Locomotive Emissions Project · Locomotive Emissions Project ... 3.2.2 Spatial Disaggregation of...
123
Locomotive Emissions Project Scoping Study of Potential Measures to Reduce Emissions from New and In-Service Locomotives in NSW and Australia Prepared for: NSW EPA Prepared by: ENVIRON Australia Pty Ltd Date: March 2013
Transcript of Locomotive Emissions Project · Locomotive Emissions Project ... 3.2.2 Spatial Disaggregation of...

Locomotive Emissions Project
Scoping Study of Potential Measures to Reduce Emissions
from New and In-Service Locomotives in NSW and
Australia
Prepared for: NSW EPA
Prepared by: ENVIRON Australia Pty Ltd
Date: March 2013
Page i
Acknowledgements The significant role of Interfleet Technologies Pty Ltd in characterising the Australian locomotive fleet
to inform the study merits specific recognition. The review of noise-related regulations and impacts
for the rail transport sector was undertaken by EMGA Mitchell McLennan Pty Ltd.
The valuable information provided by rail industry operators and service providers, and the
cooperative guidance of NSW EPA personnel during the course of the study is gratefully
acknowledged.
Disclaimer
This study was undertaken to inform the ongoing discussion about diesel emissions and possible
measures that could be considered to address them. The study is an exploratory work scoping
possible measures to reduce particulate matter (PM) emissions less than 2.5 micrometres in diameter
(PM2.5) and less than 10 micrometres in diameter (PM10) and NOx emissions from new and in-
service locomotives in NSW and Australia. Key components of the scoping study include:
Review of local, national and international air emission regulations and policies for new and in-service locomotives;
Characterisation of the locomotive fleet industry in NSW and Australia; Quantification of air emissions from locomotives in NSW and Australia; and Identification of potential cost-effective measures for reducing air emissions from new and in-
service locomotives in NSW and Australia. This report was prepared by ENVIRON Australia Pty Ltd in good faith exercising all due care and
attention, but no representation or warranty, express or implied, is made as to the relevance,
accuracy, completeness or fitness for purpose of this document in respect of any particular user’s
circumstance. Users of this document should satisfy themselves concerning its application to, and
where necessary seek expert advice in respect of, their situation. The views expressed within are not
necessarily the views of the Environment Protection Authority (EPA) and may not represent EPA
policy.
© Copyright State of NSW and the Environment Protection Authority

Page ii
Contents Page
Executive Summary vii
1 Introduction 1 1.1 Background Information 1
1.1.1 Health and Environmental Impacts 1
1.1.2 Diesel-fuelled Locomotive Emissions 1
1.2 Study Objective 2
1.3 Scope of Works 3
1.4 Consultation with Industry Stakeholders 4
1.5 Report Outline 5
2 Regulation and Management Review 6 2.1 Overview of Management Approaches 6
2.2 Air Emission Management Approaches 7
2.2.1 NSW and Australia 7
2.2.2 United States 16
2.2.3 California 17
2.2.4 International Union of Railways 20
2.2.5 European Union (EU) 21
2.2.6 Canada 23
2.3 Locomotive Diesel Fuel Regulations 24
2.3.1 Automotive Diesel in Australia 24
2.3.2 Diesel Used in the United States() 25
2.3.3 Diesel Used in Canada 26
2.3.4 Biodiesel 26
2.4 Locomotive Noise Regulations 27
2.4.1 Australia 27
2.4.2 New South Wales 27
2.4.3 Other Australian States 28
2.4.4 Canada/United States (US) 29
2.4.5 European Union (EU) 30
2.5 Summary of Findings 30
3 Locomotive Fleet Characterisation 32 3.1 Rail Operator Industry Structure 32
3.1.1 Rail Operators and National Locomotive Fleets 32
3.2 Fuel Consumption by Locomotives 36
3.2.1 Historical and Projected Future Diesel Consumption by Rail Transport 36
3.2.2 Spatial Disaggregation of Fuel Consumption 38
3.3 Emissions Performance of Current (2012) Fleet 41
3.4 Current Repowering and Rebuilding Schemes 41
3.4.1 Environmental Solutions for Freight Rail 41
3.4.2 Repowering Specific Classes of Locomotive 41
3.4.3 Upgrading Existing Engines 42

Page iii
3.5 Locomotive Categorisation Matrix and Emissions Performance Projections 43
3.5.1 Business as Usual (BaU) 43
3.5.2 New Locomotives are Tier 2 44
3.5.3 Upgrade of Existing Engines 44
3.6 Fuel Consumption by Region and Emission Performance Tier 44
3.6.1 Business as Usual Scenario 44
3.6.2 Maximum Upgrade Possible for Existing Fleet Scenario 49
3.7 Application of Business as Usual and Maximum Upgrade Possible for Existing Fleet
Scenarios 49
3.8 Summary of Findings 49
4 Air Emissions from Locomotives 51 4.1 Overview of Diesel Exhaust Emissions and Related Impacts 51
4.2 Air Emission Estimation Methodology 52
4.3 Air Emission Projections Given Business as Usual 53
4.3.1 National Emissions 53
4.3.2 NSW Emissions 54
4.4 Emission Intensity of Rail Compared to Road Transport 55
4.4.1 Projection of Health Costs 56
4.5 Summary of Findings 57
5 Noise Emission Impacts of Locomotives 58 5.1 Characteristics of Locomotive Noise 58
5.1.1 Locomotive Engine Noise 58
5.1.2 Wheel Squeal and Wheel Rail Track Interaction 58
5.1.3 Wagon Shunting 58
5.1.4 Rail Horn Noise 58
5.2 Scope for Future Locomotive Noise Controls 59
5.2.1 Noise Control at the Source 59
5.2.2 Noise Control of the Transmission Path 59
5.2.3 Noise Control at the Receiver 60
5.2.4 Regulatory Noise Control Opportunities 60
5.3 Summary of Findings 60
6 Review of Air Emission Reduction Options 62 6.1 Locomotive Emission Reduction Options 62
6.1.1 Upgrading the Existing Fleet 62
6.1.2 Alternative Drivetrain Technologies 62
6.1.3 Fuel Efficiency Improvements 64
6.1.4 Retrofitting of After-treatment 66
6.2 Evaluation of Option Benefits and Practicability 66
6.3 Measures Selected for Quantitative Analysis 70
6.3.1 National 70
6.3.2 Regional 70
6.4 Emission Reductions and Health Benefits 71
6.4.1 Environmental Benefits of National Measures 71
6.4.2 Environmental Benefits of Regional Measures 76

Page iv
6.4.3 Differences in Control Effectiveness for National and Regional Applications 80
7 Options for Further Consideration 82 7.1 National Measures 82
7.1.1 Emission Performance Requirements for New Locomotives 82
7.1.2 Identification and Funding of Fuel Efficiency Measures 83
7.1.3 Incentivised Upgrading or Accelerated Retirement of Existing Locomotives 83
7.1.4 Identification of Long term Strategies through On-going Collaboration 84
7.2 Regional Measures 84
8 References 86
9 Abbreviations 89
10 Appendix A Additional Information used for Calculating Emission Reductions and Costs
for Selected Measures 92
11 Appendix B Australian Rail Operators and National Locomotive Fleets 97

Page v
List of Tables
Table 1. Cost Effectiveness of National Diesel Locomotive Emission Reduction Measures .. xi
Table 2. Cost Effectiveness of Regional Diesel Locomotive Emission Reduction Measures (a)
.................................................................................................................................................. xi
Table 3. Annual Health Benefits due to National Measures (2012-2032) ............................... xii
Table 4. Annual Health Benefits due to Regional Measures (2012-2032) .............................. xii
Table 5. Carl Moyer Control Efficiency of National Measures (a) ........................................... xiv
Table 6. Carl Moyer Control Efficiency of Regional Measures (NSW GMR) (a) .................... xv
Table 7. Railway Rolling Stock - Exterior Environment - RDS 7512, Draft 3.1, 11 November
2008(a) ..................................................................................................................................... 10
Table 8. Fuel Efficiency and Emission Reduction Measures implemented or considered by
some Australian rail operators() ................................................................................................ 13
Table 9. US-EPA Tiered Standards for Line Haul and Switch Haul Locomotives ................... 17
Table 10. International Union of Railways (UIC) Locomotive Emission Standards ................. 21
Table 11. European Union (EU) Stage IIIA Standards for Locomotive Engines ..................... 21
Table 12. European Union (EU) Stage IIIB Standards for Locomotive Engines ..................... 22
Table 13. Australian Rail Freight Operator Locomotive Assets ............................................... 33
Table 14. Australian Rail Freight Operator Locomotive Types ............................................... 34
Table 15. Diesel Consumption in Australia for Scenario Years .............................................. 38
Table 16. Diesel Consumption in NSW for Scenario Years .................................................... 38
Table 17. Emission Performance and Upgradability of 2012 Locomotive Fleet (Active
Locomotives Only) ................................................................................................................... 41
Table 18. Fuel Consumption Projects by Region, Service and Emissions Performance
(Business as Usual) ................................................................................................................. 46
Table 19. Fuel Consumption Projects by Region, Service and Emissions Performance
(Maximum Upgrade of Existing Locomotives) ......................................................................... 47
Table 20. Change in the Proportion of Fuel Combustion by Emissions Performance Tier .... 49
Table 21. Emission Factors Applied (grams of pollutant per litre of diesel combusted) ......... 53
Table 22. Annual Locomotive Emissions given Business as Usual for Australia ................... 54
Table 23. Contribution of Projected Locomotive Emissions to Total Emissions Derived from
the National Pollutant Inventory ............................................................................................... 54
Table 24. Annual Locomotive Emissions given Business as Usual for NSW ......................... 55
Table 25. Emission Intensity of Rail Compared to Road Freight Transport() .......................... 56
Table 26. Health Cost Data ..................................................................................................... 56
Table 27. Annual Health Costs due to Locomotive Emissions given Business as Usual ....... 57
Table 28. Evaluation of Benefits and Practicability of Inventoried Measures ......................... 68
Table 29. Emission Reductions due to Selected National Measures ..................................... 72
Table 30. Annual Health Benefits due to National Measures ................................................. 73
Table 31. Cost Effectiveness of National Measures (a) .......................................................... 74
Table 32. Carl Moyer Control Efficiency of National Measures (a) ......................................... 75
Table 33. Emission Reductions due to Selected Regional Measures(a) ................................ 77
Table 34. Annual Health Benefits due to Regional Measures ................................................ 78
Table 35. Cost Effectiveness of Regional Measures (a) ......................................................... 79
Table 36. Carl Moyer Control Efficiency of Regional Measures (NSW GMR) (a) .................. 80

Page vi
List of Figures
Figure 1. Energy Consumption by Rail Transport in Australia (ABARE, 2011). 25
Figure 2. Australian Locomotive Age Profile 35
Figure 3. Diesel Consumption by Rail Transport, 1973 to 2010 (ABARE, 2011) 37
Figure 4. Diesel Consumption by Rail Transport with Projections to 2050 (BITRE, 2010) 37
Figure 5. Definition of the NSW GMR comprising Sydney, Newcastle and Wollongong
Regions (DEC, 2007) 40

Page vii
Executive Summary
Diesel-fuelled locomotives are an important contributor to anthropogenic fine particulate and oxides of nitrogen emissions (NOx). The World Health Organisation (WHO) has classified diesel engine exhaust as being carcinogenic to humans. It found that exposure to diesel exhaust is a cause of lung cancer and increases the risk of bladder cancer. In Australia, there are no air emission limits for new or re-manufactured locomotives. Nor are there any substantive programs within Australia addressing air emissions from in-service locomotives.
A study was undertaken to identify measures to reduce particulate matter (PM) emissions less than 2.5 micrometres in diameter (PM2.5) and less than 10 micrometres in diameter (PM10) and NOx emissions from new and in-service locomotives in NSW and Australia. Key components of the study included:
Review of local, national and international air emission regulations and policies for new and in-service locomotives;
Characterisation of the locomotive fleet industry in NSW and Australia;
Quantification of air emissions from locomotives in NSW and Australia; and
Identification of potential cost-effective measures for reducing air emissions from new and in-service locomotives in NSW and Australia.
Overview of Regulatory and Other Measures Implemented by Jurisdictions
Emissions standards are not applied in Australia, either nationally or by states, to address air emissions from locomotives. However, the study identified several government and industry initiatives that could be built on to establish emission reduction opportunities for the rail sector. Examples include:
The Department of Innovation Industry Science and Research (DIISR) On Track to 2040 project aimed at progressing future technologies, and including emission reduction strategies, within the Australian rail industry.
Rail Industry Safety and Standards Board (RISSB) development of Exterior Environment Standards through its Australian Rolling Stock Standards project which include emission standards for new locomotives. This initiative is on-going.
Development of energy efficiency opportunities for the rail sector through collaboration between major rail operators and the Australian Department of Resources, Energy and Tourism (DRET).
United States (US) and European Union (EU) emission standards for diesel locomotives are the most widely referenced and applied standards internationally. The US emission standards for railway locomotives apply to newly manufactured as well as remanufactured railroad locomotives and locomotive engines. The standards have been adopted in two regulatory actions: Tier 0-2 and Tier 3-4. Despite significant differences in the rail industries in the US and EU, the trend is towards the harmonisation of rail emission standards. Other measures implemented in the US, EU and Canada and leading jurisdictions such as California were identified and include:
Establishing Memorandums of Understanding (MOUs) with major rail operators to realise progressing improvements in existing fleets;
Improving funding for replacing, repowering and rebuilding old engines with newer technologies in the existing locomotive fleet;
Page viii
Research into the technical feasibility, emission reductions, costs and cost-effectiveness of emission reduction measures; and
Diesel fuel regulation, notably reductions in fuel sulfur to ensure the effectiveness of after-treatment technology.
Automotive diesel oil (ADO) represents the main fuel used by the Australian rail industry, as documented by the Australian Bureau of Agricultural and Resource Economics and Sciences and confirmed with several rail operators during the course of the study. The sulfur content of ADO has been regulated to no more than 10 parts per million (ppm), with Australian ADO therefore being of sufficient quality for the implementation of pollution reduction after-treatment technologies.
Locomotive Fleet Characterisation
A fleet characterisation matrix was established using fuel consumption figures categorised by locomotive power rating, region and emission performance. Fleet data was compiled for a base year (2012) and for two further years (2022, 2032) to facilitate the projection of ‘business as usual’ emissions and emission reduction opportunities over a 20 year period.
The existing diesel-powered locomotive fleet comprises about 1850 active locomotives, the majority of which are diesel-electric. In a diesel-electric locomotive, the diesel engine drives an electrical generator which provides power to the wheels. About 86% of these locomotives are main haul locomotives with the remainder being switch locomotives. Switch locomotives are used in rail yards but may also be used to power local and regional service trains.
Private sector companies are responsible for freight rail services. Bulk freight dominates the total tonne-kilometre rail task, comprised primarily of mineral and agricultural product rail services. Approximately 38% of the 2012 rail fleet are used for iron and coal freight, 30% for intermodal freight, 28% for rural freight (e.g. grain), and about 4% for passenger services.
The average age of diesel-electric locomotives in Australia is about 35 years and half the existing fleet is more than 26 years old. By comparison, the average age of the US fleet is 8 years.
80.7% of the existing locomotive fleet in Australia do not meet any US emission standards. 2.7% meet Tier 0, 16.1% meet Tier 1 and 0.3% meet tier 2 emission standards. The age, emissions performance and duty cycle of locomotives together with the population densities of where they operate (including urban cross city services and port access areas) are considered in emission mitigation measures examined in the report.
There are a number of potential repowering and rebuilding schemes under consideration in Australia at present including:
Repowering of older and low powered locomotives as described in the Australasian Railway Association (ARA) draft report Environmental Solutions for Freight Rail released in December 2010.
Repowering of specific classes of locomotives using modern high speed diesel engines.
Upgrading existing engines during overhaul generally.
The main drivers for the upgrading of existing locomotives are primarily improvements in fuel efficiency and equipment performance.

Page ix
Diesel Consumption by the Rail Industry
National diesel consumption by the rail sector has grown significantly over the past decade, with equivalent levels of growth projected to continue for the next four decades. Passenger rail is reported to consume only 10% of the diesel used by the rail sector nationally, with freight rail using the bulk of the diesel. Consumption by passenger rail is projected to reduce to less than 5% by 2030, with the national growth in diesel consumption being driven by freight rail and particularly increased rail for coal and iron ore transfer.
The increase in diesel consumption by the rail sector is less marked in NSW, with the percentage of diesel consumption in NSW dropping from over 30% of national consumption in the 1990s to 23% of national use by 2010. According to gross-tonnes-kilometre (GTK) data provided by the Australian Rail Track Corporation (ARTC), an estimated 65% of the fuel consumption within NSW occurs within the Greater Metropolitan Region (GMR). Based on GTK data, it is further estimated that 24% of the fuel consumption within the GMR occurs within urban areas. State-wide, 15.5% of fuel consumption within NSW is estimated to occur within urban areas.
Air Pollutant Emissions and Associated Health Costs
Air emissions from Australian diesel locomotives were quantified for the base case year (2012) and for two subsequent years (2022 and 2032) using the detailed locomotive fleet and fuel combustion data set established during this study. US emission factors were applied to calculate emissions, with such factors adjusted to account for the lower sulfur content specified for Australian automotive diesel. In 2012 locomotives were estimated to contribute 4.7% to national emissions of PM2.5 and 4.2% to national emissions of NOx.
Annual PM10, PM2.5 and NOx emissions from Australia-wide locomotive activity is around 1.34 million kilograms per annum, 1.30 million kilograms per annum and 65 million kilograms per annum, respectively. An increase in emissions is estimated to occur over the next 20 years, reflecting the projected growth in fuel consumption by the rail sector over this period.
Health costs were quantified using estimated PM10 and NOx emissions and pollutant-specific health costs data, with unit health costs adjusted to take into account low exposure potentials in non-urban areas. Reference was specifically made to the Euro5/6 Regulation Impact Study prepared by the Australian Department of Infrastructure, Transport, Regional Development and Local Government in 2010. The PM10 figure can be expected to under-predict the PM2.5 benefits as PM10 is less harmful per tonne than PM2.5. Annual emissions for 2012, 2022 and 2032 were averaged to provide the basis for the calculations. Annual health costs were estimated to be in the range of $65.6 million per annum.
Emission Reduction Measures Evaluated
A range of potential locomotive emission reduction measures were identified following a review of standards, policies and programs in the US, EU and Canada. Potential options assessed range from alternative drivetrain technologies, fuel efficiency measures, retrofitting, upgrading of existing fleet, accelerated repowering and replacement of locomotives and specification of national emission standards. These measures were qualitatively evaluated to identify potential actions:
Able to realise an emission reduction and possible fuel saving;
Unlikely to result in noise impacts;

Page x
Be implementable in the short-term (with benefits realisable in the short-term);
Technically viable and potentially economically feasible; and
Have higher degrees of certainty in terms of being successful
A mix of measures was selected so as to consider:
Existing and new locomotives;
Population density;
Line haul and switching/shunting locomotives; and
National and NSW options.
Based on the qualitative assessment of the emission reduction benefits and practicability of options, including tailored solutions proposed in previous Australian studies, the following measures were selected for quantitative analysis:
No. Diesel Locomotive Emission Reduction Measure 1 Replacement/Repowering of old freight line haul locomotives (over 25 years old) to meet EU Stage
III, as proposed by ARA 2010(1). This measure targets 150-183 locomotives (7.1%-8.7% of existing fleet) being repowered over 10 years.
2 Upgrade of existing fleet to the highest Tier achievable at overhaul, with accelerated overhaul to ensure overhaul occurs in the short-term.
3 All new locomotives to comply with Tier 2 4 All new locomotives to comply with Tier 4 5 Replacement of line haul (a) locomotives over 25 years old with Tier 4 compliant locomotives, and all
new locomotives to comply with Tier 4 6 Replacement of existing switching/shunting locomotives with gen-set (b) locomotives, and
requirement for future switching/shunting locomotives to be of this type. Only applied to locomotives with over 20 years of life remaining, with fuel consumption over 100,000 litres per year.
7 Installation of a driver advice system on freight and passenger line haul locomotives in the short-term 8 Retrofitting of ECP (c) brakes to existing line haul locomotives in the short-term 9 Installation of idling reduction systems in existing switching/shunting and line haul locomotives in the
short-term (a) Line haul locomotives transfer freight between distant points (b) Gen-set locomotives use multiple engine generators for traction power (c) ECP refers to Electronically Controlled Pneumatic Brakes
Quantification of Costs and Benefits for National and Regional Measures Measures 1 to 9 were investigated for national implementation, with measures 2 to 9 also applied separately for the NSW GMR to illustrate the viability of such measures for regional implementation.
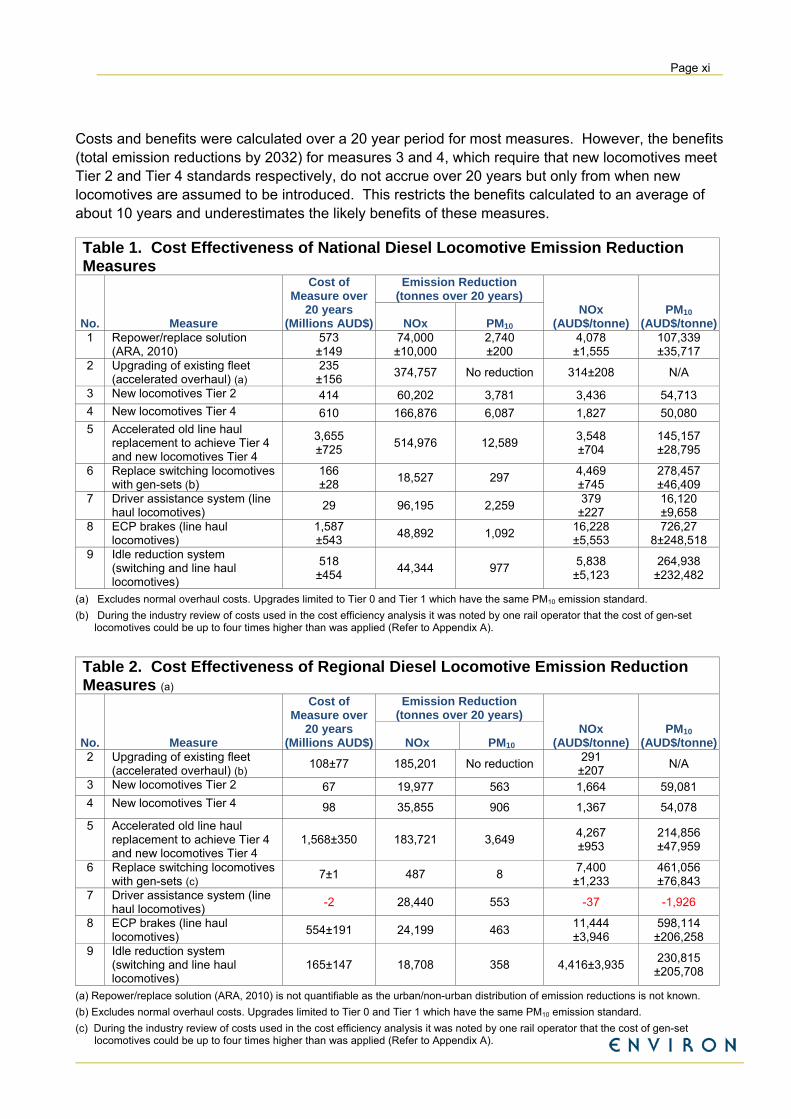
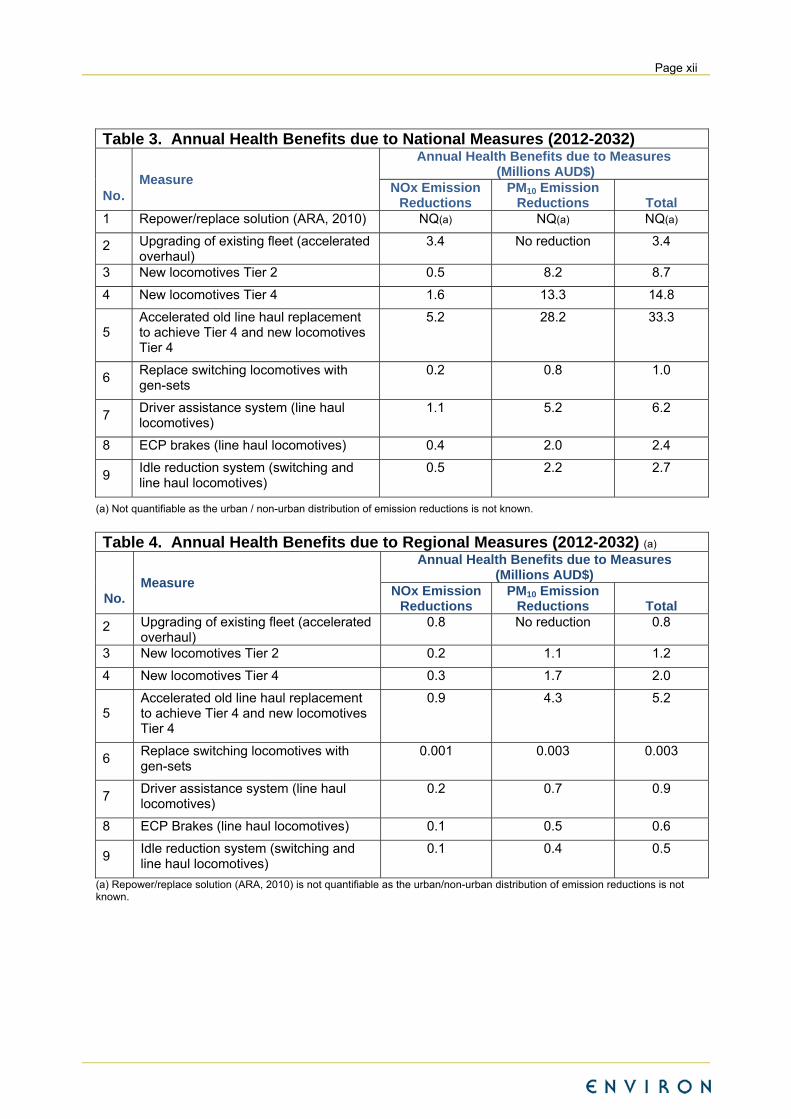
Emission reductions and health benefits achievable were quantified for each of the selected measures, and the effectiveness of each measure estimated (i.e. cost of measure per one tonne of PM10 and NOx avoided). The cost effectiveness of national and regional measures is summarised in Table 1 and Table 2, with the associated health benefits summarised in Table 3 and Table 4.
1 ARA (2010). Draft: Environmental Solutions for Freight Rail, Australasian Railway Association Inc.
Page xi
Costs and benefits were calculated over a 20 year period for most measures. However, the benefits (total emission reductions by 2032) for measures 3 and 4, which require that new locomotives meet Tier 2 and Tier 4 standards respectively, do not accrue over 20 years but only from when new locomotives are assumed to be introduced. This restricts the benefits calculated to an average of about 10 years and underestimates the likely benefits of these measures.
Table 1. Cost Effectiveness of National Diesel Locomotive Emission Reduction Measures
No. Measure
Cost of Measure over
20 years (Millions AUD$)
Emission Reduction (tonnes over 20 years)
NOx (AUD$/tonne)
PM10 (AUD$/tonne)NOx PM10
1 Repower/replace solution (ARA, 2010)
573 ±149
74,000 ±10,000
2,740 ±200
4,078 ±1,555
107,339 ±35,717
2 Upgrading of existing fleet (accelerated overhaul) (a)
235 ±156
374,757 No reduction 314±208 N/A
3 New locomotives Tier 2 414 60,202 3,781 3,436 54,713 4 New locomotives Tier 4 610 166,876 6,087 1,827 50,080 5 Accelerated old line haul
replacement to achieve Tier 4 and new locomotives Tier 4
3,655 ±725
514,976 12,589 3,548 ±704
145,157 ±28,795
6 Replace switching locomotives with gen-sets (b)
166 ±28
18,527 297 4,469 ±745
278,457 ±46,409
7 Driver assistance system (line haul locomotives)
29 96,195 2,259 379
±227 16,120 ±9,658
8 ECP brakes (line haul locomotives)
1,587 ±543
48,892 1,092 16,228 ±5,553
726,27 8±248,518
9 Idle reduction system (switching and line haul locomotives)
518 ±454
44,344 977 5,838 ±5,123
264,938 ±232,482
(a) Excludes normal overhaul costs. Upgrades limited to Tier 0 and Tier 1 which have the same PM10 emission standard.
(b) During the industry review of costs used in the cost efficiency analysis it was noted by one rail operator that the cost of gen-set locomotives could be up to four times higher than was applied (Refer to Appendix A).
Table 2. Cost Effectiveness of Regional Diesel Locomotive Emission Reduction Measures (a)
No. Measure
Cost of Measure over
20 years (Millions AUD$)
Emission Reduction (tonnes over 20 years)
NOx (AUD$/tonne)
PM10 (AUD$/tonne)NOx PM10
2 Upgrading of existing fleet (accelerated overhaul) (b)
108±77 185,201 No reduction 291
±207 N/A
3 New locomotives Tier 2 67 19,977 563 1,664 59,081 4 New locomotives Tier 4 98 35,855 906 1,367 54,078
5 Accelerated old line haul replacement to achieve Tier 4 and new locomotives Tier 4
1,568±350 183,721 3,649 4,267 ±953
214,856 ±47,959
6 Replace switching locomotives with gen-sets (c)
7±1 487 8 7,400 ±1,233
461,056 ±76,843
7 Driver assistance system (line haul locomotives)
-2 28,440 553 -37 -1,926
8 ECP brakes (line haul locomotives)
554±191 24,199 463 11,444 ±3,946
598,114 ±206,258
9 Idle reduction system (switching and line haul locomotives)
165±147 18,708 358 4,416±3,935 230,815
±205,708
(a) Repower/replace solution (ARA, 2010) is not quantifiable as the urban/non-urban distribution of emission reductions is not known.
(b) Excludes normal overhaul costs. Upgrades limited to Tier 0 and Tier 1 which have the same PM10 emission standard.
(c) During the industry review of costs used in the cost efficiency analysis it was noted by one rail operator that the cost of gen-set locomotives could be up to four times higher than was applied (Refer to Appendix A).
Page xii
Table 3. Annual Health Benefits due to National Measures (2012-2032)
Measure
Annual Health Benefits due to Measures (Millions AUD$)
No. NOx Emission Reductions
PM10 Emission Reductions Total
1 Repower/replace solution (ARA, 2010) NQ(a) NQ(a) NQ(a)
2 Upgrading of existing fleet (accelerated overhaul)
3.4 No reduction 3.4
3 New locomotives Tier 2 0.5 8.2 8.7
4 New locomotives Tier 4 1.6 13.3 14.8
5 Accelerated old line haul replacement to achieve Tier 4 and new locomotives Tier 4
5.2 28.2 33.3
6 Replace switching locomotives with gen-sets
0.2 0.8 1.0
7 Driver assistance system (line haul locomotives)
1.1 5.2 6.2
8 ECP brakes (line haul locomotives) 0.4 2.0 2.4
9 Idle reduction system (switching and line haul locomotives)
0.5 2.2 2.7
(a) Not quantifiable as the urban / non-urban distribution of emission reductions is not known.
Table 4. Annual Health Benefits due to Regional Measures (2012-2032) (a)
Measure
Annual Health Benefits due to Measures (Millions AUD$)
No. NOx Emission
Reductions PM10 Emission
Reductions Total
2 Upgrading of existing fleet (accelerated overhaul)
0.8 No reduction 0.8
3 New locomotives Tier 2 0.2 1.1 1.2
4 New locomotives Tier 4 0.3 1.7 2.0
5 Accelerated old line haul replacement to achieve Tier 4 and new locomotives Tier 4
0.9 4.3 5.2
6 Replace switching locomotives with gen-sets
0.001 0.003 0.003
7 Driver assistance system (line haul locomotives)
0.2 0.7 0.9
8 ECP Brakes (line haul locomotives) 0.1 0.5 0.6
9 Idle reduction system (switching and line haul locomotives)
0.1 0.4 0.5
(a) Repower/replace solution (ARA, 2010) is not quantifiable as the urban/non-urban distribution of emission reductions is not known.

Page xiii
Assessment of Individual Measures
Measure 1 assesses the repowering of older locomotives as outlined in the ARA Draft Report Environmental Solutions for Freight Rail ( 2010).
Measure 2 involves upgrading the existing fleet to the extent possible. While viable upgrades are limited to Tier 0 and Tier 1 US standards, the measure is estimated to result in significant NOx reductions. Given that Pre Tier 0, Tier 0 and Tier 1 locomotives have equivalent particulate matter emissions, no reduction in PM10 emissions is associated with this measure. The cost effectiveness of the measure is projected to be favourable. Note that costs of normal overhauls are excluded (i.e. only additional costs of upgrade during a normal overall are counted).
Requiring that new locomotives comply with Tier 2 or Tier 4 (measures 3 and 4) is relatively more cost effective compared to replacement measures, however there is a delay in emission reductions. A more favourable cost effectiveness is associated with the introduction of Tier 4 standards for new locomotives, relative to the introduction of Tier 2 standards. The reason for this is that Tier 4 standards are associated with a more significant emission reduction compared to Tier 2, relative to the cost of achieving compliance. During industry consultation a locomotive supplier cautioned that Tier 4 emission standards represent a significant technical challenge as the Australian outline gauge and mass limits constrain the space envelope required for the exhaust after treatment measures required.
Measure 5 comprises accelerated replacement of old line haul locomotives with Tier 4 compliant locomotives and the requirement for new locomotives to be Tier 4 compliant. The measure was estimated to result in the largest reductions in NOx and PM emissions, and hence the greatest health benefits. The cost effectiveness of the measure is, however, significantly less favourable compared to fuel efficiency and existing fleet upgrade measures.
Old locomotives (over 25 years of age), with over 20 years of operations remaining or date of retirement not yet determined, are the target of measures 2 and 5. Within NSW this subset included locomotives used for the following activities:
Passenger rail serves through the GMR (RailCorp);
Switch and main line freight rail tasks within the GMR;
Grain freight rail activities within the GMR; and
Crossing of GMR by intermodal rail services.
Locomotives used for coal transfer to ports within NSW generally comprised newer locomotives and were identified for potential upgrade but not for accelerated replacement.
Measure 6, comprising the replacement of switching locomotives with gen-sets was not estimated to result in significant emissions reductions or health benefits, particularly as a regional measure.
Fuel efficiency measures have the potential to realise significant emission reductions in a cost effective manner. In the case of the implementation of driver assistance systems (measure 7) for the NSW GMR, an overall cost saving was projected due to fuel cost
Page xiv
savings offsetting implementation costs. Several industry operators are either already implementing such systems or investigating their implementation.
A wide range in the potential cost effectiveness of installing ECP braking systems on line haul locomotives (measure 8) and idle reduction systems on switch and line haul locomotives (measure 9) was estimated. This is due to significant variations in the reported costs per locomotive of introducing such measures.
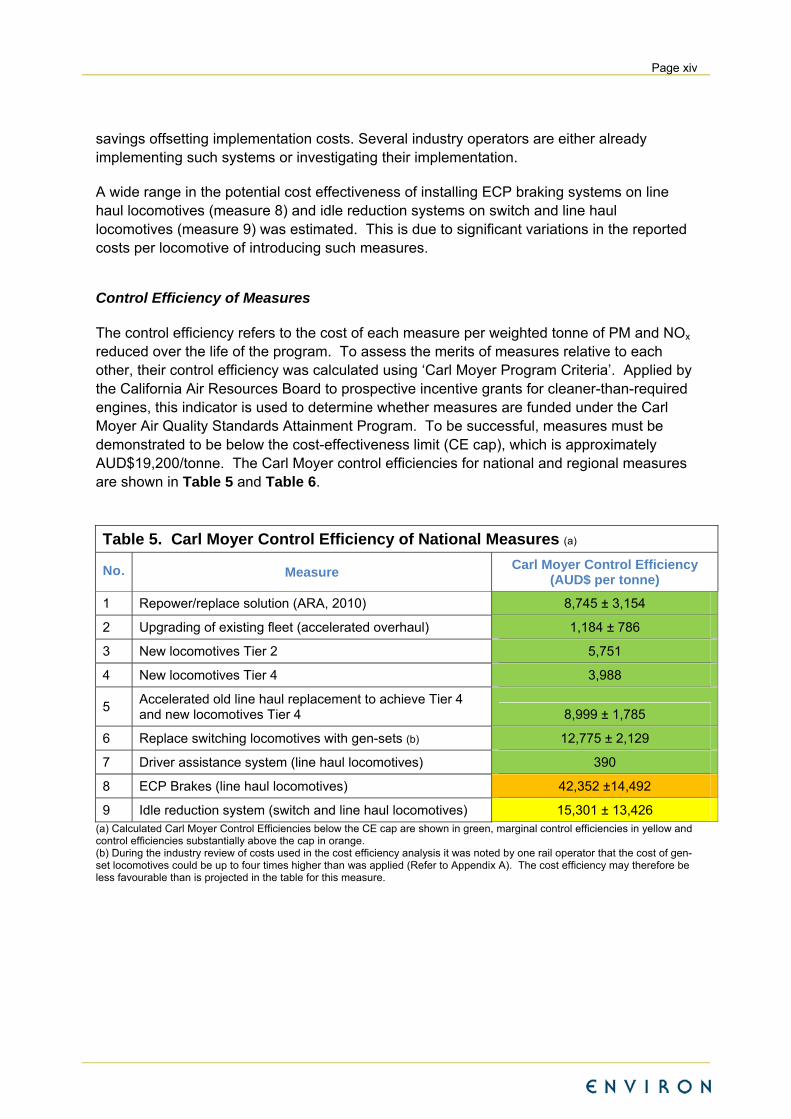
Control Efficiency of Measures The control efficiency refers to the cost of each measure per weighted tonne of PM and NOx reduced over the life of the program. To assess the merits of measures relative to each other, their control efficiency was calculated using ‘Carl Moyer Program Criteria’. Applied by the California Air Resources Board to prospective incentive grants for cleaner-than-required engines, this indicator is used to determine whether measures are funded under the Carl Moyer Air Quality Standards Attainment Program. To be successful, measures must be demonstrated to be below the cost-effectiveness limit (CE cap), which is approximately AUD$19,200/tonne. The Carl Moyer control efficiencies for national and regional measures are shown in Table 5 and Table 6.
Table 5. Carl Moyer Control Efficiency of National Measures (a)
No. Measure Carl Moyer Control Efficiency
(AUD$ per tonne)
1 Repower/replace solution (ARA, 2010) 8,745 ± 3,154
2 Upgrading of existing fleet (accelerated overhaul) 1,184 ± 786
3 New locomotives Tier 2 5,751
4 New locomotives Tier 4 3,988
5 Accelerated old line haul replacement to achieve Tier 4 and new locomotives Tier 4 8,999 ± 1,785
6 Replace switching locomotives with gen-sets (b) 12,775 ± 2,129
7 Driver assistance system (line haul locomotives) 390
8 ECP Brakes (line haul locomotives) 42,352 ±14,492
9 Idle reduction system (switch and line haul locomotives) 15,301 ± 13,426 (a) Calculated Carl Moyer Control Efficiencies below the CE cap are shown in green, marginal control efficiencies in yellow and control efficiencies substantially above the cap in orange. (b) During the industry review of costs used in the cost efficiency analysis it was noted by one rail operator that the cost of gen-set locomotives could be up to four times higher than was applied (Refer to Appendix A). The cost efficiency may therefore be less favourable than is projected in the table for this measure.
Page xv
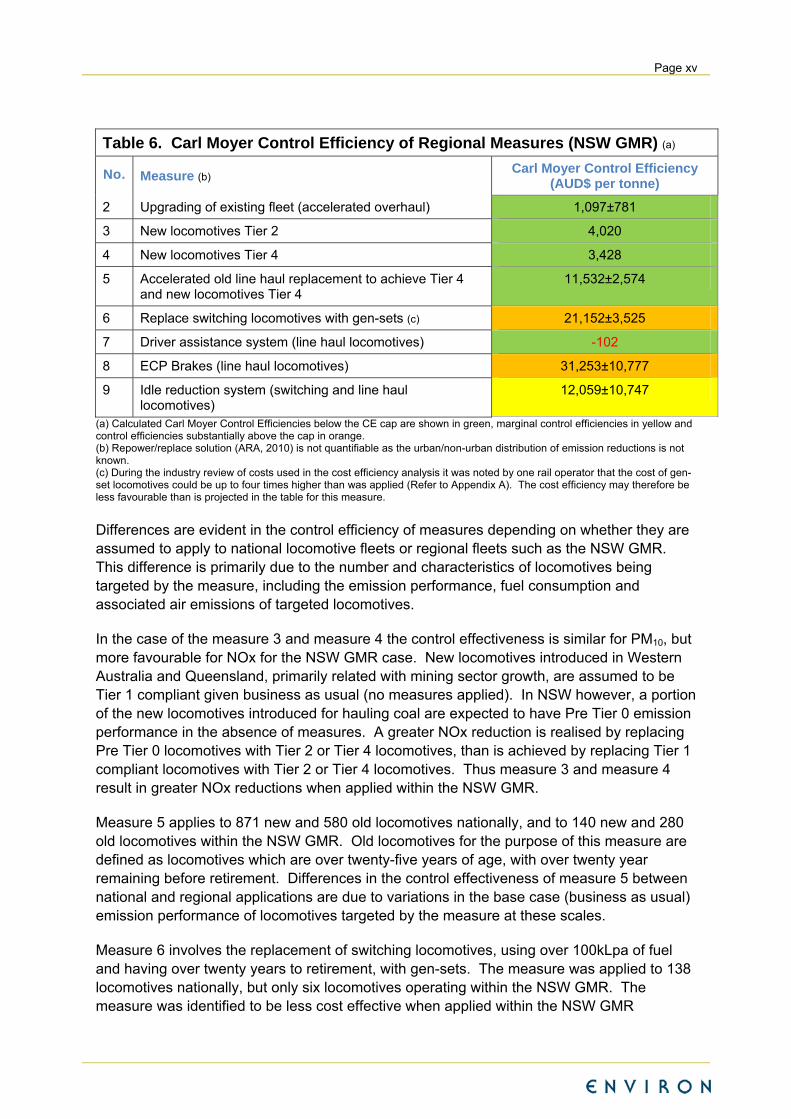
Table 6. Carl Moyer Control Efficiency of Regional Measures (NSW GMR) (a)
No. Measure (b) Carl Moyer Control Efficiency
(AUD$ per tonne)
2 Upgrading of existing fleet (accelerated overhaul) 1,097±781
3 New locomotives Tier 2 4,020
4 New locomotives Tier 4 3,428
5 Accelerated old line haul replacement to achieve Tier 4 and new locomotives Tier 4
11,532±2,574
6 Replace switching locomotives with gen-sets (c) 21,152±3,525
7 Driver assistance system (line haul locomotives) -102
8 ECP Brakes (line haul locomotives) 31,253±10,777
9 Idle reduction system (switching and line haul locomotives)
12,059±10,747
(a) Calculated Carl Moyer Control Efficiencies below the CE cap are shown in green, marginal control efficiencies in yellow and control efficiencies substantially above the cap in orange. (b) Repower/replace solution (ARA, 2010) is not quantifiable as the urban/non-urban distribution of emission reductions is not known. (c) During the industry review of costs used in the cost efficiency analysis it was noted by one rail operator that the cost of gen-set locomotives could be up to four times higher than was applied (Refer to Appendix A). The cost efficiency may therefore be less favourable than is projected in the table for this measure.
Differences are evident in the control efficiency of measures depending on whether they are assumed to apply to national locomotive fleets or regional fleets such as the NSW GMR. This difference is primarily due to the number and characteristics of locomotives being targeted by the measure, including the emission performance, fuel consumption and associated air emissions of targeted locomotives.
In the case of the measure 3 and measure 4 the control effectiveness is similar for PM10, but more favourable for NOx for the NSW GMR case. New locomotives introduced in Western Australia and Queensland, primarily related with mining sector growth, are assumed to be Tier 1 compliant given business as usual (no measures applied). In NSW however, a portion of the new locomotives introduced for hauling coal are expected to have Pre Tier 0 emission performance in the absence of measures. A greater NOx reduction is realised by replacing Pre Tier 0 locomotives with Tier 2 or Tier 4 locomotives, than is achieved by replacing Tier 1 compliant locomotives with Tier 2 or Tier 4 locomotives. Thus measure 3 and measure 4 result in greater NOx reductions when applied within the NSW GMR.
Measure 5 applies to 871 new and 580 old locomotives nationally, and to 140 new and 280 old locomotives within the NSW GMR. Old locomotives for the purpose of this measure are defined as locomotives which are over twenty-five years of age, with over twenty year remaining before retirement. Differences in the control effectiveness of measure 5 between national and regional applications are due to variations in the base case (business as usual) emission performance of locomotives targeted by the measure at these scales.
Measure 6 involves the replacement of switching locomotives, using over 100kLpa of fuel and having over twenty years to retirement, with gen-sets. The measure was applied to 138 locomotives nationally, but only six locomotives operating within the NSW GMR. The measure was identified to be less cost effective when applied within the NSW GMR
Page xvi
compared to national implementation. The difference in cost effectiveness is mainly due to the switching locomotives in other states having higher rates of utilisation, and hence relatively greater fuel consumption rates and air emissions. National application of measure 6 is therefore estimated to result in more significant emission reductions and improved control efficiencies.
Measure 7 comprised the application of driver assistance systems to line haul locomotives with over five years to retirement. Fuel savings due to the application of this measure was estimated to partially or entirely offset the costs of implementing and maintaining such systems. Locomotives targeted by the measure within the NSW GMR (353 locomotives) were associated with greater average fuel combustion rates per locomotive compared to the national locomotive fleet addressed by the measure (1792 locomotives). This resulted in the measure being more cost effective when applied in the NSW GMR, compared to the national application of the measure.
Measure 9 comprised the implementation of idle reduction systems to switching and line haul locomotives with over five years to retirement. The application of the measure within the NSW GMR resulted in more favourable control efficiencies for line haul locomotives relative to the national application of the measure, for similar reasons given above for measure 7. However measure 9 resulted in less favourable control efficiencies for switching locomotives relative to national control efficiencies for the reasons provided above for measure 6. Consequently, the overall control effectiveness of measure 9 was comparable for national and NSW GMR applications.
Options for Further Consideration
Based on the report’s qualitative and quantitative assessment of options, including the calculation of relative control effectiveness, the measures suggested for further consideration at a national level are:
Introduction of emission standards requiring emission performance equivalent to US standards for new locomotives (measure 3 or 4);
Continued identification and funding for the uptake of fuel efficiency measures such as the driver assistance system (measure 7) as a component of Energy Efficiency Opportunity programs; and
Provision of incentives to operators to promote the upgrading of existing locomotives to achieve improved emissions performance during routine overhauls, and/or accelerated retirement of old locomotives operating in urban areas (measure 2).
Identification of longer-term measures should be considered through consultative programs, such as On Track to 2040.
Measures suggested for further state consideration are:
Support of fuel efficiency measures, notably:
– Driver assistance systems for line haul locomotives, including passenger and freight locomotives; and
Page xvii
– Idle reduction systems where economic, particularly for switching locomotives operating within urban areas.
Accelerated replacement of old (25 years+) locomotives, particularly:
– Switching locomotives operating within urban areas; and
– Line-haul locomotives with high utilisation rates, such as those travelling through urban areas (e.g. passenger) and to and from ports (e.g. coal haul, freight).
Accelerated overhaul of other existing locomotives (less than 25 years old) to the highest Tier achievable, focussing on:
– Switching locomotives operating within urban areas; and
– Line-haul locomotives with high utilisation rates, particularly those travelling through urban areas (e.g. passenger) and to and from ports (e.g. coal haul, freight).
Possible steps which could be considered by state government for implementation in the short-term (one-five years) to facilitate the implementation of the above regional measures are:
Extension of existing state government clean technology programs to locomotives (e.g. NSW Clean Machine Program);
Targeting the rail sector through existing state energy efficiency or sustainability initiatives;
Collection and publication of fuel efficiency and emissions performance information for rail operators to illustrate the relative performance of operators;
Negotiate Memorandum of Understandings (MOUs) with major rail operators aimed at ensuring that locomotives undergoing rebuilds are rebuilt to a higher standard, and securing accelerated retirement of old locomotives active within areas of high population density;
Negotiate MOUs with major rail track managers (e.g. ARTC) to support the inclusion of requirements of locomotive fuel efficiency, emission performance and/or maintenance practices within their contracts with rail operators; and
Pursue improvements in fuel efficiency, maintenance practices and locomotive upgrades through regulatory mechanisms, e.g. introduction of pollution reduction programs within Environmental Protection Licences in NSW.
In addition to pursuing short-term measures discussed above, state governments could choose to commission more intensive rail corridor impact assessment studies to assist longer-term planning. Such studies have been implemented in the United States and Europe to robustly quantify temporal and spatial variations in rail-related air pollution and associated health risks in densely populated areas.
Page 1
1 Introduction
1.1 Background Information
1.1.1 Health and Environmental Impacts
Ambient Air Quality National Environmental Protection Measure (AAQ NEPM) goals for fine particles are exceeded nationally within various urban and rural environments, including parts of regional NSW(2). Fine particles with an aerodynamic diameter of under 10 microns (PM10) are small enough to be inhaled and remain within the respiratory system. Very fine particles of 2.5 microns or less (PM2.5) have been found to pose the greatest health risk as these particles are more readily deposited in, and damaging to, the lower airways and gas-exchanging portions of the lung.
Adverse health effects related to fine particulate matter inhalation include exacerbation of existing pulmonary disease, oxidative stress and inflammation, changes in cardiac autonomic functions and reduced defence mechanisms and lung damage(3). Significant health costs are associated with inhalation exposures to fine particulate matter(4). The main anthropogenic sources of fine particles have been found to be motor vehicles (especially diesel-fuelled vehicles), industry, and the commercial and domestic sector (notably solid fuel heaters).
Health studies show that there is no threshold concentration for exposure to particle emissions, below which health impacts are not observed, and there are adverse impacts associated with exposure to particle emissions below AAQ NEPM particle standards. Therefore, there are significant community health benefits associated with reducing particle emissions levels as much as practicable, even in regions where air quality standards are met.
AAQ NEPM goals for ozone are exceeded within several Australian cities including Sydney and Wollongong. Ozone exposures can induce serious respiratory tract responses including lung function reductions, aggravation of pre-existing respiratory disease (such as asthma), increases in daily hospital admissions, emergency department visits for respiratory causes, and excess mortality(5). Health studies indicate there is no threshold concentration for exposure to ozone below which health impacts are not observed.
1.1.2 Diesel-fuelled Locomotive Emissions
The contribution of diesel-fuelled locomotives to total anthropogenic NOx (a precursor of photochemical smog, notably ozone) and fine particulate emissions has been concluded by previous national and state studies to be worthy of further consideration(6)(2)(7). Such studies, 2 NSW DECCW (2007). Current and Projected Air Quality in NSW, A Technical Paper Supporting the Clean Air Forum 2007, Department of Environment, Climate Change and Water. 3 Pope III C.A. and Dockery D.W.C. (2006). Health Effects of Fine Particulate Air Pollution: Lines that Connect, Journal of Air & Waste Management Association, 56, 709-742. 4 BTRE (2005). Health Impacts of Transport Emissions in Australia: Economic Costs, Canberra, Bureau of Transport and Regional Economics. 5 WHO (2003). Health Aspects of Air Pollution with Particulate matter, Ozone and Nitrogen Dioxide, Report on a World Health Organisation Working Group, Bonn, Germany, 13-15 January 2003. 6 PAE (2005). Management Options for Non-road Engine Emissions in Urban Areas, Report compiled by Pacific Air and Environment on behalf of the Department of the Environment and Heritage, November 2005. 7 ARA (2010). Draft: Environmental Solutions for Freight Rail, Australasian Railway Association Inc.

Page 2
and international developments in the regulation of locomotive emissions, have served to emphasise the importance of reviewing emission reduction options for addressing locomotive emissions within Australia.
In NSW, locomotive emissions are expected to increase in the future as a result of:
Increased movements of freight trains along both the metropolitan and country networks due to increased investment in rail infrastructure and targets for increasing rail’s share of freight;
Increased coal mine outputs especially in the Gunnedah Basin, the northern part of the Western Basin and the Hunter Valley to the Port of Newcastle;
Increasing length and load of freight trains; and
Aging locomotive fleet.
Similar factors also affect other Australian jurisdictions. Whereas road transportation is well regulated, there are no air emission limits or fuel standards in Australia for locomotives. Nor are there any substantive programs within Australia addressing air emissions from in-service locomotives.
Emission standards for locomotives have been implemented for decades in the United States and European Union, with trends towards more stringent standards, and increased harmonisation of standards. Whereas emission standards tend to be specified for new and remanufactured locomotives, a range of initiatives have been implemented by various jurisdictions internationally to address air emissions from in-service locomotives. Measures implemented by jurisdictions such as California, Canada and Switzerland have included fuel efficiency improvements, retrofitting of after-treatment systems and installation of stationary emission control equipment at rail yards.
Considering the extent of locomotive emissions, the possible growth in such emissions and the absence of regulations or other substantial local emission mitigation practices, there is a strong case for investigating the benefits of emission reduction options for this sector. In evaluating international policies, regulations and programs it is, however, important to consider their applicability and cost-effectiveness given the existing locomotive fleet, operator industry sector and the national and state regulatory contexts.
1.2 Study Objective
The overall objective of the study is to identify measures to reduce particulate matter (PM) emissions less than 2.5 micrometres in diameter (PM2.5) and less than 10 micrometres in diameter (PM10) and nitrogen oxide (NOx) emissions from new and in-service locomotives in NSW and Australia. Key components of the study include:
Review of local, national and international air emission regulations and policies for new and in-service locomotives;
Characterisation of the locomotive fleet industry in NSW and Australia;
Quantification of air emissions from locomotives in NSW and Australia; and

Page 3
Identification of potential cost-effective measures for reducing air emissions from new and in-service locomotives in NSW and Australia.
1.3 Scope of Works
The study comprised the following scope of works:
Comparison of existing regulations, standards and policies in NSW, Australia, EU and the US and other leading jurisdictions e.g. California including;
– Review and summary of air emission standards for new locomotives in each jurisdiction;
– Review and summary of key air emission policies for in-service locomotives in each jurisdiction; and
– Review and summary of fuel and noise standards applicable to the rail sector; and policies addressing noise emissions and fuel consumption for this sector within each jurisdiction.
Characterisation of the existing locomotive fleet including;
– Analysis of the existing locomotive operator industry structure in NSW and Australia, including the evaluation of stakeholders’ readiness for change;
– Evaluation of the emissions performance of new locomotives sold in Australia relative to US and EU standards, and the projected change in emission performance over the next 20 years taking into account the locomotive turnover rate and ‘business as usual’ assumptions;
– Evaluation of the NSW and Australia in-service locomotive fleet performance relative to US and EU standards and how emission performance may vary by region within NSW;
– Inventory of the type and amount of fuel used by the NSW and Australian locomotive fleets;
– Documentation of current repowering and rebuilding schemes of NSW and Australian locomotive operators; and
– Comparing current rail transport air emissions per tonne of freight compared to equivalent emissions from the road transport fleet.
Compilation of an inventory of locomotive air emissions for NSW and Australia, including base case (2012) PM2.5, PM10 and NOx emissions (and their projected growth given fleet projections); and assessment of the extent of emission estimates relative to total emissions. The NSW inventory has been compiled with sufficient spatial resolution to permit the evaluation of the extent of emissions within urban and rural areas (for exposure reduction analysis);
Evaluation of noise emission impacts associated with locomotives operating within NSW;

Page 4
Identification and evaluation of potential emission reduction options for new and in-service locomotives for implementation within NSW and Australia including:
– Evaluating existing pollution reduction schemes and their pros and cons;
– Identifying potential emission reduction options taking into account study findings in regard to the industry structure, fleet character and turnover, and the track record of international regulations and initiatives;
– Assessing the benefits and viability of emission reduction options, including emission reductions achievable and cost effectiveness of each option. Options for new and in-service locomotives are developed separately, with options available at both state and national level considered;
– Evaluating potential interactions between noise control schemes and air pollutant emission reduction options;
– Outlining the steps that government and industry (NSW and national) would need to take to implement different emission reduction options including projected timelines needed for these steps;
– Recommending emission reduction options covering new and in-service locomotives in NSW and Australia. In the case of options targeting in-service locomotives, applicable regions for the implementation of such options will be identified; and
– Estimating the air emission reductions achievable through the implementation of recommended options (e.g. tonnes/annum), and the cost effectiveness of such options (i.e. AUD$ costs per tonne of PM10, PM2.5 and NOx reduced) relative to other measures.
1.4 Consultation with Industry Stakeholders
Key stakeholders were identified including NSW and national locomotive operators, manufacturers and industry associations.
Identified stakeholders were notified of the study objective and scope and asked to register as a stakeholder for the project.
Information was collected from industry stakeholders through electronic surveys, telephone surveys and meetings regarding:
– Locomotive fleet characteristics including type of locomotives (e.g. line haul; switcher locomotives), engine specifications (propulsion system; engine make and model; fuel type; fuel consumption rates; engine rating; age; useful life; emission performance; maintenance); and operations (operating hours per year) in NSW and Australia. For NSW operations, information was gathered on the rail route services to enable to the allocation of urban (GMR) and rural (non-GMR) emissions for exposure assessment purposes (see Figure 5 for NSW GMR map);
– Measures being implemented or considered for managing locomotive emissions; and

Page 5
– Potential barriers and opportunities in regard to emission reduction options identified.
1.5 Report Outline
Air emission regulations and policies for new and in-service locomotives, and noise and fuel regulations are documented in Section 2 for Australian and international jurisdictions.
An overview of the locomotive fleet industry in NSW and Australia is given in Section 3. This includes details on the current structure of the industry, emission performance of new and in-service locomotives, and current repowering and rebuilding schemes of NSW and Australian locomotive operators.
The extent of air pollutant emissions from locomotives in NSW and Australia is reviewed in Section 4, and noise impacts associated with locomotives considered in Section 5.
Measures for reducing air pollutant emissions from new and in-service locomotives in NSW and Australia are discussed in Section 6, and estimated emission reduction potentials of selected measures are presented. The technical and economic viability of potential measures and their implications for fuel use and noise emissions are also assessed.
Specific advice on the implementation of the mitigative measures - including projected timelines, feasibility, suitability, associated costs and the basis of recommending specific mitigation measures – are detailed in Section 7. References are provided in Section 8.
A list of Abbreviations is provided in Section 9.

Page 6
2 Regulation and Management Review
2.1 Overview of Management Approaches
Emission reduction approaches range from mandatory requirements to voluntary measures and from measures with broad coverage across locomotive sub-populations to more specific measures targeting prioritised locomotive sub-populations.
Government regulation is characterised by the adoption of mandatory best practice standards for diesel locomotives, with legally binding standards and mechanisms for non-compliance. Such regulation is more likely to lead to the maximum achievable reductions in emissions, as compared to non-regulatory measures. However, such regulation is typically for new and remanufactured locomotives with significant emission reductions only realised over long timeframes due to the slow turnover of locomotive fleets.
Co-regulation is similar to government regulation, except that it involves a greater element of involvement from industry. Typically, the relevant peak industry bodies would outline the need for emission abatement and offer support to industry. Industry undertakes internal consultation to identify acceptable standards, emission targets, compliance testing requirements and enforcement measures, industry code of practice and any requirements for a phase-in period. Outcomes of government consultation with regulatory and community stakeholders are incorporated and consensus is reached between government and industry on emission standards to be met by diesel locomotives. The peak industry bodies adopt the agreed limits and associated processes. An agreement is signed between the relevant government agency and peak industry bodies (e.g. MOU). The agreement is certified and enforcement is undertaken by government for explicit government regulation.
In the case of quasi-regulation, emission limits may be developed through government-industry consultation, with this code being endorsed and implemented by industry. Government, however, does not register or certify the industry agreement (e.g. MOU) and therefore has no statutory force for standards and no enforcement is undertaken. In Australia this type of measure is unlikely to be implemented on an industry operator specific basis, as it would be seen to be creating an unlevel playing field for operators and is unlikely to be supported. It is more likely that the lowest emission limits achievable across operators would be considered for broader application across industry operators. Non-regulatory measures are less likely to lead to the maximum achievable reductions in emissions, but may be effective on a sub-population basis.
Self-regulatory measures range from voluntary compliance with emission limits (within or outside of recognition programs) to industry benchmarking initiatives. A code of practice covering diesel locomotives could be developed with emission limits based on either industry approved levels, current best technology, or standards developed abroad (US, EU). In the case of recognition programs, emission limits are more likely to be set in line with international best practice / current best technology. Industry would need to undertake compliance monitoring and demonstration in order to achieve recognition under the program.
Self-regulation is significantly less likely than regulation and co-regulation to achieve the maximum emission reductions projected but may result in more cost-effective measures being identified.
Page 7
2.2 Air Emission Management Approaches
Regulatory and other measures implemented by jurisdictions for new locomotives and existing locomotive fleets, both locally and internationally, are addressed in this subsection.
US and EU emission standards for diesel locomotives are the most widely referenced and applied standards internationally and therefore represent a focus in the review. It is notable that the rail industry differs substantially between the US and the EU. The EU has many electrified lines, whereas a significant portion of US freight depends on diesel powered locomotives. The US also has significantly more freight activity when compared to the EU. The US emission standards for railway locomotives apply to newly manufactured as well as remanufactured railroad locomotives and locomotive engines. The standards have been adopted in two regulatory actions: Tier 0-2 and Tier 3-4. Despite significant differences in the rail industries in the US and EU, there has been a trend towards the harmonisation of emission standards by the US and EU, as is apparent in the more recent standards specified by these jurisdictions.
A detailed review is undertaken of measures investigated and applied in California. This state is a forerunner in driving initiatives addressing emissions from existing diesel locomotives aimed at realising cost-effective air quality improvements. Such initiatives have ranged from regulation to cooperation with the rail industry on voluntary measures.
2.2.1 NSW and Australia
No emission standards apply in Australia, either nationally or by states, to address air emissions from locomotives. National ambient air quality targets may have indirect implications by focussing attention on air pollutant emissions from rail transport in areas of poor air quality or high air pollution exposure reduction potential.
Some state governments may include requirements related to air emissions within the environmental protection licences issued to rail operators. In Queensland, government requirements related to air pollutant emissions from locomotives are restricted to addressing particulate matter emissions from coal loads on rail wagons. However, a significant portion of rail freight in Queensland is electrified.
NSW government requirements to date have addressed investigations into particulate matter emissions from coal wagons, focusing on dust rather than exhaust emissions (e.g. ARTC Environmental Protection Licence, EPL), and requirements for an audit of the air performance of locomotives (e.g. RailCorp EPL12208). In the RailCorp example, the following was required under Pollution Studies and Reduction Programs, U2.2 Audit of the Air Performance of Locomotives attached to RailCorp’s EPL in 2008:
diesel exhaust emissions monitoring of diesel-electric locomotives;
details of whether such locomotives were complying with the manufacturers’ air emission specifications throughout the maintenance cycle; and
review of current manufacturers’ engine specification against good practice in comparable networks.
The above pollution study was completed but did not result in any air emission reduction requirements being included in RailCorp’s EPL.

Page 8
In reviewing industry initiatives within Australia, reference is made to initiatives being undertaken by peak industry bodies, namely:
The Australasian Railway Association (ARA) represents passenger and freight rail operators, track owners and managers, rolling stock manufacturers, rail construction companies and other firms contributing to the Australian, New Zealand and Indonesian rail industries;
Australian Railway Industry Corporation (ARIC) is the peak industry export body of the Australian Rail Industry consisting of members who supply goods and services. ARIC provides members with advice on export opportunities, strategies and markets;
Rail Innovation Australia (RIA), previously Rail Cooperative Research Centre (CRC), was established in 2007 to take the technologies and intellectual property developed by the research centre to the market for the benefit of the rail industry. RIA aims to identify and lead the development and capture of new technologies to meet the railway industry's innovation needs; and
Rail Industry Safety and Standards Board (RISSB) is wholly owned by ARA and is responsible for development and management of rail industry standards, rules, codes of practice and guidelines, all of which have national application. RISSB is accredited by Standards Australia as a Standards Development Organisation, and all new standards produced by the RISSB are published as Australian Standards.
A summary is given below of initiatives and projects which hold relevance in terms of realising emission reductions from locomotives.
On Track to 2040
The Department of Innovation Industry Science and Research (DIISR), through the Rail Supplier Advocate, has commissioned On Track to 2040 to examine the future of technology in the Australian rail supply industry. The project is funded by the Australian government; the state governments of NSW, Victoria and Queensland; and the Australasian Railway Association (ARA) on behalf of industry. It will be developed by Australian National University (ANU) Edge in partnership with the University of Cambridge Institute for Manufacturing Education and Consultancy Services (IfM ECS), experts in road mapping methodologies; Rail Innovation Australia, with links to operators and the research sector; and Strategic Connection Group (SCG), for their industry networks and knowledge, and their experience understanding potential export markets.
The vision for On Track to 2040 outlines the united direction and priority areas to guide the study. Emission reduction strategies, listed under the priority area ‘efficient systems’, are:
alternative energy;
light-weighting of cars and locomotives;
increased electrification; and
integrated energy management and measurement tools.
The On Track to 2040 project is now in Phase 4 with workshops held in February 2012 focusing on the identified priority areas of:

Page 9
monitoring and management;
power and propulsion;
materials; and
manufacturing.
The facilitated workshops will examine the paths to realising future opportunities, including gaps and barriers and how these might be addressed. Outcomes from Phase 4 are not yet available.
Draft Exterior Environment Standards
In 2008 RISSB developed Draft Exterior Environment Standards through its Australian Rolling Stock Standards project. The Development Group and Rail Industry Environment Committee (RIEC) participated in the development of these standards. The RISSB rolling stock standards were focussed on providing measurable/verifiable recommended requirements. Clauses related to exhaust emissions were included within the Draft Exterior Environment Standards, dated 11 November 2008, as documented in Table 7.
RISSB state that the Draft Exterior Environment Standards are issued solely for the purposes of development within the rail industry, and are to be finalised following further feedback on its accuracy and appropriateness. Furthermore, RISSB state that the draft is not intended for implementation in its draft form and no reliance shall be placed on the accuracy or appropriateness of its content.
The Draft Exterior Environment Standards have not been progressed since November 2008 (Draft 3.1, 11 November 2008), however RISSB is intending to hold a workshop in mid-2012 to continue discussions (personal communication, Kym McLaughlin, RISSB).

Page 10
Table 7. Railway Rolling Stock - Exterior Environment - RDS 7512, Draft 3.1, 11 November 2008 (a) Part 1: Locomotive Rolling Stock, RDS 7512.1
1 Exhaust emissions from new or re-engined locomotive rolling stock should comply with the relevant requirements of European Directive 2004/26/EC, or US EPA Standard 40 CFR 92. REC 2 The emissions requirements for locomotives in EU Directive 2004/26/EC valid until 1st January 2012 are the Stage IIIA limits, referenced in Annex I, section 4) (b), table entitled 'Engines for
propulsion of locomotives'. SUP
3 The emissions requirements for locomotives in US EPA Standard 40 CFR 92 valid until 1st January 2011 are the Tier 2 limits. SUP 4 Revised US EPA locomotive emissions standards beyond 2011 were introduced in March 2008. SUP 5 The use of low sulfur diesel fuels in order to reduce levels of sulfur dioxide emissions and facilitate the future use of exhaust after-treatment equipment is to be encouraged (b). SUP 6 Any new vehicle should have a single connection to allow ground power to be connected and used when equipment is stationary. REC 7 The use of auxiliary power units, electrical shore supplies or other independent means of providing vehicle power when the primary power source can be shut down to reduce emissions and/or
noise is desirable. SUP
8 Biodiesel up to 20% blend (B20) is to be encouraged where this can be achieved without any unacceptable detriment to engine performance, commercial arrangements or wider production environmental issues.
SUP
Part 2: Freight Rolling Stock, RDS 7512.2 1 Generating sets used on freight wagons for refrigeration or other purposes should comply with the relevant requirements of European Directive 2004/26/EC, or US EPA Standard 40 CFR 89. MAN Part 3: Passenger Rolling Stock, RDS 7512.3, Draft 3.1, 11 November 2008 1 Exhaust emissions from new diesel-powered passenger vehicles should comply with the relevant requirements of European Directive 2004/26/EC, or US EPA Standard 40 CFR 89. REC 2 The emissions requirements for diesel-powered passenger vehicles in EU Directive 2004/26/EC valid until 1st January 2012 are the Stage IIIA limits, referenced in Annex I, section 40) (b),
table entitled 'Engines for propulsion of railcars'. SUP
3 The emissions requirements for diesel-powered passenger vehicles in US EPA Standard 40 CFR 89 are the Tier 3 limits, referenced in section 89.112, table 1. SUP 4 The use of low sulfur diesel fuels in order to reduce levels of sulfur dioxide emissions and facilitate the future use of exhaust after-treatment equipment is to be encouraged (b). SUP 5 Any new vehicle should have a single connection to allow ground power to be connected and used when equipment is stationary. REC 6 The use of auxiliary power units, electrical shore supplies or other independent means of providing vehicle power when the primary power source can be shut down to reduce emissions and/or
noise is desirable. SUP
7 Biodiesel up to 20% blend (B20) is to be encouraged where this can be achieved without any unacceptable detriment to engine performance, commercial arrangements or wider production environmental issues.
SUP
Part 4: Infrastructure Maintenance Rolling Stock, RDS 7512.4
1 Exhaust emissions from new infrastructure maintenance rolling stock utilising diesel engines for power and/or traction should comply with the relevant requirements of European Directive 2004/26/EC, or US EPA Standard 40 CFR 89.
REC
2 The emissions requirements for diesel engines used on new infrastructure maintenance rolling stock in EU Directive 2004/26/EC are the Stage IIIA limits, referenced in Annex I, section 4) (b), table entitled 'Engines for use in other applications than propulsion of inland waterway vessels, locomotives and railcars' or 'Engines for propulsion of locomotives', dependent upon the application.
SUP
3 The emissions requirements for diesel engines used on new infrastructure maintenance rolling stock in US EPA Standard 40 CFR 89 are the Tier 3 limits, referenced in section 89.112, table 1. SUP 4 The use of low sulfur diesel fuels in order to reduce levels of sulfur dioxide emissions and facilitate the future use of exhaust after-treatment equipment is to be encouraged. REC 5 The use of auxiliary power units, electrical shore supplies or other independent means of providing vehicle power when the primary power source can be shut down to reduce emissions and/or
noise is desirable. SUP
6 Biodiesel up to 20% blend (B20) is to be encouraged where this can be achieved without any unacceptable detriment to engine performance, commercial arrangements or wider production environmental issues.
SUP
REC - recommended; SUP – supplementary; MAN - mandatory (a)The RISSB Draft Exterior Environment Standards are issued with the following clauses:
- Draft only and issued solely for the purposes of development within the rail industry; - To be finalised following further feedback on its accuracy and appropriateness; and - Not intended for implementation in its draft form and no reliance shall be placed on the accuracy or appropriateness of its content.
(b) This is in line with the direction of EU Directive 2004/26/EC referenced above, and is consistent with international trends.

Page 11
Energy Efficiency Opportunities
Major rail operators have been working with the Australian Department of Resources, Energy and Tourism (DRET) to develop and report on potential additional opportunities to reduce energy use. A key criterion for these opportunities is that they have a potential payback of four years or less. These measures are expected to provide incremental improvements in rail’s environmental performance.
Most recently Rare Consulting (2012) has compiled a research paper on behalf of DRET addressing energy efficiency opportunities in the Australian rail sector(8). The research paper qualitatively reviews the application relevance, potential benefits and key implementation considerations of opportunities classified into three broad strategies:
Alternative drivetrains technologies – including engine switching locomotives, hybrid drivetrains and battery storage;
Fuel efficiency improvements – weight reduction, double stacking, driver assistance software, auxiliary power systems, improved aerodynamics, electronically controlled pneumatic (ECP) brakes, idle management devices and speed management; and
Intermodal transfer improvements – regenerative loading/unloading cranes, and intermodal train planning.
Draft Environmental Solutions for Freight Rail
The ARA reviewed short and long term opportunities for improving the environmental performance of the rail industry. The findings of this review are documented in the report Draft Environmental Solutions for Freight Rail. The report highlights the need for funding support from government in a partnership to:
Reduce the age of the Australian rail fleet, encouraging introduction of the latest clean and efficient technology; and
Facilitating the transition of the industry to a secure, low emission, natural gas energy alternative.
For the short term, a ten-year program of repowering and/or replacing 150 to 183 of Australia’s worst performing locomotives is proposed. The program was given as costing between AUD$424 million and AUD$721 million, reducing emissions for various pollutants by 20% to 80%. NOx emission reductions were projected to be 35-45% per locomotive, with particulate matter emissions reduced by 55-65% per locomotive. Reductions in locomotive noise emissions and health benefits for those living close to rail lines are noted to be additional benefits of repowering/replacing ageing and emissions intensive locomotives.
In the long term, a joint research and development program is proposed into the use of natural gas in Australia’s locomotives. This program is intended to focus on using natural gas as a primarily alternative fuel in high powered and well-utilised locomotives.
8 Rare Consulting (2012). Energy Efficiency Opportunities in the Australian Road and Rail Sectors– Supplementary information for EEO participants, February 2012.

Page 12
To date proposals outlined in the draft document have not been further progressed.
Study to Identify Potential Measures for Air Emissions from NSW Ports
This study, commissioned by the NSW Office of Environment and Heritage (OEH) – now the NSW EPA, aimed to identify controls and strategies to reduce air emissions from NSW ports, resulting in environmental and public health benefits. A number of potential measures were identified to address emissions from rail(9).
Notably, the main recommendations from this study relate to the encouragement of a greater model shift from road to rail freight to and from GMR ports. This measure was indicated to result in small net changes to port emissions, but to realise wider airshed benefits from reduced road network diesel traffic and congestion. Without this intervention it was indicated that a large increase in truck movements at GMR ports could be expected in the next 20 years.
In Sydney, Port Botany is committed to a 28% rail freight target, with the Port Botany Rail Team having been established to enhance rail operational performance and transport chain visibility, and to support modal shift to rail. The study recommended that truck and rail servicing charges under the Port Botany Landside Improvement Program be managed in support of Port Botany’s rail target.
Initiatives by Individual Rail Operators
Some of the voluntary initiatives being implemented by individual rail operators which have implications for air emissions are documented in Table 8.
9 PAEHolmes (2011). Potential Measures for Air Emissions from NSW Ports, Preliminary Study, Prepared for
the NSW Office of Environment & Heritage, 23 June 2011.

Page 13
Table 8. Fuel Efficiency and Emission Reduction Measures implemented or considered by some Australian rail operators(10) Queensland Rail National (QR National)
Fuel efficiency measures in place or proposed:
Driver training (one of the biggest influences operators have);
Driver Assistance tools (commercial systems such as TripOptimiser, Leader, EnergyMiser) are being investigated, with a view to having a solution in place (at least as a trial) in coming months (as reported in May 2012);
Automatic Engine Start Stop (AESS) implementations on new fleet and review of retrofit. Also a plan to consider revised operating procedures to reduce locomotive idle time;
Electric fleets - regenerative braking power implementation to make the overhead traction power supply more receptive to regenerated power from locomotives and able to transmit that power for use elsewhere in the railway or in the electricity supply grid. (Currently if the overhead supply is not receptive, the locomotives convert regenerated energy to heat locally);
QR National has an Energy Efficiency Opportunity group actively seeking out and sponsoring energy minimisation initiatives; and
Indirectly there are improved bulk fuel management programs, and building fuel more effectively into total cost of ownership models, to drive improved corporate behaviour and outcomes.
Emission reduction measures in place or proposed:
QR National will require that any new rolling stock designs, and/or repowers comply with European Union (EU) Stage IIIA Standards for Locomotive Engines UIC3 emissions requirements. QR National note that since there is no direct legislative or regulated requirement, this is a good faith requirement. As such, this requirement can be "overcome" where it is in conflict. For example, emissions compliant engines use more fuel; where this is the case QR National is likely, in the present legislative environment, to run the engine at it maximum fuel efficiency; and
Biodiesel is a consideration, but QR National note usage is limited to 5% blend by locomotive original equipment manufacturers (OEM). QR National are working to get this raised.
QR National is not investigating repowering as a solution.
10 Information provided by industry operators except where noted.
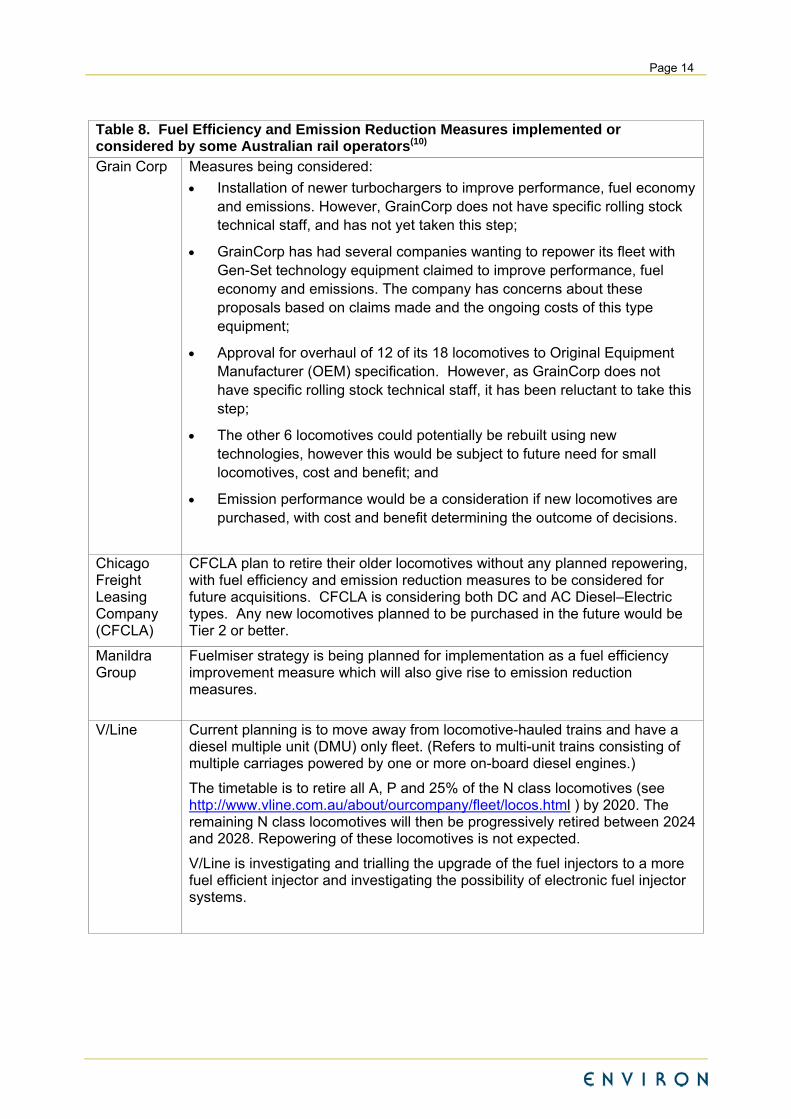
Page 14
Table 8. Fuel Efficiency and Emission Reduction Measures implemented or considered by some Australian rail operators(10) Grain Corp Measures being considered:
Installation of newer turbochargers to improve performance, fuel economy and emissions. However, GrainCorp does not have specific rolling stock technical staff, and has not yet taken this step;
GrainCorp has had several companies wanting to repower its fleet with Gen-Set technology equipment claimed to improve performance, fuel economy and emissions. The company has concerns about these proposals based on claims made and the ongoing costs of this type equipment;
Approval for overhaul of 12 of its 18 locomotives to Original Equipment Manufacturer (OEM) specification. However, as GrainCorp does not have specific rolling stock technical staff, it has been reluctant to take this step;
The other 6 locomotives could potentially be rebuilt using new technologies, however this would be subject to future need for small locomotives, cost and benefit; and
Emission performance would be a consideration if new locomotives are purchased, with cost and benefit determining the outcome of decisions.
Chicago Freight Leasing Company (CFCLA)
CFCLA plan to retire their older locomotives without any planned repowering, with fuel efficiency and emission reduction measures to be considered for future acquisitions. CFCLA is considering both DC and AC Diesel–Electric types. Any new locomotives planned to be purchased in the future would be Tier 2 or better.
Manildra Group
Fuelmiser strategy is being planned for implementation as a fuel efficiency improvement measure which will also give rise to emission reduction measures.
V/Line Current planning is to move away from locomotive-hauled trains and have a diesel multiple unit (DMU) only fleet. (Refers to multi-unit trains consisting of multiple carriages powered by one or more on-board diesel engines.)
The timetable is to retire all A, P and 25% of the N class locomotives (see http://www.vline.com.au/about/ourcompany/fleet/locos.html ) by 2020. The remaining N class locomotives will then be progressively retired between 2024 and 2028. Repowering of these locomotives is not expected.
V/Line is investigating and trialling the upgrade of the fuel injectors to a more fuel efficient injector and investigating the possibility of electronic fuel injector systems.

Page 15
Table 8. Fuel Efficiency and Emission Reduction Measures implemented or considered by some Australian rail operators(10) Pacific National (PN)(11)
PN’s division started analysing the fuel consumption of its intermodal business unit in 2009, realising that engaging train drivers and developing best practice techniques could result in significant reductions in overall fuel consumption, and therefore greenhouse gas production.
PN set targets to achieve a 5% energy reductions over two years.
Financial incentives were introduced as part of the train drivers’ enterprise agreements to encourage energy efficient operating practices, and time was spent identifying and examining new technologies for future equipment purchases.
Fuel savings teams, comprising train crew and supervisors, were established in each depot across Australia and engaged in identifying the ‘top ten driving principles’ to reduce fuel consumption.
PN identified best practice train handling techniques for each rail corridor on which it operates, taking into account location and geography. Assistance was given to train drivers to implement these techniques. Once implemented, PN was able to determine the litres per gross tonne kilometre (LGTK) and establish best practice LGTK rates per train, for the corridor and also for each driver. This made it possible to measure and benchmark drivers in terms of individual and overall depot performance.
PN is reported to have improved fuel consumption and deliver a 4.5% reduction in LGTK by the end of 2011. In its next phase of fuel improvements PN rolled out Freightmiser, a software system supporting drivers to reach their destination in a more efficient way, while taking into account variables such as the overall route, speed, gradient of the track and time. The Freightmiser system was created by a collaborative Cooperative Research Centre for Railway Engineering and Technologies (former Rail CRC) research team at the University of South Australia, Ausrail Technologies and TTG Transportation Technology(12). Due to the implementation of Freightmiser and other initiatives, PN projects it will reduce its fuel consumption by 12% during the 2011 to 2022 period.
Advances in Driver Advice Systems
Driver Advice Systems have been developed in Australia which provide train drivers with real-time advice regarding precise points at which to change modes to conserve energy, without impacting arrival times. Such systems comprise software, hardware and driver training.
Energymiser is a leading driver advisory system being delivered to the market by TTG Transportation Technologies Pty Ltd. The system is capable of delivering significant fuel savings to both passenger and freight services (personal communication, Dr. Anna Thomas, General Manager RIA). The system has also been tested for suburban trains with good 11 Information obtained from public domain information.
12 Rail Express, Cutting fuel use in rail haulage, November 2011, www.railexpress.com.au.

Page 16
results and is capable of delivering required transit times with minimal energy consumptions and environmental pollutions. Energymiser is a 4th generation product developed in collaboration with rail industry and tertiary research institutions. Freightmiser and Metromiser are earlier versions, all developed and supported in Australia. Energymiser is currently locally applied by Pacific National in addition to being implemented abroad in the UK, New Zealand, the US, Africa and India.
Future trialling or use of driver advisory systems have been noted by other Australian rail operators including Queensland Rail National and Manildra Group.
2.2.2 United States
The United States Environmental Protection Agency (US-EPA) follows a tiered approach for regulating emissions from newly manufactured and re-manufactured locomotives. Tiered standards are classified based on the power and purpose of the locomotive. Separate emission standards have been specified for locomotives with low power operations, which ideally would represent switching or shunting operations in a rail yard. Locomotives with higher power engines are more suitable for general line-hauling operations.
The first set of standards (Tier 0) applied to locomotives originally manufactured and re-manufactured prior to 2001. Following a revision of the tiered standards in 2008 any Tier 0 engine re-manufactured after 2008 would have to comply with the Tier 0+ standards. Similar principles apply to Tier 1 engines, which were originally manufactured between 2002-2004.
The 2008 revision resulted in Tier 3 and Tier 4 standards being introduced. Tier 3 standards are emission standards for newly built locomotives after 2009. Tier 4 standards, also termed as long-term standards, will come into effect from 2015 onwards. The Tier 4 emission standards for newly-built locomotives are based on the application of high-efficiency catalytic after treatment technology. According to US-EPA, implementation of the Tier 3 and Tier 4 regulations would reduce annual NOX and PM emissions by 800,000 tonnes and 27,000 tonnes respectively by 2030(13).
US Tier 0 to Tier 4 emission standards for low and high power engines are specified for common air pollutants and toxics such as: oxides of nitrogen (NOx), particulate matter (PM), carbon monoxide (CO) and hydrocarbons (HC). Such standards are expressed in grams per brake horsepower – hour (g/bhp-hr). To convert g/bhp-hr to grams per kilowatt-hour (g/kW-hr), the following conversion factor is applied: g/kW-hr = g/bhp-hr * 1.341(14).
US emission standards are given in Table 9 in g/kW-hr for line haul and switch/shunting locomotive applications.
13 EPA Finalizes More Stringent Emission Standards for Locomotives and Marine Compression-Ignition Engines,
US-EPA, March 2008 14 California – Air Resources Board (ARB) – Calculator,
www.arb.ca.gov/portable/perp/fleetemissions/calculatorinstructions.htm

Page 17
Table 9. US-EPA Tiered Standards for Line Haul and Switch Haul Locomotives
Line Haul Emission Standards (g/kW-hr)
Tier Classification
PM10 HC NOX CO
Uncontrolled 0.43 0.64 17.43 1.72
Tier 0 0.43 0.64 11.53 1.72
Tier 0+ 0.27 0.40 9.66 1.72
Tier 1 0.43 0.63 8.98 1.72
Tier 1+ 0.27 0.39 8.98 1.72
Tier 2 0.24 0.35 6.64 1.72
Tier 2 + and Tier 3 0.11 0.17 6.64 1.72
Tier 4 0.02 0.05 1.34 1.72
Switching/Shunting Emission Standards (g/kW-hr)
Tier Classification
PM10 HC NOX CO
Uncontrolled 0.59 1.35 23.33 2.45
Tier 0 0.59 1.35 16.90 2.45
Tier 0+ 0.31 0.76 14.21 2.45
Tier 1 0.58 1.35 13.28 2.45
Tier 1+ 0.31 0.76 13.28 2.45
Tier 2 0.25 0.68 9.79 2.45
Tier 2 + 0.15 0.35 9.79 2.45
Tier 3 0.11 0.35 6.03 2.45
Tier 4 0.02 0.11 1.34 2.45
2.2.3 California
NOX and PM emissions from locomotives contributed to 5% and 2.8% of California’s mobile NOX and PM emissions respectively in 2005(15). To address emissions from locomotives, the California Air Resources Board (CARB) developed an integrated approach to reducing emissions from locomotives and associated rail yards. This approach includes a series of mandatory and voluntary programs and includes partnering with US-EPA and industry, and the establishment of funding ‘incentive’ programs to maximise emission reduction opportunities. Such mandatory and voluntary initiatives address both new and existing locomotive engines(16).An overview is provided below of several key measures implemented in California to address locomotive and rail yard air emissions(17).
15 CARB (2009). Technical Options to Achieve Additional Emissions and Risk Reductions from California
Locomotives and Rail Yards, California Air Resources Board. 16 CARB (2008). Strategies to Reduce Locomotive and Associated Rail Yard Emissions, Fact Sheet, California Air Resources Board, February 2008.

Page 18
South Coast Memorandum of Understanding (MOU)
CARB established an MOU in 1998 with two major railroad companies, namely Union Pacific Railroad (UP) and BNSF Railway (BNSF). The agreement required the companies’ existing locomotive fleets operating in the South Coast Air Quality Management District (SCAQMD) to meet, on average, US Tier 2 locomotive emission standards. UP and BNSF have continued to bring their fleets progressively in line with the agreement.
Diesel Fuel Regulation
This regulation came into effect in 2007, and requires existing and new intrastate locomotives that operate 90% of the time in the state to use only California ultra-low sulfur (15 parts per million) diesel fuel.
Goods Movement Emission Reduction Program (GMERP)(17)
The GMERP, approved in 2006, is a partnership between CARB and local air district and sea port agencies aimed at projecting goods movement emissions growth estimates and devising strategies to reduce emissions from shipping and rail. The goal of the GMERP is to reduce locomotive NOX and particle emissions by up to 90% by 2020.
Availability of funding underpins the success of this program. The Department of Transport, California, authorised the legislature to allocate US$1 billion in bond funding to CARB to rapidly reduce emissions and health risks from freight movement along California’s priority trade corridors. CARB awards grants to fund projects proposed by local agencies such as air districts, ports and regional transportation agencies that are involved in freight movement or air quality improvements associated with goods movement activities. The local agencies are in turn responsible for providing financial incentives to equipment owners used in freight movement to upgrade to cleaner technologies, consistent with CARB guidelines.
GMERP targets existing locomotive fleet, with emission reduction options mainly focused on replacing, repowering or rebuilding old engines with newer technologies (e.g. generator-sets or hybrid technology for switcher locomotives) and installation of CARB-approved locomotive emission capture and control systems to minimise NOx and PM emissions.
California Yard Locomotive Replacement Program
One strategy within the GMERP is to replace California’s older yard locomotives that operate in and around rail yards state-wide. Emissions from rail yards are estimated to account for 5% of the state’s locomotive NOX and PM emissions, mostly occurring in rail yards in densely populated urban areas.
Multiple non-road engine (gen-set) and electric-hybrid yard locomotives have been introduced which demonstrate up to a 90% reduction in NOX and PM emissions is possible. UP and BNSF railroads have deployed gen-sets and electric-hybrid locomotives. BNSF has also been operating four liquefied natural gas (LNG) locomotives in the Los Angeles downtown district since the mid-1990s.
17 CARB (2010). Guidelines for Implementation, Proposition 1B: Goods Movement Emission Reduction Program, Final Report, California Air Resources Board.

Page 19
State-wide Railroad Agreement: PM Emission Reduction Program at California Rail Yards(18)
CARB signed a voluntary state-wide agreement in 2005 with UP and BNSF in regards to reducing particulate emissions at California rail yards. PM emission reduction measures implemented have included:
Installing idling devices on most (99%) California-based locomotives by June 2008. These automatic idling-reduction devices limit locomotive idling to no more than 15 minutes. For locomotives without the automatic idling devices, the participating railroad companies are required to limit the non-essential idling of locomotives, with no non-essential idling being permitted for more than 60 minutes;
Identifying and rectifying locomotives with excessive smoke issues and ensuring that at least 99% of locomotives operating in California pass smoke inspections; and
Assessing the health and risk impacts from operating in the rail yards and proposing mitigative measures.
Public consultation is an important part of this program. Toll free systems have been established to enable local residents to report locomotives that do not comply with smoke limits or idling restrictions. Periodic meetings with local communities and air districts are conducted to understand and identify impacts and mitigative measures. Communities are notified about any health and safety assessments undertaken and any new emission abatement technologies to be installed.
Technical Options Study
In 2009 CARB noted that the implementation of the aforementioned measures would significantly reduce emissions from locomotives, but that health risks associated with the remaining emissions would still be high. To address the remaining emissions, CARB compiled a Technical Options Report(19) that evaluated 37 options to further reduce locomotive and rail yard emissions. Based on the evaluation of these options in terms of technical feasibility, potential emission reductions, costs and cost-effectiveness, five measures were prioritised from the initial 37 measures, as follows:
Repowering of switch locomotives: The time period allocated for this action is two years (2010-2012). Switch locomotives are typically the yard locomotives used to push railcars and power local and regional service trains within the rail yards;
Repowering medium horsepower locomotives: The time period allocated for this action is two years (2011-2013). Medium horsepower locomotives are older locomotives that are mainly used for regional purposes than for interstate services;
Retrofitting switch locomotives with after-treatment devices: The emission control devices are mainly diesel particulate filters (DPF) for particulate matter and selective catalytic reduction (SCR) for NOX or both. The time period allocated for this action was given as three years (2012-2015);
18 CARB (2005). Particulate Emissions Reduction Program at California Rail Yards – ARB/Railroad Statewide Agreement, June 2005. 19 CARB (2009). Technical Options to Achieve Additional Emissions and Risk Reductions from California Locomotives and Railyards, California ARB, 2009.
Page 20
Retrofitting medium horsepower locomotives with after-treatment devices: This measure comprises the retrofitting of medium horsepower locomotives with DPF and/or SCR over a four year period (2012-2016); and
Introduction of Tier 4 interstate line haul engines: This option involves the accelerated implementation of Tier 4 line haul locomotives in California. Tier 4 standards require very clean engines incorporating after-treatment technologies for improved NOX and PM abatement. This is considered as a long-term objective, with a ten year implementation timeframe (2015-2025).
In addition to these five measures, CARB (2009) recommended a number of additional actions that collectively could achieve additional emission reductions from locomotives and rail yards. These include implementing specific rail yard measures, CARB development of their own emission regulations, and additional measures for reducing idling of cargo handling equipment.
In addition to the regulations and measures progressed by the CARB, several voluntary measures have been implemented by local industries, such as(20)(21):
In 2009 UP and Progress Rail Services developed an ultra-clean diesel engine which complies with US-EPA Tier 2 standards and incorporates DPF and SCR systems;
The Southwest Research Institute (SwRI), in partnership with US-EPA, initiated the first retrofit of a diesel oxidation catalyst (DOC) on a line haul locomotive in 1989. Based on estimates provided by SwRI, installing the DOC could reduce diesel PM emissions by about 50%; and
UP launched a series of new environmentally friendly ultra-low emission diesel locomotives for use in the Los Angeles Basin rail yards in 2007. These locomotives are called ‘Gen-Set’ switchers and are projected to reduce NOX and PM emissions by about 80% and to consume 16% less fuel when compared to current low-horsepower locomotives. UP have also tested another environmentally friendly low-horsepower rail yard locomotive called the ‘Green Goat’. The Green Goat is a battery run, hybrid engine, designed to cut emissions by about 80%.
2.2.4 International Union of Railways
The International Union of Railways (UIC) is a Paris-based international railway organisation comprising 82 active member countries, 80 associate member countries and 35 affiliate members. Australia is an affiliate member of the UIC. The UIC established its own locomotive emission standards, which are binding to member railways but not affiliated members.
The UIC standards are applicable to railway traction diesel engines (other than special locomotives used for refinery or mining purposes) and traction engines with power outputs of
20 MECA (2009). Case Studies of the Use of Exhaust Emission Controls on Locomotives and Large Marine Diesel Engines, Manufacturers of Emission Controls Association (MECA), September 2009. 21 New Ultra-Low Emission Locomotive, Union Pacific, http://www.uprr.com/newsinfo/releases/environment/2007/0131_ultralow.shtml
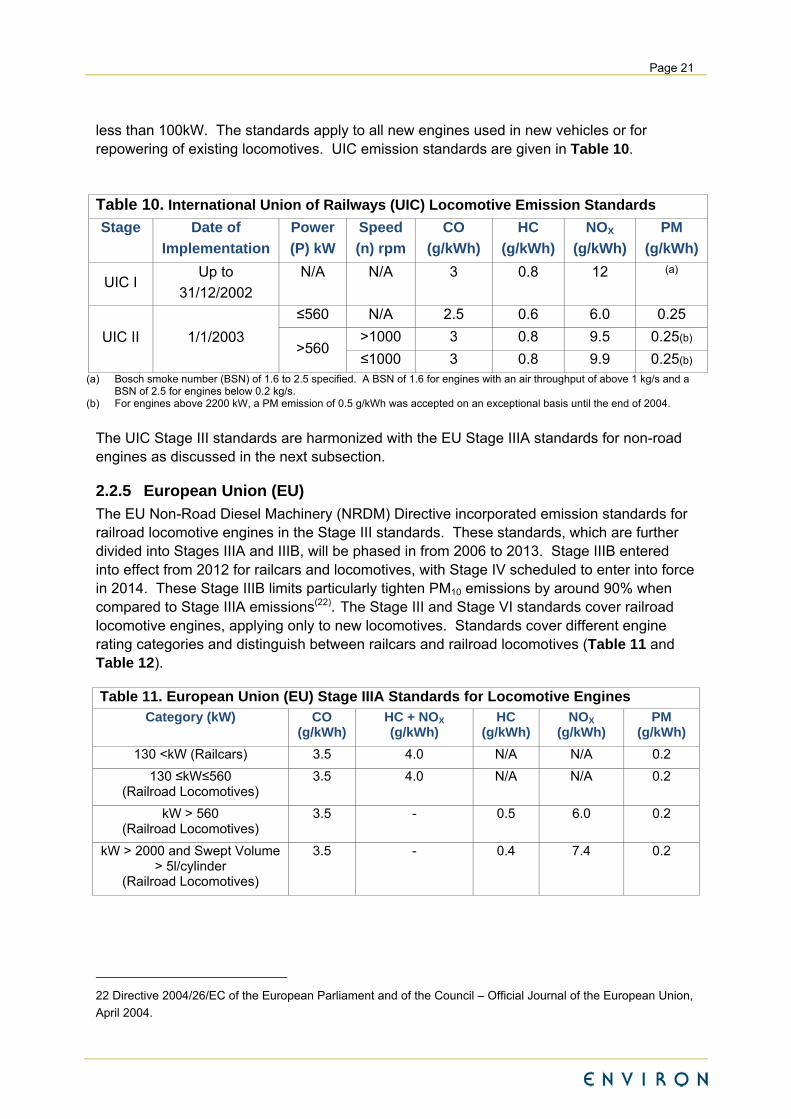
Page 21
less than 100kW. The standards apply to all new engines used in new vehicles or for repowering of existing locomotives. UIC emission standards are given in Table 10.
Table 10. International Union of Railways (UIC) Locomotive Emission Standards
Stage Date of
Implementation
Power
(P) kW
Speed
(n) rpm
CO
(g/kWh)
HC
(g/kWh)
NOX
(g/kWh)
PM
(g/kWh)
UIC I Up to
31/12/2002
N/A N/A 3 0.8 12 (a)
UIC II 1/1/2003
≤560 N/A 2.5 0.6 6.0 0.25
>560 >1000 3 0.8 9.5 0.25(b)
≤1000 3 0.8 9.9 0.25(b) (a) Bosch smoke number (BSN) of 1.6 to 2.5 specified. A BSN of 1.6 for engines with an air throughput of above 1 kg/s and a
BSN of 2.5 for engines below 0.2 kg/s. (b) For engines above 2200 kW, a PM emission of 0.5 g/kWh was accepted on an exceptional basis until the end of 2004.
The UIC Stage III standards are harmonized with the EU Stage IIIA standards for non-road engines as discussed in the next subsection.
2.2.5 European Union (EU)
The EU Non-Road Diesel Machinery (NRDM) Directive incorporated emission standards for railroad locomotive engines in the Stage III standards. These standards, which are further divided into Stages IIIA and IIIB, will be phased in from 2006 to 2013. Stage IIIB entered into effect from 2012 for railcars and locomotives, with Stage IV scheduled to enter into force in 2014. These Stage IIIB limits particularly tighten PM10 emissions by around 90% when compared to Stage IIIA emissions(22). The Stage III and Stage VI standards cover railroad locomotive engines, applying only to new locomotives. Standards cover different engine rating categories and distinguish between railcars and railroad locomotives (Table 11 and Table 12).
Table 11. European Union (EU) Stage IIIA Standards for Locomotive Engines Category (kW) CO
(g/kWh) HC + NOX (g/kWh)
HC (g/kWh)
NOX (g/kWh)
PM (g/kWh)
130 <kW (Railcars) 3.5 4.0 N/A N/A 0.2
130 ≤kW≤560 (Railroad Locomotives)
3.5 4.0 N/A N/A 0.2
kW > 560 (Railroad Locomotives)
3.5 - 0.5 6.0 0.2
kW > 2000 and Swept Volume > 5l/cylinder
(Railroad Locomotives)
3.5 - 0.4 7.4 0.2
22 Directive 2004/26/EC of the European Parliament and of the Council – Official Journal of the European Union,
April 2004.

Page 22
Table 12. European Union (EU) Stage IIIB Standards for Locomotive Engines Category (kW) CO
(g/kWh) HC + NOX (g/kWh)
HC (g/kWh)
NOX (g/kWh)
PM (g/kWh)
130 <kW (Railcars) 3.5 - 0.19 2.0 0.025
130 <kW
(Railroad Locomotives)
3.5 4.0 - - 0.025
Rail Diesel Study 2006
In addition to introducing emission standards for locomotives, the European Commission called for initiatives addressing diesel exhaust emissions for in-service fleets. The UIC commissioned the Rail Diesel Study in 2006 (23). The objective of the study was to carry out a detailed assessment, investigating and identifying measures for reducing exhaust emissions from existing locomotives and assessing the practicability of engines implementing the Stage IIIA and Stage IIIB standards.
The study comprised four parts. The first part assessed existing locomotive fleets across Europe and estimated fleet compositions for future years. The second part identified the technical and operational measures for improving emissions performance. Impacts of rail emissions on the local air quality were investigated in the third part, and potential emission reduction strategies identified in the final part of the study.
Engines addressed in the study included: pre-1990 and post-1990 railcars, pre-1990 and post-1990 mainline locomotives and pre-1990 and post-1990 shunting locomotives. Study outcomes which are of relevance for this investigation are outlined below(24).
Abatement measures investigated for existing fleet included: diesel particulate filters (DPF), selective catalytic reduction (SCR), selective catalytic reduction with diesel particulate filters (SCR+DPF), exhaust gas recirculation (EGR) and re-engining. It was noted that for pre-1990 railcars, the feasible abatement measure would be open channel DPF only and re-engining, whereas with the post-1990 railcars, SCR and SCR+DPF, may be possible. Similarly, for pre-1990 mainline locomotives, feasible measures included DPF (open channel only) and re-engining and for post-1990 mainline engines, DPF, SCR and DPF+SCR could be possible. With the pre-1990, shunting locomotives, ideal abatement measures include DPF and re-engining, whereas with the post-1990 shunting engines, DPF, SCR and DPF+SCR may be possible. The use of EGR was concluded to be a technical option for new railcar and locomotive engines to meet Stage IIIA limit values.
Assessment of abatement measures for future fleet focussed on assessing options that could aid in meeting the Stage IIIA and Stage IIIB limits. Based on information gathered from
23 Kollamthodi S (2006). Rail Diesel Study – Management Summary, AEA Technology Environment, Final
Report, March 2006. 24 Kollamthodi S (2006). Rail Diesel Study – Management Summary, AEA Technology Environment, Final
Report, March 2006.

Page 23
engine and vehicle manufacturers, it was concluded that Stage IIIA limits would be achieved by using internal engine measures and low-sulfur fuels. It was envisaged that exhaust after-treatment technologies may not be required. To comply with the Stage IIIB limits, DPF would be required to meet the PM10 limits, however the study could not ascertain whether SCR would be required to comply with the Stage IIIB NOX limits or whether it could be achieved using internal design changes.
The study observed that internal changes to the design to comply with Stage IIIA limits would lead to increased vehicle capital cost between 3% and 15%, increased maintenance cost of between 5% and 10%, and increased fuel consumption between 4% and 6%. Similarly, in order to comply with Stage IIIB limits, the vehicle capital costs would increase between 8% and 20% and maintenance costs would be expected to increase between 5% and 15%. In relation to fuel costs, there is a possibility of fuel costs decreasing by about 5% when certain abatement options are chosen or increasing by 9% for the other options chosen.
A wide range of operational measures were also reviewed such as reductions in engine idling, planning of workload of traction units, driver training and listing of energy efficient opportunities and reducing diesel traction on electrified tracks. The study observes that though operational measures could be implemented more quickly than technical measures (e.g., internal design changes; exhaust-treatment technologies), planning and operational barriers would hinder the implementation of these measures.
Operational measures were also observed to be very site-specific, with no uniform standards able to be set for implementing these measures. It is recommended that operational measure options be presented to railway operators to choose the measure feasible and applicable to them.
2.2.6 Canada
Canada has historically managed locomotive emissions through MOUs with rail operators (1995-2005 and 2006-2010). However, in 2006 the Government of Canada issued a Notice of Intent, signalling its plans to develop air emissions standards.
Canada is currently in the process of developing locomotive emission standards. It is expected that these emission regulations will closely reflect US emission standards. A study was conducted by Transport Canada in 2010 to support such regulations(25). The study noted that in 2008 rail transport contributed to about 9% of all transport related NOX emissions in Canada.
Transport Canada has also developed ecoFREIGHT, a program aimed at reducing emissions from freight transport. The initiatives within this program of relevance for rail are as follows(26):
Freight Technology Demonstration Fund: to enable cost-sharing demonstrations to test and measure new and underused freight transport technologies;
25 Rolling Towards a Cleaner Future: The Development of Canadian Locomotive Emissions Regulations – Issue
Brief, Transport Canada, December 2010 26 ARA (2010). Draft: Environmental Solutions for Freight Rail, Australasian Railway Association Inc.
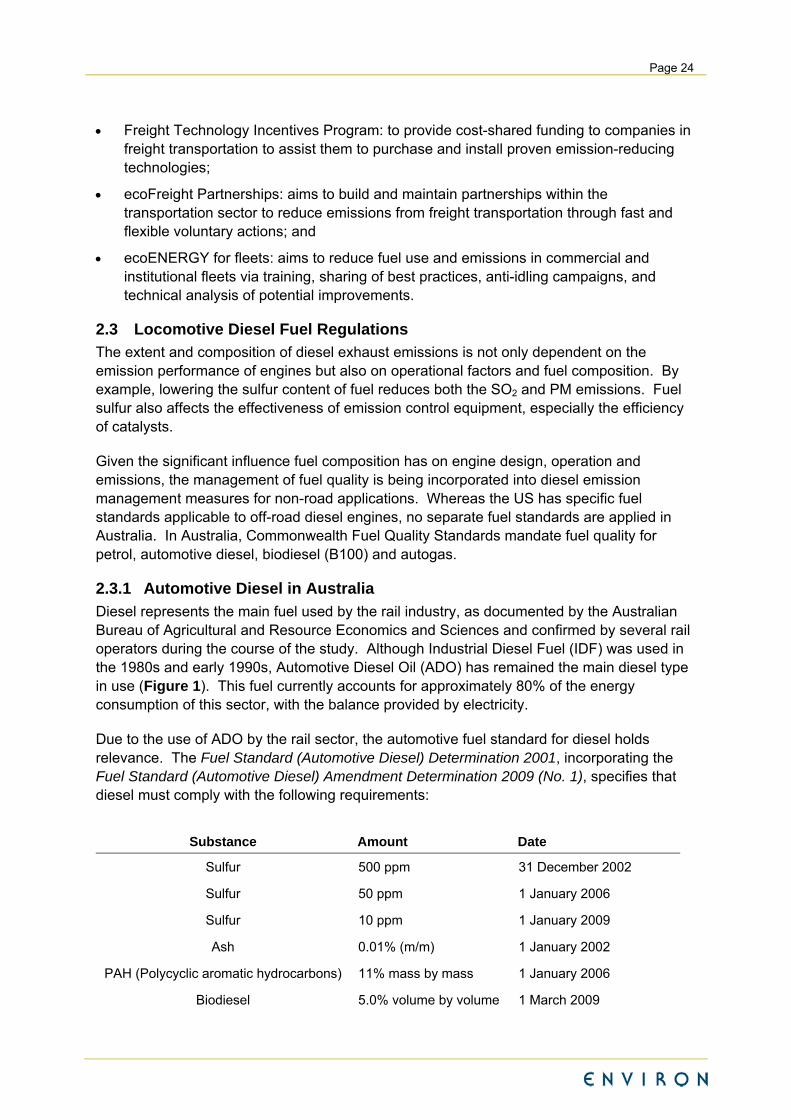
Page 24
Freight Technology Incentives Program: to provide cost-shared funding to companies in freight transportation to assist them to purchase and install proven emission-reducing technologies;
ecoFreight Partnerships: aims to build and maintain partnerships within the transportation sector to reduce emissions from freight transportation through fast and flexible voluntary actions; and
ecoENERGY for fleets: aims to reduce fuel use and emissions in commercial and institutional fleets via training, sharing of best practices, anti-idling campaigns, and technical analysis of potential improvements.
2.3 Locomotive Diesel Fuel Regulations
The extent and composition of diesel exhaust emissions is not only dependent on the emission performance of engines but also on operational factors and fuel composition. By example, lowering the sulfur content of fuel reduces both the SO2 and PM emissions. Fuel sulfur also affects the effectiveness of emission control equipment, especially the efficiency of catalysts.
Given the significant influence fuel composition has on engine design, operation and emissions, the management of fuel quality is being incorporated into diesel emission management measures for non-road applications. Whereas the US has specific fuel standards applicable to off-road diesel engines, no separate fuel standards are applied in Australia. In Australia, Commonwealth Fuel Quality Standards mandate fuel quality for petrol, automotive diesel, biodiesel (B100) and autogas.
2.3.1 Automotive Diesel in Australia
Diesel represents the main fuel used by the rail industry, as documented by the Australian Bureau of Agricultural and Resource Economics and Sciences and confirmed by several rail operators during the course of the study. Although Industrial Diesel Fuel (IDF) was used in the 1980s and early 1990s, Automotive Diesel Oil (ADO) has remained the main diesel type in use (Figure 1). This fuel currently accounts for approximately 80% of the energy consumption of this sector, with the balance provided by electricity.
Due to the use of ADO by the rail sector, the automotive fuel standard for diesel holds relevance. The Fuel Standard (Automotive Diesel) Determination 2001, incorporating the Fuel Standard (Automotive Diesel) Amendment Determination 2009 (No. 1), specifies that diesel must comply with the following requirements:
Substance Amount Date
Sulfur 500 ppm 31 December 2002
Sulfur 50 ppm 1 January 2006
Sulfur 10 ppm 1 January 2009
Ash 0.01% (m/m) 1 January 2002
PAH (Polycyclic aromatic hydrocarbons) 11% mass by mass 1 January 2006
Biodiesel 5.0% volume by volume 1 March 2009

Page 25
The sulfur content of diesel has been regulated down from 500 ppm to 50 ppm, and most recently to 10 ppm. Following extensive stakeholder consultation, amendments have been made to the Fuel Standard (Automotive Diesel) Determination 2001 to allow up to five per cent biodiesel in diesel fuel without a labelling requirement from 1 March 2009.
There are circumstances where the use of blends with more than five per cent biodiesel, such as 20 per cent biodiesel (B20) can be used. A B20 fuel standard is currently being developed.
Figure 1. Energy Consumption by Rail Transport in Australia (ABARE, 2011).
2.3.2 Diesel Used in the United States(27)
The sulfur content in non-road diesel fuels was not limited by environmental regulations during the Tier 1 to Tier 3 stages. At that time, the oil industry specification was 0.5% (maximum, by weight), with the average in-use sulfur level being in the range of 0.3% (3000 ppm). Tier 4 engines, which incorporate sulfur-sensitive control technologies such as catalytic particulate filters and NOx adsorbers, necessitated the mandated reduction of sulfur content in non-road diesel fuels.
The US Clean Air Nonroad Diesel Rule of 2004 reduced sulfur levels in non-road diesel fuels. The sulfur content was reduced to 500 ppm (effective June 2007) for non-road,
27 Regulatory Announcement – Clean Air Nonroad Diesel Rule, US-EPA, 2004

Page 26
locomotive and marine diesel fuels. The sulfur content was further reduced to 15 ppm (ultra-low sulfur diesel) for non-road fuel (effective June 2010) and locomotive and marine fuels (effective June 2012).
In 2005 CARB passed a final regulation extending the Motor Vehicle Fuel Standards to Intrastate Diesel-Locomotives and Harborcrafts (effective January 2007)(28). This regulation ensures that fuel used in diesel-electric intrastate locomotives is subject to all of the requirements applicable to vehicular diesel fuel including sulfur content and hydrocarbon content.
2.3.3 Diesel Used in Canada
Canadian Railways(29), after extensive testing, have found that diesel fuel derived from the Canadian tar sands (which have a higher aromatic content and lower cetane number) performed in an acceptable manner in locomotives. Canadian Railways then tried to assist diesel fuel suppliers in developing diesel fuel which has similar physical and chemical properties as the fuels derived from that specific region. In the absence of formal diesel emission regulations in Canada, the focus has been on regulating the type of fuel used. Examples of Canadian regulated diesel fuels include: CAN/CGSB 3.18 – diesel fuel for medium speed locomotives and CAN/CGSB 3.517 – automotive low sulfur diesel fuel.
2.3.4 Biodiesel
Research has been conducted on the cause and effects of replacing diesel fuel oils with biofuels. Biofuels are essentially produced using organic sources. Biodiesel is typically expressed as a code (e.g. B10, B20) which indicates the extent to which biodiesel has been blended with conventional diesel. The number indicates the portion of the blended fuel that is biodiesel, i.e. B10 contains 10% biodiesel and 90% regular diesel.
A detailed study on effectiveness, viability and cost implications of biodiesel was conducted by the UIC in 2007(30). The study noted that initial results from UK trials suggest that the optimum combination of effects on engine performance probably occurs at Biodiesel blends between B10 and B40/50. With the exception of emissions of NOx (which decrease from a peak around B50), all other negative impacts increase significantly for blends between B40/50 and B100. Whereas biodiesels tend to increase NOX emissions, particulate matter emissions were noted to be reduced.
The potential for particulate matter emission reductions due to biodiesel use in not conclusive. Fritz (2004) observed that while NOX emissions increased and CO emissions decreased, trends in PM emissions could not be ascertained(31).
28 Final Regulation Order – Proposed Extension of the California Standards for Motor Vehicle Diesel Fuel Used
for Intrastate Diesel-Electric Locomotives and Harborcrafts, California ARB, 2005 29 Dunn, R (2001). Diesel Fuel Quality and Locomotive Emissions in Canada, Prepared for Transportation
Development Centre – Transport Canada, April 2001. 30 Railways and Biofuel – First UIC Report, Association of Train Operating Companies, July 2007. 31 Fritz, S.G. (2004), Evaluation of Biodiesel Fuel in an EMD GP38-2 Locomotive, National Renewal Energy Laboratory, May 2004.
Page 27
2.4 Locomotive Noise Regulations
This section provides a review of current noise regulation in Australia (Commonwealth and state level) and international rail noise regulation in Europe and North America.
2.4.1 Australia
2.4.1.1 Commonwealth Legislation
There is no Commonwealth legislation relating to rail noise emissions.
2.4.1.2 Industry Standards
The Australian Rail Association (ARA) is in the process of developing Exterior Environment standards in conjunction with the Rail Industry Safety and Standards Board (RISSB). This process was started in July 2007(32) and draft guidelines were issued to key stakeholders, such as NSW and other state regulatory bodies and private industry organisations. This standard is not yet finalised. A finalisation date has not been established.
2.4.2 New South Wales
The NSW Environmental Protection Authority (NSW EPA) is responsible for rail noise policy and regulation in NSW. A review is being undertaken with industry and aims to consider industry standards in policy development.
Noise regulation in NSW is controlled by statutory and non-statutory government regulation generally focused at the planning stage, by environmental protection licenses and industry self-regulation for existing rail operations. These are described further in the following sections.
2.4.2.1 Planning Noise Criteria
The Interim guideline for the assessment of noise from rail infrastructure projects (IGANRIP) was published in 2007. Its purpose was to assist the ongoing expansion of rail transport by streamlining approval processes for rail infrastructure while ensuring that potential noise and vibration impacts are assessed in a consistent way and minimised as far as possible. The draft Rail Infrastructure Noise Guideline (RING, 2012) ) was released for public consultation and industry feedback in February 2012. It sets non-mandatory external trigger noise levels, beyond which all reasonable and feasible noise mitigation must be considered before approval is granted. The policy also provides guidance on assessing rail traffic-generating developments which may cause an increase in rail noise levels, for example, locomotive movement increases associated with mining operations. Once approved, the draft RING will replace IGANRIP.
Projects involving maintenance facilities for rolling stock, stationary sources, or rail lines on an industrial site are assessed in accordance with the NSW Industrial Noise Policy (INP) (NSW EPA, 2000). Appropriate noise criteria are being finalised for private rail lines from industrial land (for example, coal mines to the rail network).
The Department of Planning and Infrastructure (DP&I) released the Interim Guideline for Developments Near Rail Corridors and Busy Roads in 2008 which incorporates State
32 NSW Parliamentary Library Research Service (2009), Rail Freight Transport in NSW by Holly Park, Page 19.

Page 28
Environmental Planning Policy (SEPP) (Infrastructure) 2007 noise criteria. This guideline was prepared to provide a simple and consistent assessment approach across NSW for developments proposed adjacent to an operating rail corridor or busy road. The guideline provides advice on how to achieve the internal noise levels required for residential and other noise sensitive land uses in the Infrastructure State Environmental Planning Policy (SEPP) and assists consent authorities (local councils) to determine whether development adjacent to a rail corridor is suitable.
2.4.2.2 Operational Noise Criteria
The Rail Corporation of NSW (RailCorp), the Australian Rail Track Corporation (ARTC), John Holland Rail Pty Ltd and V/line hold Environmental Protection Licences (EPL) under the Protection of the Environment Operations Act 1997, issued by the NSW EPA, which sets noise limits for locomotives using the NSW rail network. All new locomotives or locomotives which have substantial modification must comply with noise limits within the EPL before approval to operate on the network is granted. However a provision of the licence allows locomotives that do not meet all of the limits to be approved provided that they are consistent with best practice, all reasonable and feasible noise mitigation measures have been implemented and that exceedences do not result in environmental harm. Most locomotives are approved under this condition. The process for obtaining approval involves acoustic testing and certification by an appropriately qualified consultant.
The license does not retrospectively apply to existing locomotives introduced into service prior to the issue date of the EPL. Therefore, a proportion of locomotives currently in service on NSW rail lines exist that have not undergone significant upgrades or refurbishment, and may not comply with the EPL limits. Of the >600 locomotives currently operating on the NSW network, approximately 60% have been approved by the NSW EPA and its predecessors in accordance with the licence. The remaining 40% were already operating on the NSW network when the licence came into force and did not have to meet these limits until they were ‘substantially modified’. Based on an understanding that locomotives generally require a major overhaul every eight to ten years, the intent of Condition L6 was for every locomotive operating in NSW to meet the specific noise criteria within a decade. This has not been achieved – whether the locomotives have not been overhauled in a manner to meet the criteria of ‘substantially modified’ or have not been notified to the NSW EPA when they have been substantially modified, or both, is unclear. A further limitation of the current licence is that it does not require locomotives to be maintained after initial testing at the noise criteria specified in the licence following approval to operate on the network.
2.4.2.3 Operational Noise Criteria Currently Under Development
In addition to RING, the rail industry is developing a rail noise abatement program to address existing significant rail noise issues on a priority basis(33). This program will target requests from noise sensitive receivers to assess and mitigate existing rail noise.
2.4.3 Other Australian States
Appendix 3 of the RING (EPA, 2012) provides a summary of rail noise criteria present in Australian states, all of which document alternative methodologies for assessing noise management and regulation(34).
33 NSW EPA (March 2012), Rail Infrastructure Noise Policy (RING), page 26.

Page 29
Both South Australia and Tasmania also use current NSW rail noise planning criteria.
In Victoria, the Victorian Department of Transport (DOT) has overall responsibility for noise caused on public rail lines(35). With the exception of several large projects, such as the Melbourne Airport rail link where planning noise levels have been established, there are currently no formal standard criteria related to rail noise emissions. A draft Rail Noise Policy is under development by the Victoria Department of Planning and Community Development (DPCD).
South Australia aims to manage rail noise using environmental protection licences. Track operators are required to manage noise impacts from the rail network in accordance with requirements of an Environmental Improvement Program, issued by the South Australian EPA, which sets out actions to reduce noise impacts (predominantly wheel squeal). RING notes that a draft rail noise guideline is in preparation, however this policy has not yet been released by the South Australian EPA.
In Queensland, QR National is responsible for their own rail network noise emissions and provides a rail management strategy prepared to demonstrate compliance with general environmental duty under the Queensland Environment Protection Act, 1994. The strategy nominates planning noise levels for new and redeveloped rail lines. The Queensland Development Code also requires proposed developments adjacent to rail corridors to be assessed and demonstrate compliance with nominated internal noise limits.
There are no formal rail noise criteria in Tasmania and typically criteria nominated in the QR National noise management document are adopted for Tasmania based rail projects.
Western Australia has a state level rail noise policy which provides noise limits for new rail lines. Where levels are above the limits, noise reduction measures need to be considered. Major upgrades of existing rail lines are dealt with on a case by case basis.
There are currently no formal rail noise criteria in Northern Territory or the ACT.
2.4.4 Canada/United States (US)
Noise criteria for new rail developments are provided in Canada and the United States.
Canadian planning requirements include absolute internal noise level specifications for habitable spaces and criterion for other spaces.
34 NSW EPA (March 2012), Rail Infrastructure Noise Policy (RING), Appendix C, Page 30. 35 CRC for Rail Innovation (November 2008).
Page 30
The United States adopt a range based criteria that indicate the onset of potential rail noise impacts. The criteria are derived taking into consideration existing rail noise levels to avoid potential cumulative impacts(36).
2.4.5 European Union (EU)
The majority of rail noise criteria in Europe apply to new rail lines only. The exception is Switzerland who provides planning noise level for redeveloped rail lines. The criteria provided in European countries is typically similar to that provided for road developments, however, the rail developments include a 5 dB bonus to reflect the industries acceptance that rail noise causes less annoyance than road traffic noise.
European rail noise criteria comprises a target noise level which is considered the ideal planning noise level, as well as an alarm noise criteria which triggers the need for noise attenuation measures. The attenuation measures include the consideration of barriers or building architectural treatment. The alarm noise is commonly set 5 - 10 dB above the planning noise levels and are a typically legislated requirement for rail developments.
The key difference between NSW and Europe is that the NSW noise measures are non-mandatory while most European countries have legislated levels.
The Technical Specification for Interoperability (TSI) has been prepared by the EU to provide noise level limits for new, renewed or upgraded operational rolling stock(37). Noise limits are provided for various types of rail vehicles (e.g. locomotives, wagons) for various operational settings (e.g. pass by, idle). The standard is currently under review(38), with the intention of tightening existing noise limits and applying the limits retrospectively to old rolling stock operating on European networks. This review is part of greater long-term schemes in Europe by private industry bodies to ameliorate rail traffic noise levels on European networks.
2.5 Summary of Findings
Regulatory and other measures implemented by jurisdictions for new locomotives and existing locomotive fleets, both locally and internationally, were reviewed.
No emission standards apply in Australia, either nationally or by states, to address air emissions from locomotives. However several government and industry initiatives were identified which are of relevance to realising emission reductions in the short and long terms, including:
DIISR’s On Track to 2040 project aimed at progressing future technologies, including emission reduction strategies, within the Australian rail industry;
RISSB’s development of Exterior Environment Standards through its Australian Rolling Stock Standards Project, which include emission standards for new locomotives. This initiative is on-going;
36 NSW EPA (March 2012), Rail Infrastructure Noise Policy (RING), page 30. 37 International Union of Railways (UIC) (2010), Railway Noise in Europe, A 2010 report on the state of the art,
page 8. 38 Transport and Environment (November 2011), Revision of the EU rail noise standards (TSI), Input to the ERA
Working Party SI Noise, Page 4.

Page 31
Development of energy efficiency opportunities for the rail sector through collaboration between major rail operators and DRET;
ARA’s review of short and longer term opportunities for freight rail, as documented in its 2010 document Draft Environmental Solutions for Freight Rail;
NSW OEH commissioned study in 2011 to identify potential measures to reduce air emissions from NSW ports, including rail-related emissions; and
Voluntary initiatives by individual rail operators including the implementation of fuel efficiency improvements, driver assistance systems and the purchase of cleaner locomotives when purchasing new stock.
Emission standards in the US and EU for diesel locomotives are the most widely referenced and applied standards internationally. Despite significant differences in the rail industries in the US and EU, the trend is towards the harmonisation of such emission standards. Other measures implemented in jurisdictions such as California, the EU and Canada were identified to include:
Establishing MOUs with major rail operators to realise progressing improvements in existing fleets;
Funding of improvements to existing locomotive fleet focusing on replacing, repowering or rebuilding old engines with newer technologies;
Research into the technical feasibility, emission reductions, costs and cost-effectiveness of emission reduction measures; and
Diesel fuel regulation, notably reductions in fuel sulfur to ensure the effectiveness of after-treatment technology.
Diesel represents the main fuel used by the Australian rail industry, accounting for approximately 80% of the energy consumption of this sector, with the balance provided by electricity. Although a small portion of Industrial Diesel Fuel (IDF) was used in the 1980s and early 1990s, automotive diesel oil (ADO) has remained the main diesel type in use by the rail sector. The sulfur content of ADO has been regulated down to 10 ppm, with Australian ADO therefore being of sufficient quality for the implementation of after-treatment technologies.
There is no Commonwealth legislation relating to rail noise emissions. Noise regulation in NSW is controlled by statutory and non-statutory government regulation generally focused at the planning stage, by environmental protection licenses and industry self-regulation for existing rail operations. Alternative methods are used in other states for noise management and regulation. The rail industry is engaged in a national process to develop Exterior Environment Standards, including noise emission requirements. This process is on-going.
Noise requirements in Canada, the US and EU primarily relate to new rail developments. Switzerland was the only jurisdiction identified as having noise criteria for redeveloped rail lines. The key difference between NSW and many overseas criteria is that the NSW trigger noise levels are non-mandatory as opposed to alarm noise levels for most of the European countries that have legislated levels.

Page 32
3 Locomotive Fleet Characterisation
3.1 Rail Operator Industry Structure
The rail industry changed dramatically over the last twenty years as the opportunities arose for open access and competition. There are now over 24 freight operators compared to less than ten in the early 1990s. The sections below introduce each of the current main freight operators along with a summary of their locomotives.
All of the former government-owned freight railways are now operated on a vertically separated model, in that the rail operators are provided with track access by rail infrastructure owners. ARTC controls access to most of the standard gauge network. State governments have elected to keep their passenger rail operations and networks as vertically integrated entities remaining in government ownership. Freight operators traversing city passenger rail networks have to apply to the passenger rail operators/owners for track access, examples being RailCorp and QR National. Private rail operators in South Australia, Northern Territory, Western Australia and Queensland operate vertically integrated railways where the one organisation has control of the trains and the track.
3.1.1 Rail Operators and National Locomotive Fleets
Table 13 details the known rail freight owners and operators in Australia and indicates the number of locomotives and the track gauges on which they run. This table is sorted by descending number of total locomotives. The bold figures represent locomotives capable of operating in NSW.
There are a variety of freight rail operators, however all are private companies. Included in the discussion below are some passenger operators that utilise diesel locomotives, which could in theory, be used for freight purposes.
About 86% of diesel-powered locomotives are main haul locomotives with the remainder being switch locomotives. Switching comprises the moving of railcars in the make-up and break-up of trains, moving of railcars on industrial switching tracks or interchange tracks, and the general movement of railcars within terminals or at junctions. Switch locomotives can also be used to power local and regional service trains. Line-haul locomotives have larger engines and tend to operate over longer distances, including intrastate and interstate travel. Large line-haul and passenger locomotives generally have a power rating greater than 2,000kW. Small line-haul locomotives have engines with power ratings between 1,000kW and 2,000kW, with switch locomotive engines generally being less than 1,000kW.
The Australian rail freight market can be divided into bulk and non-bulk markets, with the former dominating the total tonne-kilometre rail task. Bulk freight comprises primarily mineral and agricultural products. Approximately 38% of the 2011 fleet are used for iron and coal freight, 30% for intermodal freight, 28% for rural freight (e.g. grain), and about 4% for passenger services.
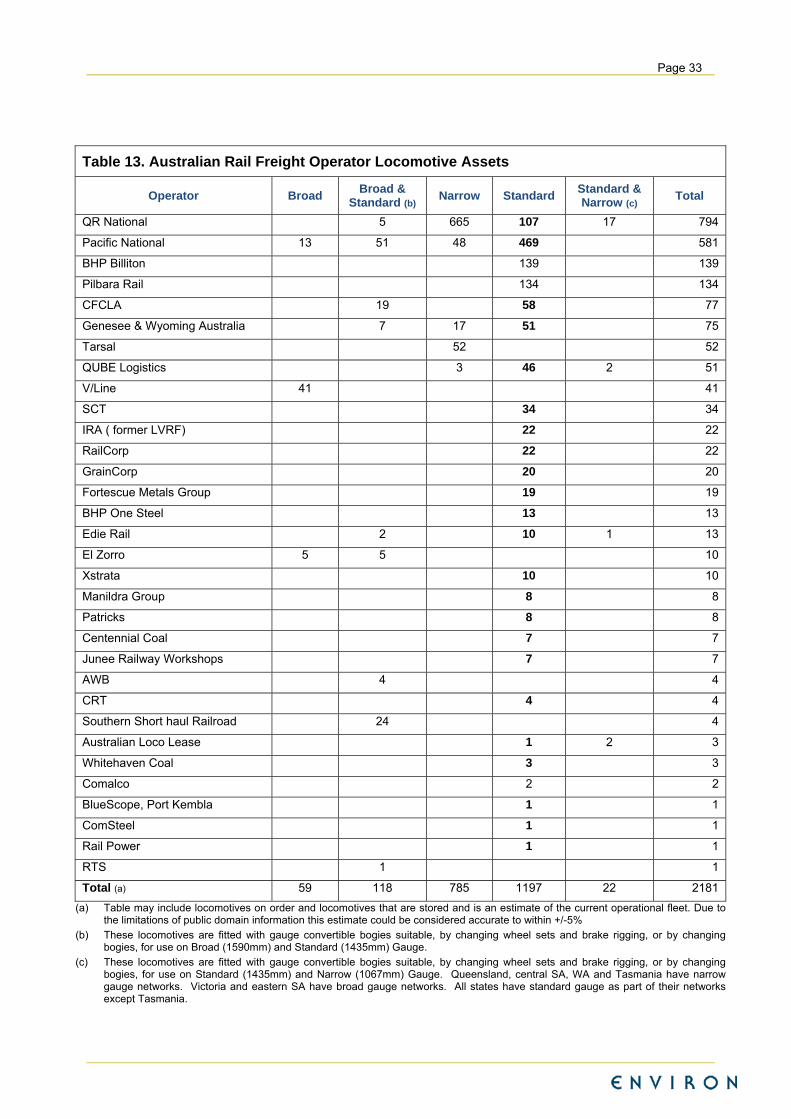
Page 33
Table 13. Australian Rail Freight Operator Locomotive Assets
Operator Broad Broad &
Standard (b) Narrow Standard
Standard & Narrow (c)
Total
QR National 5 665 107 17 794
Pacific National 13 51 48 469 581
BHP Billiton 139 139
Pilbara Rail 134 134
CFCLA 19 58 77
Genesee & Wyoming Australia 7 17 51 75
Tarsal 52 52
QUBE Logistics 3 46 2 51
V/Line 41 41
SCT 34 34
IRA ( former LVRF) 22 22
RailCorp 22 22
GrainCorp 20 20
Fortescue Metals Group 19 19
BHP One Steel 13 13
Edie Rail 2 10 1 13
El Zorro 5 5 10
Xstrata 10 10
Manildra Group 8 8
Patricks 8 8
Centennial Coal 7 7
Junee Railway Workshops 7 7
AWB 4 4
CRT 4 4
Southern Short haul Railroad 24 4
Australian Loco Lease 1 2 3
Whitehaven Coal 3 3
Comalco 2 2
BlueScope, Port Kembla 1 1
ComSteel 1 1
Rail Power 1 1
RTS 1 1
Total (a) 59 118 785 1197 22 2181
(a) Table may include locomotives on order and locomotives that are stored and is an estimate of the current operational fleet. Due to the limitations of public domain information this estimate could be considered accurate to within +/-5%
(b) These locomotives are fitted with gauge convertible bogies suitable, by changing wheel sets and brake rigging, or by changing bogies, for use on Broad (1590mm) and Standard (1435mm) Gauge.
(c) These locomotives are fitted with gauge convertible bogies suitable, by changing wheel sets and brake rigging, or by changing bogies, for use on Standard (1435mm) and Narrow (1067mm) Gauge. Queensland, central SA, WA and Tasmania have narrow gauge networks. Victoria and eastern SA have broad gauge networks. All states have standard gauge as part of their networks except Tasmania.

Page 34
Table 14 shows the number of locomotives for each freight operator by type. By far the dominant type is the Diesel electric transmission which is very versatile in terms of range and duty type. Diesel electric transmissions use a diesel engine to produce mechanical energy which is then converted to electrical energy by a traction alternator or generator. Traction motors on each axle convert the electrical energy to mechanical energy that drives the locomotive wheels. This transmission type is typically between 80% and 85% efficient. Locomotives so fitted can reconfigure their traction motors as generators and dissipate the electrical energy produced as heat to slow the train. This is termed dynamic braking.
Table 14. Australian Rail Freight Operator Locomotive Types
Operator Diesel Electric Diesel
Hydraulic Electric
Locomotive Total
QR National 543 7 244 794
Pacific National 558 23 581
BHP Billiton 139 139
Pilbara Rail 134 134
CFCLA 77 77
Genesee & Wyoming Australia 75 75
Tarsal 52 52
QUBE Logistics 51 51
V/Line 41 41
SCT 32 2 34
Southern Short haul Railroad 24 4
IRA ( former LVRF) 22 22
RailCorp 21 1 22
GrainCorp 20 20
Fortescue Metals Group 19 19
BHP One Steel 13 13
Edie Rail 12 1 13
El Zorro 10 10
Xstrata 10 10
Manildra Group 2 6 8
Patricks 6 2 8
Centennial Coal 7 7
Junee Railway Workshops 5 2 7
AWB 4 4
CRT 0 4 4
Australian Loco Lease 3 3
Whitehaven Coal 3 3
Comalco 2 2
BlueScope, Port Kembla 1 1
ComSteel 1 1
Rail Power 1 1
RTS 1 1
Total (a) 1889 25 267 2181
(a) Table 14 provides an estimate of the current locomotive fleet by type. It differs in total to that of Table 13, mainly due to the limitations of detailed public domain information. However this breakdown is still within an accuracy of +/-5%.
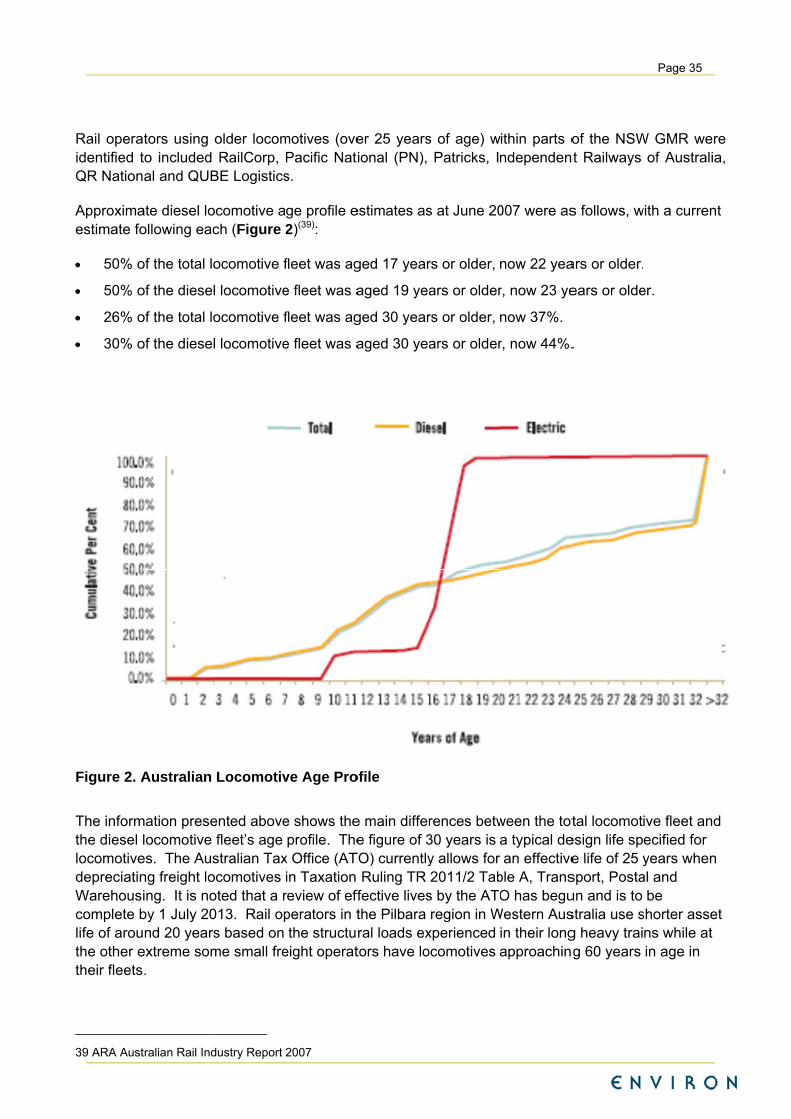
Rail operaidentified tQR Nation
Approximaestimate fo
50% o
50% o
26% o
30% o
Figure 2. A
The informthe diesel llocomotivedepreciatinWarehouscomplete blife of arouthe other etheir fleets
39 ARA Aust
ators using to included al and QUB
ate diesel loollowing eac
of the total lo
of the diesel
of the total lo
of the diesel
Australian
mation preselocomotive
es. The Ausng freight loing. It is noby 1 July 20nd 20 years
extreme som.
tralian Rail Ind
older locomRailCorp,
BE Logistics
ocomotive ach (Figure 2
ocomotive f
l locomotive
ocomotive f
l locomotive
Locomotiv
ented abovefleet’s age stralian Tax
ocomotives oted that a r013. Rail ops based on me small fre
dustry Report 2
motives (ovePacific Natis.
ge profile e2)(39):
fleet was ag
e fleet was a
fleet was ag
e fleet was a
ve Age Pro
e shows theprofile. The
x Office (ATin Taxation review of effperators in tthe structu
eight operat
2007
er 25 yearsional (PN),
estimates as
ged 17 year
aged 19 yea
ged 30 year
aged 30 yea
ofile
e main differe figure of 3
TO) currentlyRuling TR
ffective livesthe Pilbara ral loads extors have lo
s of age) wPatricks, I
s at June 20
rs or older,
ars or older
rs or older,
ars or older
rences betw30 years is y allows for 2011/2 Tab
s by the ATOregion in W
xperienced ocomotives a
ithin parts ondependen
007 were as
now 22 yea
r, now 23 ye
now 37%.
r, now 44%.
ween the tota typical dean effective
ble A, TransO has begu
Western Ausin their longapproachin
of the NSWnt Railways
s follows, w
ars or older.
ears or olde
.
tal locomotesign life spe life of 25 ysport, Postaun and is to stralia use sg heavy traig 60 years
Page 35
W GMR werof Australia
with a curren
er.
ive fleet andecified for years when
al and be
shorter assens while at in age in
re a,
nt
d
n
et
Page 36
The age and duty cycle of certain locomotives operating in urban areas, including cross city services and port access, is of interest due to the potential for exposures to emissions from such locomotives. Duty cycle refers to the daily locomotive utilisation profile, i.e. the time spent at each power notch level. Duty cycles vary significantly between main line, yard switching, regional lines and short lines, including intercity and commuter rail passenger services. Switch locomotives spend more time idling and at low power notch levels, whereas main line freight and passenger rail is characterised by reduced idle times with an increase in utilisation at high power notch levels.
Details of Australian Rail Operators and National Locomotive Fleets are presented at Appendix B. (40). Industry operators of specific interest to NSW, due to their having shuttle services within the GMR, include QR National, PN, QUBE Logistics, SCT Logistics and Independent Rail Australia.
3.2 Fuel Consumption by Locomotives
Fuel consumption was estimated for the 2012 locomotive fleet and projected for years 2022 and 2032 to inform the calculations for this study. The fuel burn of each locomotive type was assessed(41), using data provided by industry to update and verify the initial assessment of fuel consumption.
A description is provided in section 3.2.1. The diesel consumption figures used for the scenario years are documented.
3.2.1 Historical and Projected Future Diesel Consumption by Rail Transport
Diesel consumption by the rail transport industry over the past four decades is illustrated in Figure 3. National diesel consumption was of the order of 600,000 kL/year during the 1990s with about a third of the consumption being within NSW (200,000 kL/year). Diesel consumption increased markedly nationally over the past decade, primarily driven by the increase in bulk freight in Western Australia and Queensland. The increase was less marked in NSW, with consumption in NSW 23% of national use in 2009-10.
40 Information in this section and Appendix B of the report was developed with direct assistance of industry operators and
service providers and through public domain information such as company and industry association web sites. .
41 The calculation of fuel consumption by locomotive took into account operational utilisation, a duty cycle factor and the
fuel consumption rate at full throttle applicable to the specific engine used.

Page 37
Figure 3. Diesel Consumption by Rail Transport, 1973 to 2010 (ABARE, 2011)
The steep national increase in diesel consumption is projected by the Bureau of Infrastructure, Transport and Regional Economics (BITRE) to continue for the next four decades (Figure 4), with consumption predicted to exceed 1,400,000 kL/year by 2030.
Figure 4. Diesel Consumption by Rail Transport with Projections to 2050 (BITRE, 2010)
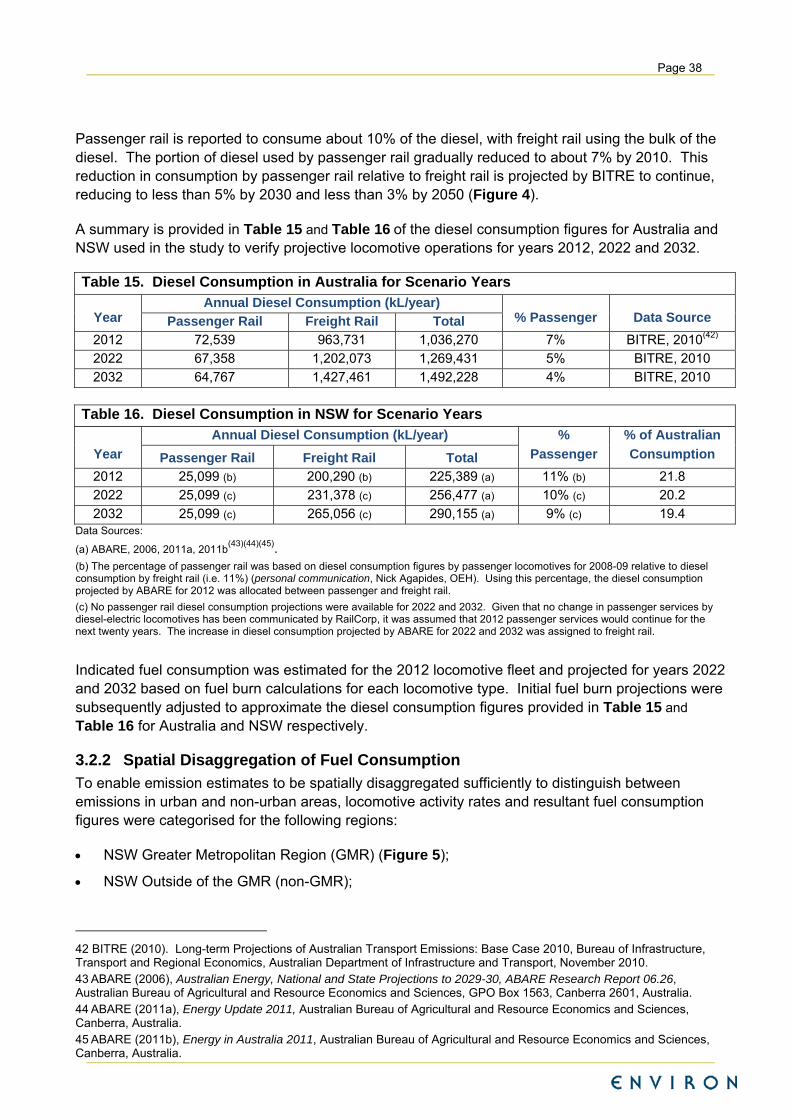
Page 38
Passenger rail is reported to consume about 10% of the diesel, with freight rail using the bulk of the diesel. The portion of diesel used by passenger rail gradually reduced to about 7% by 2010. This reduction in consumption by passenger rail relative to freight rail is projected by BITRE to continue, reducing to less than 5% by 2030 and less than 3% by 2050 (Figure 4).
A summary is provided in Table 15 and Table 16 of the diesel consumption figures for Australia and NSW used in the study to verify projective locomotive operations for years 2012, 2022 and 2032.
Table 15. Diesel Consumption in Australia for Scenario Years
Year Annual Diesel Consumption (kL/year)
% Passenger Data Source Passenger Rail Freight Rail Total 2012 72,539 963,731 1,036,270 7% BITRE, 2010(42)
2022 67,358 1,202,073 1,269,431 5% BITRE, 2010
2032 64,767 1,427,461 1,492,228 4% BITRE, 2010
Table 16. Diesel Consumption in NSW for Scenario Years
Year
Annual Diesel Consumption (kL/year) %
Passenger
% of Australian
Consumption Passenger Rail Freight Rail Total 2012 25,099 (b) 200,290 (b) 225,389 (a) 11% (b) 21.8
2022 25,099 (c) 231,378 (c) 256,477 (a) 10% (c) 20.2
2032 25,099 (c) 265,056 (c) 290,155 (a) 9% (c) 19.4 Data Sources:
(a) ABARE, 2006, 2011a, 2011b(43)(44)(45).
(b) The percentage of passenger rail was based on diesel consumption figures by passenger locomotives for 2008-09 relative to diesel consumption by freight rail (i.e. 11%) (personal communication, Nick Agapides, OEH). Using this percentage, the diesel consumption projected by ABARE for 2012 was allocated between passenger and freight rail.
(c) No passenger rail diesel consumption projections were available for 2022 and 2032. Given that no change in passenger services by diesel-electric locomotives has been communicated by RailCorp, it was assumed that 2012 passenger services would continue for the next twenty years. The increase in diesel consumption projected by ABARE for 2022 and 2032 was assigned to freight rail.
Indicated fuel consumption was estimated for the 2012 locomotive fleet and projected for years 2022 and 2032 based on fuel burn calculations for each locomotive type. Initial fuel burn projections were subsequently adjusted to approximate the diesel consumption figures provided in Table 15 and
Table 16 for Australia and NSW respectively.
3.2.2 Spatial Disaggregation of Fuel Consumption
To enable emission estimates to be spatially disaggregated sufficiently to distinguish between emissions in urban and non-urban areas, locomotive activity rates and resultant fuel consumption figures were categorised for the following regions:
NSW Greater Metropolitan Region (GMR) (Figure 5);
NSW Outside of the GMR (non-GMR);
42 BITRE (2010). Long-term Projections of Australian Transport Emissions: Base Case 2010, Bureau of Infrastructure, Transport and Regional Economics, Australian Department of Infrastructure and Transport, November 2010. 43 ABARE (2006), Australian Energy, National and State Projections to 2029-30, ABARE Research Report 06.26, Australian Bureau of Agricultural and Resource Economics and Sciences, GPO Box 1563, Canberra 2601, Australia. 44 ABARE (2011a), Energy Update 2011, Australian Bureau of Agricultural and Resource Economics and Sciences, Canberra, Australia. 45 ABARE (2011b), Energy in Australia 2011, Australian Bureau of Agricultural and Resource Economics and Sciences, Canberra, Australia.

Page 39
Other States (outside of NSW) Urban which assumes a GMR with similar margin around capital cities to that in NSW;
Other States (outside of NSW) non-Urban; and
Other States (outside of NSW) East-West which refers to operation on the TransAustralia line from Adelaide to Perth.
NSW GMR emissions were further spatially disaggregated to distinguish between:
Urban areas, comprising Newcastle, Sydney and Wollongong Regions (Figure 5); and
Non-urban areas.
Within NSW, urban areas were defined primarily as the geographical areas coinciding with the Newcastle, Sydney and Wollongong Regions depicted in Figure 5. Interstate urban areas were taken to be built up areas in and surrounding cities, where the population density approaches or exceeds 1,000 people/km2. Non-urban areas were taken to comprise the remaining areas.
In allocating the portion of diesel consumption within NSW, reference was made to gross tonnes-kilometre (GTK) data obtained from the Australian Rail Track Corporation Ltd (ARTC) for 2011 (personal communication, Chris Hockley, ARTC, May 2012). According to this data, 65% of the GTK occurs within the NSW GMR. Coal-related rail activities were reported to account for 67% of the GTK within the GMR, and for 48% of the GTK across the state.
Within the NSW GMR, approximately 17% of coal-related rail activities and about 39% of other rail activities occur in urban areas, based on spatially resolved GTK data received from the ARTC (personal communication, Chris Hockley, ARTC, May 2012). Together, approximately 24% of rail activities within the GMR occur within urban areas. On a state-wide basis, an estimated 15.5% of the annual GTK within NSW occurs within urban areas.

Page 40
Figure 5. Definition of the NSW GMR comprising Sydney, Newcastle and Wollongong
Regions (DEC, 2007)
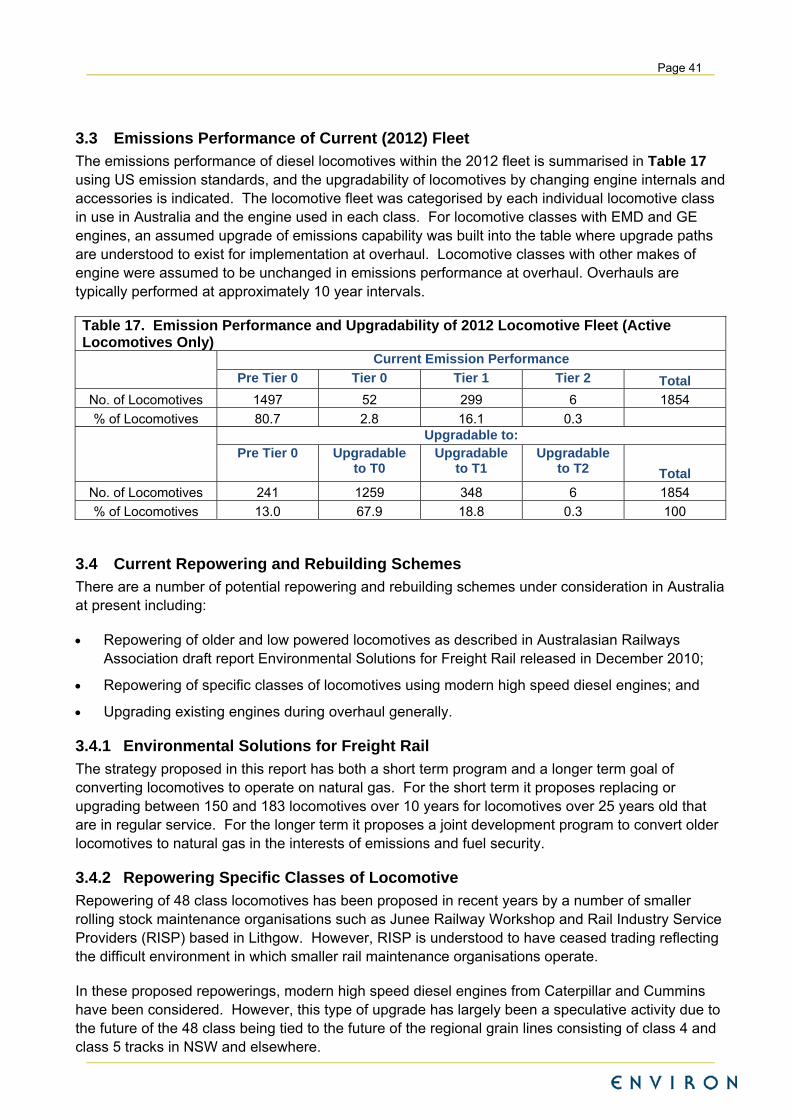
Page 41
3.3 Emissions Performance of Current (2012) Fleet
The emissions performance of diesel locomotives within the 2012 fleet is summarised in Table 17 using US emission standards, and the upgradability of locomotives by changing engine internals and accessories is indicated. The locomotive fleet was categorised by each individual locomotive class in use in Australia and the engine used in each class. For locomotive classes with EMD and GE engines, an assumed upgrade of emissions capability was built into the table where upgrade paths are understood to exist for implementation at overhaul. Locomotive classes with other makes of engine were assumed to be unchanged in emissions performance at overhaul. Overhauls are typically performed at approximately 10 year intervals.
Table 17. Emission Performance and Upgradability of 2012 Locomotive Fleet (Active Locomotives Only)
Current Emission Performance
Pre Tier 0 Tier 0 Tier 1 Tier 2 Total
No. of Locomotives 1497 52 299 6 1854
% of Locomotives 80.7 2.8 16.1 0.3
Upgradable to: Pre Tier 0 Upgradable
to T0 Upgradable
to T1 Upgradable
to T2 Total
No. of Locomotives 241 1259 348 6 1854
% of Locomotives 13.0 67.9 18.8 0.3 100
3.4 Current Repowering and Rebuilding Schemes
There are a number of potential repowering and rebuilding schemes under consideration in Australia at present including:
Repowering of older and low powered locomotives as described in Australasian Railways Association draft report Environmental Solutions for Freight Rail released in December 2010;
Repowering of specific classes of locomotives using modern high speed diesel engines; and
Upgrading existing engines during overhaul generally.
3.4.1 Environmental Solutions for Freight Rail
The strategy proposed in this report has both a short term program and a longer term goal of converting locomotives to operate on natural gas. For the short term it proposes replacing or upgrading between 150 and 183 locomotives over 10 years for locomotives over 25 years old that are in regular service. For the longer term it proposes a joint development program to convert older locomotives to natural gas in the interests of emissions and fuel security.
3.4.2 Repowering Specific Classes of Locomotive
Repowering of 48 class locomotives has been proposed in recent years by a number of smaller rolling stock maintenance organisations such as Junee Railway Workshop and Rail Industry Service Providers (RISP) based in Lithgow. However, RISP is understood to have ceased trading reflecting the difficult environment in which smaller rail maintenance organisations operate.
In these proposed repowerings, modern high speed diesel engines from Caterpillar and Cummins have been considered. However, this type of upgrade has largely been a speculative activity due to the future of the 48 class being tied to the future of the regional grain lines consisting of class 4 and class 5 tracks in NSW and elsewhere.

Page 42
3.4.3 Upgrading Existing Engines
There are two examples of locomotive upgrading of existing engines that provide a view of what can be done under certain favourable circumstances, namely the:
QR National Maxi Overhaul Program – EMD 645E to 645E3C engine conversion; and
Freight Australia Engine Cascading EMD 645E to 645E3C to 635F3B engine conversions.
Both these projects originated in the late 1990s before emissions performance was a major consideration.
The potential business drivers for these upgrades are:
Modifications that increase fuel efficiency due to engine physical changes;
Modifications that include electronic engine control of fuel injection as this allows injection timing to be optimised for every operating point rather than being limited to optimisation at full output, which is the case for the mechanical electro-hydraulic governing systems used on all locomotives prior to the mid-1990s; and
Modifications that increase the adhesive performance of the traction system so that the upgraded locomotive can haul a heavier train.
3.4.3.1 QR National Maxi Overhaul Program
The maxi overhaul program was an upgrade and overhaul for sixty 12 cylinder Clyde/EMD locomotives. A range of modifications were applied to the donor locomotives, the most notable being the fitting of a turbocharger (in place of the two Rootes Blowers) to the 645E engine block and upgrading engine accessories, such as a larger oil cooler and increased cooling system capacity. The resultant engine configuration is 12-645E3C which was the most fuel efficient form of the 12 cylinder EMD 645 engine, but does date from the mid 1980s and hence has Pre Tier 0 emissions performance. A further upgrade path exists to Tier 0.
These changes resulted in an extra 50% in the power rating and the fitting of a new traction control system. It was deemed necessary to renumber the locomotives due to the major changes made, in the end settling on the 2300 number block. The first prototype emerged 2301 in late 1997. A second prototype, 2320, was built and entered service in early 1998. All sixty locomotives have been in service throughout regional Queensland since the early 2000s.
3.4.3.2 Freight Australia Engine Cascading
Freight Australia was once the freight arm of Victorian Railways and was bought in 1999 by Rail America. It subsequently became part of PN in the mid-2000s. Prior to this, Freight Australia wanted to increase the capability of its locomotive fleet and so embarked upon an engine cascading scheme along the following lines:
Refurbished second hand EMD 16 cylinder 645F3B engines were purchased and fitted to their G class locomotives increasing power from 3300 to 3800 brake horsepower.
The 16-645E3B engines removed from the G class were fitted to their X class locomotives increasing power from 2200 to 3300 brake horsepower. Four X class locomotives were converted.
A further 9 new locomotives were built subsequently.
Page 43
The upgrade has significantly lifted power ratings which is generally advantageous, particularly for intermodal service. It has also lifted fuel efficiency, but not emissions performance which dates from the mid 1980s and is Pre Tier 0. An upgrade path exists to Tier 0.
3.5 Locomotive Categorisation Matrix and Emissions Performance Projections
Fuel consumption figures were categorised by power rating category, region and emission performance. This categorisation matrix developed for use in the study was developed for two main scenarios, namely ‘Business as Usual’ (BaU) and ‘Maximum Upgrade Possible for Existing Fleet’ (by changing engine internals and accessories).
The projected change in emission performance over the next 20 years has been examined from several perspectives:
The locomotive turnover rate and ‘business as usual’ assumptions for 10 and 20 years hence with engine overhauls ‘in-kind’.
In addition to 1, all new locomotives to have at least Tier 1 performance if capable of Tier 2.
In addition to 1, upgrade of the existing engines of all locomotives to the maximum extent possible as they pass through their usual engine overhaul cycle.
The methodology of the examination has been to categorise each class of locomotive operating in Australia for its current emissions Tier performance and for its potential performance. At present in Australia there is no regulatory requirement to reach a particular emissions performance, so manufacturers are likely to offer the engine software used in North America but modified to reduce fuel consumption and hence operating costs. By way of historical context, major equipment design changes were being made by US locomotive manufacturers in the 1980s to achieve improvements in fuel consumption of 0.25%, such was the focus of the US railroads on fuel consumption.
Assumptions have also been made in relation to the manner in which the Australian locomotive fleet is likely to expand and evolve. Half of the locomotives currently in service could be expected to retire prior to 2032 as most of them will have passed 60 years of age by then. However, for rural and bulk service there is not expected to be a viable business case to replace them. Intermodal service is similarly placed where current locomotive configurations can be expected to retained due to the apparent lack of a viable business case for upgrading.
Whether the lighter axle load fleets in intrastate and rural service are replaced will largely depend on the future viability of the class 4 and 5 grain lines. It will also depend on the level of traffic on class 3 lines as well.
The categorisation matrix assumes that the locomotive fleet will expand between 2012 and 2022 and also between 2022 and 2032 based on growth projections from ARTC for the Hunter Valley and forecast mining company expansions in Queensland and Western Australia. The categorisation matrix also assumes that none of the existing fleet will be retired due to uncertainty about their future role.
3.5.1 Business as Usual (BaU)
Business as usual provides for a situation where:
New locomotives are predominantly bought for minerals traffic;
Locomotives bought from Downer EDI Rail for standard and narrow gauge are understood to operate at Tier 1 but are capable of Tier 2 with Tier 2 engine management software loaded;

Page 44
Locomotives bought from United Group for the standard gauge networks of former government railways are categorised as Pre Tier 0 with Tier 0 being understood to be the limit of the GE 7FDL engine used;
Locomotives bought from United Group for the Pilbara and the forthcoming narrow gauge demonstration locomotive are categorised as Tier 1 with the capability of operating at Tier 2 with Tier 2 software loaded;
Locomotives from Chinese suppliers are expected to be Tier 2 capable;
As new locomotives are acquired, older locomotives are used in intermodal or intrastate services while old locomotives are not retired due to the lack of a viable business case to replace them; and
The rail operators in the Pilbara operate their locomotives for shorter lives with 20 to 30 years being common.
3.5.2 New Locomotives are Tier 2
This category is not straightforward in that it is a variation on business as usual but can only realistically provide for the best that the current ‘state of the art’ locomotive models can achieve. The anomaly is the use of the GE 7FDL engine in one of the two locomotive models competing for the market for high power locomotives on the interstate and former government rail networks.
The EMD engine is capable of Tier 2 performance while the 7FDL engine is understood to be only capable of Tier 0 performance. Accordingly this categorisation has assumed Tier 1 for all locomotives with GE and EMD, engines except for those with the 7FDL engine which are categorised as Tier 0.
Notwithstanding the above there are new locomotive specifications being prepared that call for Tier 2 or Euro IIIA performance as a minimum requirement but this is on a best endeavours basis and can be expected to be sacrificed to minimise fuel consumption (refer to Draft Exterior Environment Standards, Section 2.2.1).
3.5.3 Upgrade of Existing Engines
This categorisation view assumes that a policy objective is in force requiring locomotives with older engine configurations to be upgraded to the best Tier they can achieve, if there is one, at their next overhaul. Alco and English Electric engines are assumed to be unchanged. GE and EMD engines are assumed to be upgraded. This view is a form of sensitivity analysis as a contrast to the business as usual case. There has been industry feedback to the effect that this case would not be embraced due to the cost of buying new power assemblies and other engine components of higher emissions performance compared to overhaul of the existing power assembly and equipment configurations.
3.6 Fuel Consumption by Region and Emission Performance Tier
Fuel consumption by region and emissions performance (Tier) is given for the Business as Usual scenario in Table 18 and for the Maximum Upgrade Possible for Existing Fleet scenario in Table 19.
3.6.1 Business as Usual Scenario
As per the GTK data provided by the ARTC, an estimated 65% of the fuel consumption within NSW occurs within the GMR. Approximately 24% of the rail activity within the NSW GMR occurs within urban areas, with 15.5% of the total rail activity within NSW occurring within urban areas.

Page 45
Australia-wide about 50% of passenger rail fuel consumption and about 10% of freight rail fuel consumption were projected to occur within urban areas. The low overall percentage of rail-related fuel combustion within urban areas (12%) is due to fuel consumption by iron ore and coal rail from remote mining areas to port, long transits through remote areas along the east-west TransAustralia line (Adelaide to Perth) and the use of diesel-electric locomotives for inter-city and inter-state commuter services.
In 2012 fuel combustion by Pre Tier 0 locomotives in NSW is estimated to account for 95% of the total fuel combustion, with the remaining 5% being consumed by locomotives with Tier 1 equivalent emission performances. Nationally, the portion of fuel combustion by Pre Tier 0, Tier 0, Tier 1 and Tier 2 locomotives accounts for 77.7%, 2.6%, 19.4% and 0.2% of fuel combustion,
Given business as usual, the portion of fuel combustion nationally by Tier 1 locomotives is projected to increase from 19.4% in 2012 to 43% in 2032, primarily due to increases in the number of cleaner locomotives within the iron ore and coal haul sectors (Table 20).
NSW is also projected to experience an increase in the proportion of fuel combusted by Tier 1 locomotives, with more modest increases projected (increases from 5% in 2012 to 16% in 2032) (Table 20). As in other states, this increase is due to projected growth in fuel consumption for coal rail activities, with newer locomotives used for coal more likely to be Tier 1 compliant.

Page 46
Table 18. Fuel Consumption Projects by Region, Service and Emissions Performance (Business as Usual)
Year Service Emissions
Performance
Australia – Diesel Consumption (kL/year) by Region NSW – Diesel Consumption (kL/year) by Region
Urban Non-Urban East-West
TransAustralia Line
Total NSW GMR (a) NSW Non-
GMR Total NSW
2012 Freight Pre Tier 0 68,762 378,851 88,175 732,765 112,407 75,843 188,250 Tier 0 3,466 23,461 - 26,927 - - - Tier 1 14,504 164,792 9,651 201,546 10,736 1,305 12,041 Tier 2 255 766 1,531 2,552 - - - Total 86,986 567,869 99,358 963,791 123,143 77,148 200,291
Passenger Pre Tier 0 35,519 11,717 971 72,573 18,970 6,129 25,099 Total Pre Tier 0 104,281 390,567 89,146 805,339 131,377 81,972 213,349
Tier 0 3,466 23,461 - 26,927 - - - Tier 1 14,504 164,792 9,651 201,546 10,736 1,305 12,041 Tier 2 255 766 1,531 2,552 - - - Total 122,505 579,586 100,329 1,036,364 142,113 83,277 225,390
2022 Freight Pre Tier 0 68,189 372,482 90,946 740,631 118,448 82,998 201,446 Tier 0 3,286 21,855 - 25,141 - - - Tier 1 57,800 335,257 9,635 433,750 14,371 15,562 29,933 Tier 2 255 764 1,529 2,548 - - - Total 129,529 730,358 102,110 1,202,070 132,819 98,560 231,379
Passenger Pre Tier 0 31,562 10,665 1,046 67,358 19,101 5,997 25,099 Total Pre Tier 0 99,751 383,147 91,992 807,989 137,549 88,996 226,545
Tier 0 3,286 21,855 - 25,141 - - - Tier 1 57,800 335,257 9,635 433,750 14,371 15,562 29,933 Tier 2 255 764 1,529 2,548 - - - Total 161,091 741,023 103,156 1,269,427 151,920 104,558 256,478
2032 Freight Pre Tier 0 68,130 372,164 90,869 756,880 123,582 94,978 218,560 Tier 0 3,283 21,836 - 25,119 - - - Tier 1 96,261 489,012 9,627 642,917 17,715 28,779 46,495 Tier 2 255 764 1,527 2,546 - - - Total 167,929 883,776 102,023 1,427,462 141,298 123,757 265,055
Passenger Pre Tier 0 29,568 10,156 1,042 64,767 19,101 5,997 25,099 Total Pre Tier 0 97,699 382,320 91,911 821,647 142,684 100,975 243,659
Tier 0 3,283 21,836 - 25,119 - - - Tier 1 96,261 489,012 9,627 642,917 17,715 28,779 46,495 Tier 2 255 764 1,527 2,546 - - - Total 197,497 893,933 103,065 1,492,229 160,399 129,755 290,154
(a) Within the NSW GMR, approximately 17% of coal-related rail activities and 39% of other rail activities occur in urban areas, based on spatially resolved GTK data received from the ARTC (personal communication, ARTC, May 2012). Combined, about 24% of rail activities within the GMR occur in urban areas.

Page 47
Table 19. Fuel Consumption Projects by Region, Service and Emissions Performance (Maximum Upgrade of Existing Locomotives)
Year Service Emissions
Performance
Australia – Diesel Consumption (kL/year) by Region NSW – Diesel Consumption (kL/year) by Region
Urban Non-Urban East-West
TransAustralia Line Total NSW GMR NSW Non-GMR Total NSW
2012 Freight Pre Tier 0 1,214 5,984 1,099 22,086 3,425 9,752 13,177
Tier 0 63,119 360,007 87,076 693,392 108,982 66,091 175,073
Tier 1 22,397 201,113 9,651 245,761 10,736 1,305 12,041
Tier 2 255 766 1,531 2,552 - - -
Total 86,986 567,869 99,358 963,791 123,143 77,148 200,291 Passenger Pre Tier 0 313 639 - 20,511 16,719 3,429 20,148
Tier 0 35,206 10,828 811 51,531 2,235 2,591 4,825
Tier 1 - 250 159 531 16 109 126
Total 35,519 11,717 971 72,573 18,970 6,129 25,099 Total Pre Tier 0 1,527 6,623 1,099 42,597 20,144 13,181 33,325
Tier 0 98,326 370,835 87,887 744,923 111,217 68,682 179,898
Tier 1 22,397 201,363 9,811 246,292 10,752 1,414 12,167
Tier 2 35,774 12,482 2,502 75,125 18,970 6,129 25,099
Total 158,024 591,303 101,299 1,108,937 161,083 89,406 250,489 2022 Freight Pre Tier 0 1,212 5,974 1,318 20,945 3,216 8,774 11,990
Tier 0 62,434 352,574 89,629 701,210 115,232 74,224 189,456
Tier 1 65,628 371,046 9,635 477,367 14,371 15,562 29,933
Tier 2 255 764 1,529 2,548 - - -
Total 129,529 730,358 102,110 1,202,070 132,819 98,560 231,379 Passenger Pre Tier 0 311 636 - 20,399 16,838 3,433 20,270
Tier 0 31,251 9,822 914 46,518 2,250 2,473 4,723
Tier 1 - 207 132 441 14 92 106
Total 31,562 10,665 1,046 67,358 19,101 5,997 25,099 Total Pre Tier 0 1,524 6,610 1,318 41,344 20,054 12,207 32,261
Tier 0 93,685 362,396 90,542 747,728 117,482 76,697 194,179
Tier 1 65,628 371,253 9,768 477,807 14,385 15,654 30,038
Tier 2 31,817 11,429 2,575 69,906 19,101 5,997 25,099
Total 192,653 751,688 104,202 1,336,785 171,022 110,555 281,577

Page 48
Table 19. Fuel Consumption Projects by Region, Service and Emissions Performance (Maximum Upgrade of Existing Locomotives)
Year Service Emissions
Performance
Australia – Diesel Consumption (kL/year) by Region NSW – Diesel Consumption (kL/year) by Region
Urban Non-Urban East-West
TransAustralia Line Total NSW GMR NSW Non-GMR Total NSW
2032 Freight Pre Tier 0 1,211 5,969 1,317 20,927 3,228 8,808 12,036
Tier 0 62,381 352,273 89,552 717,492 120,354 86,170 206,524
Tier 1 104,082 524,770 9,627 686,497 17,715 28,779 46,495
Tier 2 255 764 1,527 2,546 - - -
Total 167,929 883,776 102,023 1,427,462 141,298 123,757 265,055 Passenger Pre Tier 0 310 634 - 20,326 16,838 3,433 20,270
Tier 0 29,258 9,316 910 44,001 2,250 2,473 4,723
Tier 1 - 206 132 439 14 92 106
Total 29,568 10,156 1,042 64,767 19,101 5,997 25,099 Total Pre Tier 0 1,522 6,603 1,317 41,254 20,066 12,240 32,306
Tier 0 91,639 361,589 90,462 761,494 122,604 88,643 211,247
Tier 1 104,082 524,977 9,759 686,936 17,729 28,871 46,600
Tier 2 29,823 10,920 2,570 67,313 19,101 5,997 25,099
Total 227,066 904,089 104,108 1,556,996 179,501 135,752 315,253

Page 49
Table 20. Change in the Proportion of Fuel Combustion by Emissions Performance Tier
Year
Emission Performance
Tier
Australia – Percentage Fuel Combustion by Emission
Performance Tier
NSW – Percentage Fuel Combustion by Emission
Performance Tier Business as
Usual Maximum Upgrade
Business as Usual
Maximum Upgrade
2012 Pre Tier 0 77.7 3.8 94.7 13.3 Tier 0 2.6 67.2 - 71.8 Tier 1 19.4 22.2 5.3 4.9 Tier 2 0.2 6.8 - 10.0
2022 Pre Tier 0 63.6 3.1 88.3 11.5 Tier 0 2.0 55.9 - 69.0 Tier 1 34.2 35.7 11.7 10.7 Tier 2 0.2 5.2 - 8.9
2032 Pre Tier 0 55.1 2.6 84.0 10.2 Tier 0 1.7 48.9 - 67.0 Tier 1 43.1 44.1 16.0 14.8 Tier 2 0.2 4.3 8.0
3.6.2 Maximum Upgrade Possible for Existing Fleet Scenario
In the event that locomotives upgrade to the extent possible by changing engine internals and accessories, fuel consumption by Pre Tier 0 locomotives is projected to be significantly reduced, with fuel consumption by Tier 0 locomotives predominating in NSW (Table 20). Outside NSW, Tier 0 and Tier 1 locomotives are projected to be jointly responsible for the bulk of the diesel combusted in other states given this scenario, with the portion of the fuel consumption by Tier 1 locomotives growing over time (Table 20).
3.7 Application of Business as Usual and Maximum Upgrade Possible for Existing Fleet Scenarios
The business as usual scenario is used as the base case for the current investigation for baseline air emission inventory purposes and assessing emission reductions achievable by implementing measures addressing existing and new locomotives. The ‘upgrade of existing engines’ scenario was developed for consideration as a potential emission reduction option.
3.8 Summary of Findings
The existing diesel-powered locomotive fleet comprises about 1850 active locomotives, the majority of which are diesel-electric. About 86% of these locomotives are main haul locomotives with the remainder being switch locomotives. Switch locomotives are used in rail yards but may also be used to power local and regional service trains.
Private sector companies are responsible for freight rail services. Bulk freight accounts for 84% of the total tonne-kilometre rail task, being comprised primarily of mineral and agricultural product rail services. Approximately 38% of the 2012 fleet were identified to be used for iron and coal freight, 30% for intermodal freight, 28% for rural freight (e.g. grain), and about 4% for passenger services.
The average age of diesel-electric locomotives in Australia is about 35 years and half the existing fleet is more than 26 years old. By comparison, the average age of the US fleet is 8 years.

Page 50
80.7% of the existing locomotive fleet in Australia do not meet any US emission standards. 2.7% meet Tier 0, 16.1% meet Tier 1 and 0.3% Tier 2 emission standards. The age, emissions performance and duty cycle of locomotives together with the population densities of where they operate (including urban cross city services and port access areas) are considered in emission mitigation measures examined later in the report.
There are a number of potential repowering and rebuilding schemes under consideration in Australia at present including:
Repowering of older and low powered locomotives as described in the ARA draft report Environmental Solutions for Freight Rail released in December 2010;
Repowering of specific classes of locomotives using modern high speed diesel engines; and
Upgrading existing engines during overhaul generally.
The main drivers for the upgrading of existing locomotives are primarily improvements in fuel efficiency and equipment performance.
National diesel consumption by the rail sector has grown significantly over the past decade, with equivalent levels of growth projected to continue for the next four decades. Passenger rail is reported to consume about 10% of the diesel used nationally by the rail sector, with freight rail using the bulk of the diesel. Consumption by passenger rail is also projected to reduce to less than 5% by 2030, with the national growth in diesel consumption being driven by freight rail and particularly increased rail for coal and iron ore transfer.
The increase in diesel consumption by the rail sector is less marked in NSW, with the percentage of diesel consumption in NSW dropping from over 30% of national consumption in the 1990s to 23% of national use by 2010. According to GTK data provided by the ARTC, an estimated 65% of the fuel consumption within NSW occurs within the GMR. About 24% of rail activity within the NSW GMR is estimated to take place within urban areas, and 15.5% of rail activity within NSW in general takes place within urban areas.
To inform the emission reduction projections in the current study, fuel consumption was estimated for the 2012 locomotive fleet and projected for years 2022 and 2032 based on fuel burn calculations for each locomotive type, with adjustments to reflect published diesel consumption figures. Fuel consumption figures were categorised by power rating category, geographical region and emission performance. This categorisation matrix was developed for two main scenarios, namely ‘Business as Usual’ (BaU) and ‘Maximum Upgrade Possible for Existing Fleet’ (by changing engine internals and accessories).

Page 51
4 Air Emissions from Locomotives
An inventory of locomotive air emissions has been compiled for NSW and Australia, including base case (2012) PM2.5, PM10 and NOx emissions and their projected growth given fleet projections over the next 20 years (2012-2032).
An overview of diesel exhaust emissions is given in Section 4.1, with the emission estimation methodology outlined in Section 4.2. Emission estimates projected based on business as usual assumptions are presented by region in Section 4.3 with the main purpose of distinguishing between emissions within urban and other areas for the purpose of exposure potential analysis within NSW. The contribution of estimated locomotive emissions relative to other anthropogenic sources of emissions is discussed.
4.1 Overview of Diesel Exhaust Emissions and Related Impacts
Diesel engine and equipment exhaust consists of hundreds of gas-phase, semi-volatile and particle-phase organic compounds that are produced through fossil fuel combustion. Emissions of primary and secondary particulate matter (PM) are of specific concern due to air quality criteria for fine PM being exceeded within several Australian metropolitan and rural areas. Oxides of nitrogen (NOx) and volatile organic compound (VOC) emissions released from engine/equipment exhausts are of interest individually and due to their being precursors of photochemical smog including ozone. Other emissions associated with non-road diesel engines and equipment include carbon dioxide (CO2), carbon monoxide (CO), carbonyl compounds (e.g. formaldehyde, acetaldehyde), polycyclic aromatic hydrocarbons (PAH), dioxins and furans, and a range of individual volatile and semi-volatile organic compounds including toxics such as benzene, toluene and 1,3-butadiene.
Fine particles with an aerodynamic diameter of under 10 micron (PM10) are small enough to be inhaled and remain within the respiratory system. Very fine particles of 2.5 microns or less (PM2.5) have been found to pose the greatest health risk as these particles are more readily deposited in, and damaging to, the lower airways and gas-exchanging portions of the lung. Adverse health effects related to fine particulate matter inhalation include exacerbation of existing pulmonary disease, oxidative stress and inflammation, changes in cardiac autonomic functions and reduced defence mechanisms and lung damage(46). Significant health costs are associated with inhalation exposures to fine particulate matter(47).
Diesel particulate matter (DPM) is considered to comprise a particularly significant health risk due to the particle size distribution and chemical composition of such particulates. DPM is dominated by fine and ultra-fine particles, the composition of which may include elemental carbon with adsorbed compounds such as organic compounds (including potentially carcinogenic organic compounds such as PAHs), sulphate, nitrate, metals and other trace elements. The International Agency for Research on Cancer has recently concluded that diesel engine exhaust is classifiable as being carcinogenic to humans (Group 1), based on sufficient evidence that exposure is associated with an increased risk for lung cancer(48). It was also noted to have a positive association (limited evidence) with increased risk of bladder cancer.
46 Pope III C.A. and Dockery D.W.C. (2006). Health Effects of Fine Particulate Air Pollution: Lines that Connect, Journal of Air & Waste Management Association, 56, 709-742. 47 BTRE (2005). Health Impacts of Transport Emissions in Australia: Economic Costs, Canberra, Bureau of Transport and Regional Economics. 48 IARC (2012). IARC WHO Press Release No. 213, IARC: Diesel Engine Exhaust Carcinogenic, 12 June 2012, World Health Organisation, International Agency for Research on Cancer, Lyon, France.

Page 52
NOx emissions from non-road diesel engines contribute to photochemical smog and notably ozone. Ozone exposures can induce serious respiratory tract responses including lung function reductions, aggravation of pre-existing respiratory disease (such as asthma), increases in daily hospital admissions, emergency department visits for respiratory causes, and excess mortality(49).
Environmental impacts associated with particulate and ozone concentrations include visibility reduction, impacts on crop productivity and ecosystem integrity, and damage to buildings and property (e.g. soiling of surfaces; deterioration of rubber, fabric, masonry and paint).
4.2 Air Emission Estimation Methodology
Air emissions from Australian diesel locomotives were quantified for the base case year (2012) and for two subsequent years (2022 and 2032) using the detailed locomotive fleet and fuel combustion data set established during this study for these years through reference to industry and ABARE data (refer to Section 3).
US emission factors were applied to calculate emissions based on fuel combustion as the emission performance of locomotives in the Australian fleet have been classified based on US emission standards. Emission factors, expressed in g/kW-hr (grams of pollutant emissions per kilowatt-hour), were converted to g/litre (grams of pollutant per litre of fuel combusted) using the conversion factors given by the US-EPA for large line-haul, passenger, small line-haul and switching locomotives(50).
Since PM10 emissions are, amongst other things, dependent on the sulfur content of the fuel, an adjustment was made to the baseline PM10 emission factors through the application of the following equation(51):
EFPM10 = EFPM10PAS – (ρADO /3.7862) x 1000 x 7 x 0.02247 x 0.01 x (0.33 – 0.001)
where: EFPM10 = Adjusted PM10 emission factor for large line-haul and passenger
locomotives at 0.001% (10 ppm) sulfur content of ADO (kg/kL)
EFPM10BAS = Baseline PM10 emission factor for large line-haul and passenger locomotives at 0.33% (3300 ppm) default certification sulfur content of fuel (USEPA, 2009b) - 1.7579
(kg/kL)
ρADO = Density of ADO (Table A-6; USEPA,2008) – 3.2 (kg/US gal)7 = PM10 sulfate/PM10 sulfur (kg/kg)0.02247 = Fractional sulfur in fuel converted to PM10 sulfate (-)0.01 = Conversion factor from percent to fraction (-)0.33 = Default certification sulfur content of fuel (USEPA, 2009a) – 3300 ppm (%)0.001 = Sulfur content of ADO (Attorney-General's Department, 2009) – 10 ppm (%)3.7862 = Conversion factor (L/US gal)1000 = Conversion factor (L/kL)
The resultant emission factors applied in the study are provided in Table 21.
49 WHO (2003). Health Aspects of Air Pollution with Particulate matter, Ozone and Nitrogen Dioxide, Report on a World Health Organisation Working Group, Bonn, Germany, 13-15 January 2003. 50 US-EPA (2009). Emission Factors for Locomotives, EPA-420-F-09-025, April 2009. 51 US-EPA (2009). NONROAD2008a Model, Transportation and Air Quality, United States Environmental Protection Agency, Office of Transportation and Air Quality, 1200 Pennsylvania Avenue, NW Washington, DC 20460, USA.

Page 53
Table 21. Emission Factors Applied (grams of pollutant per litre of diesel
combusted)
PM10 Emission Factors (g/litre)
Tier Classification Large Line-Haul and
Passenger Small Line Haul Switching Uncontrolled 1.321 1.101 1.329Tier 0 1.321 1.101 1.329Tier 1 1.321 1.101 1.289Tier 2 0.552 0.428 0.326Tier 3 0.440 0.385 0.321Tier 4 0.082 0.072 0.060
NOx Emission Factors (g/litre)
Tier Classification Large Line-Haul and
Passenger Small Line Haul Switching Uncontrolled 71.4 62.5 69.9Tier 0 47.3 41.3 50.6Tier 1 36.8 32.2 39.8Tier 2 27.2 23.8 29.3Tier 3 27.2 23.8 18.1Tier 4 5.5 4.8 4.0
PM2.5 emissions were taken to comprise 97% of PM10 emissions based on the speciation given by the US-EPA for diesel locomotives(52).
4.3 Air Emission Projections Given Business as Usual
Emissions were projected for base case and future years based on business as usual assumptions, as documented in Section 3.
4.3.1 National Emissions
Annual PM10, PM2.5 and NOx emissions calculated based on Australia-wide locomotive activity are presented in Table 22 by year. An increase in emissions is estimated to occur over the next 20 years, reflecting the projected growth in fuel consumption by the rail sector over this period (refer to Section 3). About 27% of emissions were projected to occur within urban areas during 2012, with the proportion of urban emissions (as a percentage of total emissions) expected to decrease due to the growth of rail transport by the resources sector.
Estimated locomotive emissions for the 2012 base case are compared to national emission estimates for all sources, as taken from the National Pollutant Inventory (NPI) for the 2010/2011 year (Table 23). Locomotive emissions were estimated to comprise 0.1%, 4.2% and 4.7% of national PM10, NOx and PM2.5 emissions respectively. Given that national PM10 emissions include contributions from mechanically generated sources which have higher proportions of particles in the coarse fraction (i.e. 2.5 to 10 micrometres) compared to combustion sources, locomotives contribute more significantly to PM2.5 than to PM10 emissions.
52 US-EPA (2009). Emission Factors for Locomotives, EPA-420-F-09-025, April 2009.

Page 54
Table 22. Annual Locomotive Emissions given Business as Usual for Australia
PM10 Emissions (kg/year)
Year Urban Non-Urban Total % Urban
2012 218,936 1,124,875 1,343,810 16
2022 281,626 1,370,444 1,652,070 17
2032 332,111 1,614,209 1,946,320 17
PM2.5 Emissions (kg/year)
Year Urban Non-Urban Total % Urban
2012 212,367 1,091,128 1,303,496 16
2022 273,177 1,329,331 1,602,508 17
2032 322,147 1,565,783 1,887,930 17
NOx Emissions (kg/year)
Year Urban Non-Urban Total % Urban
2012 11,289,327 54,041,394 65,330,721 17
2022 13,111,124 60,926,873 74,037,997 18
2032 14,486,192 68,244,208 82,730,400 18
Table 23. Contribution of Projected Locomotive Emissions to Total Emissions
Derived from the National Pollutant Inventory
Pollutant
Annual Emission Estimates (tonnes/year) Locomotive Emissions
as a Percentage of
National Emissions Locomotive
Emissions (2012) National Emissions
(2010/2011) (a)
PM10 1,344 1,271,706 0.1
PM2.5 1,303 30,694 4.2
NOx 65,331 1,402,128 4.7 (a) Emissions taken from National Pollutant Inventory Database for 2010/2011. In interpreting and using the NPI
figures, reference should be made to NPI records which document the emission estimation methodologies applied and the uncertainties and limitations of methods and data inputs
4.3.2 NSW Emissions
Annual PM10, PM2.5 and NOx emissions calculated based on NSW locomotive activity are presented in Table 24 by year. An increase in emissions is estimated to occur over the next 20 years, reflecting the projected growth in fuel consumption by the rail sector over this period (refer to Section 3). About 60% of emissions were projected to occur within the GMR, reflecting the portion of GTK reported by ARTC for the GMR (i.e. 65% for 2011).
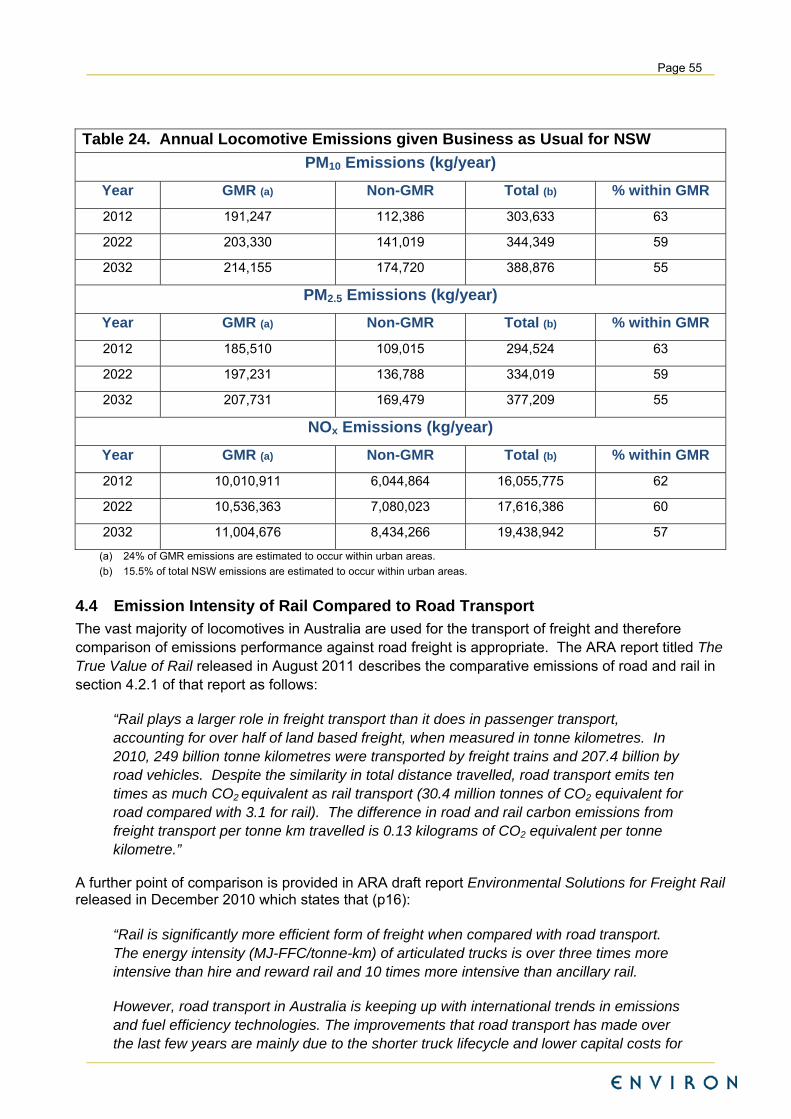
Page 55
Table 24. Annual Locomotive Emissions given Business as Usual for NSW
PM10 Emissions (kg/year)
Year GMR (a) Non-GMR Total (b) % within GMR
2012 191,247 112,386 303,633 63
2022 203,330 141,019 344,349 59
2032 214,155 174,720 388,876 55
PM2.5 Emissions (kg/year)
Year GMR (a) Non-GMR Total (b) % within GMR
2012 185,510 109,015 294,524 63
2022 197,231 136,788 334,019 59
2032 207,731 169,479 377,209 55
NOx Emissions (kg/year)
Year GMR (a) Non-GMR Total (b) % within GMR
2012 10,010,911 6,044,864 16,055,775 62
2022 10,536,363 7,080,023 17,616,386 60
2032 11,004,676 8,434,266 19,438,942 57
(a) 24% of GMR emissions are estimated to occur within urban areas.
(b) 15.5% of total NSW emissions are estimated to occur within urban areas.
4.4 Emission Intensity of Rail Compared to Road Transport
The vast majority of locomotives in Australia are used for the transport of freight and therefore comparison of emissions performance against road freight is appropriate. The ARA report titled The True Value of Rail released in August 2011 describes the comparative emissions of road and rail in section 4.2.1 of that report as follows:
“Rail plays a larger role in freight transport than it does in passenger transport, accounting for over half of land based freight, when measured in tonne kilometres. In 2010, 249 billion tonne kilometres were transported by freight trains and 207.4 billion by road vehicles. Despite the similarity in total distance travelled, road transport emits ten times as much CO2 equivalent as rail transport (30.4 million tonnes of CO2 equivalent for road compared with 3.1 for rail). The difference in road and rail carbon emissions from freight transport per tonne km travelled is 0.13 kilograms of CO2 equivalent per tonne kilometre.”
A further point of comparison is provided in ARA draft report Environmental Solutions for Freight Rail released in December 2010 which states that (p16):
“Rail is significantly more efficient form of freight when compared with road transport. The energy intensity (MJ-FFC/tonne-km) of articulated trucks is over three times more intensive than hire and reward rail and 10 times more intensive than ancillary rail.
However, road transport in Australia is keeping up with international trends in emissions and fuel efficiency technologies. The improvements that road transport has made over the last few years are mainly due to the shorter truck lifecycle and lower capital costs for

Page 56
trucks and truck engines. While the average age of locomotives in Australia is over 35 years old (the lifecycle of some locomotives is over 50 years), the average age of trucks is 10.7 years old *. Rail is a more energy efficient, lower emission mode of transport. However, capital constraints as a result of distorted and inefficient transport market, has inhibited the uptake of leading edge technologies. To ensure rail’s energy efficiency, incentives should be given to rail to adopt leading edge technologies given the long lifecycles of rail locomotives.
*ATA [Australian Trucking Association] Estimate”
Ancillary rail includes the rail freight services provided internally by mining organisations such as the iron ore mines in the Pilbara region of West Australia.
The emissions intensity of rail freight transport is also estimated to be significantly lower than truck freight transport in terms of particulate matter and NOx emissions (Table 25).
Table 25. Emission Intensity of Rail Compared to Road Freight Transport(53)
PM10 (grams/tonne-km) NOx (grams/tonne-km)
Rail Freight Transport 0.07 0.4
Truck Freight Transport 0.17 3
4.4.1 Projection of Health Costs
Health costs were quantified using estimated PM10 and NOx emissions and pollutant-specific health costs data. Reference was specifically made to the Euro 5/6 Regulatory Impact Study (Euro 5/6 RIS) prepared by the Australian Department of Infrastructure, Transport, Regional Development and Local Government. Health cost data from this study represents the most recent national assessment of the health costs (benefits) due to emissions reductions from internal combustion engines (Table 26). The PM10 figure can be expected to under predict the PM2.5 benefits because PM10 is less harmful per tonne than PM2.5. Note that secondary particles are not included in these health cost estimates.
Table 26. Health Cost Data
Study Case Pollution Costs per Tonne
(2010 AUD$)
NOx PM10
Euro 5/6 RIS 2010(54) Australian capital cities - upper 1,629 362,932
Euro 5/6 RIS 2010 Australian capital cities - central 1,086 241,955
Euro 5/6 RIS 2010 Australian capital cities - low 543 120,977
53 Zhang A., Boardman A.E., Gillen D. And Waters W.G.H., 2005. Towards Estimating the Social and Environmental Costs of Transportation in Canada, Report for Transport Canada, September 2005. 54 Department of Infrastructure and Transport (2010) Final Regulation Impact Statement for Review of Euro 5/6 Light Vehicle Emissions Standards http://www.infrastructure.gov.au/roads/environment/files/Final_RIS_Euro_5_and_6_Light_Vehicle_Emissions_Review.pdf

Page 57
Air emissions of harmful pollutants have different impacts on health costs depending on whether they occur in an urban or regional air shed, with lower exposure potentials and therefore lower impact potentials in regional areas.
Health costs associated with locomotive emissions projected to occur in urban areas were based on the Euro 5/6 RIS 2010 central health cost estimate. Assuming that non-urban emissions will result in hundreds rather than potentially hundreds of thousands of persons being exposed, the central health cost estimates were adjusted by a factor of 0.001 for application in non-urban areas.
Annual health costs based on estimated locomotive emissions are given in Table 27. Annual emissions for 2012, 2022 and 2032 were averaged to provide the basis for the calculations. Annual health costs were estimated to be in the range of AUD$65.6 million per annum. Due to the relatively higher health costs per tonne of emission, PM10 emissions were associated with higher overall health costs.
Table 27. Annual Health Costs due to Locomotive Emissions given Business as Usual
Annual Health Costs due to Locomotive Emissions (Millions AUD$)
Urban Non-urban Total PM10 emissions 53.0 0.3 53.2 NOx emissions 12.3 0.1 12.3 Total (PM10 and NOx emission) 65.2 0.3 65.6
4.5 Summary of Findings
Air emissions were quantified for the base case year (2012) and for two subsequent years (2022 and 2032) based on the detailed locomotive fleet and fuel combustion data set established. US emission factors were applied to calculate emissions, with such factors adjusted to account for the lower sulfur content in Australian diesel.
Annual PM10, PM2.5 and NOx emissions calculated based on Australia-wide locomotive activity were of the order of 1.34 million kilograms per annum, 1.30 million kilograms per annum and 65 million kilograms per annum respectively. An increase in emissions is estimated to occur over the next 20 years, reflecting the projected growth in fuel consumption by the rail sector over this period.
Particle emissions have different health costs depending on whether they occur in an urban or regional air shed. Australia-wide about 50% of passenger rail fuel consumption and about 10% of freight rail fuel consumption were projected to occur within urban areas. Consequently, about 27% of emissions were projected to occur within urban areas nationally, reflecting the significance of iron ore and coal rail activities between remote mining areas and ports, long transits through remote areas along the east-west TransAustralia line (Adelaide to Perth) and the use of diesel-electric locomotives for inter-city and inter-state commuter services. In NSW approximately 60% of emissions were projected to occur within the GMR, based on GTK data from the ARTC.
Health costs were quantified based on estimated PM10 and NOx emissions and pollutant-specific health costs data from the literature, with unit health costs adjusted to take into account low exposure potentials in non-urban areas. Annual emissions for 2012, 2022 and 2032 were averaged to provide the basis for the calculations. Annual health costs were estimated to be in the range of AUD$65.6 million per annum. Due to the relatively higher health costs per tonne of emission, PM10 emissions were associated with higher overall health costs.

Page 58
5 Noise Emission Impacts of Locomotives
This section describes characteristics of locomotive noise, provides locomotive and rail noise case studies and outlines scope for future locomotive noise controls.
5.1 Characteristics of Locomotive Noise
5.1.1 Locomotive Engine Noise
Many locomotives currently operating on the NSW rail network pre-date the requirements of the EPA Environmental Protection License (EPL) which were set in 1999 and Pollution Control Approvals issued pursuant to the former Pollution Control Act 1970. Licences focussed on mitigating noise from locomotives. EPL noise limits targeted at the older locomotives on the premise that they were to be updated every eight years (however generally this does not occur)(55). While a number of class 44 locomotives have been withdrawn from service(56)they are still prevalent on NSW rail networks. Locomotive engine noise is a source of two noise issues – pass by noise and idling. Idling is a significant source of noise complaints associated with the rail network which could potentially be alleviated through air pollution reduction initiatives.
5.1.2 Wheel Squeal and Wheel Rail Track Interaction
Wheel squeal from locomotives and wagons is a common cause of complaint and is typically one of the loudest components to rail noise emissions(57). The science behind wheel squeal is still not fully understood and there is little local and international guidance on the reasons behind this phenomenon. Wheel squeal is generally thought to be caused by variability of friction between the wheel and rail, causing the wheel to slip and generate a squealing noise against the rail track. RailCorp are leading local research and suggest that for the majority of cases of wheel squeal is caused by misaligned axel pairs operating on curved rail tracks(56). Wheel defects, such as “flats” are responsible for repetitive, “thumping” noises and poor rail and wheel conditions (roughness) increase wheel rail contact noise emissions.
5.1.3 Wagon Shunting
Rail wagon shunting can cause noise during transient acceleration (from “stretching”) or braking (from “bunching”), when the linkages between wagons abruptly push and pull against each other. This noise can be significant for freight trains which can be up to more than a kilometre in length. Shunting impacts can be reduced by driver behaviour.
5.1.4 Rail Horn Noise
Train horns are often sounded by rail operators for safety reasons when approaching level crossings, entering and exiting underground tunnels or during regular maintenance routines. Noise regulation of rail horns (i.e. absolute levels) is often not provided as the activity fulfils a safety purpose which generally holds precedence over a potential noise impacts. Best practice of train horn operation is often reviewed to limit events to a practicable number.
55 Australian Rolling Stock Standards Project (August 2009), Exterior Environment Standards Workshop, Meeting
minutes, Page 2. 56 CRC for Rail Innovation (October 2008), Environmental Regulations Pertaining to Rail Noise, page 26. 57 Rail Corporation of NSW (RailCorp), official website, http://www.railcorp.info/community/rail_noise/wheel_squeal
Page 59
5.2 Scope for Future Locomotive Noise Controls
Noise controls are often separated into three main categories:
1. Noise control at the source. This provides the greatest overall benefit to nearby receiver locations. With respect to locomotive noise, such measures would include muffler redesign, top-of-rail friction modifiers for curved rail sections and track isolators/dampers.
2. Noise control in transmission path. This minimises the propagation of noise and is commonly done with the installation of barriers.
3. Noise control at the receiver. This reduces noise levels at an affected property, by means such as insulated facades, roof/ceilings and windows.
These noise control mechanisms are described below. This section also identifies regulatory noise control opportunities.
5.2.1 Noise Control at the Source
Noise control at the source is often considered the most effective noise control strategy. Many initiatives are in place in Australia and in Europe with the aim of reducing noise emissions from rolling stock at the source.
Australian noise reduction initiatives include the development of the RISSB standard for new and refurbished locomotives and RailCorp's research on minimising wheel squeal.
The UIC is promoting the implementation of composite brake blocks on rolling stock. Cast-iron brakes which are commonly used on the European rail network create wheel wear, increasing the irregularity of the wheel and increasing the noise generated when coming in contact with the rail track. Rough wheels will also wear the track over time, creating a cumulative noise effect. The use of composite brakes as proposed will maintain smoothness of rolling stock and the rail track. The indicated reduction from this strategy is the order of 8-10 dBA which would be applied to the entire rail network, once fully implemented. The retrofitting of composite on brake blocks is less costly than noise barrier strategies and is therefore seen as a high performing long-term mitigation strategy.
In Australia, cast iron brakes are not used and many Australian locomotives already have composite brakes.
5.2.2 Noise Control of the Transmission Path
Noise control of the transmission path and at the receiver is often targeted at particular receiver locations and is often considered to be less effective than noise control at the source.
Noise barriers are commonly used in NSW, other states within Australia and globally. As an example, many European countries are currently are investing large amounts in barrier construction(58).
It is noted, however, that this is not uniformly the case. In NSW, they are not a favoured mitigation measure by organisations such as RailCorp(59) as it is considered that the barriers are typically not as affective for locomotive engine or exhaust noise or when receivers are elevated in relation to the rail line.
58 International Union of Railways (2010), Railway Noise in Europe, A 2010 report on the state of the art, Page 17. 59 Rail Corporation of NSW (RailCorp), official website, http://www.railcorp.info/community/rail_noise/freight
Page 60
The UIC has completed extensive research on noise control strategies for rail(60). The findings of the research identified that noise barriers provide the highest level of noise reduction (5-15 dBA) however, the affect is localised to receivers adjacent to the noise barrier. The construction of noise barriers is also the most expensive of rail noise mitigation strategies used in Europe.
5.2.3 Noise Control at the Receiver
Receiver control measures include building treatments such as acoustically insulated facades and laminated or double glazed windows. Such mitigation measures are often seen as last resort as the cost can be significant and the benefit is clearly focused at the individual properties where the treatment is provided. Typically such measures would be implemented when a limited number of properties are affected, as opposed to a single noise barrier which may potentially reduce noise levels at a larger number of affected properties.
5.2.4 Regulatory Noise Control Opportunities
A key opportunity to manage rail noise impacts is to provide cohesive and integrated noise regulation at National, State and Local Government level. Many case studies available today are from rail noise issues caused by residential development built adjacent to the rail corridor without proper assessment or design to ameliorate potential rail noise impacts. The introduction of SEPP (Infrastructure) 2007 will see a more consistent assessment approach across the state which should minimise these issues over time if adopted as a mandatory policy by councils.
Initiatives by the NSW EPA to generate a rigorous assessment procedure for new or redeveloped rail lines by the introduction of RING is a step forward, however the lack of industry regulation on non-compliant locomotives will see issues such as low frequency noise (which is not an assessment requirement in RING) still continue. The completion of the RISSB design standards will see a more complete regulatory mechanism, however until this is resolved the intention of the other policies are arguably incomplete, with some rail noise impacts still likely to continue.
The implementation of RING and the need to investigate all reasonable and feasible mitigation measures without the completion of the RISSB standards may also pose a financial burden on the rail industry if non-compliant locomotives operate on proposed new and redeveloped rail projects.
The RISSB guidelines are a key element to reducing rail noise that will subsequently reduce noise at the source and provide a greater benefit to current and future sensitive developments next to rail corridors. The expedited completion and implementation of this guideline is therefore in the best interest of the government bodies and the rail industry.
5.3 Summary of Findings
There is a range of noise characteristics associated with locomotives which originate from engine/exhaust operation, brake operation, wheel and rail track interaction, wagon shunting, “bunching” of wagons, stretching of wagons and horns.
The most effective way of reducing noise from locomotive operation is by implementing at source mitigation strategies such as rail grinding or the introduction of composite brake block systems as currently proposed on European railways. Other mitigation strategies such as transmission path (e.g. barriers) or at receiver (e.g. dwelling architectural treatments) are also commonly used, however are often less preferred due to their effectiveness in comparison to at source mitigation strategies.
60 International Union of Railways (2010), Railway Noise in Europe, A 2010 report on the state of the art, Pages 10-19.
Page 61
Consistent locomotive design standards are another form of at source mitigation which is a current RISSB initiative and would be a step forward in providing consistency in locomotive noise emissions in Australia.

Page 62
6 Review of Air Emission Reduction Options
This section identifies and inventories the relevant locomotive emission reduction options applicable from a state-wide and a national perspective. Following an initial qualitative review of the environmental benefits and viability of inventoried options against evaluation criteria, a sub-set of options are selected for a more detailed review. Based on the outcome of this review, options are put forward for further consideration.
6.1 Locomotive Emission Reduction Options
Emission reduction options identified based on the review of international, national and local measures being implemented or considered are listed and briefly described below. More detailed descriptions of such measures are provided in the literature(61)(62)(63)(64).
6.1.1 Upgrading the Existing Fleet
The fleet data set developed for this study included an ‘upgrade of existing fleet’ scenario (refer to Section 3). This scenario assumed that a policy objective was in force requiring locomotives with older engine configurations to be upgraded to the best Tier achievable at their next overhaul. (Alco and English Electric engines are assumed to be unchanged. GE and EMD engines are assumed to be upgraded.)
There has been industry feedback to the effect that this case would not be embraced due to the cost of buying new power assemblies and other engine components of higher emissions performance compared to overhaul of the existing power assembly and equipment configurations.
6.1.2 Alternative Drivetrain Technologies
Alternative drivetrain technologies may be progressively implemented when new locomotives are introduced. However, given the slow turnover of the Australian locomotive fleet, the introduction of cleaner technologies could be accelerated through repowering of existing locomotives with new engines or by replacing older locomotives with new locomotives. Alternative drivetrain technologies which may be considered in repowering/replacement programs are listed below.
Ultra Low-Emitting Engine Switching Locomotives
Engine-switching locomotives use multiple smaller efficient engines to provide power on demand in place of a large conventional engine. Ultra low-emitting switch locomotives being implemented internationally include multi-engine gen-set locomotives, liquefied natural gas (LNG) locomotives and battery electric hybrid locomotives.
Application of this measure is mainly restricted to switching/shunting locomotives which move cars within a rail yard. If implemented in Australia, new locomotives from US and Canadian-based suppliers would need to be re-engineered for Australian conditions and gain certification to operate
61 Rare Consulting (2012). Energy Efficiency Opportunities in the Australian Road and Rail Sectors– Supplementary information for EEO participants, February 2012. 62 ARA (2010). Draft: Environmental Solutions for Freight Rail, Australasian Railway Association Inc. 63 CARB (2009). Technical Options to Achieve Additional Emissions and Risk Reductions from California Locomotives
and Rail yards, California Air Resources Board. 64 Kollamthodi S (2006). Rail Diesel Study – Management Summary, AEA Technology Environment, Final Report, March
2006.

Page 63
on local tracks. In the US there are some rebuilds from older engines using standard components but technology providers and installers are lacking in Australia.
Two gen-set locomotives were trialled on the Whyalla narrow gauge iron ore operations(65). These locomotives were manufactured in the US by National Railway Equipment Company and brought to Australia by Downer EDI Rail. The six-axle gen-set locomotives comprise three Cummins engines which are only switched in as determined by the throttle settings.
Battery Electric Hybrids
Propulsion power derives from a large battery, with a smaller diesel generator recharging the battery as its charge is depleted. This technology can be integrated with a regenerative braking system to convert kinetic energy back into electricity to be stored when braking.
AC Traction
AC traction systems replace conventional DC traction motors to provide improved levels of wheel to rail traction and enable less powerful locomotives, or a smaller number of locomotives, to perform tasks. Implementation of this technology may require a long procurement process due to the design adaptations needed to account for a smaller kinematic envelope in Australia.
Battery Storage
This option comprises a fully electric, battery-powered locomotive with the charge in the batteries being replenished either by regenerative braking or via grid-connected charging points. This technology is still being developed with a long timeframe expected before a commercially viable system is available for implementation.
Natural Gas
The utilisation of Liquefied Natural Gas (LNG) or Compressed Natural Gas (CNG) in place of diesel with the aim of reducing emissions and fuel cost. This option requires engine modifications and the transport of specifically designed fuel containers(66).
Standardise Gauge (including axle loads and kinematic envelope)
This measure involves a national effort to replace or upgrade the rail track network to standard gauge, axle load grade and kinematic envelope to enable companies to buy ‘off the shelf’ locomotives which are more efficient and competitively priced(66).
Electrification
This measure comprises the replacement of diesel-electric and diesel locomotives with electric locomotives. Australia’s high reliance on coal power electricity generation means there is no significant overall air pollution emissions benefits from electrification. However, electrification would result in reductions in population exposure to air pollution and thus health benefits. The move towards renewable sources of electricity generation means that electrification has the potential to be an extremely low emissions option. Since the electrification of the Queensland coal railways, no
65 Rail Horizons (2011), RTSA National, Journal No. 51, April 2011. 66 ARA (2010). Draft: Environmental Solutions for Freight Rail, Australasian Railway Association Inc.

Page 64
significant rail electrification projects have been undertaken in Australia. Additionally, no electric locomotives have been added to the fleet since 1999.
6.1.3 Fuel Efficiency Improvements
Driver Assistance Systems
Driver assistance systems include software, a portable data logger and GPS receiver able to interface with the locomotive to log location, speed and power setting. The software estimates fuel consumption and provides instructions to optimise power according to line segment grade and curvature. Use of such systems results in fuel-efficient driving techniques including slower acceleration towards maximum line speed, coasting and running at a speed lower than the maximum to enable more gradual deceleration ahead of braking.
Energymiser is a driver advisory system being delivered to the market by TTG Transportation Technologies Pty Ltd (TTG). FreightMiser and MetroMiser represent earlier versions of this system which was developed in Australia over 16 years. Energymiser is currently locally implemented by PN, and abroad in the UK, New Zealand, the US, Africa and India. Future trialling or use of driver advisory systems has been noted by other Australian rail operators including QR National and Manildra Group (Table 8).
Documentation on Energymiser indicates a potential energy and emission reduction by up to 23%. TTG provided the following examples of energy and emission reductions realised through the use of this system:
8.9% for iron ore trains in Africa;
10% or more for freight trains in Australia, UK and India;
14% for coal trains in UK; and
over 20% for high speed passenger trains in UK.
According to TTG, every 1% reduction in energy consumption can reduce costs by AUD$10,000 per year, per locomotive, and reduce carbon emissions by 35 tonnes per year. This estimate is based on average class 1 mainline locomotive, and assumes AUD$1 per litre for diesel, and may vary with factors such as driver compliance and terrain.
Other benefits of Energymiser were noted by TTG to include:
Improved on-time running, pacing of locomotives and utilisation of rail network capacity, given integration with timetable and speed restriction feeds;
Reduced maintenance costs of trains and tracks, given less over-speeding and braking;
Quick and ongoing return-on-investment. The system is able to pay for itself in less than 6 months, assuming drivers follow the advice and management are committed to reducing their energy consumption/emissions;
Easily retrofitted to any type of locomotive;
Automatically adapts to actual conditions throughout each journey;
Richer driver information, including configurable 6km look-ahead with display of trackside features (helps during low visibility situations and driver training, for example); and
Page 65
Web-based reporting and administration to easily measure, benchmark and monitor performance by driver, locomotive, route, etc.
‘Consist Manager’, a technology developed under the Locomotive Technology Program, funded by the US Department of Energy and GE Transportation, uses driver guidance software to continuously monitor and select the optimal throttle positions. In addition to the 5% to 20% fuel savings due to driver assistance software, additional fuel savings of 1% to 3% can be achieved when used in conjunction with Consist Manager(67).
Idle Management Systems and Anti-Idling Policies
Idle reduction technologies were initially developed to mitigate emissions associated with non-essential idling from locomotive engines. Anti-idling policies provide an opportunity for reducing noise associated with idling. Most idle management systems are designed to automatically shut off the main diesel internal combustion engine and then restart it when the water temperature and battery charge (among other parameters) fall below a specified threshold that would impede a quick start or restart.
Anti-idling policies may also be implemented to reduce emissions, e.g. within rail yards. Such operational measures could be implemented more quickly than technical measures (idle management device implementation), however operational barriers may hinder implementation and the measure may not be as consistently applied. Ingrained practices established by drivers may reduce the effectiveness of anti-idling policies and idle reduction devices.
Idle reduction opportunities are limited for main line applications due to regulations that prevent locomotives from being switched off. In the US, idle management devices have primarily been implemented on switcher locomotives.
The extent of fuel savings from idle reduction systems depends on idling durations. Fuel reductions of over 80% at idle are reported. The retrofitting of intrastate locomotives with idle reduction devices in California was estimated to result in a 10% reduction in fuel and emissions from switch locomotives and about a 3% reduction in fuel and emissions from line haul locomotives(68).
Electronically Controlled Pneumatic (ECP) Brakes
ECP brakes are fitted to locomotives and wagons to ensure that braking occurs on all wagons simultaneously. This allows locomotives achieve higher average speeds and carry heavier loads while still operating within safety limits.
ECP braking systems have been extensively trialled in Australia and are considered viable for rapid implementation across rolling stock. Although ECP braking systems can be retrofitted alongside existing brake systems, emphasis is placed on introducing such systems on new rolling stock.
To date the adoption of this technology has been restricted due to the time and cost of retrofitting a fleet of wagons. However, wagon manufacturers in Australia indicate a very rapid uptake is possible(67). The greatest benefits will derive from implementation within areas of changing terrain.
67 Rare Consulting (2012). Energy Efficiency Opportunities in the Australian Road and Rail Sectors– Supplementary information for EEO participants, February 2012. 68 CARB (2009). Technical Options to Achieve Additional Emissions and Risk Reductions from California Locomotives
and Rail yards, California Air Resources Board.

Page 66
Improved Aerodynamics
Improving the aerodynamics of locomotives and wagons reduces drag and increases fuel efficiency. The effects are greatest when applied along the whole train length (e.g. streamlining train sides, ordering freight cars to optimise aerodynamic profile, minimising gaps between cars, covering open top cars).
Improvement opportunities are greatest for intermodal container trains due to these locomotives being characterised by significantly higher aerodynamic drag.
Speed Management
Restricting throttle usage and operating at lower speeds reduces the need for braking, with lower speeds also reducing aerodynamic drag. Fuel savings and resultant emission reductions of up to 8% for limiting throttle usage and up to 11% for speed reduction are reported.
Weight Reduction
This involves reductions in the weight of rolling stock through improved design and replacing existing mechanical control systems with electronic fly-by-wire systems(69). Fuel savings result from the increase in the wagon payload as a proportion of the total gross mass of the locomotive.
6.1.4 Retrofitting of After-treatment
Potential after-treatment systems which may be retrofitted to existing locomotives include:
diesel particulate filters (DPF);
selective catalytic reduction (SCR);
selective catalytic reduction with diesel particulate filters (SCR+DPF); and
exhaust gas recirculation (EGR).
For locomotives manufactured prior to 1990 (comprising about 50% of the existing fleet in Australia), the feasible abatement measure would be open channel DPF only, whereas with the post-1990 locomotives, SCR and SCR+DPF may be possible(70).The use of EGR was concluded to be a technical option for new railcar and locomotive engines to meet Stage IIIA limit values.
The rail sector has little experience with the retrofitting of after-treatment systems, hence there is limited detailed information about applicability, costs and reliability of such measures for the existing fleet. In most cases it is very difficult to retrofit exhaust after-treatment equipment to existing rail vehicles although some options exist as noted above. More work is however required to assess the feasibility of fitting such equipment, such as the potential for significant space and weight restrictions(70).
6.2 Evaluation of Option Benefits and Practicability
Emission reduction options identified were qualitatively evaluated using an opportunity matrix to identify the most suitable measures for further analysis where sufficient information was available for such an evaluation (Table 28).
69 Rare Consulting (2012). Energy Efficiency Opportunities in the Australian Road and Rail Sectors– Supplementary information for EEO participants, February 2012. 70 Kollamthodi S (2006). Rail Diesel Study – Management Summary, AEA Technology Environment, March 2006.

Page 67
The opportunity matrix compares the emission reduction potential, suitability and applicability of each measure for implementation within NSW and Australia. The following criteria are considered:
Environmental benefits - As a minimum, the measure should ensure the reduction of emissions. Options expected to achieve the following are preferred from an environmental perspective: (i) reduce air emissions, particularly where reductions coincide with regions with air quality exceedances and higher public exposures; (ii) reduce fossil fuel consumption; and (iii) realise noise reduction co-benefits (or as a minimum, avoid increases in noise impacts). Emission reductions achievable were classified on the following basis:
– Low: 0-5% reduction
– Medium: 5-10% reduction
– High: 10-30% reduction
– Very High: over 30% reduction
Technical viability - The option should be practical and feasible under current conditions, with the technology required for its implementation already available (options that require further development involve a higher degree of uncertainty). Options that are based on proven technologies or methods are preferable to those using unproven technologies. Implementation difficulty was classified on the following basis(71):
– Low: Low to moderate complexity, accepted technology, no major barriers to implementation.
– Medium: Moderate complexity, standards require alteration, limited industry consensus on benefits, limited track work required, limited technological barriers, limited external issues.
– High: Highly complex, significant standards alteration and/or legislative change, no industry consensus, major track work required, high technical barriers, considerable external issues.
Economic feasibility - The feasibility of the measure, given the capital and operating costs associated with its implementation, and the sectors responsible for covering such costs.
National and/or state implementation – Options at both a national and state level are to be examined. The level of a populations’ exposure within a region is also a consideration.
Timeframes for implementation and environmental benefit realisation - Shorter timeframes for implementation were given preference.
71 Classification adopted from ARA (2010). Draft: Environmental Solutions for Freight Rail, Australasian Railway Association Inc.

Page 68
Table 28. Evaluation of Benefits and Practicability of Inventoried Measures Measure National or
State Measure
Applicability - Locomotive
Type
Applicability -New or Existing
Locomotives
Emission Reduction
Fuel Savings Implementation Difficulty / Technical Viability (Examples)
Economic Feasibility – Cost
Timeframe Other
Existing Fleet UpgradeUpgrade to the best Tier achievable, if there is one, at their next overhaul
National or State
Switching/ shunting and line haul
Existing locomotives
High (NOx)Low (PM)
Yes/NoSpecific to locomotive
Low / Viable Medium
Short term* *Timeframe depends on when locomotives are due for overhaul
Alternative Drivetrain Technology Replace with ULEL, e.g. Gen-set switch locomotives
National or State
Switching/ shunting
Replace existing with new
Very High 85% reduction from Pre Tier 0 (c)
Yes20-40% reduction (c); 49% when combined with hybrid regenerative braking technology (b)
Low / Viable E.g. California, Texas
MediumUp to six times more expensive than conventional locomotives(b)
Short term Long timeframe for realising benefits if limited to new locomotives (and no accelerated replacement)
Replace with battery electric hybrid switch locomotives (Green Goats)
National or State
Switching/ shunting
Replace existing with new
Very HighOver 80% reduction from Pre Tier 0 (c)
Yes15-25% reduction (b)
Low / Viable E.g. California, Texas
Medium Short term
Replace with battery hybrids for line hauls
National or State
Line haul
Replace existing with new
Very High
Yes15-25% reduction (b)
MediumCommercial line-haul hybrid release in the US not suitable for non-standard gauge rail networks
Medium Longer-term
Alternative fuels (CNG, LNG)
National or State
Switching/ shunting
Replace existing with new
Very High
Yes
Medium(design adaptations required) (a) (b)
Medium/High (a) (b)
Longer-term
AC Traction National or State
Line haul (interstate)
Replace existing with new
Low/MediumUp to 10% (a)
Yes, Potentially Medium(design adaptations required) (b)
Low/Medium10% more expensive than DC locomotive (b)
Longer-term (b)
Battery storage National or State
Switching/ shunting
Replace existing with new
Very High
Yes Not provenPrototype; no commercially viable systems
Medium/High(b)
Longer-term
Standardise Gauge
National Line haul Replace existing with new
Very High
Yes High (a) High (a) Longer-term
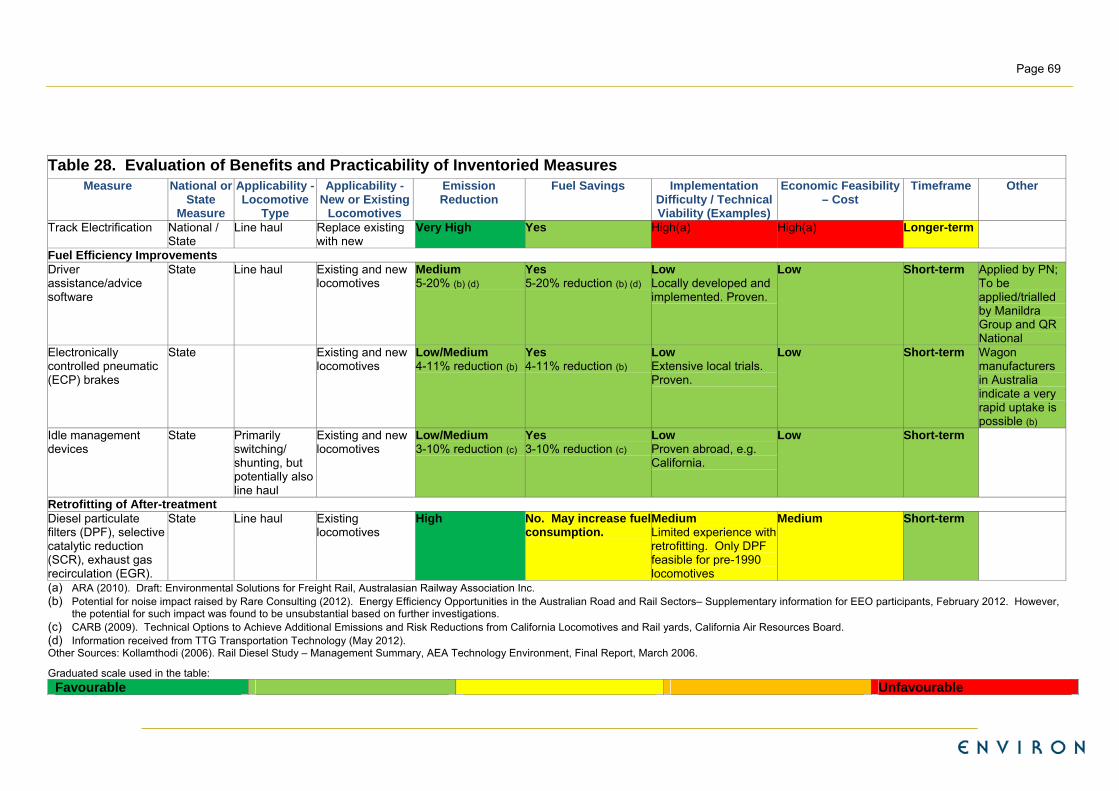
Page 69
Table 28. Evaluation of Benefits and Practicability of Inventoried Measures Measure National or
State Measure
Applicability - Locomotive
Type
Applicability -New or Existing
Locomotives
Emission Reduction
Fuel Savings Implementation Difficulty / Technical Viability (Examples)
Economic Feasibility – Cost
Timeframe Other
Track Electrification National / State
Line haul Replace existing with new
Very High
Yes High(a) High(a) Longer-term
Fuel Efficiency Improvements Driver assistance/advice software
State Line haul Existing and new locomotives
Medium5-20% (b) (d)
Yes5-20% reduction (b) (d)
LowLocally developed and implemented. Proven.
Low Short-term Applied by PN; To be applied/trialled by Manildra Group and QR National
Electronically controlled pneumatic (ECP) brakes
State Existing and new locomotives
Low/Medium4-11% reduction (b)
Yes4-11% reduction (b)
LowExtensive local trials. Proven.
Low Short-term Wagon manufacturers in Australia indicate a very rapid uptake is possible (b)
Idle management devices
State Primarily switching/ shunting, but potentially also line haul
Existing and new locomotives
Low/Medium3-10% reduction (c)
Yes3-10% reduction (c)
LowProven abroad, e.g. California.
Low Short-term
Retrofitting of After-treatment Diesel particulate filters (DPF), selective catalytic reduction (SCR), exhaust gas recirculation (EGR).
State Line haul Existing locomotives
High No. May increase fuel consumption.
MediumLimited experience with retrofitting. Only DPF feasible for pre-1990 locomotives
Medium Short-term
(a) ARA (2010). Draft: Environmental Solutions for Freight Rail, Australasian Railway Association Inc. (b) Potential for noise impact raised by Rare Consulting (2012). Energy Efficiency Opportunities in the Australian Road and Rail Sectors– Supplementary information for EEO participants, February 2012. However,
the potential for such impact was found to be unsubstantial based on further investigations. (c) CARB (2009). Technical Options to Achieve Additional Emissions and Risk Reductions from California Locomotives and Rail yards, California Air Resources Board. (d) Information received from TTG Transportation Technology (May 2012). Other Sources: Kollamthodi (2006). Rail Diesel Study – Management Summary, AEA Technology Environment, Final Report, March 2006. Graduated scale used in the table:
Favourable Unfavourable

Page 70
6.3 Measures Selected for Quantitative Analysis
6.3.1 National
Based on the qualitative assessment of the emission reduction benefits and practicability of options, and taking into account the tailored solutions proposed in previous Australian studies, the following measures were selected for further analysis for national application:
No. Measure
1 Replacement/Repowering of old freight line haul locomotives to meet Stage III, as proposed by ARA 2010(72). This measure targets 150-183 locomotives being repowered over 10 years.
2 Upgrade of existing fleet to the highest Tier achievable at overhaul (refer to Section 3), with accelerated overhaul to ensure overhaul occurs in the short-term.
3 All new locomotives to comply with Tier 2 (not accelerated). 4 All new locomotives to comply with Tier 4 (not accelerated).
5 Replacement of line haul locomotives over 25 years old with Tier 4 compliant locomotives, and all new locomotives to comply with Tier 4.
6
Replacement of existing switch locomotives with gen-set locomotives, and requirement for future switching/shunting locomotives to be of this type. Only applied to locomotives with over 20 years of life remaining, with fuel consumption over 100,000 litres per year.
7 Installation of a driver assistance system on freight and passenger line haul locomotives in the short-term.
8 Retrofitting of ECP brakes to existing line haul locomotives in the short-term.
9 Installation of idling reduction systems in existing switching/shunting and line haul locomotives in the short-term.
The numbers of locomotives affected by each of the above measures are noted in Appendix A.
6.3.2 Regional
To address considerations of regional options several of the measures identified were evaluated for implementation within the NSW GMR. The following measures were applied exclusively to locomotives with operations within the NSW GMR:
No. Measure (a)
2 Upgrade of existing fleet to the highest Tier achievable at overhaul (refer to Section 3), with accelerated overhaul to ensure overhaul occurs in the short-term.
3 All new locomotives to comply with Tier 2 (not accelerated). 4 All new locomotives to comply with Tier 4 (not accelerated).
5 Replacement of line haul locomotives over 25 years old with Tier 4 compliant locomotives, and all new locomotives to comply with Tier 4.
6
Replacement of existing switch locomotives with gen-set locomotives, and requirement for future switching/shunting locomotives to be of this type. Only applied to locomotives with over 20 years of life remaining, with fuel consumption over 100,000 litres per year.
7 Installation of a driver advise system on freight and passenger line haul locomotives in the short-term. 8 Retrofitting of ECP brakes to existing line haul locomotives in the short-term.
9 Installation of idling reduction systems in existing switching/shunting and line haul locomotives in the short-term.
(a) Repower/replace solution (ARA, 2010) is not quantifiable as the urban/non-urban distribution of emission reductions is not known.
72 ARA (2010). Draft: Environmental Solutions for Freight Rail, Australasian Railway Association Inc.

Page 71
The regional measures were made applicable to all locomotives operating entirely or partially within the NSW GMR. The numbers of locomotives affected by each of the above measures are documented in Appendix A.
6.4 Emission Reductions and Health Benefits
The quantitative assessment focused on evaluating measures which are:
able to realise an emission reduction and possible fuel saving;
unlikely to result in noise impacts;
implementable in the short-term (with benefits realisable in the near-term in most cases);
technically viable and potentially economically feasible; and
have higher degrees of certainty in terms of being successful.
A mix of measures was selected so as to consider:
existing and new locomotives;
population density;
line haul and switching/shunting locomotives; and
national and state options.
More detailed information used in the quantification of emission reductions and calculation of costs related to measure implementation is given in Appendix A.
6.4.1 Environmental Benefits of National Measures
The environmental benefits of the selected emission reduction options were assessed on a national basis through the quantification of emission reductions achievable (Table 29) and the associated health benefits (Table 30).

Table 29. Emission Reductions due to Selected National Measures
No. Measure
Non-Urban PM10
Reduction (tpa)
Urban PM10 Reduction
(tpa)
Total PM10 Reduction
(tpa)
Non-Urban NOx
Reduction (tpa)
Urban NOx Reduction
(tpa)
Total NOx Reduction
(tpa)
Urban PM10 Reduction
(%)
Total PM10 Reduction
(%)
Urban NOx Reduction
(%)
Total NOx Reduction
(%)
1 Repower/replace solution (ARA, 2010) ND(a) ND(a) 148 ND(a) ND(a) 4,200 N/A 9 N/A 6
2 Upgrading of existing fleet (accelerated overhaul) - - - 15,624 3,114 18,738 - - 25 25
3 New locomotives Tier 2 155 34 189 2,540 470 3,010 9 11 3 4 4 New locomotives Tier 4 250 55 304 6,918 1,426 8,344 15 18 9 11
5
Accelerated old line haul replacement to achieve Tier 4 and new locomotives Tier 4 514 116 629 20,998 4,751 25,749 36 38 32 35
6 Replace switching locomotives with gen-sets 12 3 15 726 200 926 1 1 1 1
7 Driver assistance system (line haul locomotives) 92 21 113 3,833 977 4,810 7 7 7 6
8 ECP brakes (line haul locomotives) 46 8 55 2,072 373 2,445 3 3 3 3
9
Idle reduction system (switching and line haul locomotives) 40 9 49 1,785 433 2,217 3 3 3 3
(a) No data
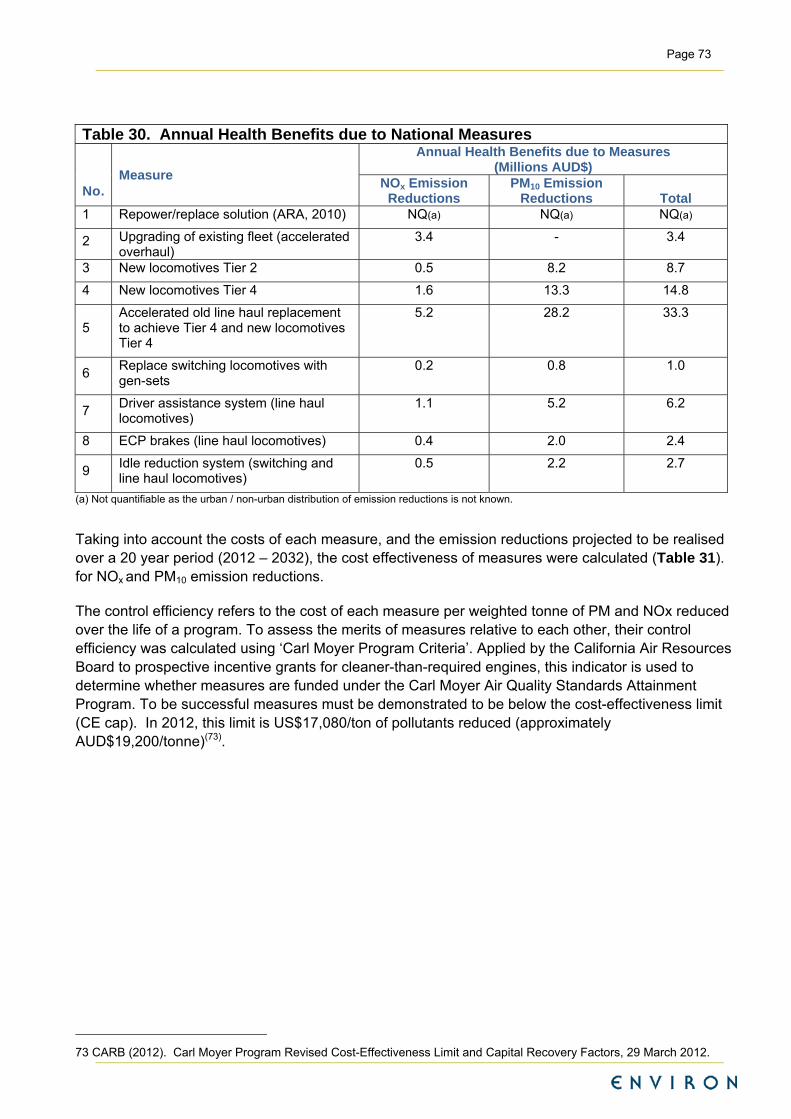
Page 73
Table 30. Annual Health Benefits due to National Measures
Measure
Annual Health Benefits due to Measures (Millions AUD$)
No. NOx Emission Reductions
PM10 Emission Reductions Total
1 Repower/replace solution (ARA, 2010) NQ(a) NQ(a) NQ(a)
2 Upgrading of existing fleet (accelerated overhaul)
3.4 - 3.4
3 New locomotives Tier 2 0.5 8.2 8.7
4 New locomotives Tier 4 1.6 13.3 14.8
5 Accelerated old line haul replacement to achieve Tier 4 and new locomotives Tier 4
5.2 28.2 33.3
6 Replace switching locomotives with gen-sets
0.2 0.8 1.0
7 Driver assistance system (line haul locomotives)
1.1 5.2 6.2
8 ECP brakes (line haul locomotives) 0.4 2.0 2.4
9 Idle reduction system (switching and line haul locomotives)
0.5 2.2 2.7
(a) Not quantifiable as the urban / non-urban distribution of emission reductions is not known.
Taking into account the costs of each measure, and the emission reductions projected to be realised over a 20 year period (2012 – 2032), the cost effectiveness of measures were calculated (Table 31). for NOx and PM10 emission reductions.
The control efficiency refers to the cost of each measure per weighted tonne of PM and NOx reduced over the life of a program. To assess the merits of measures relative to each other, their control efficiency was calculated using ‘Carl Moyer Program Criteria’. Applied by the California Air Resources Board to prospective incentive grants for cleaner-than-required engines, this indicator is used to determine whether measures are funded under the Carl Moyer Air Quality Standards Attainment Program. To be successful measures must be demonstrated to be below the cost-effectiveness limit (CE cap). In 2012, this limit is US$17,080/ton of pollutants reduced (approximately AUD$19,200/tonne)(73).
73 CARB (2012). Carl Moyer Program Revised Cost-Effectiveness Limit and Capital Recovery Factors, 29 March 2012.

Table 31. Cost Effectiveness of National Measures (a)
No. Measure
Cost of Measure over
20 years (Millions AUD$) Pre Unit Costs(a)(AUD$)
Emission Reduction (tonnes over 20 years)
Control Effectiveness
for NOx (AUD$/tonne)
Control Effectiveness
for PM10 (AUD$/tonne) NOx PM10
1 Repower/replace solution (ARA, 2010)
573 ±149
$1.5-$2.5 million per locomotive for repowering; $3.5-$6 million/locomotive for replacement
74,000 ±10,000
2,740 ±200
4,078 ±1,555
107,339 ±35,717
2 Upgrading of existing fleet (accelerated overhaul) (b) 235
±156
$50k to $300k per locomotive for Pre Tier 0 to Tier 0 upgrade; $400k to $700k per locomotive for Pre Tier 0 to Tier 1 upgrade
374,757 No reduction
314±208 NA
3 New locomotives Tier 2 414
$475k per locomotive for purchasing and operating a Tier 2 compared to Tier 1
60,202 3,781 3,436 54,713
4 New locomotives Tier 4 610
$700k per locomotive for purchasing and operating a Tier 4 compared to Tier 1
166,876 6,087 1,827 50,080
5 Accelerated old line haul replacement to achieve Tier 4 and new locomotives Tier 4
3,655 ±725
$4-6.5 million per locomotive for replacements and $700k for new locomotives (purchasing and operating a Tier 4 compared to a Tier 1)
514,976 12,589 3,548 ±704
145,157 ±28,795
6 Replace switching locomotives with gen-sets (c)
166 ±28
$1-$1.4 million per locomotive replaced 18,527 297 4,469
±745 278,457 ±46,409
7 Driver assistance system (line haul locomotives)
29 $16k per locomotive (accounting for capital and operating costs, and fuel savings)
96,195 2,259 379 ±227
16,120 ±9,658
8 ECP brakes (line haul locomotives)
1,587 ±543
$500k to $1 million per locomotive 48,892 1,092 16,228
±5,553 726,27
8±248,518 9 Idle reduction system (switching
and line haul locomotives) 518 ±454
$25k to $385k per locomotive 44,344 977 5,838
±5,123 264,938 ±232,482
(a) Further detail provided in Appendix A.
(b) Excludes normal overhaul costs. Upgrades limited to Tier 0 and Tier 1 which have the same PM10 emission standard.
(c) During the industry review of costs used in the cost efficiency analysis it was noted by one rail operator that the cost of gen-set locomotives could be up to four times higher than indicated (Refer to Appendix A).
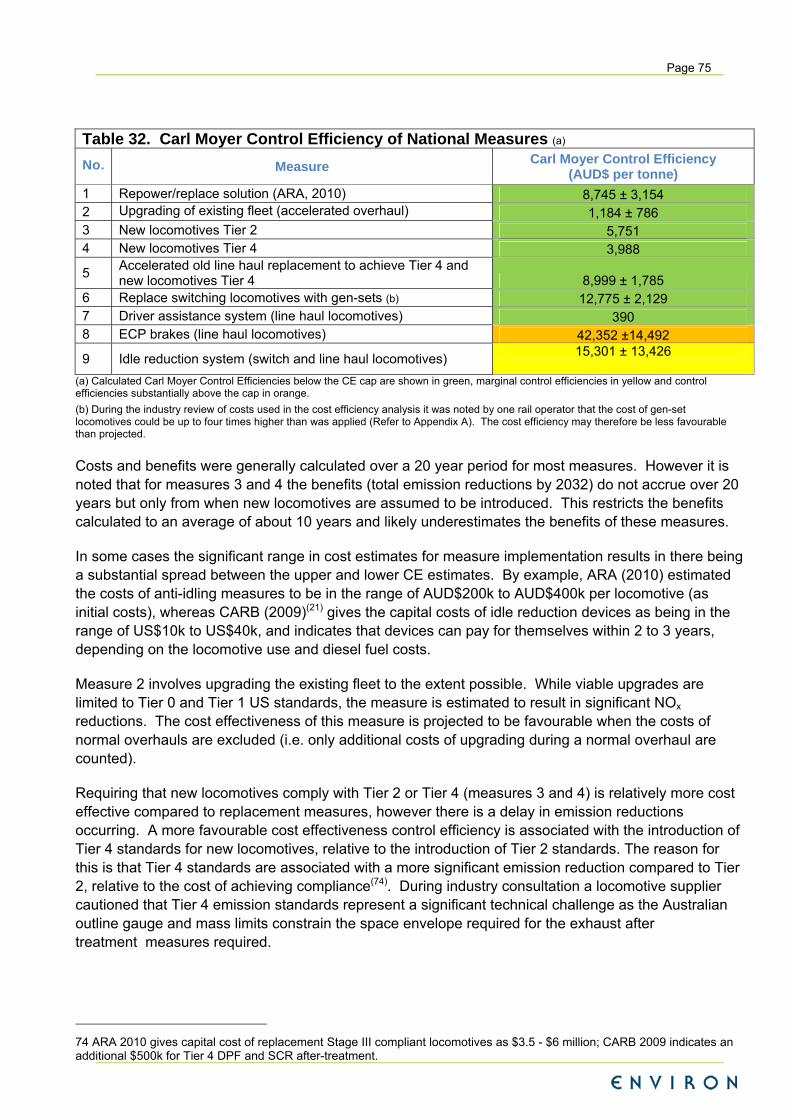
Page 75
Table 32. Carl Moyer Control Efficiency of National Measures (a)
No. Measure Carl Moyer Control Efficiency
(AUD$ per tonne)
1 Repower/replace solution (ARA, 2010) 8,745 ± 3,154 2 Upgrading of existing fleet (accelerated overhaul) 1,184 ± 786 3 New locomotives Tier 2 5,751 4 New locomotives Tier 4 3,988
5 Accelerated old line haul replacement to achieve Tier 4 and new locomotives Tier 4 8,999 ± 1,785
6 Replace switching locomotives with gen-sets (b) 12,775 ± 2,129 7 Driver assistance system (line haul locomotives) 390 8 ECP brakes (line haul locomotives) 42,352 ±14,492
9 Idle reduction system (switch and line haul locomotives) 15,301 ± 13,426
(a) Calculated Carl Moyer Control Efficiencies below the CE cap are shown in green, marginal control efficiencies in yellow and control efficiencies substantially above the cap in orange.
(b) During the industry review of costs used in the cost efficiency analysis it was noted by one rail operator that the cost of gen-set locomotives could be up to four times higher than was applied (Refer to Appendix A). The cost efficiency may therefore be less favourable than projected.
Costs and benefits were generally calculated over a 20 year period for most measures. However it is noted that for measures 3 and 4 the benefits (total emission reductions by 2032) do not accrue over 20 years but only from when new locomotives are assumed to be introduced. This restricts the benefits calculated to an average of about 10 years and likely underestimates the benefits of these measures.
In some cases the significant range in cost estimates for measure implementation results in there being a substantial spread between the upper and lower CE estimates. By example, ARA (2010) estimated the costs of anti-idling measures to be in the range of AUD$200k to AUD$400k per locomotive (as initial costs), whereas CARB (2009)(21) gives the capital costs of idle reduction devices as being in the range of US$10k to US$40k, and indicates that devices can pay for themselves within 2 to 3 years, depending on the locomotive use and diesel fuel costs.
Measure 2 involves upgrading the existing fleet to the extent possible. While viable upgrades are limited to Tier 0 and Tier 1 US standards, the measure is estimated to result in significant NOx
reductions. The cost effectiveness of this measure is projected to be favourable when the costs of normal overhauls are excluded (i.e. only additional costs of upgrading during a normal overhaul are counted).
Requiring that new locomotives comply with Tier 2 or Tier 4 (measures 3 and 4) is relatively more cost effective compared to replacement measures, however there is a delay in emission reductions occurring. A more favourable cost effectiveness control efficiency is associated with the introduction of Tier 4 standards for new locomotives, relative to the introduction of Tier 2 standards. The reason for this is that Tier 4 standards are associated with a more significant emission reduction compared to Tier 2, relative to the cost of achieving compliance(74). During industry consultation a locomotive supplier cautioned that Tier 4 emission standards represent a significant technical challenge as the Australian outline gauge and mass limits constrain the space envelope required for the exhaust after treatment measures required.
74 ARA 2010 gives capital cost of replacement Stage III compliant locomotives as $3.5 - $6 million; CARB 2009 indicates an additional $500k for Tier 4 DPF and SCR after-treatment.
Page 76
Measure 5 comprises accelerated replacement of old line haul locomotives with Tier 4 compliant locomotives and the requirement for new locomotives to be Tier 4 compliant. The measure was estimated to result in the largest reductions in NOx and PM emissions, and hence the greatest health benefits. The cost effectiveness of the measure is significantly less favourable compared to fuel efficiency and existing fleet upgrade measures.
Based on the overall costs of measures, health benefits and the relative cost-efficiency, the most attractive options for potential national implementation were identified as follows:
Upgrading of the existing fleet through accelerated overhaul (but excluding the costs of normal overhaul);
Ensuring new locomotives have Tier 4 equivalent emissions performance; and
Implementation of fuel efficiency measures, and notably measures such as driver assistance systems.
6.4.2 Environmental Benefits of Regional Measures
To address considerations of regional options, several of the measures identified were evaluated for implementation within the NSW GMR. The environmental benefits of the selected emission reduction options applicable as regional measures were assessed through the quantification of emission reductions achievable (Table 33) and the associated health benefits (Table 34).
Taking into account the costs of each measure, and the emission reductions projected to be realised over a 20 year period (2012 – 2032), the cost effectiveness of measures were calculated (Table 35). The control efficiencies given in this table are given for NOx and PM10 emission reductions individually.
To assess the relative significance of the cost efficiencies of measures relative to each other and to measures likely to be considered acceptable for implementation abroad, the Carl Moyer Control Effectiveness was estimated for each measure (Table 36), with the current cost-effectiveness cap equivalent to approximately AUD$19,200/tonne referenced(75).
Costs and benefits were generally calculated over a 20 year period for most measures. Note that the benefits (total emission reductions by 2032) for measures 3 and 4, involving the requirement that new locomotives meet Tier 2 and Tier 4 standards respectively, do not accrue over 20 years but only from when new locomotives are assumed to be introduced. This restricts the benefits calculated to an average of about 10 years and likely underestimates the benefits of these measures.
Measure 2 involves upgrading of the existing fleet to the extent possible. While viable upgrades are limited to Tier 0 and Tier 1 US standards, the measure is estimated to result in significant NOx reductions. Given that Pre Tier 0, Tier 0 and Tier 1 locomotives have equivalent particulate matter emissions, no reduction in PM10 emissions is associated with this measure. The cost effectiveness of the measure is projected to be favourable when the costs of normal overhauls are excluded (i.e. only additional costs of upgrade during a normal overhaul are counted).
75 CARB (2012). Carl Moyer Program Revised Cost-Effectiveness Limit and Capital Recovery Factors, 29 March 2012.

Page 77
Table 33. Emission Reductions due to Selected Regional Measures (a)
No. Measure Scale Non-Urban PM10 Reduction (tpa)
Urban PM10 Reduction (tpa)
Total PM10 Reduction (tpa)
Non-Urban NOx Reduction (tpa)
Urban NOx Reduction (tpa)
Total NOx Reduction (tpa)
2 Upgrading of existing fleet (accelerated overhaul) (b)
NSW GMR No reduction No reduction No reduction 4,112.0 754.3 4,866.3
3 New locomotives Tier 2 NSW GMR 23.8 4.4 28.1 844.0 154.8 998.8 4 New locomotives Tier 4 NSW GMR 38.3 7.0 45.3 1,514.9 277.9 1,792.8
5
Accelerated old line haul replacement to achieve Tier 4 and new locomotives Tier 4
NSW GMR 95.9 17.6 113.5 4,646.8 852.4 5,499.1
6 Replace switching locomotives with gen-sets
NSW GMR 0.06 0.01 0.07 3.49 0.64 4.14
7 Driver assistance system (line haul locomotives)
NSW GMR 15.8 2.9 18.7 801.7 147.1 948.8
8 ECP brakes (line haul locomotives)
NSW GMR 11.3 2.1 13.3 576.7 105.8 682.4
9 Idle reduction system (switching and line haul locomotives)
NSW GMR 8.8 1.6 10.5 453.0 83.1 536.1
(a) Repower/replace solution (ARA, 2010) is not quantifiable as the urban/non-urban distribution of emission reductions is not known. (b) Excludes normal overhaul costs. Upgrades limited to Tier 0 and Tier 1 which have the same PM10 emission standard.
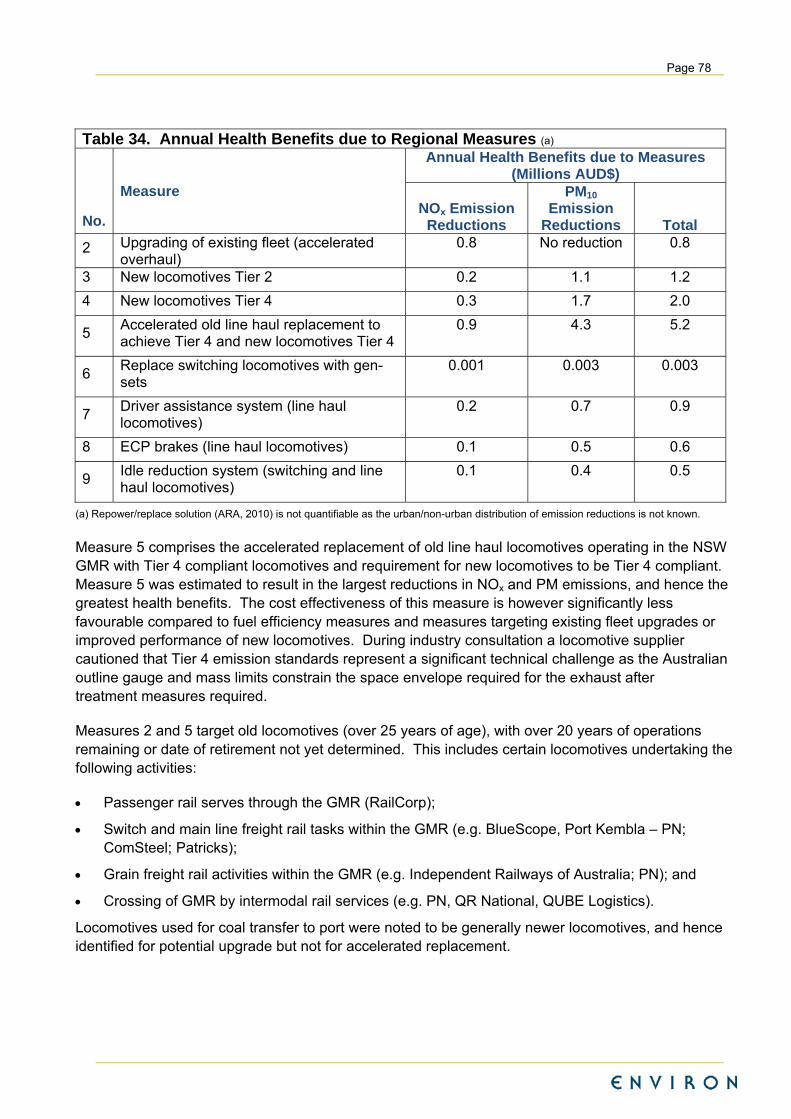
Page 78
Table 34. Annual Health Benefits due to Regional Measures (a)
No.
Measure
Annual Health Benefits due to Measures (Millions AUD$)
NOx Emission Reductions
PM10 Emission
Reductions Total
2 Upgrading of existing fleet (accelerated overhaul)
0.8 No reduction 0.8
3 New locomotives Tier 2 0.2 1.1 1.2
4 New locomotives Tier 4 0.3 1.7 2.0
5 Accelerated old line haul replacement to achieve Tier 4 and new locomotives Tier 4
0.9 4.3 5.2
6 Replace switching locomotives with gen-sets
0.001 0.003 0.003
7 Driver assistance system (line haul locomotives)
0.2 0.7 0.9
8 ECP brakes (line haul locomotives) 0.1 0.5 0.6
9 Idle reduction system (switching and line haul locomotives)
0.1 0.4 0.5
(a) Repower/replace solution (ARA, 2010) is not quantifiable as the urban/non-urban distribution of emission reductions is not known.
Measure 5 comprises the accelerated replacement of old line haul locomotives operating in the NSW GMR with Tier 4 compliant locomotives and requirement for new locomotives to be Tier 4 compliant. Measure 5 was estimated to result in the largest reductions in NOx and PM emissions, and hence the greatest health benefits. The cost effectiveness of this measure is however significantly less favourable compared to fuel efficiency measures and measures targeting existing fleet upgrades or improved performance of new locomotives. During industry consultation a locomotive supplier cautioned that Tier 4 emission standards represent a significant technical challenge as the Australian outline gauge and mass limits constrain the space envelope required for the exhaust after treatment measures required.
Measures 2 and 5 target old locomotives (over 25 years of age), with over 20 years of operations remaining or date of retirement not yet determined. This includes certain locomotives undertaking the following activities:
Passenger rail serves through the GMR (RailCorp);
Switch and main line freight rail tasks within the GMR (e.g. BlueScope, Port Kembla – PN; ComSteel; Patricks);
Grain freight rail activities within the GMR (e.g. Independent Railways of Australia; PN); and
Crossing of GMR by intermodal rail services (e.g. PN, QR National, QUBE Logistics).
Locomotives used for coal transfer to port were noted to be generally newer locomotives, and hence identified for potential upgrade but not for accelerated replacement.

Page 79
Table 35. Cost Effectiveness of Regional Measures (a)
No. Measure (b) Scale
Cost of Measure over
20 years (AUD$ Million) Pre Unit Costs(a)(AUD$)
Emission Reduction (tonnes over 20 years)
Control Effectiveness
for NOx (AUD$/tonne)
Control Effectiveness
for PM10 (AUD$/tonne) NOx PM10
2 Upgrading of existing fleet (accelerated overhaul) (c)
NSW GMR
108±77
$50k to $300k per locomotive for Pre Tier 0 to Tier 0 upgrade; $400k to $700k per locomotive for Pre Tier 0 to Tier 1 upgrade
185,201 No
reduction 291 ±207
N/A
3 New locomotives Tier 2 NSW GMR
67 $475k per locomotive for purchasing and operating a Tier 2 compared to Tier 1
19,977 563 1,664 59,081
4 New locomotives Tier 4 NSW GMR
98 $700k per locomotive for purchasing and operating a Tier 4 compared to Tier 1
35,855 906 1,367 54,078
5 Accelerated old line haul replacement to achieve Tier 4 and new locomotives Tier 4
NSW GMR
1,568±350
$4-6.5 million per locomotive for replacements and $700k for new locomotives (purchasing and operating a Tier 4 compared to a Tier 1)
183,721 3,649 4,267 ±953
214,856 ±47,959
6 Replace switching locomotives with gen-sets (d)
NSW GMR
7±1 $1-$1.4 million per locomotive replaced 487 8 7,400 ±1,233
461,056 ±76,843
7 Driver assistance system (line haul locomotives)
NSW GMR -2
$16k per locomotive (accounting for capital and operating costs, and fuel savings)
28,440 553 -37 -1,926
8 ECP brakes (line haul locomotives)
NSW GMR
554±191 $500k to $1 million per locomotive 24,199 463 11,444 ±3,946
598,114 ±206,258
9 Idle reduction system (switching and line haul locomotives)
NSW GMR 165±147 $25k to $385k per locomotive 18,708 358 4,416±3,935
230,815 ±205,708
(a) Further detail provided in Appendix A.
(b) Repower/replace solution (ARA, 2010) is not quantifiable as the urban/non-urban distribution of emission reductions is not known.
(c) Excludes normal overhaul costs. Upgrades limited to Tier 0 and Tier 1 which have the same PM10 emission standard.
(d) During the industry review of costs used in the cost efficiency analysis it was noted by one rail operator that the cost of gen-set locomotives could be up to four times higher than was applied (Refer to Appendix A).

Page 80
Table 36. Carl Moyer Control Efficiency of Regional Measures (NSW GMR) (a)
No. Measure (b) Carl Moyer Control Efficiency
(AUD$ per tonne) 2 Upgrading of existing fleet (accelerated overhaul) 1,097±781 3 New locomotives Tier 2 4,020 4 New locomotives Tier 4 3,428 5 Accelerated old line haul replacement to achieve Tier 4
and new locomotives Tier 4 11,532±2,574
6 Replace switching locomotives with gen-sets (c) 21,152±3,525 7 Driver assistance system (line haul locomotives) -102 8 ECP brakes (line haul locomotives) 31,253±10,777 9 Idle reduction system (switching and line haul
locomotives) 12,059±10,747
(a) Calculated Carl Moyer Control Efficiencies below the CE cap are shown in green, marginal control efficiencies in yellow and control efficiencies substantially above the cap in orange.
(b) Repower/replace solution (ARA, 2010) is not quantifiable as the urban/non-urban distribution of emission reductions is not known.
(c) During the industry review of costs used in the cost efficiency analysis it was noted by one rail operator that the cost of gen-set locomotives could be up to four times higher than was applied (Refer to Appendix A). The cost efficiency may therefore be less favourable than is projected in the table for this measure.
Requiring that new locomotives comply with Tier 2 or Tier 4 (measures 3 and 4) is relatively more cost effective compared to replacement measures 5 and 6. The introduction of Tier 2 or Tier 4 standards for new locomotives were calculated to have control efficiencies within the Carl Moyer cap limit, however it is noted that the emission reductions and associated benefits will be achieved over a longer time period. A more favourable control efficiency is associated with the introduction of Tier 4 standards for new locomotives, relative to the introduction of Tier 2 standards, given that Tier 4 locomotives are associated with greater emission reductions relative to the cost of achieving compliance. New locomotives projected for NSW were primarily for coal freight services.
Measure 6, comprising the replacement of switching locomotives with gen-sets, was not estimated to result in significant emissions reductions or health benefits. Given the conditions set out for the measure (i.e. applicability to switch locomotives operating in the GMR which use over 100kLpa of fuel and have over 20 years to retirement), only six locomotives were identified for measure application. The benefits and control efficiency of this measure could potentially be improved through additional scenario modelling with varied applicability criteria.
Fuel efficiency measures have the potential to realise significant emission reductions in a cost effective manner. In the case of the implementation of driver assistance systems (measure 7), an overall cost saving was projected due to fuel cost savings offsetting implementation costs. Several industry operators are either already implementing such systems (e.g. PN) or investigating their implementation (e.g. QR National). In quantifying emission reductions achievable through the implementation of this measure, application of the measure to locomotives operated by companies already implementing such systems was excluded.
A wide range in the potential cost effectiveness of installing ECP braking systems on line haul locomotives (measure 8) and idle reduction systems on switch and line haul locomotives (measure 9) was estimated. This is due to significant variations in the reported costs per locomotive of introducing such measures. (Further detail is provided in Appendix A.)
6.4.3 Differences in Control Effectiveness for National and Regional Applications
Differences are evident in the control efficiency of measures depending on whether they are assumed to apply to national locomotive fleets or regional fleets such as the NSW GMR. This difference is

Page 81
primarily due to the number and characteristics of locomotives being targeted by the measure, including the emission performance, fuel consumption and associated air emissions of targeted locomotives.
In the case of the measure 3 and measure 4 the control effectiveness is similar for PM10, but more favourable for NOx for the NSW GMR case. New locomotives introduced in Western Australia and Queensland, primarily related with mining sector growth, are assumed to be Tier 1 compliant given business as usual (no measures applied). In NSW however, a portion of the new locomotives introduced for hauling coal are expected to have Pre Tier 0 emission performance in the absence of measures. A greater NOx reduction is realised by replacing Pre Tier 0 locomotives with Tier 2 or Tier 4 locomotives, than is achieved by replacing Tier 1 compliant locomotives with Tier 2 or Tier 4 locomotives. Thus measure 3 and measure 4 result in greater NOx reductions when applied within the NSW GMR.
Measure 5 applies to 871 new and 580 old locomotives nationally, and to 140 new and 280 old locomotives within the NSW GMR. Old locomotives for the purpose of this measure are defined as locomotives which are over twenty-five years of age, with over twenty year remaining before retirement. Differences in the control effectiveness of measure 5 between national and regional applications are due to variations in the base case (business as usual) emission performance of locomotives targeted by the measure at these scales.
Measure 6 involves the replacement of switching locomotives, using over 100kLpa of fuel and having over twenty years to retirement, with gen-sets. The measure was applied to 138 locomotives nationally, but only six locomotives operating within the NSW GMR. The measure was identified to be less cost effective when applied within the NSW GMR compared to national implementation. The difference in cost effectiveness is mainly due to the switching locomotives in other states having higher rates of utilisation, and hence relatively greater fuel consumption rates and air emissions. National application of measure 6 is therefore estimated to result in more significant emission reductions and improved control efficiencies.
Measure 7 comprised the application of driver assistance systems to line haul locomotives with over five years to retirement. Fuel savings due to the application of this measure was estimated to partially or entirely offset the costs of implementing and maintaining such systems. Locomotives targeted by the measure within the NSW GMR (353 locomotives) were associated with greater average fuel combustion rates per locomotive compared to the national locomotive fleet addressed by the measure (1792 locomotives). This resulted in the measure being more cost effective when applied in the NSW GMR, compared to the national application of the measure.
Measure 9 comprised the implementation of idle reduction systems to switching and line haul locomotives with over five years to retirement. The application of the measure within the NSW GMR resulted in more favourable control efficiencies for line haul locomotives relative to the national application of the measure, for similar reasons given above for measure 7. However measure 9 resulted in less favourable control efficiencies for switching locomotives relative to national control efficiencies for the reasons provided above for measure 6. Consequently, the overall control effectiveness of measure 9 was comparable for national and NSW GMR applications.

Page 82
7 Options for Further Consideration
This section outlines suggested options for further consideration in respect of national and regional measures, and briefly outlines possible implementation steps and timelines for such measures.
7.1 National Measures
Based on the report’s qualitative and quantitative assessment of options, including calculation of relative control efficiencies, measures for consideration at a national level are as follows:
Introduction of emission standards requiring emission performance equivalent to US standards for new locomotives (measure 3 or 4);
Continued identification and funding for the uptake of fuel efficiency measures such as the driver assistance system (measure 7) as a component of Energy Efficiency Opportunity programs;
Provision of incentives to operators to promote the upgrading of existing locomotives to achieve improved emissions performance during routine overhauls, and/or accelerated retirement of old locomotives operating in urban areas (measure 2); and
Identification of longer-term measures should be considered through consultative programs, such as On Track to 2040.
Steps which may be considered by national government to implement the above measures and suitable timelines for the implementation of such measures are discussed in subsequent sections.
7.1.1 Emission Performance Requirements for New Locomotives
The following potential steps could be considered in developing this measure:
Development of national regulation. This option comprises the enactment of new Commonwealth legislation. The regulation could apply to new and remanufactured locomotives and would restrict emissions through the specification of emission standards;
Establishment of a National Environmental Protection Measure (NEPM), under the National Environment Protection Council Act 1994. As for the Commonwealth regulation, the NEPM would apply to new and remanufactured locomotives and could restrict emissions through the specification of emission standards. For national coverage, each state would need to adopt NEPM provisions in their own jurisdiction, under their own legislation. Thus industry operators and suppliers may need to deal with more than one regulatory agency; and
Work with the peak rail industry association in establishing an industry standard applicable for new and remanufactured locomotives. RISSB has already developed Draft Exterior Environment Standards, which incorporate emission standards, through its Australian Rolling Stock Standards Project. RISSB is intending to hold a further meeting of the Development Group and Rail Industry Environment Committee (RIEC) in mid-2012 to progress the development of these standards.
Emission performance requirements for new locomotives could be established and implemented in the medium term (2015-2020), with benefits being realised in the long term due to the slow turnover of the existing fleet. The measure would however also reduce the potential for incremental risks occurring in the medium term associated with the growth in the coal and iron ore freight businesses.

Page 83
7.1.2 Identification and Funding of Fuel Efficiency Measures
The Australian Centre for Renewable Energy (ACRE) within the Department of Resources, Energy and Tourism (DRET) has responsibility for a variety of the Australian Government’s clean energy programs. Major rail operators have been working with DRET to develop and report on potential additional opportunities to reduce energy use. A key criterion for these opportunities is that they have a potential payback of four years or less. This program has been instrumental in identifying and promoting the implementation of fuel efficiency measures within the rail industry, thus also serving to reduce air emissions.
The DRET program is underpinned by on-going research. A recent study commissioned by DRET addressing energy efficiency opportunities in the Australian rail sector(76) reviewed the application relevance, potential benefits and key implementation considerations of the following strategies:
Alternative drivetrains technologies – including engine switching locomotives, hybrid drivetrains and battery storage;
Fuel efficiency improvements – weight reduction, double stacking, driver assistance software, auxiliary power systems, improved aerodynamics, electronically controlled pneumatic (ECP) brakes, idle management devices and speed management; and
Intermodal transfer improvements – regenerative loading/unloading cranes, and intermodal train planning.
Continued support of the implementation of fuel efficient improvements by major rail operators through existing Energy Efficiency Opportunities programs is recommended. Such efforts should not be duplicated through an additional process. Air quality considerations may however be integrated within existing programs, e.g. by focusing on fuel efficiency improvements by operators with services in urban areas. Implementation and benefits are realisable in the short-term for the existing fleet.
Additionally, on-going research and development of energy efficiency opportunities by the Australian Government, in partnership with major rail operators, to identify further options for implementation in the medium to long term is recommended.
7.1.3 Incentivised Upgrading or Accelerated Retirement of Existing Locomotives
A scheme for encouraging the upgrading or accelerated retirement of existing locomotives could be progressed through the Australian Government’s clean energy programs. Examples of government incentives/disincentives include:
Loan guarantees to reduce the cost of equity;
Accelerated depreciation and investment tax credits to improve the financial outcome in early years; and
Carbon pricing.
The viability of this measure would need careful consideration. A recent study has been undertaken on the feasibility of promoting technical investment in the Australian rail freight sector through accelerated depreciation. This study concluded that accelerated depreciation should not be used as a primary
76 Rare Consulting (2012). Energy Efficiency Opportunities in the Australian Road and Rail Sectors– Supplementary information for EEO participants, February 2012.

Page 84
mechanism to drive rolling stock modernisation since there are many other factors that restrain the replacement investment in the rail freight sector(77).
7.1.4 Identification of Long Term Strategies Through Collaboration
The Department of Innovation Industry Science and Research (DIISR), through the Rail Supplier Advocate, has commissioned On Track to 2040 project to examine the future of technology in the Australian rail supply industry. The project is funded by the Australian Government; the state governments of NSW, Victoria and Queensland; and the Australasian Railways Association (ARA) on behalf of industry. It is being delivered by Australian National University (ANU) Edge in partnership with the University of Cambridge Institute for Manufacturing Education and Consultancy Services (IfM ECS), the CRC for Rail Innovation, and the Strategic Connection Group (SCG).
The On Track to 2040 project entered its fourth phase in 2012, focusing on the identified priority areas of energy monitoring and management; power and propulsion; and materials and manufacturing. Potential longer-term measures which may be progressed through this and associated consultative programs include alternative energy (e.g. natural gas), standardised gauge and increased track electrification.
In its 2010 draft report, Draft: Environmental Solutions for Freight Rail, the ARA emphasised the importance of facilitating the transition of the industry to a secure, low emission, natural gas energy alternative. This was concluded to be a long term measure, with a joint research and development program being proposed into the use of natural gas in Australia’s locomotives.
7.2 Regional Measures
Measures suggested for further state consideration are as follows:
Support of fuel efficiency measures, notably:
– Driver assistance systems for line haul locomotives, including passenger and freight locomotives; and
– Idle reduction systems where economic, particularly for switching locomotives operating within urban areas.
Accelerated replacement of old (25 years+) locomotives, particularly:
– Switching locomotives operating within urban areas; and
– Line-haul locomotives with high utilisation rates, particularly those travelling through urban areas (e.g. passenger) and to and from ports (coal haul, freight).
Accelerated overhaul of other existing locomotives (less than 25 years old) to the highest Tier achievable, focussing on:
– Switching locomotives operating within urban areas; and
– Line-haul locomotives with high utilisation rates, particularly those travelling through urban areas (e.g. passenger) and to and from ports (coal haul, freight).
77 Koowattanatianchai N. (2011). Promoting Technical Investment in the Australian Rail Freight Sector: Evaluating the Feasibility of Accelerated Depreciation, DBA thesis, Southern Cross University, Lismore, NSW.

Page 85
Steps which may be considered by state government for implementation in the short-term (one-five years) to facilitate the implementation of the aforementioned regional measures are as follows:
Extension of existing state clean technology programs to locomotives. By example, the NSW Clean Machine Program which supports the retrofitting of non-road diesel engines could provide the framework for driving improvements in locomotive fuel efficiency, maintenance practices and existing locomotive upgrades;
Targeting of the rail sector through existing state energy efficiency or sustainability initiatives. By example, OEH’s Sustainability Advantage program could provide the framework to workshop fuel efficiency measures with rail operators, encouraging information sharing by operators already implementing such measures (e.g. driver assistance systems);
Collection and publication of fuel efficiency and emissions performance information for rail operators to illustrate the relative performance of operators;
Negotiate MOUs with major rail operators aimed at ensuring that locomotives undergoing rebuilds are rebuilt to a higher standard, and securing accelerated retirement of old locomotives active within areas of high population density;
Negotiate MOUs with major rail track managers to support the inclusion of requirements in respect of locomotive fuel efficiency, emission performance and/or maintenance practices within their contracts with rail operators; and
Pursue improvements in fuel efficiency, maintenance practices and locomotive upgrades through regulatory mechanisms, e.g. introduction of pollution reduction programs within Environmental Protection Licences in NSW.
The age and duty cycle of certain locomotives operating in urban areas, including cross city services and port access, is of interest due to the potential for exposures to emissions from such locomotives. Switch locomotives spend more time idling and at low power notch levels, whereas main line freight and passenger rail is characterised by reduced idle times with an increase in utilisation at high power notch levels.
In addition to pursuing short-term measures discussed above, state governments may choose to commission more intensive rail corridor impact assessment studies to inform longer-term planning. Such studies have been implemented in the US and Europe to robustly quantify temporal and spatial variations in rail-related air pollution and associated health risks in densely populated areas.

Page 86
8 References
ABARE (2006), Australian Energy, National and State Projections to 2029-30, ABARE Research Report 06.26, Australian Bureau of Agricultural and Resource Economics and Sciences, Canberra, Australia.
ABARE (2011a), Energy Update 2011, Australian Bureau of Agricultural and Resource Economics and Sciences, Canberra, Australia.
ABARE (2011b), Energy in Australia 2011, Australian Bureau of Agricultural and Resource Economics and Sciences, Canberra, Australia.
ARA Australian Rail Industry Report 2007.
ARA (2010). Draft: Environmental Solutions for Freight Rail, Australasian Railway Association Inc.
Australian Rolling Stock Standards Project (August 2009), Exterior Environment Standards Workshop, Meeting Minutes, Page 2.
BTRE (2005). Health Impacts of Transport Emissions in Australia: Economic Costs, Canberra, Bureau of Transport and Regional Economics.
BITRE (2010). Long-term Projections of Australian Transport Emissions: Base Case 2010, Bureau of Infrastructure, Transport and Regional Economics, Australian Department of Infrastructure and Transport, November 2010.
California – Air Resources Board (ARB) – Calculator, www.arb.ca.gov/portable/perp/fleetemissions/calculatorinstructions.htm
CARB (2005). Particulate Emissions Reduction Program at California Rail Yards – ARB/Railroad Statewide Agreement, June 2005.
CARB (2008). Strategies to Reduce Locomotive and Associated Rail Yard Emissions, Fact Sheet, California Air Resources Board, February 2008.
CARB (2009). Technical Options to Achieve Additional Emissions and Risk Reductions from California Locomotives and Rail yards, California Air Resources Board.
CARB (2010). Guidelines for Implementation, Proposition 1B: Goods Movement Emission Reduction Program, Final Report, California Air Resources Board.
CARB (2012). Carl Moyer Program Revised Cost-Effectiveness Limit and Capital Recovery Factors, 29 March 2012.
Classification adopted from ARA (2010). Draft: Environmental Solutions for Freight Rail, Australasian Railway Association Inc.
CRC for Rail Innovation (November 2008), An Inventory of Environmental Regulation Pertaining to Rail in Australia, Page 22.
CRC for Rail Innovation (October 2008), Environmental Regulations Pertaining to Rail Noise, Page 26.

Page 87
Department of Infrastructure and Transport (2010) Final Regulation Impact Statement for Review of Euro 5/6 Light Vehicle Emissions Standards http://www.infrastructure.gov.au/roads/environment/files/Final_RIS_Euro_5_and_6_Light_Vehicle_Emissions_Review.pdf
Directive 2004/26/EC of the European Parliament and of the Council – Official Journal of the European Union, April 2004.
Dunn, R (2001). Diesel Fuel Quality and Locomotive Emissions in Canada, Prepared for Transportation Development Centre – Transport Canada, April 2001.
EPA Finalizes More Stringent Emission Standards for Locomotives and Marine Compression-Ignition Engines, US-EPA, March 2008.
Final Regulation Order – Proposed Extension of the California Standards for Motor Vehicle Diesel Fuel Used for Intrastate Diesel-Electric Locomotives and Harborcrafts, California ARB, 2005.
Fritz, S.G. (2004), Evaluation of Biodiesel Fuel in an EMD GP38-2 Locomotive, National Renewal Energy Laboratory, May 2004.
IARC (2012). IARC WHO Press Release No. 213, IARC: Diesel Engine Exhaust Carcinogenic, 12 June 2012, World Health Organisation, International Agency for Research on Cancer, Lyon, France.
Information received from TTG Transportation Technology (May 2012).
International Union of Railways (2010), Railway Noise in Europe, A 2010 Report on the State of the art, Page 10-19, 17, 8.
Kollamthodi S (2006). Rail Diesel Study – Management Summary, AEA Technology Environment, Final Report, March 2006.
Koowattanatianchai N. (2011). Promoting Technical Investment in the Australian Rail Freight Sector: Evaluating the Feasibility of Accelerated Depreciation, DBA thesis, Southern Cross University, Lismore, NSW.
MECA (2009). Case Studies of the Use of Exhaust Emission Controls on Locomotives and Large Marine Diesel Engines, Manufacturers of Emission Controls Association (MECA), September 2009.
New Ultra-Low Emission Locomotive, Union Pacific, http://www.uprr.com/newsinfo/releases/environment/2007/0131_ultralow.shtml
NSW DEC (2007). New South Wales Greater Metropolitan Region, Department of Environment and Conservation, Sydney.
NSW DECCW (2007). Air Emissions Inventory for the Greater Metropolitan Region in New South Wales, New South Wales, Department of Environment, Climate Change and Water, Sydney.
NSW DECCW (2007). Current and Projected Air Quality in NSW, A Technical Paper Supporting the Clean Air Forum 2007, Department of Environment, Climate Change and Water.
NSW Environmental Protection Authority (March 2012), Rail Infrastructure Noise Policy (RING), Page 26 and 30.

Page 88
NSW Parliamentary Library Research Service (2009), Rail Freight Transport in NSW, Page 19.
PAE (2005). Management Options for Non-road Engine Emissions in Urban Areas, Report compiled by Pacific Air and Environment on behalf of the Department of the Environment and Heritage, November 2005.
PAEHolmes (2011). Potential Measures for Air Emissions from NSW Ports, Preliminary Study, Prepared for the NSW Office of Environment & Heritage, 23 June 2011.
Pope III C.A. and Dockery D.W.C. (2006). Health Effects of Fine Particulate Air Pollution: Lines that Connect, Journal of Air & Waste Management Association, Page 56, 709-742.
Rail Corporation of NSW (RailCorp), official website, http://www.railcorp.info/community/rail_noise/freight
Rail Corporation of NSW (RailCorp), official website, http://www.railcorp.info/community/rail_noise/wheel_squeal
Rail Express, Cutting Fuel Use in Rail Haulage, November 2011, www.railexpress.com.au.
Rail Horizons (2011), RTSA National, Journal No. 51, April 2011.
Railways and Biofuel – First UIC Report, Association of Train Operating Companies, July 2007.
Rare Consulting (2012). Energy Efficiency Opportunities in the Australian Road and Rail Sectors– Supplementary information for EEO participants, February 2012.
Regulatory Announcement – Clean Air Nonroad Diesel Rule, US-EPA, 2004
Rolling Towards a Cleaner Future: The Development of Canadian Locomotive Emissions Regulations – Issue Brief, Transport Canada, December 2010.
Transport and Environment (November 2011), Revision of the EU Rail Noise Standards (TSI), Input to the ERA Working Party, Page 4.
US-EPA (2009). Emission Factors for Locomotives, EPA-420-F-09-025, April 2009.
US-EPA (2009). NONROAD2008a Model, Transportation and Air Quality, United States Environmental Protection Agency, Office of Transportation and Air Quality, Washington, DC, USA.
US National Center for Environmental Economics (2012). Retrospective Study of the Costs of EPA Regulations: An Interim Report of Five Case Studies, March 2012.
WHO (2003). Health Aspects of Air Pollution with Particulate matter, Ozone and Nitrogen Dioxide, Report on a World Health Organisation Working Group, Bonn, Germany, 13-15 January 2003.
Zhang A., Boardman A.E., Gillen D. And Waters W.G.H., 2005. Towards Estimating the Social and Environmental Costs of Transportation in Canada, Report for Transport Canada, September 2005.

Page 89
9 Abbreviations AAQ NEPM Ambient Air Quality National Environment Protection Measure ABARE Australian Bureau of Agricultural and Resource Economics and Sciences ABS Australian Bureau of Standards ACRE Australian Centre for Renewable Energy ADO Automotive Diesel Oil AESS Automatic Engine Start Stop ANU Australian National University ARA Australasian Railway Association ARIC Australian Railway Industry Corporation ARTC Australian Rail Track Corporation ATA Australian Trucking Association ATO Australian Tax Office AWB Australian Wheat Board BaU Business as Usual BITRA Bureau of Infrastructure, Transport and Regional Economics CARB California Air Resources Board CRC Rail Cooperative Research Centre (now Rail Innovation Australia) CNG compressed natural gas CO/CO2 carbon monoxide / carbon dioxide dB /dBA decibels DEC Department of Environment and Conservation (now OEH) DECCW Department of Environment, Climate Change and Water NSW (now OEH) DIISR Department of Innovation Industry Science and Research DMU diesel multiple unit DOCs diesel oxidation catalysts DOT Department of Transport (Victoria) DPCD Department of Planning and Community Development (Victoria)

Page 90
DP&I Department of Planning and Infrastructure DPF diesel particulate filters DPM diesel particulate matter DRET Department of Resources, Energy and Tourism ECP brakes electronically controlled pneumatic brakes EEO energy efficiency opportunity EGR exhaust gas recirculation EMD Electro Motive Diesels EPA Environment Protection Authority EPL environment protection licence EU European Union GE General Electric GMR Greater Metropolitan Region GTK gross-tonnes-kilometre hP horsepower IDF Industrial Diesel Fuel IfM ECS University of Cambridge Institute for Manufacturing Education and Consultancy Services INP Industrial Noise Policy (NSW) ktpa kilotonnes per annum LNG liquefied natural gas MOU Memorandums of Understanding NEPC National Environment Protection Council NEPM National Environmental Protection Measure NPI National Pollutant Inventory NOx Oxides of nitrogen OEH NSW Office of Environment and Heritage OEM original equipment manufacturer
Page 91
PAH polycyclic aromatic hydrocarbons PM Particulate matter PM10 Particulate matter with an aerodynamic diameter of less than 10 microns PM2.5 Particulate matter with an aerodynamic diameter of less than 2.5 microns PN Pacific National ppm parts per million QR National Queensland Rail National RIA Rail Innovation Australia RIEC Rail Industry Environment Committee RING Rail Infrastructure Noise Guideline RISP rail industry service providers RISSB Rail Industry Safety and Standards Board SEPP State Environmental Planning Policy SCG Strategic Connection Group SCR selective catalytic reduction SO2 sulfur dioxide THC total hydrocarbons tpa tonnes per annum TPM total particulate matter TSI Technical Specification for Interoperability UIC International Union of Railways ULSD ultra low sulfur diesel US United States US-EPA United States Environmental Protection Agency VOC volatile organic compound WHO World Health Organisation
Page 92
10 Appendix A Additional Information used for Calculating Emission Reductions and Costs for Selected Measures

National Measures
Measure
No. Locos
Affected
Details on Locomotives Affected
Assumptions for Emission Reduction Estimates
Details for Costing (AUD$)
1 Repower/replace solution (ARA, 2010)
150-183 150-183 locomotives being repowered over 10 years.
Emission reduction estimate ranges taken from ARA (2010)
$1.5 to $2.5 million per locomotive for repowering; $3.5 to $6 million per locomotive for replacement (ARA, 2010)
2 Upgrading of existing fleet (accelerated overhaul)
1238 1154 currently active locomotives + 35 future active locomotives upgraded from Pre Tier 0 to Tier 0 (total 1189); 49 locomotives upgraded from Pre Tier 0 to Tier 1
Reductions estimated based shift from Pre Tier 0 to Tier 0 (28-34% reduction in NOx; no reduction in PM); and from Pre Tier 0 to Tier 1 (43-48% reduction in NOx; 2-42% reduction in PM)
Pre Tier 0 to Tier 0 costs: $50k to $300k per locomotive; Pre Tier 0 to Tier 1 costs: $400k to $700k per locomotive (excluding normal overhaul costs) (NCEE, 2012). Normal overhaul cost would be in the order of $1m to $1.2m for a complete locomotive, including bogie, overhaul. Such costs were excluded for this measure it being assumed that such overhauls would take place every about 10 years in any case.
3 New locomotives Tier 2
871 871 new locomotives Application of Tier 2 emission factors when new locomotives are projected to be introduced
Additional hardware costs and 2% fuel penalty for purchasing and operating Tier 2 over Tier 1 is calculated to be approximately $475k per locomotive. (NCEE, 2012).
4 New locomotives Tier 4
871 871 new locomotives Application of Tier 4 emission factors when new locomotives are projected to be introduced
$700k per new locomotive, including $500k capital costs and $200k increase in maintenance and fuel costs based on NCEE 2012. CARB 2009 indicates an additional $500k for Tier 4 DPF and SCR after-treatment.
5 Accelerated old line haul replacement to achieve Tier 4 and new locomotives Tier 4 compliant
1451 871 new; 580 >25 yrs old in 2012 (over 20 yrs to retirement)
Application of Tier 4 emission factors when new locomotives are projected to be introduced; application of Tier 4 emission factors in the short-term for accelerated existing old line haul locomotives to be replaced.
$4-6.5 million per locomotive to be replaced and $700k for new locomotives. ARA 2010 gives capital cost of replacement Stage III compliant locomotives as $3.5 - $6 million; CARB 2009 indicates an additional $500k for Tier 4 DPF and SCR after-treatment. Additional $200k per locomotive for additional maintenance and fuel costs as per NCEE 2012.
6 Replace switching locos with gen-sets
138 138 switch locomotives, using over 100kLpa of fuel and having over 20years to retirement
Gen-set emission factors applied from CARB 2009: 3.0 g/bhp-hr (12 g/litre) for NOx and 0.1 g/bhp-hr (0.4 g/litre) for PM10.
$1-$1.4 million per locomotive assumed (a). According to Rare Consulting (2012) switcher locomotives cost from US$1.3m to US$1.4m each. However, rebuilt switcher locomotives are 30–40% less expensive but still up to six times more expensive than regular locomotives. No information is available with regards to the capital cost for line haul applications.
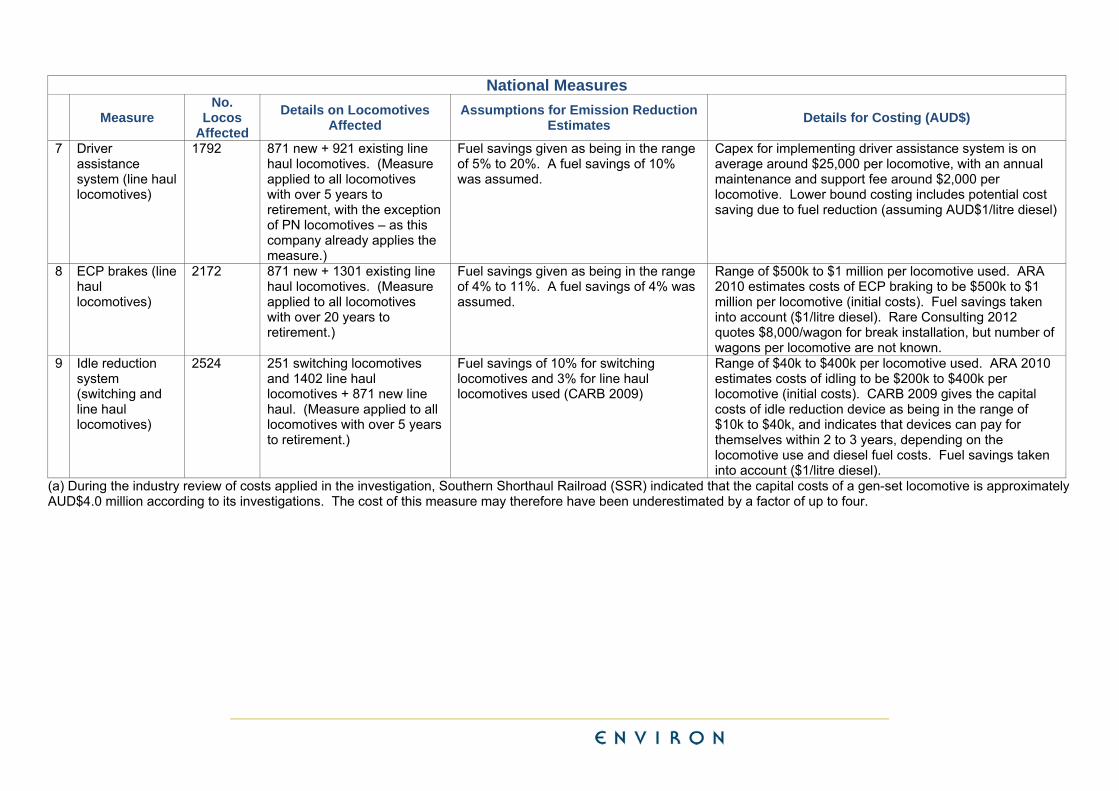
National Measures
Measure
No. Locos
Affected
Details on Locomotives Affected
Assumptions for Emission Reduction Estimates
Details for Costing (AUD$)
7 Driver assistance system (line haul locomotives)
1792 871 new + 921 existing line haul locomotives. (Measure applied to all locomotives with over 5 years to retirement, with the exception of PN locomotives – as this company already applies the measure.)
Fuel savings given as being in the range of 5% to 20%. A fuel savings of 10% was assumed.
Capex for implementing driver assistance system is on average around $25,000 per locomotive, with an annual maintenance and support fee around $2,000 per locomotive. Lower bound costing includes potential cost saving due to fuel reduction (assuming AUD$1/litre diesel)
8 ECP brakes (line haul locomotives)
2172 871 new + 1301 existing line haul locomotives. (Measure applied to all locomotives with over 20 years to retirement.)
Fuel savings given as being in the range of 4% to 11%. A fuel savings of 4% was assumed.
Range of $500k to $1 million per locomotive used. ARA 2010 estimates costs of ECP braking to be $500k to $1 million per locomotive (initial costs). Fuel savings taken into account ($1/litre diesel). Rare Consulting 2012 quotes $8,000/wagon for break installation, but number of wagons per locomotive are not known.
9 Idle reduction system (switching and line haul locomotives)
2524 251 switching locomotives and 1402 line haul locomotives + 871 new line haul. (Measure applied to all locomotives with over 5 years to retirement.)
Fuel savings of 10% for switching locomotives and 3% for line haul locomotives used (CARB 2009)
Range of $40k to $400k per locomotive used. ARA 2010 estimates costs of idling to be $200k to $400k per locomotive (initial costs). CARB 2009 gives the capital costs of idle reduction device as being in the range of $10k to $40k, and indicates that devices can pay for themselves within 2 to 3 years, depending on the locomotive use and diesel fuel costs. Fuel savings taken into account ($1/litre diesel).
(a) During the industry review of costs applied in the investigation, Southern Shorthaul Railroad (SSR) indicated that the capital costs of a gen-set locomotive is approximately AUD$4.0 million according to its investigations. The cost of this measure may therefore have been underestimated by a factor of up to four.
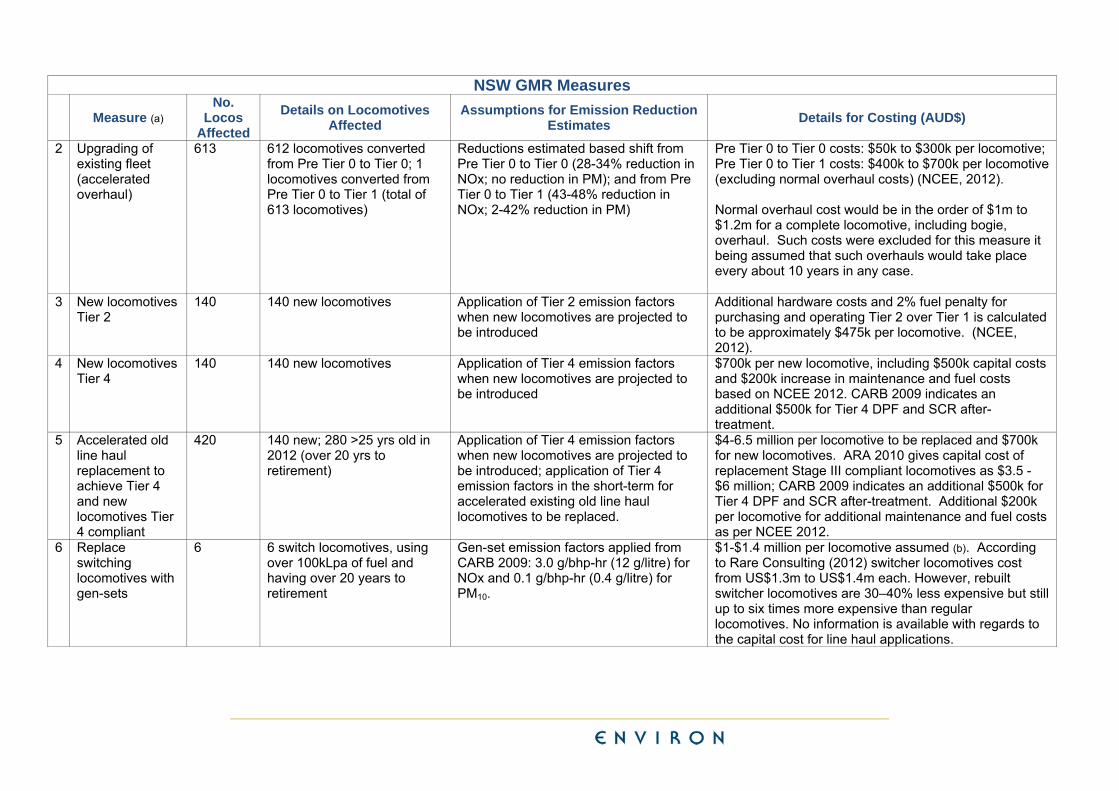
NSW GMR Measures
Measure (a)
No. Locos
Affected
Details on Locomotives Affected
Assumptions for Emission Reduction Estimates
Details for Costing (AUD$)
2 Upgrading of existing fleet (accelerated overhaul)
613 612 locomotives converted from Pre Tier 0 to Tier 0; 1 locomotives converted from Pre Tier 0 to Tier 1 (total of 613 locomotives)
Reductions estimated based shift from Pre Tier 0 to Tier 0 (28-34% reduction in NOx; no reduction in PM); and from Pre Tier 0 to Tier 1 (43-48% reduction in NOx; 2-42% reduction in PM)
Pre Tier 0 to Tier 0 costs: $50k to $300k per locomotive; Pre Tier 0 to Tier 1 costs: $400k to $700k per locomotive (excluding normal overhaul costs) (NCEE, 2012). Normal overhaul cost would be in the order of $1m to $1.2m for a complete locomotive, including bogie, overhaul. Such costs were excluded for this measure it being assumed that such overhauls would take place every about 10 years in any case.
3 New locomotives Tier 2
140 140 new locomotives Application of Tier 2 emission factors when new locomotives are projected to be introduced
Additional hardware costs and 2% fuel penalty for purchasing and operating Tier 2 over Tier 1 is calculated to be approximately $475k per locomotive. (NCEE, 2012).
4 New locomotives Tier 4
140 140 new locomotives Application of Tier 4 emission factors when new locomotives are projected to be introduced
$700k per new locomotive, including $500k capital costs and $200k increase in maintenance and fuel costs based on NCEE 2012. CARB 2009 indicates an additional $500k for Tier 4 DPF and SCR after-treatment.
5 Accelerated old line haul replacement to achieve Tier 4 and new locomotives Tier 4 compliant
420 140 new; 280 >25 yrs old in 2012 (over 20 yrs to retirement)
Application of Tier 4 emission factors when new locomotives are projected to be introduced; application of Tier 4 emission factors in the short-term for accelerated existing old line haul locomotives to be replaced.
$4-6.5 million per locomotive to be replaced and $700k for new locomotives. ARA 2010 gives capital cost of replacement Stage III compliant locomotives as $3.5 - $6 million; CARB 2009 indicates an additional $500k for Tier 4 DPF and SCR after-treatment. Additional $200k per locomotive for additional maintenance and fuel costs as per NCEE 2012.
6 Replace switching locomotives with gen-sets
6 6 switch locomotives, using over 100kLpa of fuel and having over 20 years to retirement
Gen-set emission factors applied from CARB 2009: 3.0 g/bhp-hr (12 g/litre) for NOx and 0.1 g/bhp-hr (0.4 g/litre) for PM10.
$1-$1.4 million per locomotive assumed (b). According to Rare Consulting (2012) switcher locomotives cost from US$1.3m to US$1.4m each. However, rebuilt switcher locomotives are 30–40% less expensive but still up to six times more expensive than regular locomotives. No information is available with regards to the capital cost for line haul applications.

NSW GMR Measures
Measure (a)
No. Locos
Affected
Details on Locomotives Affected
Assumptions for Emission Reduction Estimates
Details for Costing (AUD$)
7 Driver assistance system (line haul locomotives)
353 353 locomotives including 140 new locomotives. (Measure applied to all locomotives with over 5 years to retirement, with the exception of PN locomotives – as this company already applies the measure.)
Fuel savings given as being in the range of 5% to 20%. A fuel savings of 10% was assumed.
Capex for implementing DAS is on average around $25,000 per locomotive, with an annual maintenance and support fee around $2,000 per locomotive. Lower bound costing includes potential cost saving due to fuel reduction (assuming AUD$1/litre diesel)
8 ECP brakes (line haul locomotives)
764 764 locomotives including 140 new locomotives (Measure applied to all locomotives with over 20 years to retirement.)
Fuel savings given as being in the range of 4% to 11%. A fuel savings of 4% was assumed.
Range of $500k to $1 million per locomotive used. ARA 2010 estimates costs of ECP Braking to be $500k to $1 million per locomotive (initial costs). Fuel savings taken into account ($1/litre diesel). Rare Consulting 2012 quotes $8,000/wagon for break installation, but number of wagons per locomotive are not known.
9 Idle reduction system (switching and line haul locomotives)
818 818 locomotives including 140 new locomotives (measure applied to all locomotives with over 5 years to retirement.)
Fuel savings of 10% for switching locomotives and 3% for line haul locomotives used (CARB 2009)
Range of $40k to $400k per locomotive used. ARA 2010 estimates costs of idling to be $200k to $400k per locomotive (initial costs). CARB 2009 gives the capital costs of idle reduction device as being in the range of $10k to $40k, and indicates that devices can pay for themselves within 2 to 3 years, depending on the locomotive use and diesel fuel costs. Fuel savings taken into account ($1/litre diesel).
(a) Repower/replace solution (ARA, 2010) is not quantifiable as the urban/non-urban distribution of emission reductions is not known. (b) During the industry review of costs applied in the investigation, Southern Shorthaul Railroad (SSR) indicated that the capital costs of a gen-set locomotive is approximately AUD$4.0
million according to its investigations. The cost of this measure may therefore have been underestimated by a factor of up to four.

Page 97
11 Appendix B Australian Rail Operators and National Locomotive Fleets
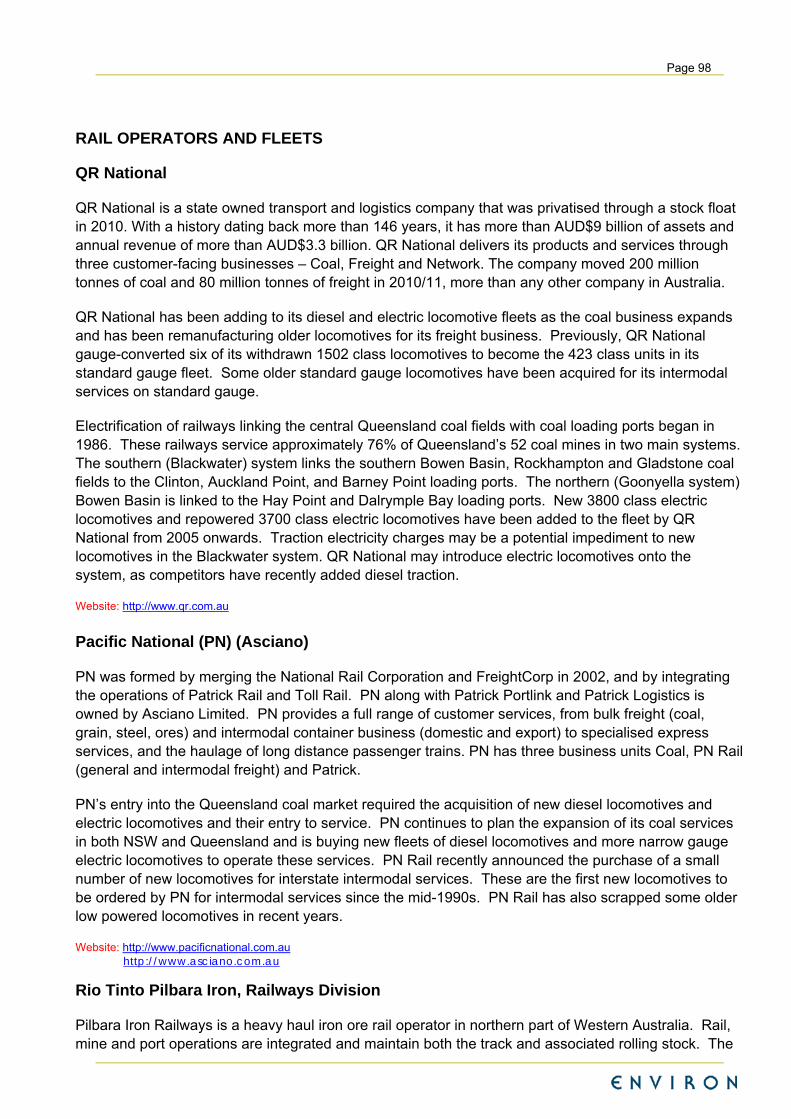
Page 98
RAIL OPERATORS AND FLEETS
QR National
QR National is a state owned transport and logistics company that was privatised through a stock float in 2010. With a history dating back more than 146 years, it has more than AUD$9 billion of assets and annual revenue of more than AUD$3.3 billion. QR National delivers its products and services through three customer-facing businesses – Coal, Freight and Network. The company moved 200 million tonnes of coal and 80 million tonnes of freight in 2010/11, more than any other company in Australia.
QR National has been adding to its diesel and electric locomotive fleets as the coal business expands and has been remanufacturing older locomotives for its freight business. Previously, QR National gauge-converted six of its withdrawn 1502 class locomotives to become the 423 class units in its standard gauge fleet. Some older standard gauge locomotives have been acquired for its intermodal services on standard gauge.
Electrification of railways linking the central Queensland coal fields with coal loading ports began in 1986. These railways service approximately 76% of Queensland’s 52 coal mines in two main systems. The southern (Blackwater) system links the southern Bowen Basin, Rockhampton and Gladstone coal fields to the Clinton, Auckland Point, and Barney Point loading ports. The northern (Goonyella system) Bowen Basin is linked to the Hay Point and Dalrymple Bay loading ports. New 3800 class electric locomotives and repowered 3700 class electric locomotives have been added to the fleet by QR National from 2005 onwards. Traction electricity charges may be a potential impediment to new locomotives in the Blackwater system. QR National may introduce electric locomotives onto the system, as competitors have recently added diesel traction.
Website: http://www.qr.com.au Pacific National (PN) (Asciano)
PN was formed by merging the National Rail Corporation and FreightCorp in 2002, and by integrating the operations of Patrick Rail and Toll Rail. PN along with Patrick Portlink and Patrick Logistics is owned by Asciano Limited. PN provides a full range of customer services, from bulk freight (coal, grain, steel, ores) and intermodal container business (domestic and export) to specialised express services, and the haulage of long distance passenger trains. PN has three business units Coal, PN Rail (general and intermodal freight) and Patrick.
PN’s entry into the Queensland coal market required the acquisition of new diesel locomotives and electric locomotives and their entry to service. PN continues to plan the expansion of its coal services in both NSW and Queensland and is buying new fleets of diesel locomotives and more narrow gauge electric locomotives to operate these services. PN Rail recently announced the purchase of a small number of new locomotives for interstate intermodal services. These are the first new locomotives to be ordered by PN for intermodal services since the mid-1990s. PN Rail has also scrapped some older low powered locomotives in recent years.
Website: http://www.pacificnational.com.au http://www.asciano.com.au
Rio Tinto Pilbara Iron, Railways Division
Pilbara Iron Railways is a heavy haul iron ore rail operator in northern part of Western Australia. Rail, mine and port operations are integrated and maintain both the track and associated rolling stock. The

Page 99
operation has seen rapid expansion activity over recent years in line with the increased demand for iron ore with plans to nearly double production in less than 10 years. Expansion activities include additional track, provision of infrastructure to new mines and increases in rolling stock.
The locomotive fleet will continue to expand with the purchase of further GE EVO Series locomotives. The oldest Dash 8 locomotives continue to be retired as new locomotive orders are received. Trains have nominally 2 locomotives and 234 wagons and are 3km long and weigh 35,000 tonnes.
Rio Tinto Aluminium, also has a standard gauge railway in North Queensland that connects Andoom (mine) with Weipa (port). The line carries some 10 million tonnes of bauxite ore annually. The railway is operated with two diesel-electric locomotives and 120 bottom-discharge ore (124 tonne gross) wagons and nine freight wagons. Two new JT42C 2200kW locomotives were delivered in recent years from Downer Edie Rail for the Weipa operation.
Website: http://www.pilbarairon.com
BHP Billiton
BHP Billiton is a heavy haul operator in the Pilbara region of West Australia which has plans to double its output in the next 10 years.
BHP Billiton diesel locomotives, including GE AC6000 E Dash 8 locomotives are progressively being replaced by EMD SD70Ace locomotives. From 2003 the fleet was supplemented by 20 second-hand General Motors SD40-2 locomotives initially procured as a stopgap measure pending new locomotive orders. New traction has taken the form of SD70ACe locomotives, ordered from Edie Rail but built by Electro-Motive Diesel Inc in Canada and more recently in built in the USA. These continue to be ordered in batches of up to 20 at a time.
Trains are up to 336 wagons long with six locomotives in three pairs distributed throughout the train. Total train mass is 48,000 tonnes.
Website: http://www.bhpbilliton.com Genesee & Wyoming Australia (GWA)
Genesee & Wyoming Australia (GWA) is a South Australian based company, operating over nearly 5,000 kilometres of track principally in South Australia and Victoria providing intrastate and interstate haulage of bulk commodities (including grain, steel, gypsum and minerals) to key industries as well as short haul shunting and terminal operations.
It is also the owner and operator of the Alice Springs to Darwin line and a major supplier of contracted services, such as locomotives, wagons and crews to freight forwarders and infrastructure service providers operating on the interstate rail network.
GWA has recently bought 7 new diesel locomotives with AC drive to support its expanding business.
Website: http://www.gwrr.com QUBE Logistics
In 2010, QUBE Logistics acquired South Spur Rail Services (SSRS) along with its rail subsidiaries that made up a wholly owned division of the Coote Industrial Group. QUBE’s Ports Logistics Operator, P&O
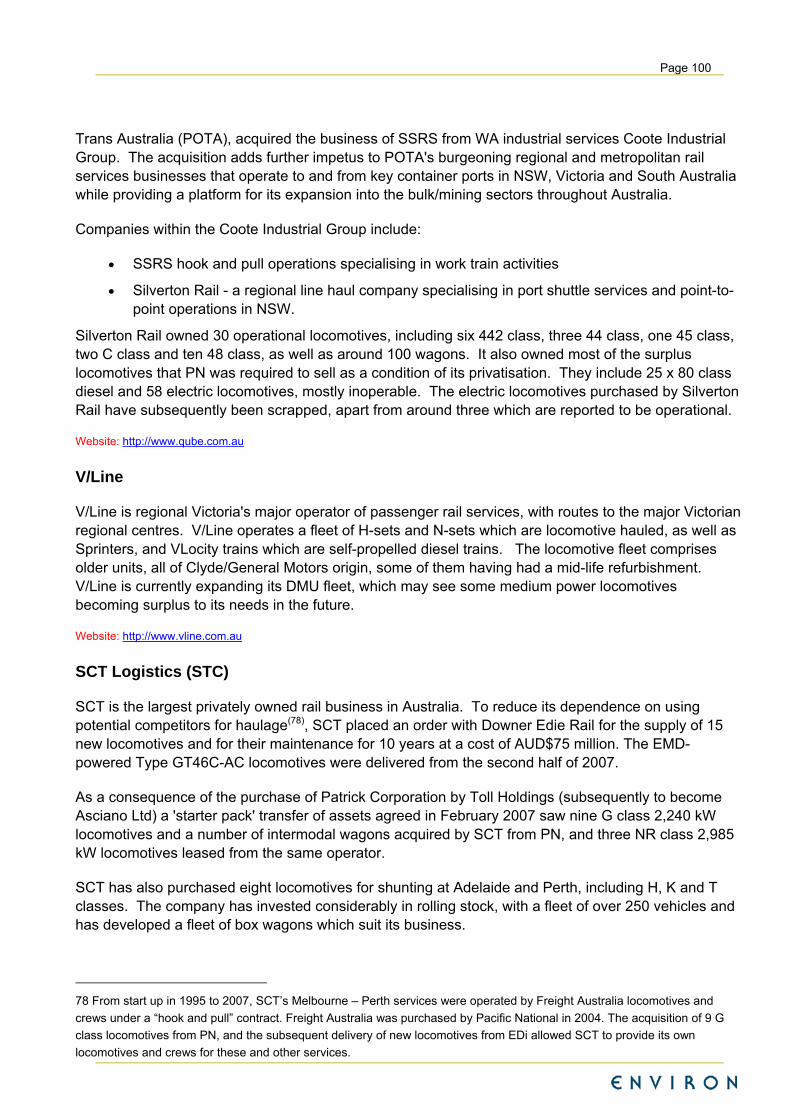
Page 100
Trans Australia (POTA), acquired the business of SSRS from WA industrial services Coote Industrial Group. The acquisition adds further impetus to POTA's burgeoning regional and metropolitan rail services businesses that operate to and from key container ports in NSW, Victoria and South Australia while providing a platform for its expansion into the bulk/mining sectors throughout Australia.
Companies within the Coote Industrial Group include:
SSRS hook and pull operations specialising in work train activities
Silverton Rail - a regional line haul company specialising in port shuttle services and point-to-point operations in NSW.
Silverton Rail owned 30 operational locomotives, including six 442 class, three 44 class, one 45 class, two C class and ten 48 class, as well as around 100 wagons. It also owned most of the surplus locomotives that PN was required to sell as a condition of its privatisation. They include 25 x 80 class diesel and 58 electric locomotives, mostly inoperable. The electric locomotives purchased by Silverton Rail have subsequently been scrapped, apart from around three which are reported to be operational.
Website: http://www.qube.com.au
V/Line
V/Line is regional Victoria's major operator of passenger rail services, with routes to the major Victorian regional centres. V/Line operates a fleet of H-sets and N-sets which are locomotive hauled, as well as Sprinters, and VLocity trains which are self-propelled diesel trains. The locomotive fleet comprises older units, all of Clyde/General Motors origin, some of them having had a mid-life refurbishment. V/Line is currently expanding its DMU fleet, which may see some medium power locomotives becoming surplus to its needs in the future.
Website: http://www.vline.com.au SCT Logistics (STC)
SCT is the largest privately owned rail business in Australia. To reduce its dependence on using potential competitors for haulage(78), SCT placed an order with Downer Edie Rail for the supply of 15 new locomotives and for their maintenance for 10 years at a cost of AUD$75 million. The EMD-powered Type GT46C-AC locomotives were delivered from the second half of 2007.
As a consequence of the purchase of Patrick Corporation by Toll Holdings (subsequently to become Asciano Ltd) a 'starter pack' transfer of assets agreed in February 2007 saw nine G class 2,240 kW locomotives and a number of intermodal wagons acquired by SCT from PN, and three NR class 2,985 kW locomotives leased from the same operator.
SCT has also purchased eight locomotives for shunting at Adelaide and Perth, including H, K and T classes. The company has invested considerably in rolling stock, with a fleet of over 250 vehicles and has developed a fleet of box wagons which suit its business.
78 From start up in 1995 to 2007, SCT’s Melbourne – Perth services were operated by Freight Australia locomotives and
crews under a “hook and pull” contract. Freight Australia was purchased by Pacific National in 2004. The acquisition of 9 G
class locomotives from PN, and the subsequent delivery of new locomotives from EDi allowed SCT to provide its own
locomotives and crews for these and other services.

Page 101
In February 2012 SCT took delivery of the first six of an order for sixteen 2,700kW AC drive diesel locomotives from China Southern Rail. These are likely to be the first Euro IIIA capable locomotives to enter service in Australia.
Website: http://www.sctlogistics.com.au CountryLink
CountryLink's all-diesel fleet includes XPT trains with a power car at each end of a set of trailers. CountryLink operates 19 XPT power cars, which have been re-engined with new Paxman VP185 engines in 2002. Although these power cars are theoretically capable of hauling small high speed freight trains, RailCorp has no current plan to release them to the market. The current engines are not believed to be Euro IIIA compliant or capable of being made so.
Website http://www.countrylink.info/travelling_with_us/our_fleet Fortescue Metals Group Ltd (FMG)
FMG has established large scale mining operations in Western Australia in conjunction with an open access port and rail network for the delivery of iron ore to world markets.
In 2007 FMG received 15 C44-9W diesel-electric locomotives from GE Transportation in the US. It has more recently acquired nine EMD SD90 locomotives, however only four are currently in service while the other five are being overhauled in the US (including reconfiguration to use the 710 engine). A further order for 19 EMD SD70ACe locomotives has been placed but deliveries have not yet commenced.
Website http://www.fmgl.com.au Great Southern Railway (GSR)
GSR owns and operates The Ghan (Adelaide - Darwin), the Indian Pacific (Sydney - Perth) and The Overland (Adelaide - Melbourne) rail passenger services.
GSR is the owner of 111 passenger cars and 14 motorail wagons, which are maintained under contract by United Group Rail. The company does not own any locomotives. Traction and crews are hired from PN and primarily consists of NR class locomotives.
Website: http://www.gsr.com.au Manildra Group
The Manildra Group produces industrial and domestic flour in NSW. Manildra is an accredited railway owner and operator within NSW. Manildra operate eight shunting locomotives at their sites for placement of wagons to load and unload.
Website: http://www.manildra.com.au El Zorro
Based in Victoria, El Zorro is an accredited rail operator on both standard and broad gauges, and operates infrastructure trains, electric multiple unit transfer trains, and regular freight trains.
Page 102
El Zorro was recently reported as signing a deal that will see the Australian Wheat Board (AWB) invest in 84 grain wagons and El Zorro commission two or three more locomotives from Melbourne manufacturer Avteq. The five-year agreement, with the option of a further five years, will result in El Zorro operating four train sets in NSW and Victoria. El Zorro is reported as currently operating two locomotives capable of hauling 83 wagons it had hired off other rail companies. It is also reported that Chicago Freight Car Leasing Company had agreed to lease El Zorro 42 wagons.
Website: N/A
Independent Rail Australia (IR)
IR operates a number of train services in NSW. These are summarised as follows:
Regional freight train services across NSW, one example being a Blayney to Port Botany container service three times per week;
Shuttle train services between Port Botany and destinations in the Sydney metropolitan area; and
Shunting services at Port Botany.
IR owns and operates a number of older locomotives with engine technology from the 1950s and
1960s. It also operates leased rolling stock.
Website: http://www.independentrail.com.au/ir/index.htm
Other Small Operators
There are a range of existing and emerging small freight operators throughout Australia. Two of these are summarised below:
Southern Short haul Railroad (SSR): In 2012 the SSR locomotive fleet comprised one B class, one S class and two T class diesel locomotives which date from the 1950s; and
CRT Group does not operate a main line fleet but owns 2 x X200 class diesel-hydraulic locomotives which are used for yard shunting. CRT Group also own 2 Cargo Sprinter units which have Euro IIIA engines fitted.
EMISSIONS PERFORMANCE OF NEW LOCOMOTIVES SOLD IN AUSTRALIA
New locomotives sold in Australia have until recently only had medium speed diesel engines from US based manufacturers Electro Motive Diesels (EMD) and General Electric (GE). Prior to that there were also medium speed diesel engines from UK manufacturers. The exceptions are the XPT passenger trains operated by RailCorp and Diesel Multiple Unit passenger trains, which all have high speed diesel engines.
Some operators are looking to high speed diesel to lower the market price of new locomotives in Australia, which had exceeded AUD$6 million each for high power standard and narrow gauge locomotives (prior to the appreciation of the Australian Dollar since 2009). One high speed engine for this new generation of locomotives appears to be the MTU 4000V20R43 which is a 20 cylinder, 2700kW engine that is Euro IIIA compliant and Euro IIIB ready. This engine has been introduced by
Page 103
KiwiRail (New Zealand) in their newest locomotives. There are other engines also about to enter service in Australia from large manufacturers of road truck engines, Caterpillar and Cummins.
During the industry comment period one rail operator noted that Kiwi Rail and SCT have introduced the MTU engine, but that these operators are not representative of other rail operators who base their technical and financial decisions on a different basis.
The main engine families are examined in the following sections:
Electro Motive Diesels (EMD)
EMD’s current engine family is the 710G engine family which has a displacement of 710 cubic inches per cylinder and is a turbo-supercharged two stroke cycle engine that was introduced in the mid-1980s. This engine family has since evolved to achieve both US Tier 2 compliance and Euro IIIA compliance when used with EMD’s electronic fuel injection control system. This compliance is achieved without pre or post treatment of the fuel or exhaust gases.
The 710G engine is used in Australia in 12 and 16 cylinder variants which produce up to 3360 brake kW (4500 brake hp) in 16 cylinder form. It is assumed they are not loaded with Tier 2 engine control software in any current application. The nearest is the Tier 1 software that is loaded onto the SCT class and similar locomotives, which is the Tier 2 software without retarded injection timing.
EMD also offer an 8 cylinder version for low emissions repowering of older EMD powered locomotives in the 1490 to 1640 brake kW (2000 to 2200 brake horsepower) range. To date no one in Australia has initiated such an upgrade.
EMD’s earlier engine families are the 567C/567B, 645E and 645F families which are also two stroke cycle engines. Parts support from EMD has largely ceased for the 567 engine which dates from the 1950s, however some of these engines remain in service through the use of compatible 645 cylinder and other assemblies.
The 645E engine family dates from the 1960s,supercharged producing up to 2460 brake kW (3300 brake horsepower) in 16 cylinder form. In almost all Australian applications 645E engines are fitted with an electro-hydraulic engine control system. The 645F engine family is in use in Australia only as a turbo-supercharged 16 cylinder version producing 2835 brake kW (3800 brake horsepower). Upgrade kits of replacement engine internal and accessory components exist for the improvement of emissions performance to Tier 0 without the use of pre or post treatment of fuel or exhaust gases.
EMD also developed an ‘H’ engine family which is only present in the four SD90 locomotives in service. As these are located in the Pilbara region of Western Australia and are to be converted to have the 710G engine retrofitted, they are not considered further in this report.
Downer Edie Rail is the EMD licensee in Australia.
General Electric Transportation Services (GE)
GE have three engine families in service in Australia which are the 7FDL , 7HDL and GEEVO families. GE have announced the introduction of a fourth family, the PowerHaul family, which is aimed at narrow gauge service in the Queensland coal fields. The 7FDL, 7HDL and GEEVO are turbocharged, four stroke cycle engines.

Page 104
The majority of GE engined locomotives in Australia use a version of the 7FDL engine which dates from the early 1960s in its earliest form.
The 7FDL is present in Australia in both 12 and 16 cylinder forms with the 16 cylinder version producing up to 3400 brake kW (4550 brake horsepower). Currently, the 7FDL is capable of only Tier 0 performance or being upgraded to Tier 0 performance. A Tier 1 tuning for the 7FDL is said to exist but is held to be significantly less fuel efficient than the Tier 0 tuning. It is likely that all of the 7FDL engine locomotives currently in service in Australia are running at Pre Tier 0 levels.
The 7HDL engine dates from the 1990s and is only present in 7 AC 6000 locomotives operated by BHP Billiton in the Pilbara region of Western Australia. These higher horsepower units were developed by GE for the next phase of the development of North American locomotives. However, the US market was unreceptive and has standardised on locomotives of approximately 4400 horsepower rather than overcoming the difficulties of integrating 6000 horsepower locomotives into their operations. BHP Billiton has elected to renew their locomotive fleet with EMD SD70ACe locomotives and so the remaining AC 6000 locomotives are expected to retire in the next 10 years.
The GEEVO engine is Tier 2 capable. It was the successor to the 7HDL engine and is present in Australia only in 12 cylinder form producing 3400 brake kW (4550 brake horsepower). The GEEVO engine is currently only available in the US GEEVO locomotives which are fully imported for operation in the Pilbara where the outline gauge is taller than the Australian specification. Their application elsewhere would require the development of a platform to accommodate this engine for compliance to the Australian specification.
The PowerHaul locomotive engine is derived from the Jenbacher stationary engine running on gas. The engine is a high speed, turbocharged, four stroke diesel. The PowerHaul family is Euro IIIA compliant and is in service in the UK in class 70 locomotives. The exact emissions status for Australian service is not known as a prototype locomotive is not yet in service in Australia.
United Group Limited is the GE Transportation licensee in Australia.
Older Engine Designs
There are three groups of older engine designs in use in Australia:
American Locomotive Company (ALCO)
ALCO provided engines for locomotives built in Australia from the 1950s to the early 1980s and then withdrew from the general freight locomotive engine market worldwide. Today, the ALCO engines in service remain that way based on parts manufactured in India which adopted the ALCO engine and developed indigenous manufacture of them. There is no currently known upgrade path to Tier 0 performance for the engine itself and hence all ALCO engine locomotives are considered to be Pre Tier 0 in terms of their emissions performance.
English Electric
English Electric engines were fitted to locomotives built in Australia from the 1950s to the 1970s. They remain in service today based on parts supply from General Electric Company of the UK. There is no known path for these engines to Tier 0 and they are considered to have Pre Tier 0 performance.

Page 105
Miscellaneous Small Engines
This group contains a small number of Caterpillar and Cummins engines in rail tractors and low powered branch line locomotives. They are all considered to have Pre Tier 0 performance and there is no upgrade path for them apart from replacement with a new engine of current design and emissions performance.