
Locating groundwater resources for Aboriginal communities ...
21
Locating groundwater resources for Aboriginal communities in remote and arid parts of South Australia D. Pedler-Jones Supervisor: Graham Heinson
Transcript of Locating groundwater resources for Aboriginal communities ...
Locating groundwater resources for Aboriginal
communities in remote and arid parts of South
Australia
D. Pedler-Jones
Supervisor: Graham Heinson
LocatinggroundwaterresourcesforAboriginalcommunitiesinremoteandaridpartsofSouthAustralia
DavidPedler-Jones1148574
Abstract
AboriginalcommunitiesinremoteareasofSouthAustraliarequireaccesstoborewaterfortheirnon-potablesuppliesduetothearidityoftheregion.Thiswaterisoftenfoundindeep,fracturedrockaquifers.Duetotheanisotropicandheterogeneousnatureoffracturedrockaquifers,thereisasignificantriskofdrillingcostlydryboreholesintheattempttofindwater.Thisprojectisapilotstudytogaugetheeffectivenessofmagnetotellurics-ageophysicalmethodthatimagesthedistributionofelectricalconductivityinthesubsurface-inmappingandcharacterisingfracturedrockaquifersinordertoreducetheriskofdrillingdryboreholes.ThissurveywascarriedoutintheNipapanhaCommunity,intheNorthernFlindersRanges,SouthAustralia.Thereisaneedforanincreaseinborewatersupplyfromthelocalfracturedrockaquifer.Geophysical,hydrogeologicalandstructuralresearchhasbeencarriedoutinthearea,whichwillactasaguideforthissurvey,sothatknowledgeandtechniqueslearnedmaybeappliedinpoorlyconstrainedareas.
Magnetotelluricdatawererecordedat3000Hzand500Hzover40sitesaroundthetargetareainordertocreateaseriesof52Dprofilesaswellasamapofphasetensorsatvariousfrequencies.ControlledsourcemagnetotelluricdatafromaprevioussurveycarriedoutbyZongeEngineeringwereobtainedandreprocessedandinvertedtocreateaseriesof6inversionsinordertoincreasecoverageofthesurvey.Interpretationoftheinversionsandphasetensorsinconjunctionwithhydrogeologicalinformationwasabletoidentifyareasofanomalousapparentconductivity,possiblycorrespondingtoincreasedwatercontent.Predominantdirectionsofconductivity,correspondingtofractureorientationthroughouttheareawerealsoidentified.
Introduction
ManyAboriginalcommunitiesinremoteandaridpartsofSouthAustraliacurrentlyrelyongroundwaterresourceslocatedindeepaquifers(>50mtothewatertable)infracturedrockfornon-potablewatersupplies.Rainfallintheseareasishighlyvariable,rangingfromperiodsofdroughttooccasionalveryhighrainfallevents.Thequalityandquantityofwateravailablefromfracturedfrockaquifersisvariableonasmallscale,withunsuccessfulboresdrilledwithinmetresofproductivebores.
Duetotheremotenessofthesecommunities,drillingdryboreholescanbeaverycostlyexerciseanditishopedthattheuseofmagnetotellurics(MT)willbeabletoreducethisrisk.Thiswasachievedbyusingmagnetotelluricdatainagridoverprospectiveaquiferstoimagetwodimensionalslicesandphasetensorprofilesthroughthegeologytobetterunderstandthedimensionalityofelectricalconductivityinthesub-surface.BythenapplyingArchie’sLaw,whichdescribestherelationshipbetweenconductivity,porespaceandwatersalinity,wecanbetterdefinetheflowanddistributionofwaterinthesubsurface.
Fractureswithintheaquiferscanbedifficulttodetectforacombinationofreasons:
• Bulkporositiesoffracturedrockaquifersaregenerallylow,typicallylessthan1%,andwillreducewithdepth;thereforethebulkelectricalconductivitywillbeonlymarginallydependentonwatersaturation.
• Fracturesdisplayspatialheterogeneity,intermsoftheirlength,orientation,apertureandconnection,thereforetheelectricalconductivitywilldependonthepositionandorientationofmeasurement
• Theanalogybetweenthefluxoffluidandelectricalcurrentsisonlypartiallycorrect,inpracticeelectriccurrentshavehighmobilityandcanflowinalldirectionsundervariouselectricpotentialgradients,whereasfluidflowisgenerallydownwardsundergravitationalpressurepotential.
ThisprojectisbasedintheAboriginalcommunityofNipapanha,located500kmnorthofAdelaidebetweenLakeFromeandLakeTorrensintheArrowieBasinoftheNorthernFlindersRanges.Thecommunitywasestablishedinthe1930’sinanareawithonlyaspringfedcreekasawatersupply(Costaretal.2008).Borewateriscurrentlysuppliedbyadualreticulationsystemsourcingwaterfromtwowellswithsalinityinthe~1000mg/LTDSregionandyieldsof2.2and12L/swhichhavebeendeclining(Costaretal.2009).
Thisprojectisapilotstudyina2yearprogram,asthereareanumberofgeologicalandgeophysicalconstraintsalreadyplacedupontheareaaroundtheNipapanhacommunity,withknowledgegainedfromthisprojectusedtointerpretdatafromtheAnanguPitjantjatjaraYankunytjatjaralandsnextyear.
PreviousStudies
Thegeophysicalmethodsofdirectcurrent(DC)andinparticular,electromagnetics(EM)areusefulforprovidingathreedimensionalframeworktoworkfromwhendescribingfluidflowthroughheterogeneousfracturedmediums.Theyaremoreeffectivethanothermethodssuchasboreholelogging,drillcoreinvestigation,packertestsandpumptestsduetothesemethodsfailingtoquantifybulkpropertiesofthewholemedium;EMmethodsproducevolumetricdatawhichcanproducebulkhydraulicparametersasopposedtopointsourcetestresults(Skinner&Heinson2004).Theuseofmagnetotelluricstoimageaquifersystemshasbeencarriedoutinmultipleareasworld-wide(Turbergetal.1994,Newmanetal.2008,Arangoetal.2009,Chandrasekharetal.2009).
TheLlucmajoraquifersysteminSpainwasmappedwithahighdegreeofsuccessbyusing3Dforwardmodellingtakingintoaccounttheimpedancetensor.Thisapproachalloweddelineationofaquiferfeatureswithresistivitiesrangingacross2ordersofmagnitudeanddepthsofupto600metres.Byintegratingexplorationboreholelogsand2Dimpedanceprofiles,theworkerswereabletocreateanaccurate3Dmodelthatimageslayersoftheaquifersystemthatvaryinthickness,saturationandconnectivityinthreedimensions(Arangoetal.2009).Whilemostofthesepapersareconcernedwiththemagnetotelluriccharacterizationofporousaquifers,someworkhasbeendoneonfracturedrockaquifers,e.g.(Moecketal.2007)
ThegroundwaterfluxofthefracturedrockaquifersystemoftheCentralAlgarveBasininPortugalwasmappedwiththeuseofstresstensororientationscoupledwithmagnetotelluric,electromagneticandhydrogeologicaldata.Byintegratingthesedatasetstheworkerswereabletorevealsignificantrelationshipsbetweenhydraulicallyconductivestructuresandfaultandfracture
kinematicswithinthecurrentstressfield.Theyconcludedthatmagnetotelluricscombinedwithtectonicanalysis,remotesensingandhydrogeologicalinvestigationisausefultoolintheinvestigationofgroundwaterflowinfracturedrocksystems(Moecketal.2007).
Thedifferencesinthewayporousaquifersandfracturedaquifersconductgroundwatermakeitamuchlesscertainprocesswhenusingmagnetotelluricstoimagefracturedrockaquifers.Characterisingtheflowofanyfluidthroughfracturedrockrepresentsauniquechallengeduetoextremecontrastsinhydraulicconductivitybetweenfracturesandthesurroundingmatrix,rangingfromwellconnectedfracturenetworksprovidingaverypermeablesystemforfluidflowdowntototallysealedfracturesdisallowingfluidflow.Inordertocharacteriseanetworkoffracturedrockaquifersitisnecessarytodeterminethepercentageoffracturesineachnetworkthatisconductive,thedegreeofconductivity,andwhateffectthishasontheoverallanisotropyoftherockmass(Faybishenko2000).
Whenconsideringthedifferencesbetweenfracturedrockandporousrockaquifers,itisimportanttorealisethatthereisaspectrumofdifferentcombinationsoffracturedandporousaquifersystems.Poroussystemscanrangefromhomogenoustoheterogeneous,wherevariationsingrainsizecausepreferentialflowpathswithinthematrix.Therecanalsobefracturedporousmediawithgoodpermeabilitythroughoutthematrixleadingtogoodconnectivity,andfracturedporousmediathatisnotverypermeableleadingtopoorfracture-matrixconnectivity.Therearealsopurelyfracturedsystemswithnegligibleporosity(Cook2003).Structural,hydrogeologicalandgeophysicalstudieshavepreviouslybeencarriedoutintheNepabunnaarea,makingitidealforaproofofconcepttestarea,astherearemultiplestudiestocompareresultsagainst.
AhydrogeologicalinvestigationcarriedoutbyRead(1981)identifiedthevarioushydrogeologicalpropertiesofthelithologiespresentintheNepabunnaarea.ProductionfromwellstothenorthandwestofNepabunnawasstronglydependentonseasonalrechargeintotheMtMcKinlaycreek.Itwassuggestedthatstructurewasamoreimportantcontrolonpermeabilitythanlithology,butanotherstudybyRead(1984)suggestedthatdiminishingreturnsfromawellfieldintheNepabunnaSiltstoneduetodewateringwasduetopoorhydrogeologicalpropertiesofthesiltstone.TheWilkawillinaLimestonewasthenidentifiedasapotentialregionalaquiferduetoitshydrogeologicalpropertiesandgoodperformanceinpumpingtests.
PreviousgeophysicalworkhasbeencarriedoutintheNipapanhacommunitybytheDepartmentofWater,LandandBiodiversityConservation.Theirstudywasbasedaroundusingcontrolledsourceaudio-magnetotellurics(CSAMT)tocreateaseriesofeast-westalignedprofileswheretheybelievedtheprospectiveareatobe,duetoajuxtapositionofthemainaquiferunitandacreekwithareasonablesizedcatchmentarea.TheirstudywasnotveryeffectiveduetotheuseofCSAMTonlyprovidingscalardataandtherefore1Dinversionprofiles.Thislevelofinformationwasinsufficienttoproperlycharacterisethedistributionofwaterthroughouttheaquiferduetotherebeinganinsufficientcontrastofwaterfilledfracturesagainstthematrix(mostlikelybecausethefracturesystemwasnotsufficientlyprevalent,largeorsaturated)andadrillingprogramwasnotrecommendedwiththisdataasaguide(Costaretal.2008).ThisprojectaimstoexpandupontheworkbyCostaretal.(2008)byusingAMTtocreateaseriesof2Dinversionsandphasetensormapstoprovidegreaterinformationaboutthedirectionofelectricalconductivityandthereforewater
flowandfractureorientation,ratherthantheexactdistribution;itishopedthatthisinformationwillprovideabettergroundworkforadrillingprogramtobebasedon.
Geology
RegionalGeologicalFramework:
TheNorthernFlindersRangesdisplaybroad,opendomeandbasin-shapedfoldspossiblyformedbyanearlyphaseofmeridonalfoldingandaconcurrentphaseofeast-northeasttrendingfoldpattern.IthasbeensuggestedbyDyson(1998,1999)thedomeandbasinformationsarecausedbyLatePrecambriantoEarlyCambriansalttectonicswiththeDelamerianOrogenycausingminortighteningoffolds(Costaretal.2009).Theregionaleast-northeastandlocalwest-northwesttrendofthefoldaxesprovideevidenceforroughlynorth-southorientedshortening(Pauletal.1999).
AccordingtoDyson(2005),theopendomestructuresarecentredonapparentdiapiricintrusions.SynclinesarerimmedbydiapirsthatwereformedduetosaltwithdrawalandintowhichsedimentsoftheHawkerandWilpenaGroupsweredeposited.Thesynclinesweresubjecttoonlyminorlatestagecompressionandsoremainfairlyopenstructures,withtheirstructuralorientationdominantlynorthwestandnortheastwhichisthoughttocoincidewiththemainstructurallineamentsthatareassociatedwithlateNeoproterozoicrifting.
Structure:
TheNipapanhaCommunityislocatedwithintheNepabunnaSynclinorium,astructurecomposedoftwoeast-westtrendingsynclinesseparatedbyananticline.Thesynclinestightentowardsthewestcausingpossibleminorattenuationofthebeddingthickness,butopenouttowardstheeast(Costaretal.2009).Anumberofsmallfaultshavebeenidentified,althoughtheyappeartoberelativelyoldassomehavebeenfilledinwithcalciteandafewothersremainopen.Attheoutcroplevelthemostobviousfeatureistheprimaryeast-westtrendingcleavagewhichhasdevelopedparallelwiththeaxialplaneoffolding(Read1981).
Stratigraphy:
ThestratigraphyoftheNepabunnaSynclinoriumrangesinagefromLatePrecambrian(WilpenaGroup)toEarlyCambrian(HawkerGroup)inage.PreviousinvestigationshaveidentifiedtheWilkawillinaLimestoneoftheHawkerGroupasapotentialregionalaquifertarget.TheWilkawillinaLimestoneisclassifiedastypicallybiohermalandstromatolitic,regularlydolomiticandoolitic,interbeddedwithgreycalcareoussiltstone,limoniticsiltstoneandminorthinbeddedsandstone.ThisformationdefinestheoutcropoftheplungingsynclinesoftheNepabunnaSynclinoriumalongwiththeNepabunnaSiltstone,whichisclassifiedasadarkblue-greytogreyishgreencalcareoussiltstonewithminorthinbedsoflimestone(Costaretal.2009).
TheWilkawillinalimestonehasbeenidentifiedasthemainunitofinterestforhydrogeologicalpurposes,andcanbefurthersplitintoupperandlowerunits.Thelowerunitisclassifiedasacleanmassivelimestone,whichmayhavemoderateyieldinplaces,especiallywheretheyarecrossedbyacreekforrecharge.Theupperunitisclassifiedasinterbeddedlimestoneandsiltstone,andhasonlygivenpooryieldswhereithasbeendrilledinthepast(Costaretal.2008).
Method
Magnetotelluricmethod:
MagnetotelluricsisafieldofgeophysicsusedtoprovideinformationaboutthedistributionofelectricalconductivitythroughouttheEarth’scrustandmantle.Itisflexibleinthatincansensefromafewmetrestohundredsofkilometresdepth.Itinvolvesmeasuringthenaturallyoccurringelectromagneticfieldpresentbetweentheionosphereandgroundtomeasurethedistributionofelectricresistivitythroughouttheearth.Itreliesonsimultaneouslymeasuringthefluctuationsofelectricalandmagneticcomponentsindifferentdimensionsinordertodeterminethedistribution,strikeandskewofelectricalresistivity(Smirnovetal.2008,Arangoetal.2009).WhenmeasuringthelocalmagneticHandelectricalfieldsEduringamagnetotelluricsurvey,eventhoughtherecanbelocaliseddistortionofthemagneticfield,wecanassumethatthemeasuredlocalfieldHisagoodapproximationoftheregionalfieldHR.Ifthemeasuredelectricalfieldisdistortedbyheterogeneitiesinthesub-surface,wecansaythatthismeasuredfield,E,hasbeendistortedfromtheregionalelectricalfield,ER,bythedistortiontensor,D,i.e.E=DER.Dactsbydistortingthemagnitudeanddirectionofthemeasuredelectricalfield.
TheimpedanceZistherelationshipthatlinksthemeasuredelectricalfieldandmagneticfield,i.e.E=ZH.Ifthereisnodistortion,theregionalimpedanceZRcanbegivenbyER=ZRHR.TherelationshipbetweentheobservedandregionalimpedanceisthereforeZ=DZR(Caldwelletal.2004,Bibbyetal.2005).
Theskindepthequationisgivenby:
𝛿𝛿 = 2 𝜎𝜎𝜎𝜎𝜎𝜎
Whereσistheconductivity,μisthemagneticpermeability,ωisthefrequencyandδisthedepth.Duetothefactthatmagneticpermeability,µ,doesnotvarysubstantiallyintheearth,thisequationcanbere-writtenas𝛿𝛿 𝑇𝑇 ≈ 500 𝑇𝑇𝑇𝑇whereTistheperiodinsecondsand𝑇𝑇istheapparentresistivityinohm.m.
Thisequationisverypowerful,asitgivestherelationshipbetweenthedepththattheequipmentissensitivetoandthefrequencythatitcorrespondsto.Thiscanbeinterpretedassayingthatforagivenresistivityoftheearth,studyinglongerperiodwavelengthswillcorrespondtodeeperdepths,andforagivenperiodthedepthofinvestigationwillincreaseforanincreaseinresistivity(Smirnovetal.2008).
Thebandwidthoffrequenciesusedinmagnetotelluricstudiesrangesfrom104Hzto10-4Hz,whichcorrespondstodepthsofaround50m-500kmfortheaverageearthconductivity.Therangeoffrequenciesarederivedfromafewdifferentsources,themostimportantsignalcovering104Hzto10Hzcomingfrommeteorologicalactivity(lightningstrikes).Alightningstrikecausesaradiallyexpandingmagneticfieldwhichpropagatesthroughtheatmospherewithalmostnoattenuation,andatadistancefarenoughfromthestrikewillappearasauniformplane-wavesource.Duetotheglobalfrequencyofthunderstorms,especiallyaroundtheequator,thisisareliableandusefulsource.Aroundthebandwidthof101Hzto10-1Hzthereisalmostnonaturalsourceofenergytoprovideamagnetotelluricsignal;thiscanbeaproblemastheskindepthofthesefrequencies
roughlycorrespondsto1.5kmto15km,whichisthedepthofinterestformanystudies.Thesignalinthebandwidthof10-1Hzto10-4Hzisprovidedbymagneticpulsationsandmagneticstorms.Thepulsationsarecausedbyelectronsresonatingintheionosphere;theseresonancesoccuroverawideareaandbehavelikeaplane-wavesource.Magneticstormsarecausedbysolaractivitydisruptingthegeomagneticfieldwhichactsasauniforminducingfieldatmostlatitudesoftheearth(Simpson&Bahr2005).
Thephasetensorisamethodofusingtheobserveddatatoplotaseriesofellipseswhichprovideinformationaboutthestrikeandcomplexity(ordegreeof3-dimensionality)oftheelectricalresistivitystructure.Theseellipsesarethereforeapowerfultooltovisuallyanalysethedegreeofanisotropyoffracturealignmentifweusethelogicthatfractureswhichcarrywaterwillhaveahigherelectricalconductivitythanthesurroundingrock(Skinner&Heinson2004,Rayneretal.2007).Thereforeifthemajorityoffracturesarealignedinthesamedirection,therewillbeagreaterelectricalconductivityoverallinthatdirection,thanorthogonaltoit,whichwillberevealedbythephasetensorellipses(Caldwelletal.2004,Bibbyetal.2005).ThephasetensorcanbederivedbysplittingtheregionalandlocalimpedancetensorsZandZRintoreal(X)andimaginary(Y)parts.
Z=X+iYandZR=XR+iYR
Z=DZRcanberewrittenas2equations,X=DXRandY=DYR
ThecomponentsofZcanbedefinedas𝑍𝑍 = 𝑍𝑍.. 𝑍𝑍./𝑍𝑍/. 𝑍𝑍//
.
Thesecomponentscontaininformationaboutthedimensionalityofthesubsurface,andcanbeusedtodetermineifitis1D,2Dor3D.
ThephasetensorisdefinedasΦ=X−1YwhereX−1istheinverseofX(therealpartoftheimpedancetensorZ).Thephasetensorcanalsobedefinedintermsoftheregionalfieldby
Φ=X−1Y=(DXR)−1(DYR)=XR−1D−1DYR=XR−1YR=ΦR
Thereby,asexpected,thephasewillbehaveindependentofthedistortiontensorDwhichaffectstheimpedancetensor(Caldwelletal.2004,Bibbyetal.2005).
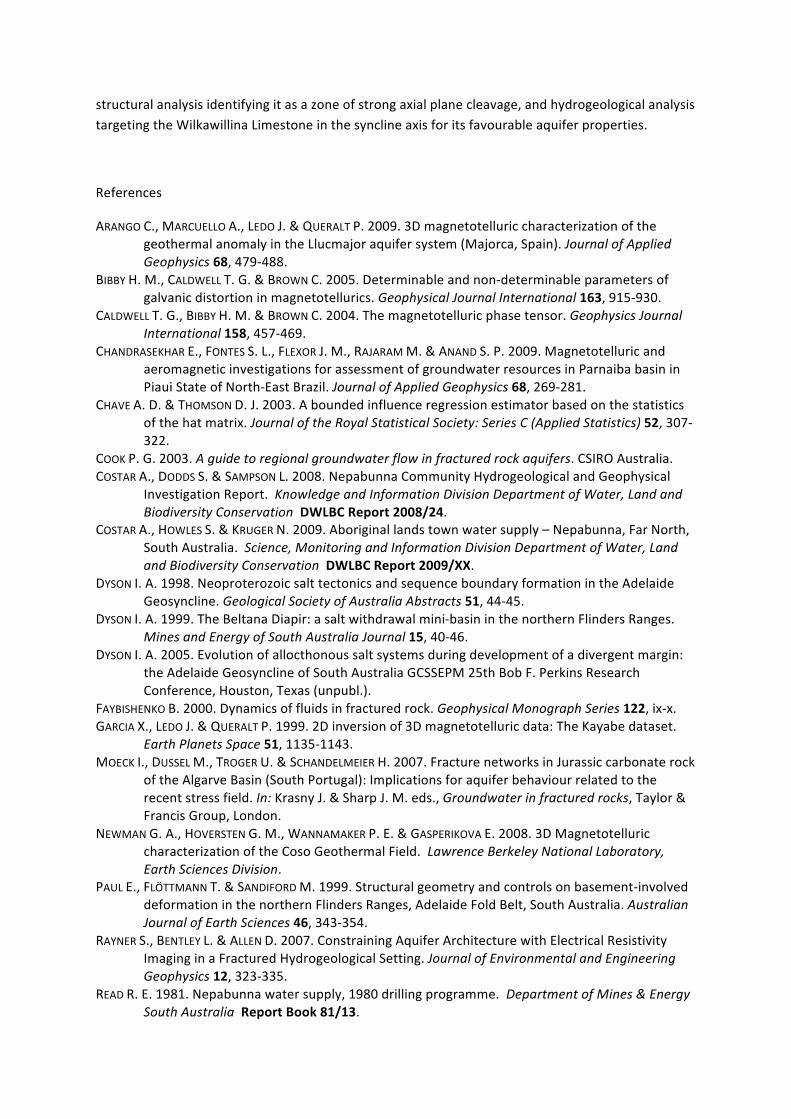
Thephasetensorisareal,secondranktensor,whichmeansthatitisdefinedbythreeindependentscalarvalues(Φmax,Φminandβ)andadirection(α).
βisameasureoftheasymmetryofthephasetensor,highervaluescorrespondtogreaterasymmetry.
𝜷𝜷 = 𝟏𝟏𝟐𝟐𝒕𝒕𝒕𝒕𝒕𝒕6𝟏𝟏(𝚽𝚽𝟏𝟏𝟐𝟐6𝚽𝚽𝟐𝟐𝟏𝟏
𝚽𝚽𝟏𝟏𝟏𝟏9𝚽𝚽𝟐𝟐𝟐𝟐).
αisthedirectionofthephasetensor,andexpressesthetensor’sdependenceontheco-ordinatesystem.
𝜶𝜶 = 𝟏𝟏𝟐𝟐𝒕𝒕𝒕𝒕𝒕𝒕6𝟏𝟏(𝚽𝚽𝟏𝟏𝟐𝟐9𝚽𝚽𝟐𝟐𝟏𝟏
𝚽𝚽𝟏𝟏𝟏𝟏6𝚽𝚽𝟐𝟐𝟐𝟐).
Thephasetensorisfullydefinedby
Φ = 𝑅𝑅> 𝛼𝛼 − 𝛽𝛽 Φmax 00 Φmin 𝑅𝑅(𝛼𝛼 + 𝛽𝛽).
whereR(α+β)istherotationmatrix,andRTistheinverserotationmatrix.
𝑅𝑅 𝛼𝛼 + 𝛽𝛽 = 𝑐𝑐𝑐𝑐𝑐𝑐 𝛼𝛼 + 𝛽𝛽 𝑐𝑐𝑠𝑠𝑠𝑠 𝛼𝛼 + 𝛽𝛽−𝑐𝑐𝑠𝑠𝑠𝑠 𝛼𝛼 + 𝛽𝛽 𝑐𝑐𝑐𝑐𝑐𝑐 𝛼𝛼 + 𝛽𝛽 .
Thephasetensorwillbehavedifferentlyfor1D,2Dand3Dcases.
Fora1DcasethegraphicalrepresentationoftheellipsewillbeacircleduetoequalvaluesforΦmaxandΦmin.Anexampleofa1Dscenariowouldbeauniformstackoflayers,suchasanhomogeneousandisotropicsedimentaryaquifer.
For2DcasesΦmaxandΦminwillhavedifferentvaluesandthereforethephasetensorwillformanellipseandrepresentthestrikeofelectricalconductivity.However,thethirdco-ordinateinvariantβwillbezeroandthephasetensorwillbesymmetric.Anexampleofa2Dscenariowouldbewheretheearthvariesin2dimensions,butremainsconstantinthethird,suchasafault.
For3DcasesΦmaxandΦminwillhavedifferentvalues,onceagaincausingthephasetensortoappearasanellipsewiththemajoraxisshowingthestrikeofelectricalconductionandβwillbenonzerowhichmeasuresthedegreeofasymmetryofthetensor.Anexampleofa3Dstructurewouldbeanorebodyvaryinginall3Ddimensions.(Caldwelletal.2004).
Magnetotelluricscanbeusedtocreatea3Dimageofthesubsurfacebydeployingthestationsinagridoverthestudyareaandtheninvertingandforwardmodellingthedatatocreatea3Dimageofelectricalresistivity(Garciaetal.1999).
FieldDeployment:
FieldworkwascarriedoutinJuneof2010,takingroughlyaweektocomplete.14instrumentsintotalwereused,utilisingTinker&Rasorcopper-coppersulphatehalfcellreferenceelectrodestomeasuretheelectricfields,andbroadbandinductionmagnetometerstomeasurethemagneticfields.
Eachstationcomprisedasetof3electrodesorientedintheN-SandE-Wdirectionsat90°toeachother,withdipolelengthsascloseto50maspracticallyallowable,asetof2inductioncoilmagnetometersalsoalignedN-SandE-W.Thesewerepluggedintoaloggerwhichrecordsthetime-seriesdatatoaharddrive,aGPSreceivertoensureaccuratemeasurementsoftimeandlocationandacarbatterytoprovidepower.Oncesetup,alaptopwasusedtoconnecttotheloggertocheckthesignalandsetthesamplingrate.Forthepurposesofthisexperimenttheloggerswerefirstsettorecordat3000Hzforatleast30minutesinordertorecordlongenoughobtainenoughsignaltoachieveanacceptablesignaltonoiseratio,thensetto500Hzovernight.Thisstrategywasusedtoobtaingoodsignaltonoiseratioinboththelongandshortperiodwavelengthspresentintheareaduetotherockyandundulatingterraincausingdistortionofthesignal.Twositesweresetupinitiallynearthesurveyareainareasthoughttohaveagoodsignaltonoiseratiotorunforthewholedurationofthesurveyandactasremotereferencesfortheprocessingstage.
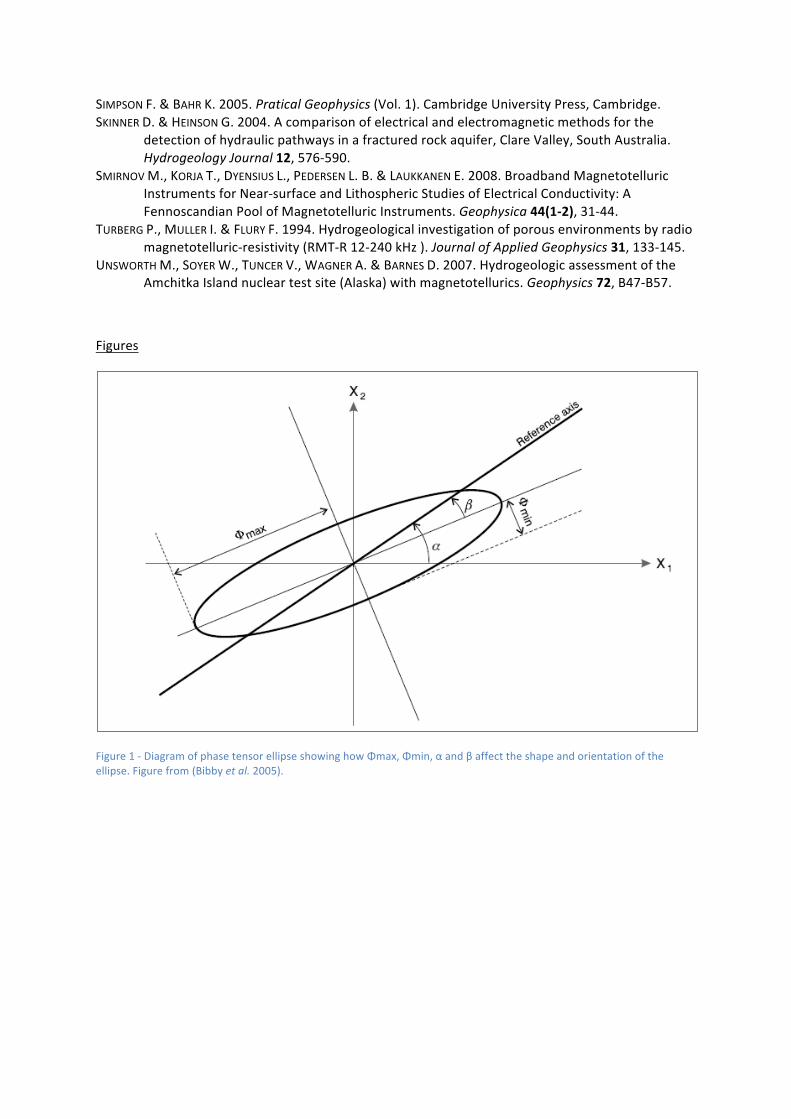
Apreliminaryaerialphotoinvestigationforsiteselectiontakingintoaccountdistancefromestablishedtracksandpowerlinesaswellasdifficultyofterrainyieldedapossible60sites,onceinthefielditwasrealisedthattheterrainwasmoredifficultthanrealisedandsiteswereselectedbasedoneaseofaccesswhilemaintaininga200-300mseparation.Inall,40sitesand2remotereferencesiteswerecollected.
DataProcessing:
DatawererecordedandinspectedasatimeseriesoffieldvalueswhichwerethensubjectedtoaFouriertransformation,whichseekstorepresentthetimedomaindatainthefrequencydomain.ThiswasdoneusingtheBIRRPcode.TheFouriertransformedfileswerethenconvertedtoasetoffilesforusewiththemodellingsoftware,WinGLink,accordingtovariousparameters,suchasremotereferencingandcoherencethresholds.
Remotereferencingworksbyassumingthatthemagneticfieldovertheentireregionshouldchangeconstantly.Itcomparesthemagneticfieldsfromthesiteandtheremotereferenceandanysignalthatisnotcommonisinterpretedasnoiseandignored.Coherencethresholdsseektoimprovethesignaltonoiseratioofthedatabyrejectingpartsofthesignalthathaveacoherencevaluethatislowerthanwhateverspecificvaluethethresholdwassetat.Ifasitewasparticularlynoisy,thethresholdcouldbesetashighas0.7,andonlyasmallportionofthedatawouldbeused.ThisprocessgivesasmoothermodelwithabetterRMSvalue(ameasureofhowwelltheobserveddatafitsthemodel)(Chave&Thomson2003).Theapparentresistivityandphasevs.frequencyplotsweretheninvestigatedmanuallyinWinGLink,withanyclearlynoisyfrequenciesbeingmaskedout.Thesefrequencieswerecommonly50Hz,andmostfrequenciesabove100Hz,andbelow1Hz.
Results
Thefiguresfortheresultsection(figures2,3,4,5,6,7,8,9,10,11and12)werechosentobestprovideinformationabouttheareabyusingroughlyperpendicularprofilesthatcoverallthesites,aswellasthestructuresandareasofimportance.Theyshow2DinversionsofprofilesNS1,NS2,EW1,EW2andEW3,aswellasinversionsofZongeprofiles4600,4900,5180,5450,5650and5850.Phasetensorprofilesof94Hz,70hzand23Hz,aswellasapseudosectionofprofileNS1.
ProfilesNS1andNS2showsincreasingresistivitywithdepthandasynclinalfeature.ProfilesEW1,EW2andEW3showincreasingresistivitywithdepth,astructuralplungetowardstheeastandzonesofhigherapparentconductivityseparatedbyaresistiveband.TheZongeprofilesshowcontinuationofanomalousconductiveunitsacrosstheprofilerelatingtoaproductivebore.Thephasetensorprofilesshowdominantregionalconductivityinthenortheast-southwestdirection,withshallowerfeaturesrangingfromnortheast-southwesttonorthwest-southeastconductance.
Discussion
Whenattemptingtointerpretthe2DinversionsproducedinWinGLink,itisimportanttokeepinmindthelimitationsofthedata.Firstofallisthefactoftheskindepthequation,giventhatthestablesignalwerecordedrangedfromroughly1Hzto100Hz,andthemodelledresistivityatthenearsurfacerangesroughlyfrom50ohm.mto150ohm.m,wehaveaskindepthrangeofaround300to600mforthehighestfrequenciesand3to6kmforthelowestfrequencies.Whilethismayseemlikedepthsfardeeperthantheareaofinterest,itisimportanttorememberthatthosearethe
maximumdepthsreachedbythosefrequencies,andtheycontainresistivity/conductanceinformationfromthefullvolumeofrockabove.
Thenextimportantthingtoconsideristheunderlyingstructureandlithologyofthesurveyarea.Thissurveywassituateddirectlyoverthetopofaneastplungingsyncline,comprisedatthesurfaceoffracturedsiltstoneandlimestone,andunderlainbyvariousothersedimentssuchassandstoneandshale.
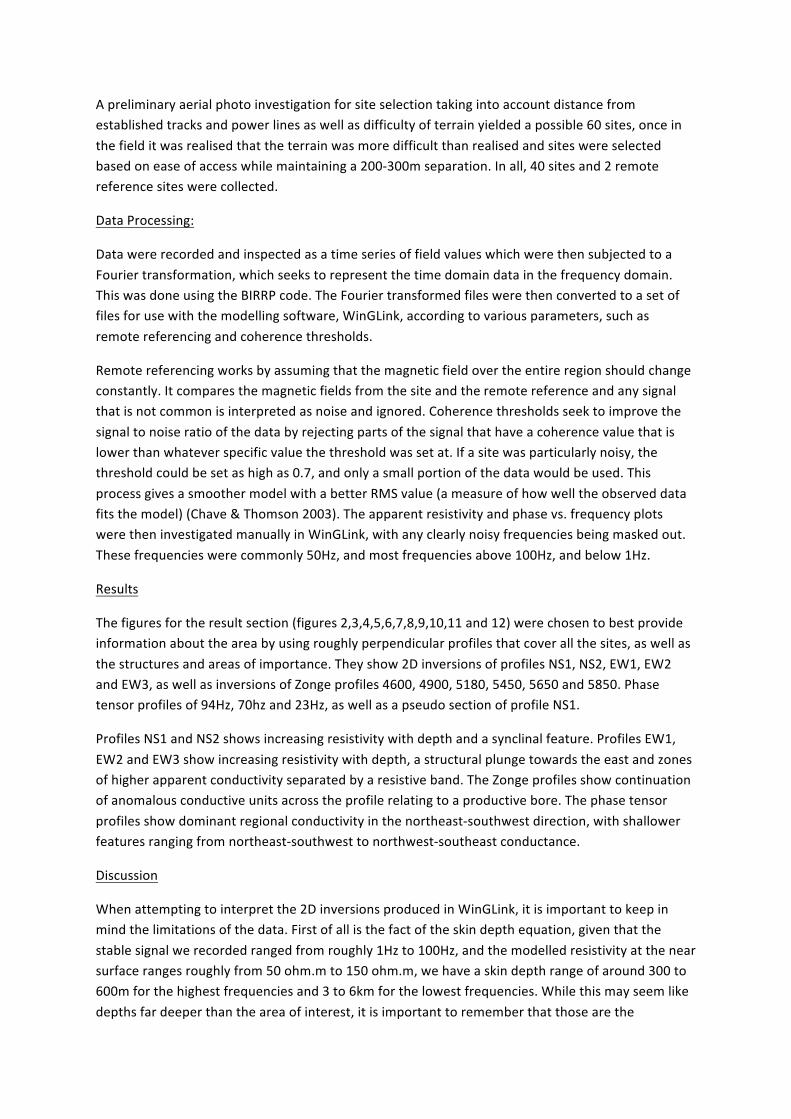
Runningeasttowestalongthesouthernedgeofthesurveyarea,acrossthesouthernlimbofthemajorsynclineistheprofileEW1,ofwhicha2Dinversionisshowninfigure4.Asisexpected,themodel’spredominantfeatureisanincreasingresistivitywithdepth.Thisisconsistentwiththetheorythatanincreaseindepthwillgenerallycorrespondtoanincreaseinresistivity,duetoadecreaseinwatercontentandporosityduetoincreasingpressure(Unsworthetal.2007).Itcanalsobeobservedthatthereisaplungeofstructuretowardstheeast,consistentwiththeobservedplungeoftheaxisofthelocalsyncline.
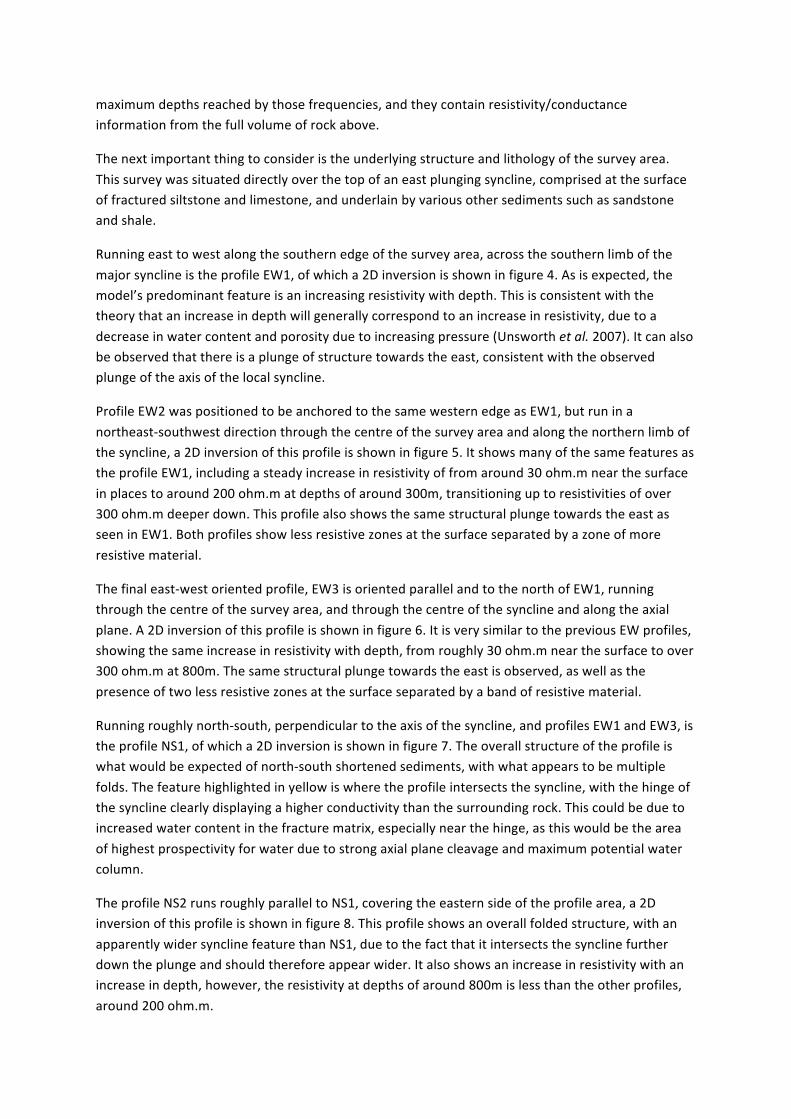
ProfileEW2waspositionedtobeanchoredtothesamewesternedgeasEW1,butruninanortheast-southwestdirectionthroughthecentreofthesurveyareaandalongthenorthernlimbofthesyncline,a2Dinversionofthisprofileisshowninfigure5.ItshowsmanyofthesamefeaturesastheprofileEW1,includingasteadyincreaseinresistivityoffromaround30ohm.mnearthesurfaceinplacestoaround200ohm.matdepthsofaround300m,transitioninguptoresistivitiesofover300ohm.mdeeperdown.ThisprofilealsoshowsthesamestructuralplungetowardstheeastasseeninEW1.Bothprofilesshowlessresistivezonesatthesurfaceseparatedbyazoneofmoreresistivematerial.
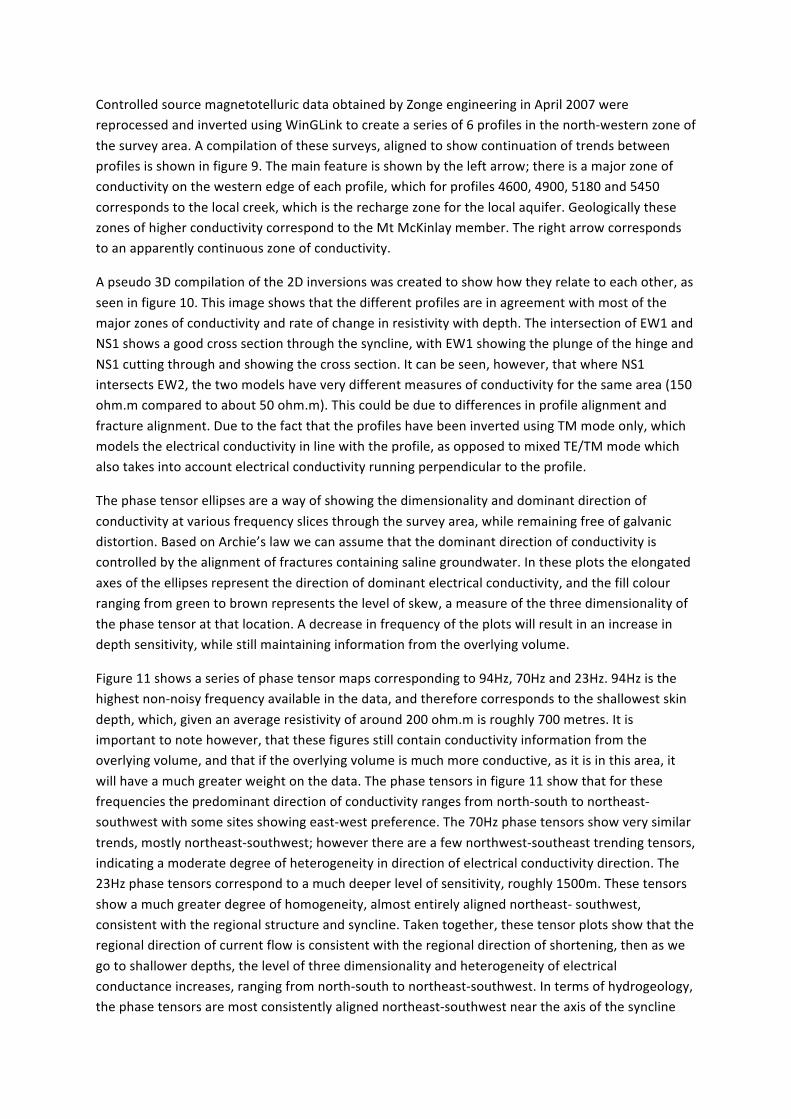
Thefinaleast-westorientedprofile,EW3isorientedparallelandtothenorthofEW1,runningthroughthecentreofthesurveyarea,andthroughthecentreofthesynclineandalongtheaxialplane.A2Dinversionofthisprofileisshowninfigure6.ItisverysimilartothepreviousEWprofiles,showingthesameincreaseinresistivitywithdepth,fromroughly30ohm.mnearthesurfacetoover300ohm.mat800m.Thesamestructuralplungetowardstheeastisobserved,aswellasthepresenceoftwolessresistivezonesatthesurfaceseparatedbyabandofresistivematerial.
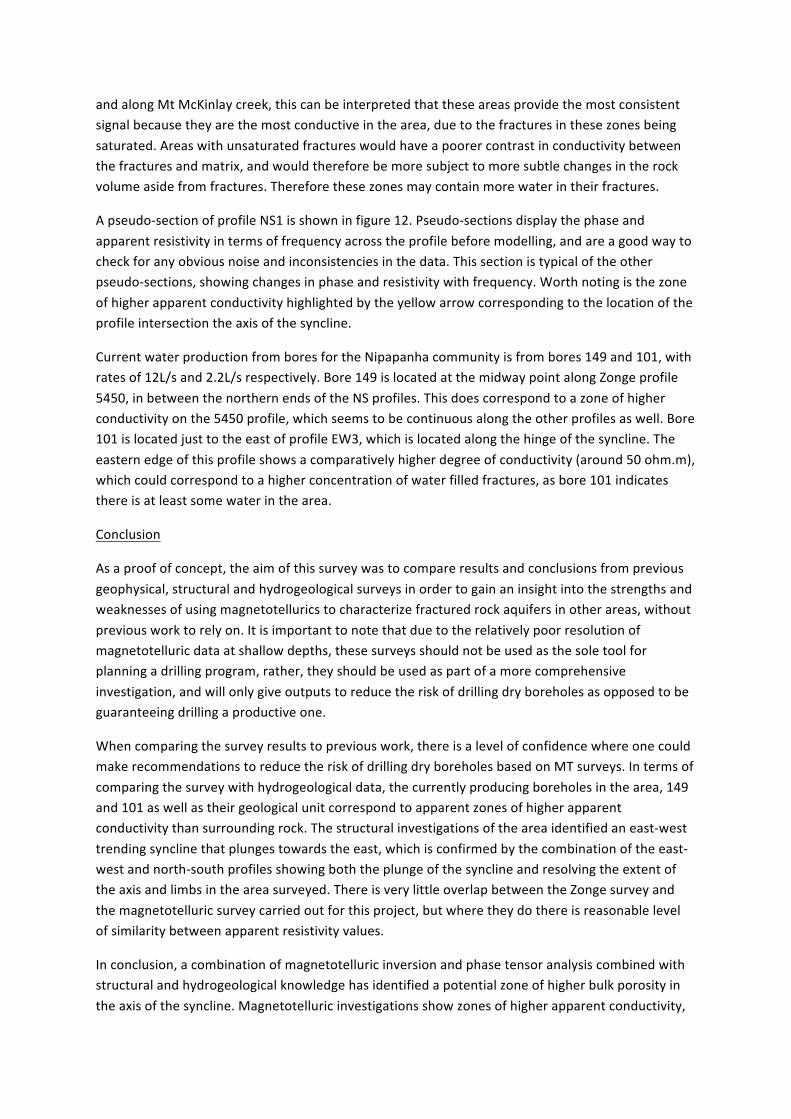
Runningroughlynorth-south,perpendiculartotheaxisofthesyncline,andprofilesEW1andEW3,istheprofileNS1,ofwhicha2Dinversionisshowninfigure7.Theoverallstructureoftheprofileiswhatwouldbeexpectedofnorth-southshortenedsediments,withwhatappearstobemultiplefolds.Thefeaturehighlightedinyellowiswheretheprofileintersectsthesyncline,withthehingeofthesynclineclearlydisplayingahigherconductivitythanthesurroundingrock.Thiscouldbeduetoincreasedwatercontentinthefracturematrix,especiallynearthehinge,asthiswouldbetheareaofhighestprospectivityforwaterduetostrongaxialplanecleavageandmaximumpotentialwatercolumn.
TheprofileNS2runsroughlyparalleltoNS1,coveringtheeasternsideoftheprofilearea,a2Dinversionofthisprofileisshowninfigure8.Thisprofileshowsanoverallfoldedstructure,withanapparentlywidersynclinefeaturethanNS1,duetothefactthatitintersectsthesynclinefurtherdowntheplungeandshouldthereforeappearwider.Italsoshowsanincreaseinresistivitywithanincreaseindepth,however,theresistivityatdepthsofaround800mislessthantheotherprofiles,around200ohm.m.
ControlledsourcemagnetotelluricdataobtainedbyZongeengineeringinApril2007werereprocessedandinvertedusingWinGLinktocreateaseriesof6profilesinthenorth-westernzoneofthesurveyarea.Acompilationofthesesurveys,alignedtoshowcontinuationoftrendsbetweenprofilesisshowninfigure9.Themainfeatureisshownbytheleftarrow;thereisamajorzoneofconductivityonthewesternedgeofeachprofile,whichforprofiles4600,4900,5180and5450correspondstothelocalcreek,whichistherechargezoneforthelocalaquifer.GeologicallythesezonesofhigherconductivitycorrespondtotheMtMcKinlaymember.Therightarrowcorrespondstoanapparentlycontinuouszoneofconductivity.
Apseudo3Dcompilationofthe2Dinversionswascreatedtoshowhowtheyrelatetoeachother,asseeninfigure10.Thisimageshowsthatthedifferentprofilesareinagreementwithmostofthemajorzonesofconductivityandrateofchangeinresistivitywithdepth.TheintersectionofEW1andNS1showsagoodcrosssectionthroughthesyncline,withEW1showingtheplungeofthehingeandNS1cuttingthroughandshowingthecrosssection.Itcanbeseen,however,thatwhereNS1intersectsEW2,thetwomodelshaveverydifferentmeasuresofconductivityforthesamearea(150ohm.mcomparedtoabout50ohm.m).Thiscouldbeduetodifferencesinprofilealignmentandfracturealignment.DuetothefactthattheprofileshavebeeninvertedusingTMmodeonly,whichmodelstheelectricalconductivityinlinewiththeprofile,asopposedtomixedTE/TMmodewhichalsotakesintoaccountelectricalconductivityrunningperpendiculartotheprofile.
Thephasetensorellipsesareawayofshowingthedimensionalityanddominantdirectionofconductivityatvariousfrequencyslicesthroughthesurveyarea,whileremainingfreeofgalvanicdistortion.BasedonArchie’slawwecanassumethatthedominantdirectionofconductivityiscontrolledbythealignmentoffracturescontainingsalinegroundwater.Intheseplotstheelongatedaxesoftheellipsesrepresentthedirectionofdominantelectricalconductivity,andthefillcolourrangingfromgreentobrownrepresentsthelevelofskew,ameasureofthethreedimensionalityofthephasetensoratthatlocation.Adecreaseinfrequencyoftheplotswillresultinanincreaseindepthsensitivity,whilestillmaintaininginformationfromtheoverlyingvolume.
Figure11showsaseriesofphasetensormapscorrespondingto94Hz,70Hzand23Hz.94Hzisthehighestnon-noisyfrequencyavailableinthedata,andthereforecorrespondstotheshallowestskindepth,which,givenanaverageresistivityofaround200ohm.misroughly700metres.Itisimportanttonotehowever,thatthesefiguresstillcontainconductivityinformationfromtheoverlyingvolume,andthatiftheoverlyingvolumeismuchmoreconductive,asitisinthisarea,itwillhaveamuchgreaterweightonthedata.Thephasetensorsinfigure11showthatforthesefrequenciesthepredominantdirectionofconductivityrangesfromnorth-southtonortheast-southwestwithsomesitesshowingeast-westpreference.The70Hzphasetensorsshowverysimilartrends,mostlynortheast-southwest;howeverthereareafewnorthwest-southeasttrendingtensors,indicatingamoderatedegreeofheterogeneityindirectionofelectricalconductivitydirection.The23Hzphasetensorscorrespondtoamuchdeeperlevelofsensitivity,roughly1500m.Thesetensorsshowamuchgreaterdegreeofhomogeneity,almostentirelyalignednortheast-southwest,consistentwiththeregionalstructureandsyncline.Takentogether,thesetensorplotsshowthattheregionaldirectionofcurrentflowisconsistentwiththeregionaldirectionofshortening,thenaswegotoshallowerdepths,thelevelofthreedimensionalityandheterogeneityofelectricalconductanceincreases,rangingfromnorth-southtonortheast-southwest.Intermsofhydrogeology,thephasetensorsaremostconsistentlyalignednortheast-southwestneartheaxisofthesyncline
andalongMtMcKinlaycreek,thiscanbeinterpretedthattheseareasprovidethemostconsistentsignalbecausetheyarethemostconductiveinthearea,duetothefracturesinthesezonesbeingsaturated.Areaswithunsaturatedfractureswouldhaveapoorercontrastinconductivitybetweenthefracturesandmatrix,andwouldthereforebemoresubjecttomoresubtlechangesintherockvolumeasidefromfractures.Thereforethesezonesmaycontainmorewaterintheirfractures.
Apseudo-sectionofprofileNS1isshowninfigure12.Pseudo-sectionsdisplaythephaseandapparentresistivityintermsoffrequencyacrosstheprofilebeforemodelling,andareagoodwaytocheckforanyobviousnoiseandinconsistenciesinthedata.Thissectionistypicaloftheotherpseudo-sections,showingchangesinphaseandresistivitywithfrequency.Worthnotingisthezoneofhigherapparentconductivityhighlightedbytheyellowarrowcorrespondingtothelocationoftheprofileintersectiontheaxisofthesyncline.
CurrentwaterproductionfromboresfortheNipapanhacommunityisfrombores149and101,withratesof12L/sand2.2L/srespectively.Bore149islocatedatthemidwaypointalongZongeprofile5450,inbetweenthenorthernendsoftheNSprofiles.Thisdoescorrespondtoazoneofhigherconductivityonthe5450profile,whichseemstobecontinuousalongtheotherprofilesaswell.Bore101islocatedjusttotheeastofprofileEW3,whichislocatedalongthehingeofthesyncline.Theeasternedgeofthisprofileshowsacomparativelyhigherdegreeofconductivity(around50ohm.m),whichcouldcorrespondtoahigherconcentrationofwaterfilledfractures,asbore101indicatesthereisatleastsomewaterinthearea.
Conclusion
Asaproofofconcept,theaimofthissurveywastocompareresultsandconclusionsfrompreviousgeophysical,structuralandhydrogeologicalsurveysinordertogainaninsightintothestrengthsandweaknessesofusingmagnetotelluricstocharacterizefracturedrockaquifersinotherareas,withoutpreviousworktorelyon.Itisimportanttonotethatduetotherelativelypoorresolutionofmagnetotelluricdataatshallowdepths,thesesurveysshouldnotbeusedasthesoletoolforplanningadrillingprogram,rather,theyshouldbeusedaspartofamorecomprehensiveinvestigation,andwillonlygiveoutputstoreducetheriskofdrillingdryboreholesasopposedtobeguaranteeingdrillingaproductiveone.
Whencomparingthesurveyresultstopreviouswork,thereisalevelofconfidencewhereonecouldmakerecommendationstoreducetheriskofdrillingdryboreholesbasedonMTsurveys.Intermsofcomparingthesurveywithhydrogeologicaldata,thecurrentlyproducingboreholesinthearea,149and101aswellastheirgeologicalunitcorrespondtoapparentzonesofhigherapparentconductivitythansurroundingrock.Thestructuralinvestigationsoftheareaidentifiedaneast-westtrendingsynclinethatplungestowardstheeast,whichisconfirmedbythecombinationoftheeast-westandnorth-southprofilesshowingboththeplungeofthesynclineandresolvingtheextentoftheaxisandlimbsintheareasurveyed.ThereisverylittleoverlapbetweentheZongesurveyandthemagnetotelluricsurveycarriedoutforthisproject,butwheretheydothereisreasonablelevelofsimilaritybetweenapparentresistivityvalues.
Inconclusion,acombinationofmagnetotelluricinversionandphasetensoranalysiscombinedwithstructuralandhydrogeologicalknowledgehasidentifiedapotentialzoneofhigherbulkporosityintheaxisofthesyncline.Magnetotelluricinvestigationsshowzonesofhigherapparentconductivity,
structuralanalysisidentifyingitasazoneofstrongaxialplanecleavage,andhydrogeologicalanalysistargetingtheWilkawillinaLimestoneinthesynclineaxisforitsfavourableaquiferproperties.
References
ARANGOC.,MARCUELLOA.,LEDOJ.&QUERALTP.2009.3DmagnetotelluriccharacterizationofthegeothermalanomalyintheLlucmajoraquifersystem(Majorca,Spain).JournalofAppliedGeophysics68,479-488.
BIBBYH.M.,CALDWELLT.G.&BROWNC.2005.Determinableandnon-determinableparametersofgalvanicdistortioninmagnetotellurics.GeophysicalJournalInternational163,915-930.
CALDWELLT.G.,BIBBYH.M.&BROWNC.2004.Themagnetotelluricphasetensor.GeophysicsJournalInternational158,457-469.
CHANDRASEKHARE.,FONTESS.L.,FLEXORJ.M.,RAJARAMM.&ANANDS.P.2009.MagnetotelluricandaeromagneticinvestigationsforassessmentofgroundwaterresourcesinParnaibabasininPiauiStateofNorth-EastBrazil.JournalofAppliedGeophysics68,269-281.
CHAVEA.D.&THOMSOND.J.2003.Aboundedinfluenceregressionestimatorbasedonthestatisticsofthehatmatrix.JournaloftheRoyalStatisticalSociety:SeriesC(AppliedStatistics)52,307-322.
COOKP.G.2003.Aguidetoregionalgroundwaterflowinfracturedrockaquifers.CSIROAustralia.COSTARA.,DODDSS.&SAMPSONL.2008.NepabunnaCommunityHydrogeologicalandGeophysical
InvestigationReport.KnowledgeandInformationDivisionDepartmentofWater,LandandBiodiversityConservationDWLBCReport2008/24.
COSTARA.,HOWLESS.&KRUGERN.2009.Aboriginallandstownwatersupply–Nepabunna,FarNorth,SouthAustralia.Science,MonitoringandInformationDivisionDepartmentofWater,LandandBiodiversityConservationDWLBCReport2009/XX.
DYSONI.A.1998.NeoproterozoicsalttectonicsandsequenceboundaryformationintheAdelaideGeosyncline.GeologicalSocietyofAustraliaAbstracts51,44-45.
DYSONI.A.1999.TheBeltanaDiapir:asaltwithdrawalmini-basininthenorthernFlindersRanges.MinesandEnergyofSouthAustraliaJournal15,40-46.
DYSONI.A.2005.Evolutionofallocthonoussaltsystemsduringdevelopmentofadivergentmargin:theAdelaideGeosynclineofSouthAustraliaGCSSEPM25thBobF.PerkinsResearchConference,Houston,Texas(unpubl.).
FAYBISHENKOB.2000.Dynamicsoffluidsinfracturedrock.GeophysicalMonographSeries122,ix-x.GARCIAX.,LEDOJ.&QUERALTP.1999.2Dinversionof3Dmagnetotelluricdata:TheKayabedataset.
EarthPlanetsSpace51,1135-1143.MOECKI.,DUSSELM.,TROGERU.&SCHANDELMEIERH.2007.FracturenetworksinJurassiccarbonaterock
oftheAlgarveBasin(SouthPortugal):Implicationsforaquiferbehaviourrelatedtotherecentstressfield.In:KrasnyJ.&SharpJ.M.eds.,Groundwaterinfracturedrocks,Taylor&FrancisGroup,London.
NEWMANG.A.,HOVERSTENG.M.,WANNAMAKERP.E.&GASPERIKOVAE.2008.3DMagnetotelluriccharacterizationoftheCosoGeothermalField.LawrenceBerkeleyNationalLaboratory,EarthSciencesDivision.
PAULE.,FLÖTTMANNT.&SANDIFORDM.1999.Structuralgeometryandcontrolsonbasement-involveddeformationinthenorthernFlindersRanges,AdelaideFoldBelt,SouthAustralia.AustralianJournalofEarthSciences46,343-354.
RAYNERS.,BENTLEYL.&ALLEND.2007.ConstrainingAquiferArchitecturewithElectricalResistivityImaginginaFracturedHydrogeologicalSetting.JournalofEnvironmentalandEngineeringGeophysics12,323-335.
READR.E.1981.Nepabunnawatersupply,1980drillingprogramme.DepartmentofMines&EnergySouthAustraliaReportBook81/13.
SIMPSONF.&BAHRK.2005.PraticalGeophysics(Vol.1).CambridgeUniversityPress,Cambridge.SKINNERD.&HEINSONG.2004.Acomparisonofelectricalandelectromagneticmethodsforthe
detectionofhydraulicpathwaysinafracturedrockaquifer,ClareValley,SouthAustralia.HydrogeologyJournal12,576-590.
SMIRNOVM.,KORJAT.,DYENSIUSL.,PEDERSENL.B.&LAUKKANENE.2008.BroadbandMagnetotelluricInstrumentsforNear-surfaceandLithosphericStudiesofElectricalConductivity:AFennoscandianPoolofMagnetotelluricInstruments.Geophysica44(1-2),31-44.
TURBERGP.,MULLERI.&FLURYF.1994.Hydrogeologicalinvestigationofporousenvironmentsbyradiomagnetotelluric-resistivity(RMT-R12-240kHz).JournalofAppliedGeophysics31,133-145.
UNSWORTHM.,SOYERW.,TUNCERV.,WAGNERA.&BARNESD.2007.HydrogeologicassessmentoftheAmchitkaIslandnucleartestsite(Alaska)withmagnetotellurics.Geophysics72,B47-B57.
Figures
Figure1-DiagramofphasetensorellipseshowinghowΦmax,Φmin,αandβaffecttheshapeandorientationoftheellipse.Figurefrom(Bibbyetal.2005).
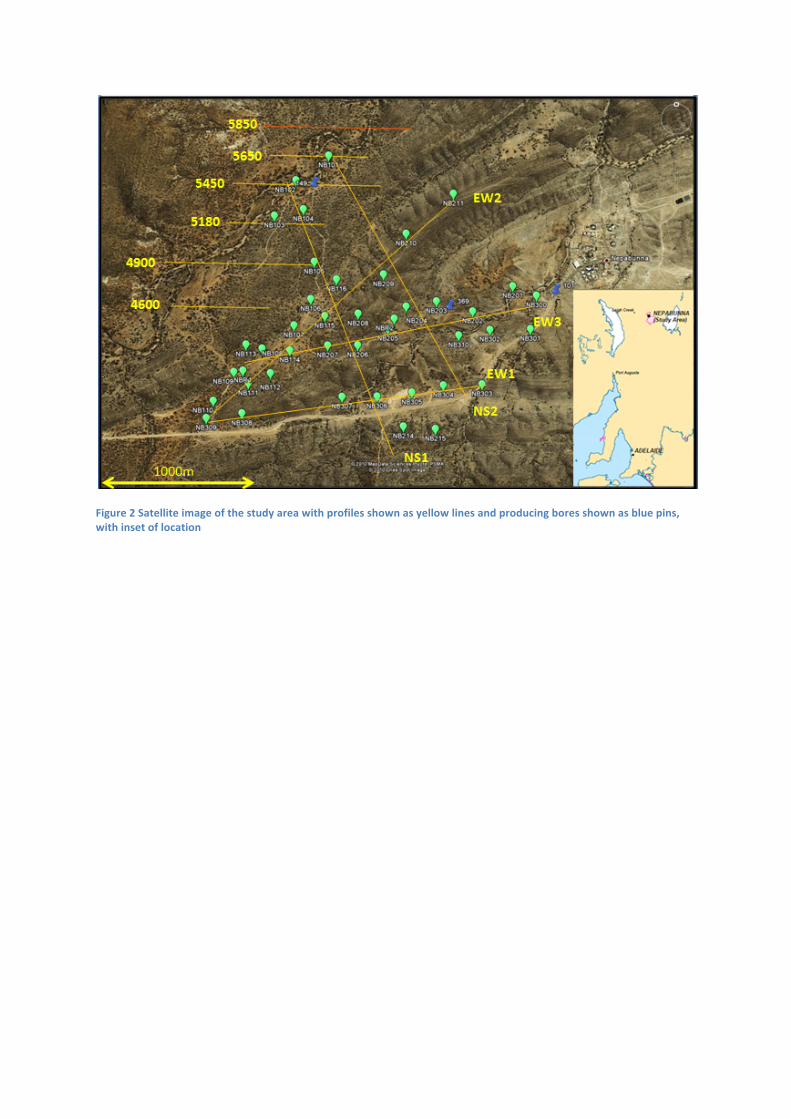
Figure2Satelliteimageofthestudyareawithprofilesshownasyellowlinesandproducingboresshownasbluepins,withinsetoflocation
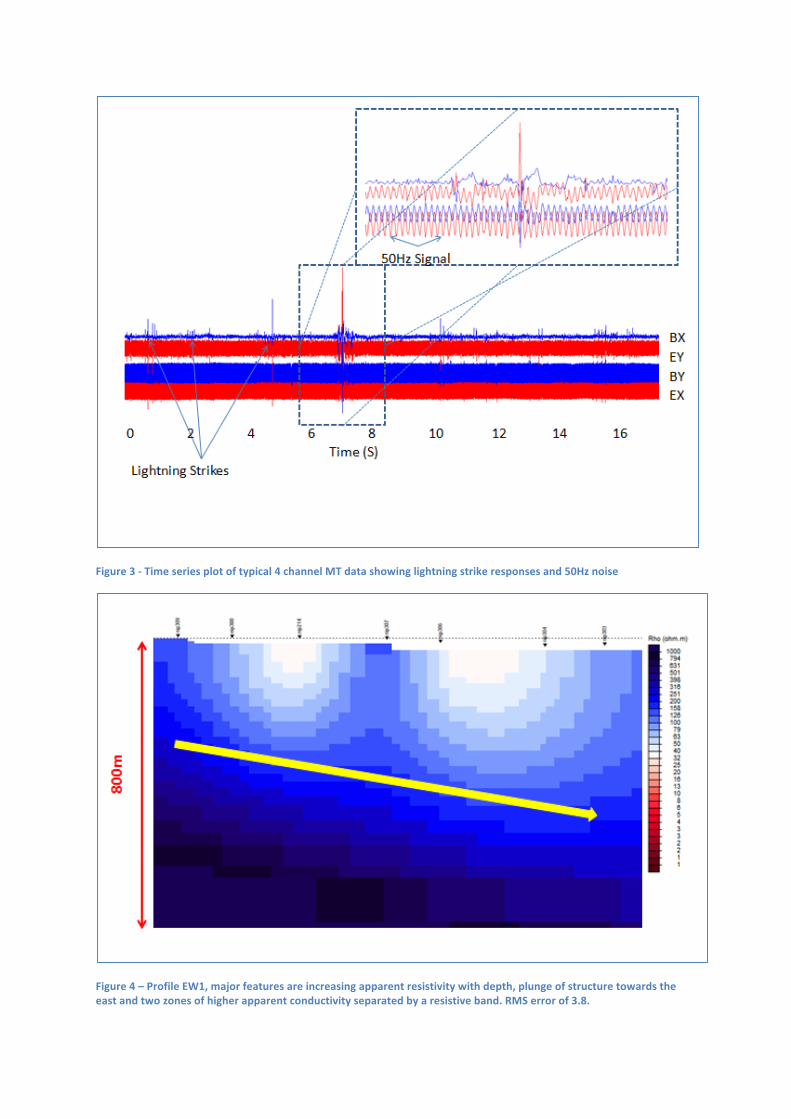
Figure3-Timeseriesplotoftypical4channelMTdatashowinglightningstrikeresponsesand50Hznoise
Figure4–ProfileEW1,majorfeaturesareincreasingapparentresistivitywithdepth,plungeofstructuretowardstheeastandtwozonesofhigherapparentconductivityseparatedbyaresistiveband.RMSerrorof3.8.
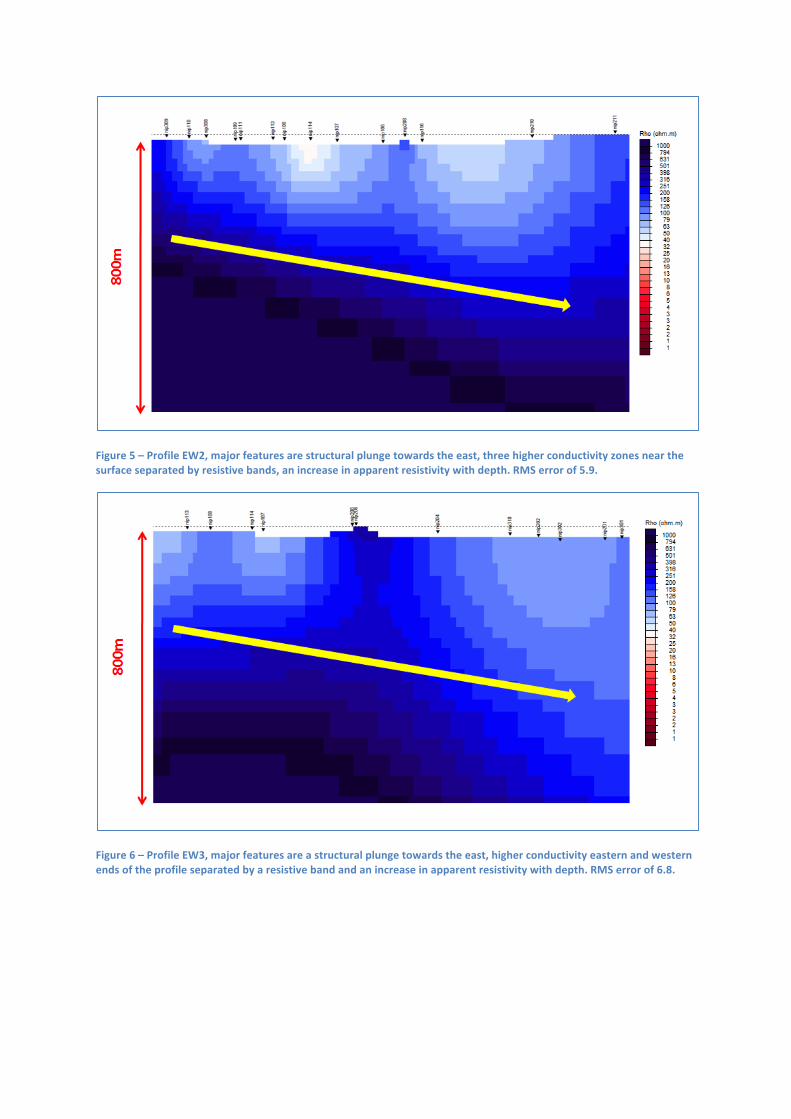
Figure5–ProfileEW2,majorfeaturesarestructuralplungetowardstheeast,threehigherconductivityzonesnearthesurfaceseparatedbyresistivebands,anincreaseinapparentresistivitywithdepth.RMSerrorof5.9.
Figure6–ProfileEW3,majorfeaturesareastructuralplungetowardstheeast,higherconductivityeasternandwesternendsoftheprofileseparatedbyaresistivebandandanincreaseinapparentresistivitywithdepth.RMSerrorof6.8.
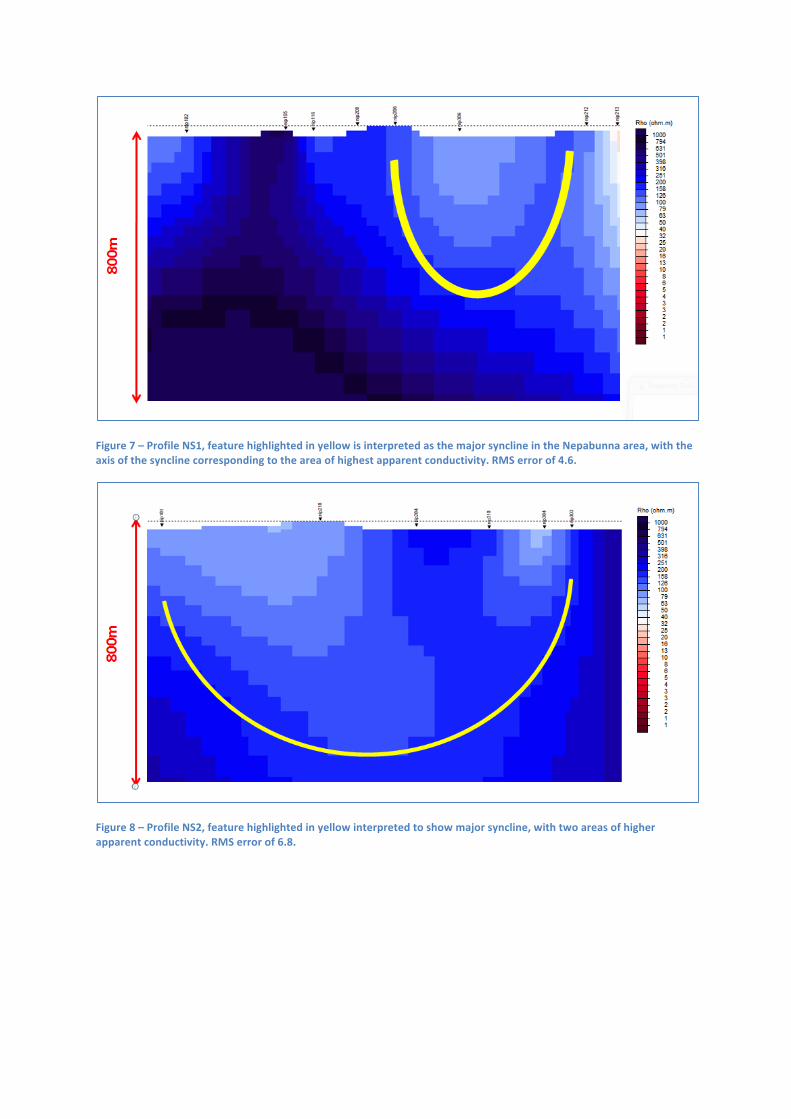
Figure7–ProfileNS1,featurehighlightedinyellowisinterpretedasthemajorsynclineintheNepabunnaarea,withtheaxisofthesynclinecorrespondingtotheareaofhighestapparentconductivity.RMSerrorof4.6.
Figure8–ProfileNS2,featurehighlightedinyellowinterpretedtoshowmajorsyncline,withtwoareasofhigherapparentconductivity.RMSerrorof6.8.
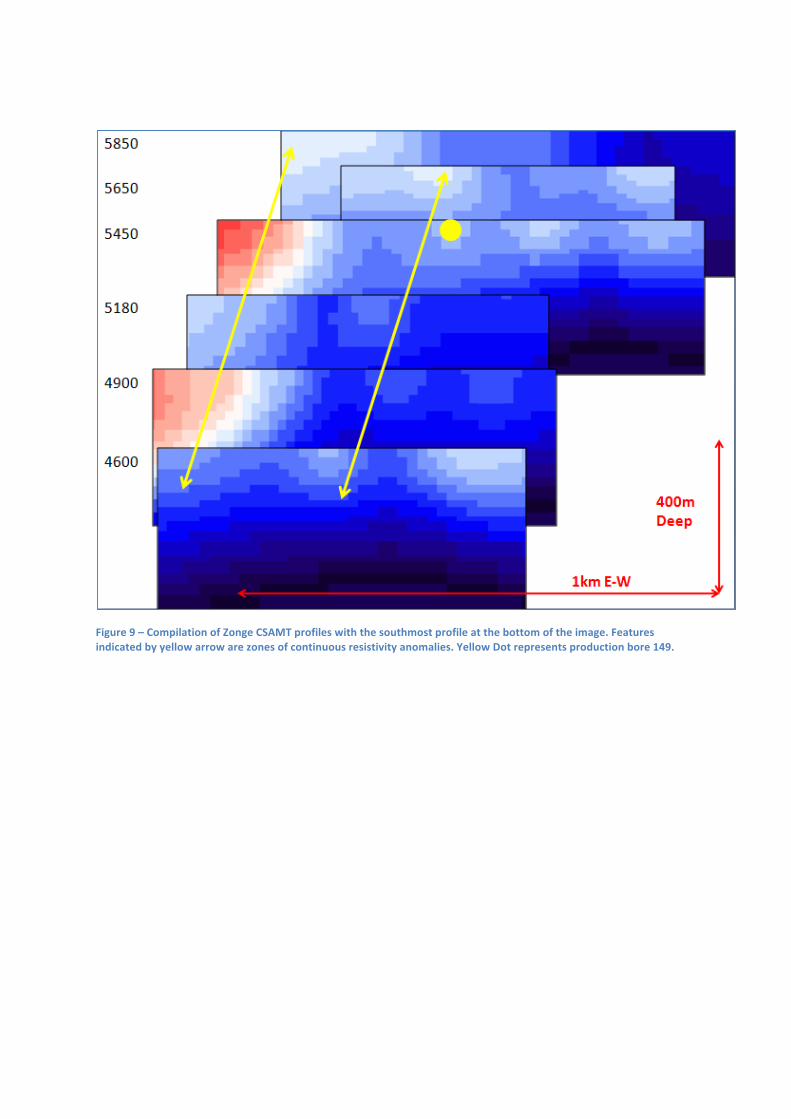
Figure9–CompilationofZongeCSAMTprofileswiththesouthmostprofileatthebottomoftheimage.Featuresindicatedbyyellowarrowarezonesofcontinuousresistivityanomalies.YellowDotrepresentsproductionbore149.
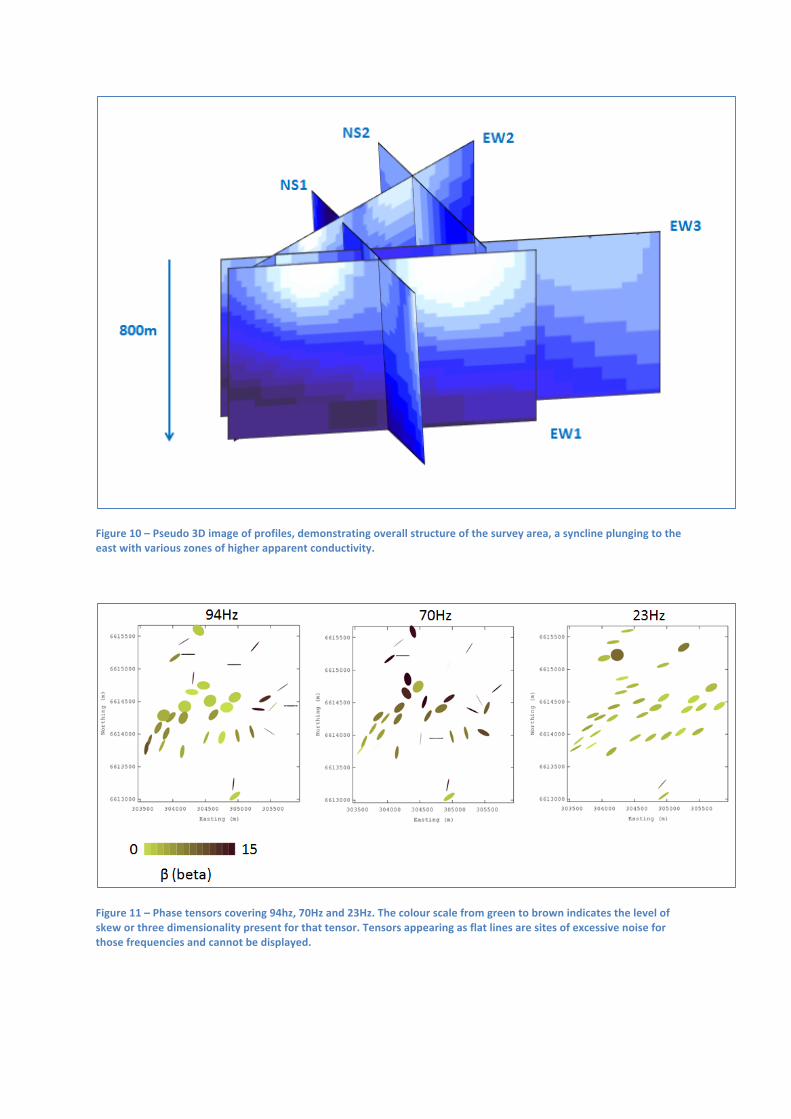
Figure10–Pseudo3Dimageofprofiles,demonstratingoverallstructureofthesurveyarea,asynclineplungingtotheeastwithvariouszonesofhigherapparentconductivity.
Figure11–Phasetensorscovering94hz,70Hzand23Hz.Thecolourscalefromgreentobrownindicatesthelevelofskeworthreedimensionalitypresentforthattensor.Tensorsappearingasflatlinesaresitesofexcessivenoiseforthosefrequenciesandcannotbedisplayed.
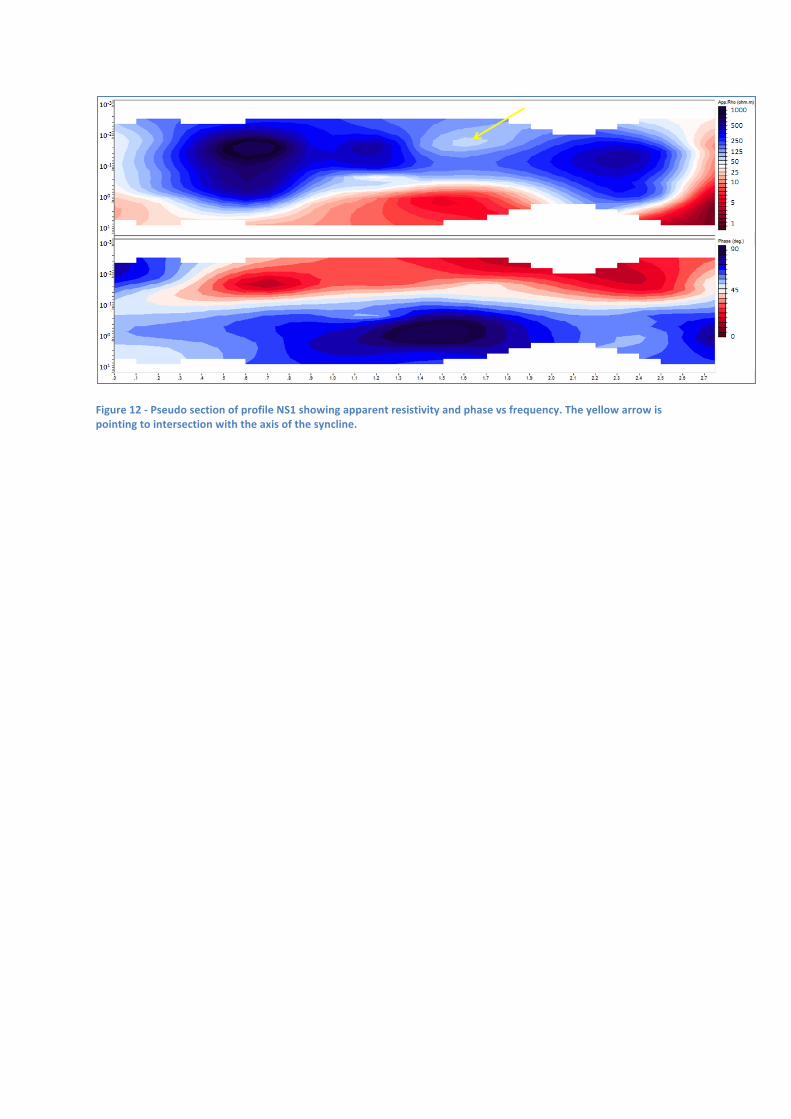
Figure12-PseudosectionofprofileNS1showingapparentresistivityandphasevsfrequency.Theyellowarrowispointingtointersectionwiththeaxisofthesyncline.