Locating and Positioning Solar Panels in a 3D City Model ...
11
147 Locating and Positioning Solar Panels in a 3D City Model: A Case Study of Newcastle, UK Heidi El-Hosaini [email protected] Full paper double blind review Abstract The recent advent of high quality, realistic 3D city models is creating new possibilities for analyses and visualisations of solar irradiance and photovoltaic (PV) potential at an urban level. A 3D city model of Newcastle (UK) is used to demonstrate potential applications for locating solar panels (i.e. which surfaces within the model), and positioning them (i.e. where on a given surface). After geometrically validating the model, a 3D PV assessment tool is developed for locating suitable surfaces, which accounts for 3D geometric properties (surface area, slope, aspect), clear-sky solar irradiance estimates, and annual PV estimates. Optimal sub-sections of a selected surface are then identified using 3D shadow detection analyses. Outputs include a daily animation of the shadows cast across the surface each hour, and a static image displaying mean non-shaded percentage patterns on the surface. 1 Introduction The pursuit of sustainable and renewable technologies is imperative to sustain an ever- increasing global demand for energy, whilst reducing negative environmental impacts (SOLANGI et al. 2011). Solar energy is widely recognised for being clean and abundant, and solar photovoltaic (PV) technology offers a sustainable method of transforming incoming solar energy into electricity. More than 80% of the population of England, and nearly 65% of the population of Wales, live in urban areas, represented by 20% and 12% of the total land area respectively (PATEMAN 2011). There has been dramatic growth in the solar PV sector in the UK in re- cent years, and it is thought that future PV applications may involve mainly the built envi- ronment (HOFIERKA & KAŇUK 2009). Such installations will therefore need to be integrated into buildings and other infrastructure, which often have complex morphologies in urban settings. In order to fully exploit the potential that solar PV has to offer, understanding and identifying suitable surfaces for installations is essential to ensure the most cost-effective and environmentally efficient results. Therefore, an understanding of the urban solar poten- tial at a building level is important for urban planners, PV installers, householders, and other decision-makers within the solar energy sector. However, there are few applications or tools to date that deliver quick but accurate results that account for urban morphology (NGUYEN & PEARCE 2012). As a tool for processing complex spatial information, geographical information systems (GIS) may contribute to the effective assessment of solar resources. Moreover, an accurate GI_Forum ‒ Journal for Geographic Information Science, 1-2015. © Herbert Wichmann Verlag, VDE VERLAG GMBH, Berlin/Offenbach. ISBN 978-3-87907-558-4. © ÖAW Verlag, Wien. ISSN 2308-1708, doi:10.1553/giscience2015s147.
Transcript of Locating and Positioning Solar Panels in a 3D City Model ...
147
Locating and Positioning Solar Panels in a 3D City Model: A Case Study of Newcastle, UK
Heidi El-Hosaini
Full paper double blind review
Abstract
The recent advent of high quality, realistic 3D city models is creating new possibilities for analyses and visualisations of solar irradiance and photovoltaic (PV) potential at an urban level. A 3D city model of Newcastle (UK) is used to demonstrate potential applications for locating solar panels (i.e. which surfaces within the model), and positioning them (i.e. where on a given surface). After geometrically validating the model, a 3D PV assessment tool is developed for locating suitable surfaces, which accounts for 3D geometric properties (surface area, slope, aspect), clear-sky solar irradiance estimates, and annual PV estimates. Optimal sub-sections of a selected surface are then identified using 3D shadow detection analyses. Outputs include a daily animation of the shadows cast across the surface each hour, and a static image displaying mean non-shaded percentage patterns on the surface.
1 Introduction
The pursuit of sustainable and renewable technologies is imperative to sustain an ever-increasing global demand for energy, whilst reducing negative environmental impacts (SOLANGI et al. 2011). Solar energy is widely recognised for being clean and abundant, and solar photovoltaic (PV) technology offers a sustainable method of transforming incoming solar energy into electricity.
More than 80% of the population of England, and nearly 65% of the population of Wales, live in urban areas, represented by 20% and 12% of the total land area respectively (PATEMAN 2011). There has been dramatic growth in the solar PV sector in the UK in re-cent years, and it is thought that future PV applications may involve mainly the built envi-ronment (HOFIERKA & KAŇUK 2009). Such installations will therefore need to be integrated into buildings and other infrastructure, which often have complex morphologies in urban settings. In order to fully exploit the potential that solar PV has to offer, understanding and identifying suitable surfaces for installations is essential to ensure the most cost-effective and environmentally efficient results. Therefore, an understanding of the urban solar poten-tial at a building level is important for urban planners, PV installers, householders, and other decision-makers within the solar energy sector. However, there are few applications or tools to date that deliver quick but accurate results that account for urban morphology (NGUYEN & PEARCE 2012).
As a tool for processing complex spatial information, geographical information systems (GIS) may contribute to the effective assessment of solar resources. Moreover, an accurate
GI_Forum ‒ Journal for Geographic Information Science, 1-2015. © Herbert Wichmann Verlag, VDE VERLAG GMBH, Berlin/Offenbach. ISBN 978-3-87907-558-4. © ÖAW Verlag, Wien. ISSN 2308-1708, doi:10.1553/giscience2015s147.

H. El-Hosaini 148
assessment of any such patterns or trends at a building level clearly requires a 3-dimen-sional (3D) evaluation. The potential of 3D city models to distinctly represent individual buildings, vegetation, streets, and other city infrastructure makes them ideal for urban stud-ies (NGUYEN & PEARCE 2012) and simulations (ALAM et al. 2012), and will likely trans-form the landscape of urban modeling altogether.
2 Review of Literature
There have been an increasing number of GIS-based assessments of solar radiation and/or PV potential in the academic literature (e.g. SÚRI et al. 2007, HOFIERKA & KAŇUK 2009, CARNEIRO et al. 2009, AGUGIARO et al. 2012, NGUYEN & PEARCE 2012, HOFIERKA &
ZLOCHA 2012, ALAM et al. 2012). These often account for shadow detection techniques or algorithms, as shadows significantly impact insolation levels and their distribution in urban environments is highly complex (HOFIERKA & ZLOCHA 2012). However, the geometric representation of the urban model used in these studies fundamentally affects the tech-niques and analyses that are possible. Most urban-based studies use 2.5D digital surface models (DSMs) (e.g. CARNEIRO et al. 2009, AGUGIARO et al. 2012, NGUYEN & PEARCE 2012). Nowadays, with high quality, realistic 3D city models, new possibilities and tech-niques are being explored (e.g. HOFIERKA & KAŇUK 2009, HOFIERKA & ZLOCHA 2012, ALAM et al. 2012).
2.1 Visualisation of 3D City Models
Many applications of 3D city models are restricted to the visualisation of virtual scenes (KOLBE & GRÖGER 2009). However, 3D models were found to be more ‘useful’ when they not only depict the real world, but also included additional information (e.g. solar potential information, distribution of air pollution) (BLEISCH 2012). Adding semantic meaning, as such, transforms them into analytical visualisations, which offer new possibilities for com-municating ideas and design alternatives in urban planning (ZLATANOVA et al. 2010). Their ability to represent individual roof and façade surfaces makes them particularly suitable to PV analyses. Levels of interactivity can also be incorporated for presentation and commu-nication (e.g. animation).
2.2 GIS-based Solar Radiation Models
Since the 1990s, several solar radiation models have been developed that use DEMs as in-puts to determine topographic features (e.g. elevation, slope, aspect, topographic shading), but use different approaches to estimating the solar radiation. The r.sun model, available in the open-source GRASS GIS environment (NETELER & MITASOVA 2008), is well-known, accessible, and has been tested in a variety of studies with reliable results (ROMERO et al. 2008, RUIZ-ARIAS et al. 2009, NGUYEN & PEARCE 2010, AGUGIARO et al. 2012).
The first 3D vector-based solar radiation model, v.sun (HOFIERKA & ZLOCHA 2012), is based on the same solar radiation methodology as r.sun. It uses a voxel-based data model and a space tessellation approach. It was applied to a 3D city model of Presov, Slovakia, demonstrating its ability to illustrate the distribution of solar radiation over different parts of buildings, including façades. Also developed for GRASS GIS, it is not yet available.
Locating and Positioning Solar Panels in a 3D City Model: A Case Study of Newcastle, UK 149
2.3 Shadow Detection Techniques
Shadow casting algorithms in 2.5D require innovative techniques due to their inability to truly represent vertical surfaces (e.g. RATTI & RICHENS 2004, CARNEIRO et al. 2009). NGUYEN & PEARCE (2012) ran r.sun simulations, with and without its shadowing algorithm applied, in order to determine which pixels were shaded at specified times. This was per-formed for each daylight hour and pixels were then averaged to give ‘shade fractions’. This technique identifies sections of roofs that are more suitable for PV installations.
ALAM et al. (2012) introduced an approach to 3D shadow casting similar to ray-tracing techniques used in CAD software. This involves triangulating all polygon surfaces within the 3D model, and drawing a line from the centre point of each triangle in the direction of the sun, representing the sun’s ray at that instant. The sun’s ray is checked for intersections with other surfaces in the model. An intersection implies the triangle is shaded, and shaded triangles are then combined to illustrate the total shaded area. This technique allows partial shading on individual surfaces to be accurately identified and depicted in 3D. It only con-siders the shadow effects of direct radiation.
3 Data and Methods
3.1 3D City Model
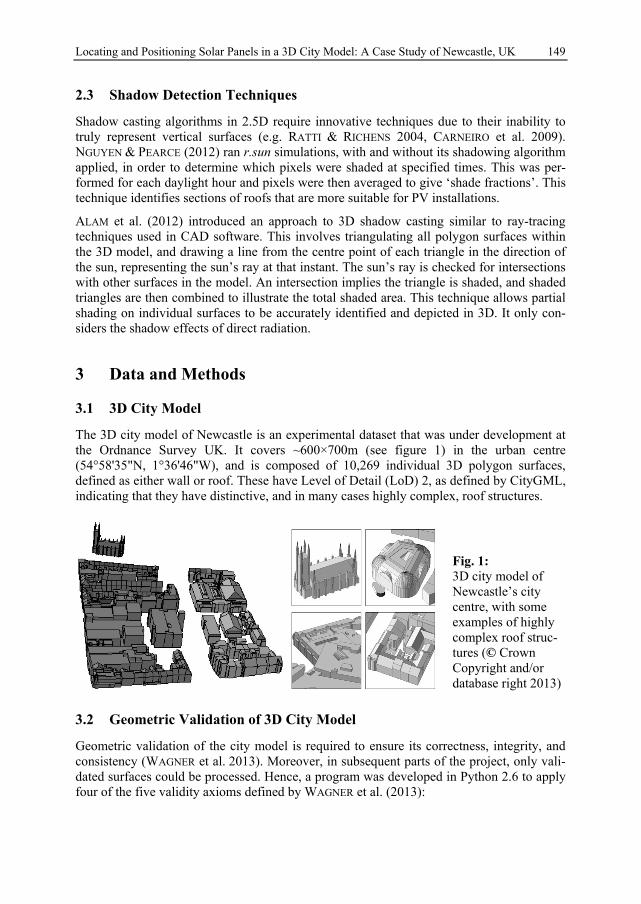
The 3D city model of Newcastle is an experimental dataset that was under development at the Ordnance Survey UK. It covers ~600×700m (see figure 1) in the urban centre (54°58'35"N, 1°36'46"W), and is composed of 10,269 individual 3D polygon surfaces, defined as either wall or roof. These have Level of Detail (LoD) 2, as defined by CityGML, indicating that they have distinctive, and in many cases highly complex, roof structures.
Fig. 1: 3D city model of Newcastle’s city centre, with some examples of highly complex roof struc-tures (© Crown Copyright and/or database right 2013)
3.2 Geometric Validation of 3D City Model
Geometric validation of the city model is required to ensure its correctness, integrity, and consistency (WAGNER et al. 2013). Moreover, in subsequent parts of the project, only vali-dated surfaces could be processed. Hence, a program was developed in Python 2.6 to apply four of the five validity axioms defined by WAGNER et al. (2013):

H. El-Hosaini 150
The polygon must consist of at least four ordered points The first and last points are identical (i.e. it is closed) All points in the sequences (except the first and last) are different The boundary must be planar
A fifth ‘no self-intersections’ axiom was not implemented due to time constraints in the project. The planarity check was implemented using a method similar to Algorithm 3 de-scribed by WAGNER et al. (2013). A polygon is planar if all points in its sequence are co-planar. Planarity can therefore be validated by checking that for each set of three con-secutive points defining the polygon, the unit normal vector is the same as all other unit normal vectors defined for that polygon, within a small pre-defined threshold. The thresh-old accounts for surfaces that are ‘nearly’ planar, so may be affected by floating point er-rors in the program or minor mismatches in manual editing. The procedure for calculating the unit vector, and hence for validating planarity, was adapted from KOLECKA (2012).
3.3 Calculating 3D PV Assessment Attributes
The 3D city model was extended to include geometric and geographic attributes relevant to PV assessment and optimal location planning. These include slope, aspect, 3D surface area, and monthly and annual solar irradiance (kWh/m2) and PV estimates (kWh/kWp).
3.3.1 Calculating 3D Surface Parameters
The processing of true 3D surfaces in GIS is impossible or limited (SCHÖN et al. 2009), so vector algebra techniques were introduced through separate scripting procedures. The cal-culation of slope, aspect, and 3D surface area were implemented in Python 2.6.
To calculate the slope and aspect, the unit normal vector ˆ , , )(x y zi i ii n n n n must first be
determined. The slope, ς, is then given by arccoszi
n , and the aspect, ψ, is given by
arctan2
y
x
i
i
n
n
(KOLECKA 2012).
The surface area of a planar polygon 0 )( , ... , nP p p in 3D space is given by 10 1( )ˆ( ) n
i iiA P n p p . The full derivation is given in SUNDAY (2012).
3.3.2 Determining and Visualising Solar Irradiance Estimates
Monthly and annual solar irradiance estimates were determined for clear-sky conditions using the r.sun solar radiation model. A DSM was first created at a 0.25m resolution by effectively ‘burning’ the 3D city model surfaces into a DTM of Newcastle using ESRI’s custom geoprocessing tool AddBuildingstoDEM (ARCGIS RESOURCE CENTER 2012).
The r.horizon module was run in GRASS to create 72 ‘horizon maps’ at 5° intervals, as required by r.sun’s shadowing algorithm. Slope and aspect raster maps were created using r.slope.aspect. These were input into the r.sun model along with the DSM, Linke turbidity (SODA, no date) and ground albedo coefficients (NASA 2013). Simulations were run with a
Locating and Positioning Solar Panels in a 3D City Model: A Case Study of Newcastle, UK 151
0.5 hour timestep for each day of the year (Wh.m-2.day-1). These were summed to monthly or annual estimates (kWh.m-2). Processing was automated with UNIX-based shell scripts.
The irradiance estimates were then ‘re-projected’ back to the 3D city model. Surfaces that would not be accurately represented were eliminated (i.e. slope ≥ 85°, or 2D footprint area < 0.25m2). Irradiance estimates were averaged for each surface for visualisation purposes.
3.3.3 Converting to PV Estimates
PV yield is often a preferable measurement to solar irradiance, as it can be directly used in economic and environmental assessments. It is expressed as the total electricity generated from a PV system for a given time period (i.e. kilowatt-hours, kWh) (SÚRI et al. 2007):
kE P G PR (Eqn 1)
Where Pk is the unit peak power (kWp), PR is the system performance ratio, and G is the total annual sum of global irradiation (kWh.m-2). The kilowatt-peak (kWp), or peak power, is commonly assumed to be 1-kWp. The performance ratio for a typical roof-mounted system is approximately 0.75. This reduces the calculation of total annual electricity generated, expressed as kilowatt-hours from each kilowatt-peak (kWh/kWp), to 0.75 · G.
3.4 Detecting and Analysing Shadows
A detailed shadow analysis was made of a selected roof, which is particularly occluded by tall buildings to the east and south, for the 21st of March 2014. The surface was triangulated at a 0.2m resolution using the open-source mesh generating software NETGEN 5.0 (SCHÖBERL 2009). Outputs were translated to a shapefile format, and triangle centroids were calculated.
For each daylight hour, a ‘sun ray’ was drawn from each centroid in the direction of the
sun. The sun ray unit vector, S , is calculated as ˆ (cos sin , cos cos , sin )z z z= A A S ,
where θz is the zenith angle and A is the azimuth angle (STINE & GEYER 2001). Solar zenith and azimuth angles were downloaded from NREL (no date). Each sun ray was then checked for intersections with all other 3D surfaces in the model. An intersection implied that the corresponding triangle was shaded for that hour. Shaded triangles were then aggregated to produce a multipatch ‘snapshot’ of shadows cast at that time. A static image was calculated, showing mean non-shaded percentages for that day. Daily visual animations were also created of the shadows cast across the surface each hour.
4 Results
4.1 Geometric Validation of City Model
All polygons in all datasets fulfilled the first two validity axioms, i.e. that they are defined by at least four points and they are closed. Duplicated points were detected in 35 polygons (i.e. 0.34% of all polygons). The number of polygons identified as non-planar is dependent on the normal threshold value applied, ε. WAGNER et al. (2013) used a default value of 0.01. Various values of ε were investigated in this project. A value of 0.02 was used, as this

H. El-Hosaini 152
was found to be small enough for truly non-planar surfaces to be identified, but allows most of those with imprecisions or computational errors to be considered as planar.
4.2 Visualisation of 3D Assessment Attributes
The 3D surface parameters for slope, aspect, and surface area were successfully attributed to the validated city model surfaces.
Outputs from the r.sun model were roughly validated against those published by NASA for monthly averaged clear-sky insolation on a horizontal surface (kWh.m-2.day-1) (NASA 2013). Averaging values for all horizontal surfaces gives lower estimates than those of NASA, presumably due to shadowing effects on some surfaces. Averaging values for the ten horizontal surfaces receiving the highest annual insolation levels gives a much closer estimate. These are assumed to be less susceptible to shadowing. The monthly and annual solar irradiance estimates were then converted to PV estimates by applying equation 1.
Both 2D and 3D visualisations of both solar irradiance and PV estimates were created. The 2D ‘hybrid’ images combine the raster-based estimates with vector footprints to portray heterogeneous demarcated surfaces (see figure 2). The 3D visualisations display estimates averaged over each surface, giving a homogeneous impression of its distribution (see figure 3). A year-long animation of monthly estimates was also produced (not available here), demonstrating another type of visual tool that may descend from these techniques.
Fig. 2: 2D ‘hybrid’ image demonstrating the heterogeneous nature of total annual solar irradiance (kWh/m2) (© Crown Copyright and/or database right 2013)
The 3D visualisation of solar irradiance and/or PV estimates, combined with the 3D surface parameters, can be used as a potential tool for multi-criteria analyses.

Locating and Positioning Solar Panels in a 3D City Model: A Case Study of Newcastle, UK 153
Fig. 3: 3D visualisation of annual PV estimates (kWh/kWp) averaged for each surface, from different viewpoints (© Crown Copyright and/or database right 2013)
4.3 Shadow Detection Analysis
The surface triangulation at 0.2m resolution resulted in 3922 triangles. The sun rays drawn from the centroid of each triangle for each of 12 daylight hours on 21st March, 2014 are displayed in figure 4. A close-up of a subset of sun rays and intersections with surrounding buildings is depicted in figure 5.
Fig. 4: Sun rays drawn from a single surface for each of 12 daylight hours (07:00-18:00) on March 21st, 2014, from oblique and aerial viewpoints (© Crown Copyright and/or database right 2013)
Fig. 5: Random subset of sun rays (purple) and all sun ray intersections (yellow) dis-played at 13:00 on March 21st, 2014, with some sun rays intersecting the sur-rounding buildings (© Crown Copyright and/or database right 2013)

H. El-Hosaini 154
Figure 6 shows the shadows cast across the surface at 11:00, 12:00 and 13:00 on March 21st, 2014. An animation was created of the 12 hourly images, demonstrating another po-tential output descending from these techniques. Finally, static maps were created of mean non-shaded percentages for each triangle, averaged over all daylight hours (see figure 7). This gives an accurate visual depiction of how shading affects sub-sections of the surface.
Fig. 6: Shadows (grey) cast across surface at 11:00, 12:00, and 13:00 (respectively) on March 21st, 2014
Fig. 7: Static patterned image of mean non-shaded percentages (© Crown Copyright and/or database right 2013)
5 Discussion
The development of multifunctional 3D city models for analysis and simulation is increas-ing, particularly in the urban planning sector (KOLBE & GRÖGER 2009). As demonstrated in this project, these allow several factors to be incorporated into a single visual tool, and multi-criteria analyses can be made quickly and easily, with results visualised instantly. Developing a 3D ‘inventory’ of solar-related attributes may contribute to future projects and analyses. The level of interaction possible with such 3D models is important to users (ZLATANOVA et al. 2010). A year-long animation was incorporated into the PV assessment tool to demonstrate monthly changes in estimates. Navigation around the city model is possible in an appropriate 3D environment. Users can also ‘click/query’ surfaces for more detailed information (e.g. 3D surface parameters, monthly estimates, etc.).
However, the main drawback of a 3D representation is that values must be aggregated over a given surface. Sub-sections of surfaces cannot be identified with respect to solar irradi-ance and/or PV estimates. A more detailed analysis of suitable surface sub-sections is there-fore necessary, and is achieved using 3D shadow detection analyses (ALAM et al. 2012). The presentation of both daily shadow animations and mean non-shaded percentage images are unique to this project and are immediately and intuitively comprehensive, giving clear and meaningful results.

Locating and Positioning Solar Panels in a 3D City Model: A Case Study of Newcastle, UK 155
A combination of the 3D PV assessment tool and the 3D shadow visualisations presented in this project are considered to be a useful approach for selecting suitable sub-sections of individual surfaces at the city level.
The analyses in this project have focused on the current physical built environment. How-ever, a number of critical questions in sustainable urban design and planning also focus on the impact of planned and new buildings, and how to build denser cities without decreasing the current solar potential (CARNEIRO et al. 2009, NGUYEN & PEARCE 2012). From the initial design stages, such buildings could be embedded into the model, and assessed for their own solar potential, as well as their impact on surrounding infrastructure.
A major assumption made throughout this project is that all PV panels are laid flat on build-ing surfaces (i.e. all solar irradiance and PV estimates are calculated for the defined build-ing surfaces). However, PV panels are frequently positioned with other inclinations, par-ticularly on large flat roofs where optimal inclination is preferable.
6 Conclusions
Both a 3D visual PV assessment tool for locating solar panels at the city scale, and a shad-ow detection technique resulting in 3D visualisations of shadow patterns were developed. Both were achieved using a 3D city model that was geometrically validated as required. In combination, these 3D visual tools can be used analytically, allowing the user to first apply a multi-criteria analysis at an urban scale to prioritise suitable surfaces for installations, and then to identify sub-sections of a surface that may be more or less suitable. Sub-section identification is particularly important for large surfaces, across which irradiation may vary significantly due to local overshadowing.
Acknowledgements
The Ordnance Survey developed and supplied the 3D city model of Newcastle. The project was registered on their MSc Dissertation Programme 2013, and wouldn’t have been pos-sible without their support.
References
AGUGIARO, G., NEX, F., REMONDINO, F., DE FILIPPI, R., DROGHETTI, S. & FURLANELLO, C. (2012), Solar radiation estimation on building roofs and web-based solar cadastre. ISPRS Annals of the Photogrammetry, Remote Sensing and Spatial Information Sci-ences, (I-2), 177-182.
ALAM, N., COORS, V., ZLATANOVA, S. & OOSTEROM, P. J. M. (2012), Shadow effect on photovoltaic potentiality analysis using 3D city models. International Archives of Pho-togrammetry, Remote Sensing and Spatial Information Sciences, 39 (B8), 209-214.

H. El-Hosaini 156
ARCGIS RESOURCE CENTER (2012), Add Buildings into DEM. http://resources.arcgis.com/gallery/file/java/details?entryID=2929E846-1422-2418-A0DD-16627D87B471 (20th May 2013).
BLEISCH, S. (2012), 3D Geovisualisation – Definition and Structures for the Assessment of Usefulness. ISPRS Annals of the Photogrammetry, Remote Sensing and Spatial Infor-mation Sciences, (I-2), 129-134.
CARNEIRO, C., MORELLO, E., RATTI, C. & GOLAY, F. (2009), Solar Radiation over the Ur-ban Texture: LIDAR Data and Image Processing Techniques for Environmental Analy-sis at City Scale. In: LEE, J. & ZLATANOVA, S. (Eds.), 3D Geo-Information Sciences: Lecture Notes in Geoinformation and Cartography. Part II. Springer, Berlin, 319-340.
HOFIERKA, J. & KAŇUK, J. (2009), Assessment of photovoltaic potential in urban areas using open-source solar radiation tools. Renewable Energy, 3, 2206-2214.
HOFIERKA, J. & ZLOCHA, M. (2012), A New 3-D Solar Radiation Model for 3-D City Mod-els. Transactions in GIS, 16 (5), 681-690.
KOLBE, T. H. & GRÖGER G. (2009), Towards Unified 3D City Models. In SCHIEWE, J., HAHN, M., MADDEN, M., & SESTER, M. (Eds.), Challenges in Geospatial Analysis, Inte-gration and Visualization II. International Society for Photogrammetry and Remote Sensing Commission. IV Joint Workshop, Stuttgart, Germany.
KOLECKA, N. (2012), Vector Algebra for Steep Slope Model analysis. Landform Analysis, 21, 17-25.
NASA (2013), Surface Meteorology and Solar Energy. NASA. https://eosweb.larc.nasa.gov/sse/ (23rd February 2013).
NETELER, M. & MITASOVA, H. (2008), Open Source GIS: A GRASS GIS Approach (3rd edition). Springer, New York.
NGUYEN, H. T. & PEARCE, J. M. (2010), Estimating potential photovoltaic yield with r.sun and the open source GRASS. Solar Energy, 84 (5), 831-843.
NGUYEN, H. T. & PEARCE, J. M. (2012), Incorporating Shading Losses in Solar Photo-voltaic Potential Assessment at the Municipal Scale. Solar Energy, 86 (5), 1245-1260.
NREL (no date), Solar and Lunar Position Calculators. http://www.nrel.gov/midc/solpos/ (14th August 2013).
PATEMAN, T. (2011), Rural and urban areas: comparing lives using rural/urban classifica-tions. Regional Trends 43. Office for National Statistics, UK.
RATTI C. & RICHENS P. (2004), Raster analysis of urban form. Environment and Planning B: Planning and Design, 31 (2), 297-309.
ROMERO, L. F., TABIK, S., VÍAS, J. M., & ZAPATA, E. L. (2008), Fast clear-sky solar irra-diation computation for very large digital elevation models. Computer Physics Com-munications, 178, 800-808.
RUIZ-ARIAS, J. A., TOVAR-PESCADOR, J., POZO-VÁZQUEZ, D. & ALSAMAMRA, H. (2009), A comparative analysis of DEM-based models to estimate the solar radiation in moun-tainous terrain. Int’l Journal of Geographical Information Science, 23(8), 1049-1076.
SCHÖBERL, J. (2009), NETGEN – 4.X. http://netgen-mesher.sourceforge.net/docs/ng4.pdf (12th August 2013).
SCHÖN, B., LAEFER, D. F., MORRISH, S. W. & BERTOLOTTO M. (2009), Three-Dimensional Spatial Information Systems: State of the Art Review. Recent Patents on Computer Sci-ence, 2 (1), 21-31.
SODA (no date), Climate: Averages, Normals and Typical Years. http://www.soda-is.com/eng/services/climat_free_eng.php#lin (21st February 2013).
Locating and Positioning Solar Panels in a 3D City Model: A Case Study of Newcastle, UK 157
SOLANGI, K. H., ISLAM, M. R., SAIDUR, R., RAHIM, N. A. & FAYAZ, H. (2011), A review on global solar energy policy. Renewable and Sustainable Energy Review, 15 (4), 2149-2163.
STINE, W.B. & GEYER, M. (2001), Chapter 3: The Sun’s Position. Power From The Sun. http://www.powerfromthesun.net/Book/chapter03/chapter03.html (7th August 2013).
SUNDAY, D. (2012), Area of Triangles and Polygons. http://geomalgorithms.com/a01-_area.htm (l8th May 2013).
SÚRI, M., HULD, T. A., DUNLOP, E. D. & OSSENBRINK, H. A. (2007), Potential of solar electricity generation in the European Union member states and candidate countries. So-lar Energy, 81, 1295-1305.
WAGNER, D., WEWETZER, M., BOGDAHN, J., ALAM, N., PRIES, M. & COORS, V. (2013), Geometric-Semantical Consistency Validation of CityGML Models. In: POULIOT, J., DANIEL, S., HUBERT, F. & ZAMYADI, A. (Eds), Progress and New Trends in 3D Geo-information Sciences. Lecture Notes in Geoinformation and Cartography. Springer, Ber-lin/Heidelberg, 171-192.
ZLATANOVA, S., ITARD, L, KIBRIA, M. S. & VAN DORST, M. (2010), A user requirements study of digital 3D models for urban renewal. Open House International, 35 (3), 37-46.