Perceptual Application Development using Intel Perceptual ...
Upload
trankhuongCategory
view
224download
0
Local Weighting: a Perceptual Quantization for JPEG2000
Jaime MorenoSuperior School of Mechanical and Electrical Engineers,
National Polytechnic Institute, Mexico City, [email protected]
Abstract— The aim of this work is to explain how to applyperceptual concepts to define a perceptual pre-quantizer andto improve JPEG2000 compressor.The approach consistsin quantizing wavelet transform coefficients using someof the human visual system behavior properties. Noise isfatal to image compression performance, because it canbe both annoying for the observer and consumes excessivebandwidth when the imagery is transmitted. Perceptual pre-quantization reduces unperceivable details and thus improveboth visual impression and transmission properties. Thecomparison between JPEG2000 without and with perceptualpre-quantization shows that the latter is not favorable inPSNR, but the recovered image is more compressed atthe same or even better visual quality measured with aweighted PSNR. Perceptual criteria were taken from theCIWaM (Chromatic Induction Wavelet Model).
Keywords: man Visual System, Wavelet Transform, ChromaticInduction Model, Image Coding
1. IntroductionDigital image compression has been a research topic for
many years and a number of image compression standardshas been created for different applications. The JPEG2000is intended to provide rate-distortion and subjective imagequality performance superior to existing standards, as wellas to supply functionality [1]. However JPEG2000 does notprovide the most relevant characteristics of the human visualsystem, since for removing information in order to compressthe image mainly information theory criteria are applied.This information removal introduces artifacts to the imagethat are visible at high compression rates, because of manypixels with high perceptual significance have been discarded.
Hence it is necessary an advanced model that removesinformation according to perceptual criteria, preservingthe pixels with high perceptual relevance regardless ofthe numerical information. The Chromatic InductionWavelet Model presents some perceptual concepts thatcan be suitable for it. Both CIWaM and JPEG2000 usewavelet transform. CIWaM uses it in order to generate anapproximation to how every pixel is perceived from a certaindistance taking into account the value of its neighboringpixels. By contrast, JPEG2000 applies a perceptualcriteria for all coefficients in a certain spatial frequency
independently of the values of its surrounding ones. Inother words, JPEG2000 performs a global transformationof wavelet coefficients, while CIWaM performs a local one.
CIWaM attenuates the details that the human visualsystem is not able to perceive, enhances those that areperceptually relevant and produces an approximation ofthe image that the brain visual cortex perceives. At longdistances, as Figure 3d depicts, the lack of information doesnot produce the well-known compression artifacts, rather itis presented as a softened version, where the details withhigh perceptual value remain (for example, some edges).
This paper is organized as follows: Section JPEG2000Quantization Overview specifies quantization and dequan-tization model used by JPEG2000 for encoding and re-construction of wavelet coefficients, thereby is describedthe Dead-zone Uniform Scalar Quantizer and the GlobalVisual Frequency Weighting for JPEG2000. Section Chro-matic Induction Wavelet Model describes the Chromatic as-similation/contrast phenomena. In Section Local PerceptualWeighting, the proposed method of pre-quantization will bediscussed. Experimental results applied for some test imagesare given in the next section. The last section is where theconclusions and future work will be exposed.
2. JPEG2000 Quantization Overview2.1 Dead-zone Uniform Scalar Quantizer
In 2002, Marcellin et. al. in [2] summarize, among others,the uniform scalar quantizer. This quantizer is described asa function that maps each element in a subset of the realline to a particular value, which ensures that more zerosresult. In this way all thresholds are uniformly spaced bystep size ∆, except for the interval containing zero, whichis called the dead-zone and extends from −∆ to +∆, thusa dead-zone means that the quantization range about 0 is 2∆.
For each spatial frequency s, a basic quantizer step size∆s is used to quantize all the coefficients in that spatialfrequency according to Equation 1.
q = sign(y)
⌊|y|∆s
⌋(1)

where y is the input to the quantizer or original waveletcoefficient value, sign(y) denotes the sign of y and q isthe resulting quantized index. Figure 1 illustrates such aquantizer with step size ∆.
Fig. 1DEAD-ZONE UNIFORM SCALAR QUANTIZER WITH STEP SIZE ∆:
VERTICAL LINES INDICATE THE ENDPOINTS OF THE QUANTIZATION
INTERVALS AND HEAVY DOTS REPRESENT RECONSTRUCTION VALUES.
The inverse quantizer or the reconstructed y is given bythe Equation 2, wherein δ is a parameter often set to placethe reconstruction value at the centroid of the quantizationinterval and varies form 0 to 1.
y =
(q + δ)∆s, q > 0(q − δ)∆s, q < 00, q = 0
(2)
The International Organization for Standardization recom-mends in [1] to adopt the mid-point reconstruction value,setting δ = 0.5. Experience indicates that some smallimprovements can be obtained by selecting a slightly smallervalue, as Pearlman and Said suggest [3] δ = 0.375, es-pecially for higher frequency subbands. It is important torealize that when −∆ < y < ∆, the quantizer level andreconstruction value are both 0. For a spatial frequency,there may be many coefficients usually those of higherfrequencies, that are set to 0. The array of quantizer levelsq is further encoded losslessly.
2.2 JPEG2000 Global Visual FrequencyWeighting
In JPEG2000, only one set of weights is chosen andapplied to wavelet coefficients according to a particularviewing condition (100, 200 or 400 dpi’s) with fixedvisual weighting. This viewing condition may be truncateddepending on the stages of embedding, in other words atlow bit rates, the quality of the compressed image is poorand the detailed features of the image are not availablesince at a relatively large distance the low frequencies areperceptually more important.
The table 1 specifies a set of weights which was designedfor the luminance component based on the Contrast Sen-sitivity Function (CSF) value at the mid-frequency of eachspatial frequency. The viewing distance is supposed to be4000 pixels, corresponding to 10 inches for 400 dpi printor display. The weight for LL is not included in the table,because it is always 1. Levels 1, 2, . . . , 5 denote the spatialfrequency levels in low to high frequency order with threespatial orientations, horizontal, vertical and diagonal.
Table 1RECOMMENDED JPEG2000 FREQUENCY WEIGHTING FOR 400 DPI’S
s horizontal vertical diagonal1 1 1 12 1 1 0.731 6683 0.564 344 0.564 344 0.285 9684 0.179 609 0.179 609 0.043 9035 0.014 774 0.014 774 0.000 573
3. Chromatic Induction Wavelet ModelIn order to explain the Chromatic assimilation/contrast
phenomena as a unique perceptual process, Otazu et al.propose in [4] a low-level Chromatic induction model ,which combines three important stimulus properties: spatialfrequency, spatial orientation and surround contrast.
Thereby the input image I is separated into differentspatial frequency and orientation components using amultiresolution wavelet decomposition. Thus every singletransformed coefficient is weighted using the response ofthe extended contrast sensitivity function (e-CSF, Figure 2),hence a perceptual Chromatic image Iρ is recovered. Thee-CSF is an extension of the perceptual CSF consideringboth spatial surround information and observation distance.Particulary the e-CSF value decreases when the surroundcontrast increases and vice versa.
Fig. 2CONTINUOUS FUNCTION: EXTENDED CONTRAST SENSITIVITY
FUNCTION. DASHED FUNCTION: PROFILE OF E-CSF C′ (s, zctr (s, o))
WITH zctr (x, y; s, o) = 0.75. DASHED-DOTTED FUNCTION: PROFILE OF
Cmin(s). DOTTED LINE: VALUES ABOVE THIS VALUE IMPLIES
BRIGHTNESS CONTRAST, AND VALUES BELOW IT IMPLIES BRIGHTNESS
ASSIMILATION.

Image I can be decomposed into a set of wavelet planesω of different spatial frequencies, where each wavelet planecontains details at different spatial resolutions and it isdescribed by:
I =
n∑s=1
∑o=v,h,d
ωos + cn (3)
where n is the number of wavelet planes. The term cn isthe residual plane and the index o represents the spatialorientation either vertical, horizontal or diagonal.
The perceptual image Iρ recovered from the waveletplanes can be written as:
Iρ =n∑
s=1
∑o=v,h,d
C ′ (s, zctr (s, o)) · ωos + cn. (4)
The term C ′ (s, zctr (s, o)) is the e-CSF weighting func-tion, that tries to emulate some perceptual properties ofhuman visual system, as described in [5], has a shape similarto the CSF and can be written as:
C ′ (s, zctr (s, o)) = zctr · Cd(s) + Cmin(s) (5)
where zctr is a non-linear function and an estimation of thecentral feature contrast relative to its surround contrast. Itsrange oscillates from zero to one and is defined by:
zctr =
[σcen
σsur
]21 +
[σcen
σsur
]2 (6)
being σcen and σsur the standard deviation of the waveletcoefficients in two concentric rings, which represent acenter−surround interaction around each coefficient.
The weighting function Cd(s) is an approximation to theperceptual CSF, emulates some perceptual properties and isdefined as a piecewise Gaussian function [6], such as:
Cd(s) =
e− s2
2σ21 , s = s− sthr ≤ 0,
e− s2
2σ22 , s = s− sthr > 0.
(7)
The term Cmin(s) avoids the C ′ (s, zctr (s, o)) functionto be zero and is defined by:
Cmin(s) =
{12 e
− s2
2σ21 , s = s− sthr ≤ 0,
12 , s = s− sthr > 0.
(8)
taking σ1 = 2 and σ2 = 2σ1. Both Cmin(s) and Cd(s)depend on the factor sthr, which is the scale associated to4cpd when an image is observed from a distance d witha pixel size lp and one visual degree, whose expression isdefined by Equation 9.
sthr = log2
(d tan(1◦)
4 lp
)(9)
This sthr value is associated to the CSF maximum value.Figure 3 shows three CIWaM images of Lena, which are cal-culated by Equation 4 for a 19 inch monitor with 1280 pixelsof horizontal resolution, at 30, 100 and 200 centimeters ofdistance.
Fig. 3PERCEPTUAL COLOR IMAGES OF Lena PERFORMED BY CIWAM. THE
LACK OF INFORMATION DOES NOT PRODUCE COMPRESSION ARTIFACTS,RATHER IT IS PRESENTED AS A SOFTENED VERSION.
(a) Original (b) 30 cm.
(c) 100 cm. (d) 200 cm.
4. Perceptual Local WeightingIn order to compare the JPEG2000 effectiveness and to get
each bit-plane, some transformed coefficients of the OriginalImage or Iorg are selected such that Iorg ≥ 2thr−bpl+1,where bpl is the desired bit-plane and thr is the maximumthreshold of Iorg , expressed as follows:
thr =
⌊log2
(max(i,j)
{∣∣∣Iorg(i,j)∣∣∣})⌋ (10)
Figure 4 depicts this process, which is applied for thethree components of a opponent color space, i.e. Intensity,Red-Green and Blue-Yellow, thus this selected coefficientsare inverse transformed in order to create a new Source ofImage Data and to separate the original one in bit-planes.

The modification of JPEG2000 core is illustrated in theblock diagram of Figure 5. To obtain wavelet coefficients ofI a Forward Transformation with the 9/7 filter fast wavelettransform is first applied on the source image data. Then,the perceptual quantized coefficients Q, calculated from aknown viewing distance d as follows:
Q =
n∑s=1
∑o=v,h,d
sign(ωos)
⌊|C′ (s, zctr (s, o)) · ωo
s |∆s
⌋+
⌊cn∆n
⌋(11)
This expression is similar to Equation 1, but introducesperceptual criteria to each coefficient contrary to theclassical Global Visual Frequency Weighting. A normalizedquantization step size ∆ = 1/128 is used, namely therange between the minimal and maximal values at Iρ isdivided into 128 intervals. Finally, the perceptual quantizedcoefficients are entropy coded, before forming the outputcode stream or bitstream.
Fig. 4BIT-PLANE SELECTION. SOME COEFFICIENTS ARE SELECTED PROVIDED
THAT THEY FULFIL THE CURRENT THRESHOLD.
At the decoder, the code stream is, first, entropy decodedin order to reconstruct the perceptual quantized coefficientsQ, second, dequantized using Equation 2 with a normalizedquantization step size ∆ = 1/128 and δ = 3/8. Finally, aninverse discrete wavelet transform is applied to recover Iρ ,thus providing the reconstructed perceived image data.
5. Experimental ResultsThe software used to obtain a JPEG2000 compression
for the experiments was JJ2000, developed by CannonResearch, École Polytechnique Fédérale de Lausanne andEricsson, available at http://jj2000.epfl.ch.
The Perceptual Local Weighting in JPEG2000 was testedon all the color images of the Miscellaneous volume ofthe University of Southern California Image Data Base,
available at http://sipi.usc.edu/database/. The data sets wereeight 256×256 pixel images (Figure 6) and eight 512×512pixel images (Figure 7), but only visual results of the well-known images Lena, F-16 and Baboon are depicted, whichare 24-bit color images and 512 × 512 of resolution. TheCIWaM images were calculated for a 19 inch monitor with1280 pixels of horizontal resolution at 50 centimeters ofviewing distance.
The Peak Signal to Noise Ratio or PSNR [7] between theoriginal image f(i, j) and the reconstructed image f(i, j)
Fig. 5GENERAL BLOCK DIAGRAM OF JPEG2000 COMPRESSION, APPLYING
BETWEEN TRANSFORMATION AND QUANTIZATION STEPS A
PERCEPTUAL LOCAL WEIGHTING FUNCTION INTO THE WAVELET
COEFFICIENTS.
Fig. 6TESTED 256 X 256 PIXEL 24-BIT COLOR IMAGES, OBTAINED FROM THE
UNIVERSITY OF SOUTHERN CALIFORNIA IMAGE DATA BASE.

was developed to calculate objectively the degradationsintroduced into the compression process. PSNR is a functionof the Mean Square Error (MSE) and is defined as:
PSNR = 10 log10
(Gmax
2
MSE
)(12)
where Gmax is the maximum possible intensity value inf(i, j) (M ×N size) and the MSE has the form:
MSE =1
NM
N∑i=1
M∑j=1
[f(i, j)− f(i, j)
]2(13)
However PSNR does not calculate perceptual qualitymeasures. Therefore, it is necessary to weight each PSNRterm by means of its local activity factor, taking into accountthe local variance of the neighbors of the studied waveletcoefficients, thus defining a weighted PSNR or wPSNR [8],[9]. The wPSNR increases with increasing variance and viceversa as:
wPSNR = 10 log10
(Gmax
2
wMSE
)(14)
where the weighted MSE (wMSE) is defined as:
wMSE =1
NM
N∑i=1
M∑j=1
[f(i, j)− f(i, j)
1 + V ar(i, j)
]2
(15)
Figure 8 shows the assessment results of the averageperformance of color image compression for each bit-planeusing a Dead-zone Uniform Scalar Quantizer (continuousfunction with heavy dots), and adding to it a previousquantization step developed by CIWaM (continuousfunction with heavy stars).
CIWaM used as a method of pre-quantization, achievesbetter compression ratios with the same threshold, reaching
Fig. 7TESTED 512 X 512 PIXEL 24-BIT COLOR IMAGES, OBTAINED FROM THE
UNIVERSITY OF SOUTHERN CALIFORNIA IMAGE DATA BASE.
Fig. 8JPEG2000 COMPRESSION RATIO BY BIT-PLANE. CONTINUOUS
FUNCTION WITH HEAVY DOTS: JPEG2000 ONLY QUANTIZED BY THE
DEAD-ZONE UNIFORM SCALAR MANNER. CONTINUOUS FUNCTION
WITH HEAVY STARS: JPEG2000 PRE-QUANTIZED BY THE CHROMATIC
INDUCTION WAVELET MODEL, IN ADDITION TO A DEAD-ZONE UNIFORM
SCALAR QUANTIFICATION.
better results at the highest bit-planes, since CIWaM reducesunperceivable coefficients. Figure 9 shows the contributionof CIWaM in the JPEG2000 compression ratio, for exampleat the eighth bit-plane, CIWaM diminishes 1.2423 bits perpixel less than without it, namely in a 512×512 pixel colorimage, CIWaM estimates that 39.75KB of information isperceptually irrelevant at 50 centimeters.
The comparison between compression ratio and imagequality is depicted by the Figure 10, which shows that thereconstructed images pre-quantized by CIWaM (continuousfunction with heavy stars) has less PSNR but higherwPSNR (continuous function with heavy asterisks) than theones quantized just by a scalar way (continuous functionwith heavy dots), i.e. even if the reconstructed image hasa lower objective quality, this image could have a higherperceptual quality.
Both Figure 11 and 12 depict examples of reconstructedimages compressed at 0.9 and 0.4 bits per pixel, respectively,by means of JPEG2000 without (a) and with perceptualpre-quantization (b). Also this figures demonstrate that theCIWaM subjective quality is higher than the objective one.
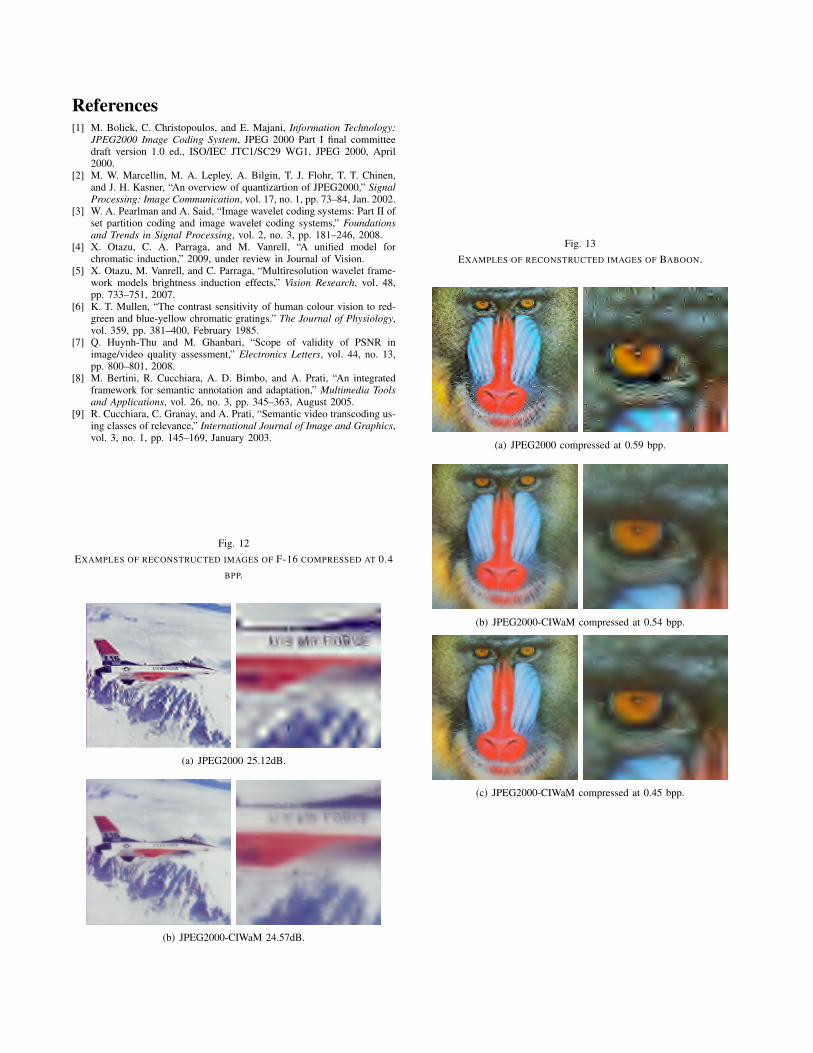
The Figure 13 shows examples of reconstructed imagesof Baboon compressed at 0.59, 0.54 and 0.45 bits per pixelby means of JPEG2000 without (a) and with perceptualpre-quantization (b and c). PSNR in 13a is 26.18dB andin 13b is 26.15dB but wPSNR is equal to 34.08 decibels,
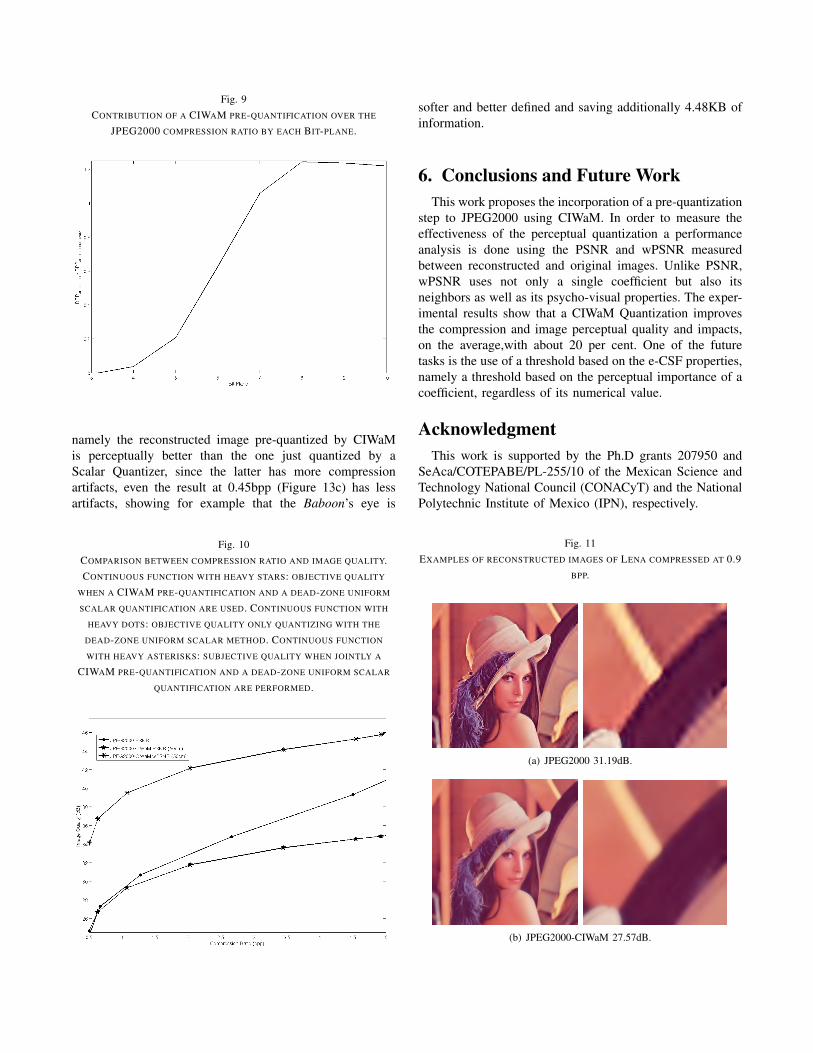
Fig. 9CONTRIBUTION OF A CIWAM PRE-QUANTIFICATION OVER THE
JPEG2000 COMPRESSION RATIO BY EACH BIT-PLANE.
namely the reconstructed image pre-quantized by CIWaMis perceptually better than the one just quantized by aScalar Quantizer, since the latter has more compressionartifacts, even the result at 0.45bpp (Figure 13c) has lessartifacts, showing for example that the Baboon’s eye is
Fig. 10COMPARISON BETWEEN COMPRESSION RATIO AND IMAGE QUALITY.CONTINUOUS FUNCTION WITH HEAVY STARS: OBJECTIVE QUALITY
WHEN A CIWAM PRE-QUANTIFICATION AND A DEAD-ZONE UNIFORM
SCALAR QUANTIFICATION ARE USED. CONTINUOUS FUNCTION WITH
HEAVY DOTS: OBJECTIVE QUALITY ONLY QUANTIZING WITH THE
DEAD-ZONE UNIFORM SCALAR METHOD. CONTINUOUS FUNCTION
WITH HEAVY ASTERISKS: SUBJECTIVE QUALITY WHEN JOINTLY A
CIWAM PRE-QUANTIFICATION AND A DEAD-ZONE UNIFORM SCALAR
QUANTIFICATION ARE PERFORMED.
softer and better defined and saving additionally 4.48KB ofinformation.
6. Conclusions and Future WorkThis work proposes the incorporation of a pre-quantization
step to JPEG2000 using CIWaM. In order to measure theeffectiveness of the perceptual quantization a performanceanalysis is done using the PSNR and wPSNR measuredbetween reconstructed and original images. Unlike PSNR,wPSNR uses not only a single coefficient but also itsneighbors as well as its psycho-visual properties. The exper-imental results show that a CIWaM Quantization improvesthe compression and image perceptual quality and impacts,on the average,with about 20 per cent. One of the futuretasks is the use of a threshold based on the e-CSF properties,namely a threshold based on the perceptual importance of acoefficient, regardless of its numerical value.
AcknowledgmentThis work is supported by the Ph.D grants 207950 and
SeAca/COTEPABE/PL-255/10 of the Mexican Science andTechnology National Council (CONACyT) and the NationalPolytechnic Institute of Mexico (IPN), respectively.
Fig. 11EXAMPLES OF RECONSTRUCTED IMAGES OF LENA COMPRESSED AT 0.9
BPP.
(a) JPEG2000 31.19dB.
(b) JPEG2000-CIWaM 27.57dB.
References[1] M. Boliek, C. Christopoulos, and E. Majani, Information Technology:
JPEG2000 Image Coding System, JPEG 2000 Part I final committeedraft version 1.0 ed., ISO/IEC JTC1/SC29 WG1, JPEG 2000, April2000.
[2] M. W. Marcellin, M. A. Lepley, A. Bilgin, T. J. Flohr, T. T. Chinen,and J. H. Kasner, “An overview of quantizartion of JPEG2000,” SignalProcessing: Image Communication, vol. 17, no. 1, pp. 73–84, Jan. 2002.
[3] W. A. Pearlman and A. Said, “Image wavelet coding systems: Part II ofset partition coding and image wavelet coding systems,” Foundationsand Trends in Signal Processing, vol. 2, no. 3, pp. 181–246, 2008.
[4] X. Otazu, C. A. Parraga, and M. Vanrell, “A unified model forchromatic induction,” 2009, under review in Journal of Vision.
[5] X. Otazu, M. Vanrell, and C. Parraga, “Multiresolution wavelet frame-work models brightness induction effects,” Vision Research, vol. 48,pp. 733–751, 2007.
[6] K. T. Mullen, “The contrast sensitivity of human colour vision to red-green and blue-yellow chromatic gratings.” The Journal of Physiology,vol. 359, pp. 381–400, February 1985.
[7] Q. Huynh-Thu and M. Ghanbari, “Scope of validity of PSNR inimage/video quality assessment,” Electronics Letters, vol. 44, no. 13,pp. 800–801, 2008.
[8] M. Bertini, R. Cucchiara, A. D. Bimbo, and A. Prati, “An integratedframework for semantic annotation and adaptation,” Multimedia Toolsand Applications, vol. 26, no. 3, pp. 345–363, August 2005.
[9] R. Cucchiara, C. Granay, and A. Prati, “Semantic video transcoding us-ing classes of relevance,” International Journal of Image and Graphics,vol. 3, no. 1, pp. 145–169, January 2003.
Fig. 12EXAMPLES OF RECONSTRUCTED IMAGES OF F-16 COMPRESSED AT 0.4
BPP.
(a) JPEG2000 25.12dB.
(b) JPEG2000-CIWaM 24.57dB.
Fig. 13EXAMPLES OF RECONSTRUCTED IMAGES OF BABOON.
(a) JPEG2000 compressed at 0.59 bpp.
(b) JPEG2000-CIWaM compressed at 0.54 bpp.
(c) JPEG2000-CIWaM compressed at 0.45 bpp.