Local Sales Tax Growth in 2017 Highest in Four years · Local Sales Tax Growth in 2017 . ... many...
12
Statewide Trends Local sales tax collections for calendar year 2017 totaled $16.6 billion, an increase of $620 million, or 3.9 percent, from the previous year. This marks the highest year-over-year growth since 2013. 1 (See Figure 1.) The increase in 2017 was driven largely by growth occurring in the fourth quarter, which was nearly twice as much as each of the prior three quarters, and one-half higher than for the fourth quarter of 2016. (See Figure 2.) Regional Trends For most regions, 2017 year-over-year collections growth was stronger than their average annual growth rate from 2010 to 2016. 2 However, New York City’s increase of 4.4 percent in 2017 was less than its prior years’ average. Its $7.4 billion in total collections accounted for 45 percent of total local sales tax collections statewide and over 64 percent of those downstate. (See Figure 3.) Thomas P. DiNapoli, State Comptroller OFFICE OF THE NEW YORK STATE COMPTROLLER Division of Local Government and School Accountability January 2018 Local Sales Tax Growth in 2017 Highest in Four Years -0.2% 9.5% 4.2% -6.0% 9.9% 5.2% 3.9% -8% -4% 0% 4% 8% 12% 2000 2001 2002 2003 2004 2005 2006 2007 2008 2009 2010 2011 2012 2013 2014 2015 2016 2017 Recessions Annual Change in Local Sales Tax Collections Source: New York State Department of Taxation and Finance with calculations by the Office of the New York State Comptroller (OSC). Notes: Includes New York City. Adjusted for correction adding $238 million to collections for New York City in calendar year 2015. Figure 1 0.8% 3.8% 3.1% 5.7% 0% 1% 2% 3% 4% 5% 6% 7% 1Q 2016 2Q 2016 3Q 2016 4Q 2016 1Q 2017 2Q 2017 3Q 2017 4Q 2017 Quarterly Year-Over-Year Change in Local Sales Tax Collections Source: New York State Department of Taxation and Finance with calculations by OSC. Notes: Includes New York City. Adjusted for correction adding $238 million to collections for New York City in calendar year 2015 Figure 2 2016 2017
Transcript of Local Sales Tax Growth in 2017 Highest in Four years · Local Sales Tax Growth in 2017 . ... many...
Statewide Trends
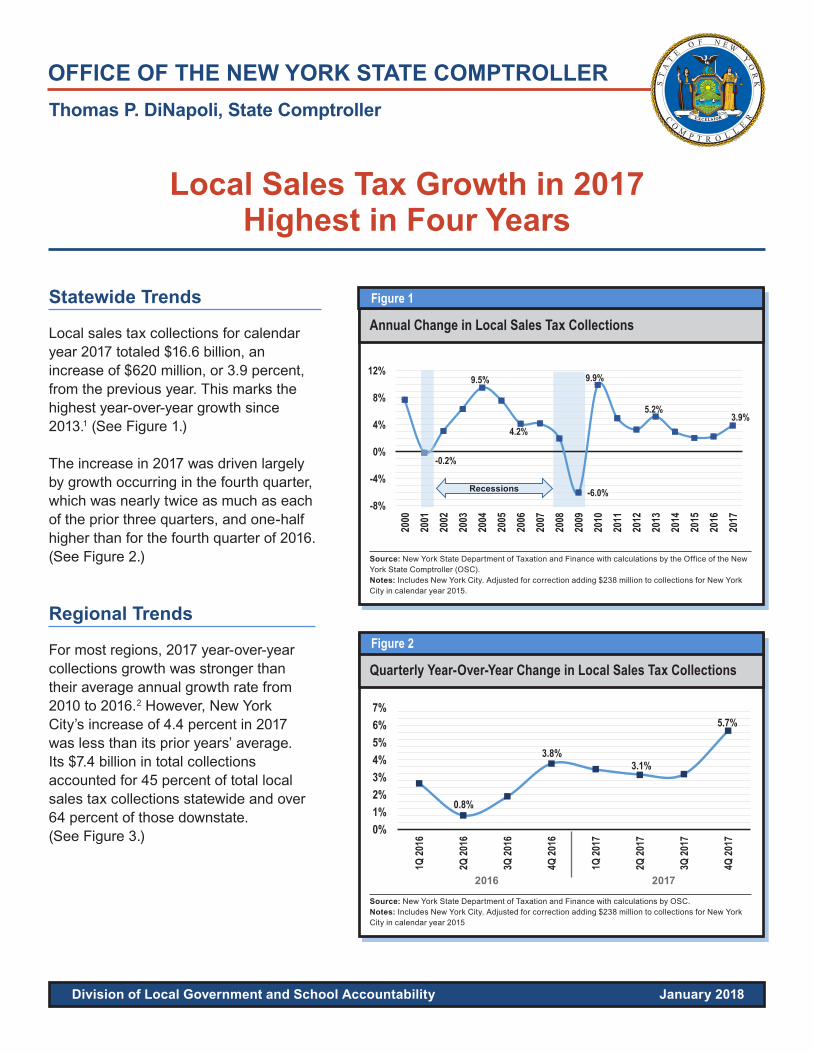
Local sales tax collections for calendar year 2017 totaled $16.6 billion, an increase of $620 million, or 3.9 percent, from the previous year. This marks the highest year-over-year growth since 2013.1 (See Figure 1.)
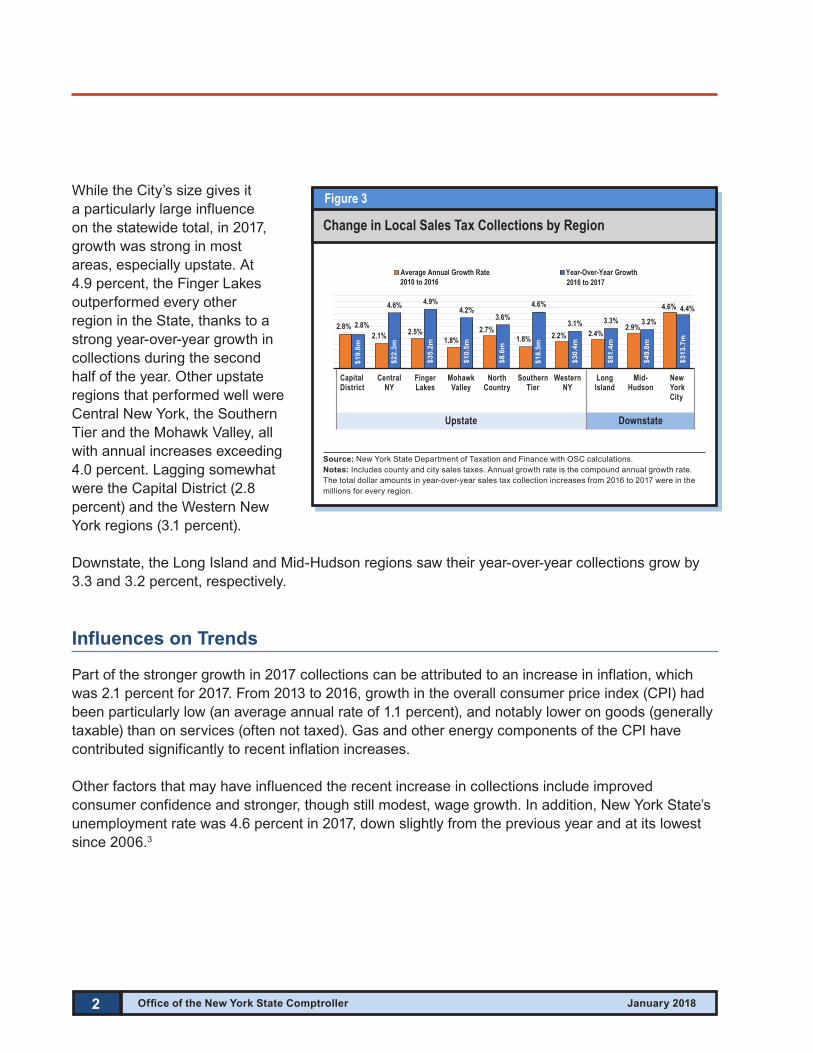
The increase in 2017 was driven largely by growth occurring in the fourth quarter, which was nearly twice as much as each of the prior three quarters, and one-half higher than for the fourth quarter of 2016. (See Figure 2.)
Regional Trends
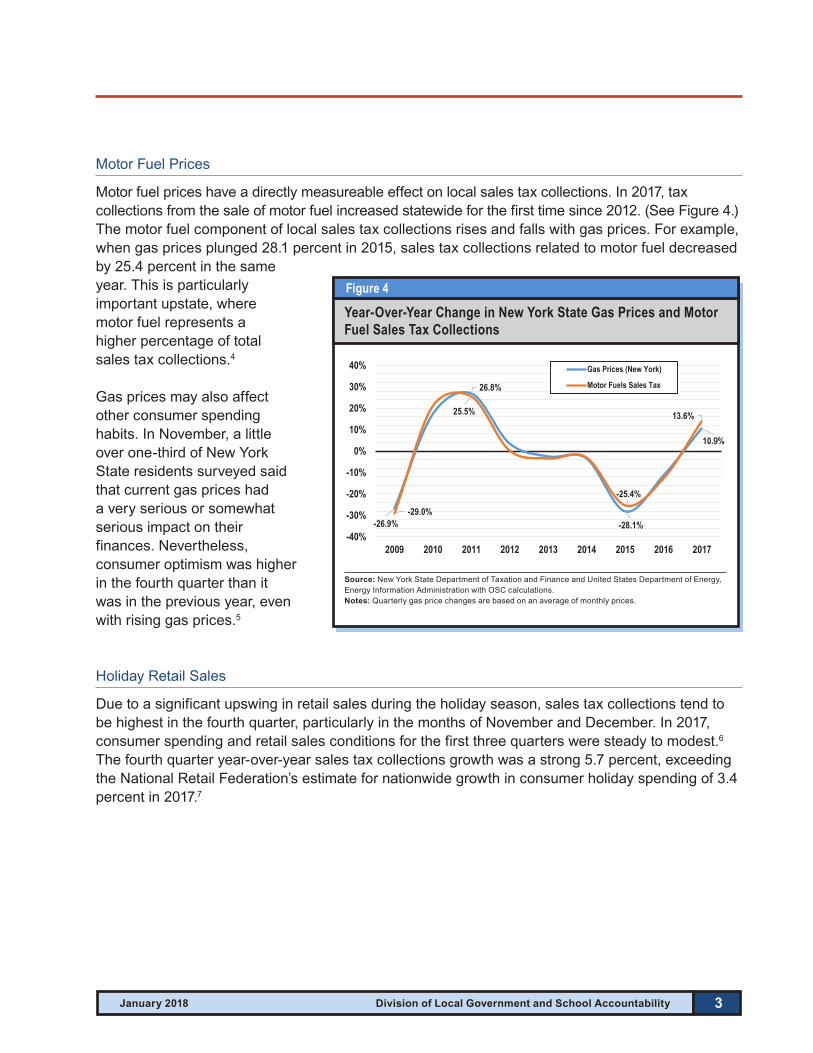
For most regions, 2017 year-over-year collections growth was stronger than their average annual growth rate from 2010 to 2016.2 However, New York City’s increase of 4.4 percent in 2017 was less than its prior years’ average. Its $7.4 billion in total collections accounted for 45 percent of total local sales tax collections statewide and over 64 percent of those downstate. (See Figure 3.)
Thomas P. DiNapoli, State Comptroller
OFFICE OF THE NEW YORK STATE COMPTROLLER
Division of Local Government and School Accountability January 2018
Local Sales Tax Growth in 2017 Highest in Four Years
-0.2%
9.5%
4.2%
-6.0%
9.9%
5.2%3.9%
-8%
-4%
0%
4%
8%
12%
2000
2001
2002
2003
2004
2005
2006
2007
2008
2009
2010
2011
2012
2013
2014
2015
2016
2017
Recessions
Annual Change in Local Sales Tax Collections
Source: New York State Department of Taxation and Finance with calculations by the Office of the New York State Comptroller (OSC). Notes: Includes New York City. Adjusted for correction adding $238 million to collections for New York City in calendar year 2015.
Figure 1
0.8%
3.8%3.1%
5.7%
0%1%2%3%4%5%6%7%
1Q 20
16
2Q 20
16
3Q 20
16
4Q 20
16
1Q 20
17
2Q 20
17
3Q 20
17
4Q 20
17
Quarterly Year-Over-Year Change in Local Sales Tax Collections
Source: New York State Department of Taxation and Finance with calculations by OSC. Notes: Includes New York City. Adjusted for correction adding $238 million to collections for New York City in calendar year 2015
Figure 2
2016 2017
2 Office of the New York State Comptroller January 2018
While the City’s size gives it a particularly large influence on the statewide total, in 2017, growth was strong in most areas, especially upstate. At 4.9 percent, the Finger Lakes outperformed every other region in the State, thanks to a strong year-over-year growth in collections during the second half of the year. Other upstate regions that performed well were Central New York, the Southern Tier and the Mohawk Valley, all with annual increases exceeding 4.0 percent. Lagging somewhat were the Capital District (2.8 percent) and the Western New York regions (3.1 percent).
Downstate, the Long Island and Mid-Hudson regions saw their year-over-year collections grow by 3.3 and 3.2 percent, respectively.
Influences on Trends
Part of the stronger growth in 2017 collections can be attributed to an increase in inflation, which was 2.1 percent for 2017. From 2013 to 2016, growth in the overall consumer price index (CPI) had been particularly low (an average annual rate of 1.1 percent), and notably lower on goods (generally taxable) than on services (often not taxed). Gas and other energy components of the CPI have contributed significantly to recent inflation increases.
Other factors that may have influenced the recent increase in collections include improved consumer confidence and stronger, though still modest, wage growth. In addition, New York State’s unemployment rate was 4.6 percent in 2017, down slightly from the previous year and at its lowest since 2006.3
2.8%2.1% 2.5%
1.8%2.7%
1.8% 2.2% 2.4%2.9%
4.6%
2.8%
4.6% 4.9%4.2%
3.6%4.6%
3.1% 3.3% 3.2%4.4%
Cap
ital D
istri
ct
Cen
tral N
Y
Fing
er L
akes
Moh
awk
Valle
y
Nor
th C
ount
ry
Sout
hern
Tie
r
Wes
tern
NY
Long
Isla
nd
Mid
-Hud
son
New
Yor
k C
ity
Average Annual Growth Rate Year-Over-Year Growth2010 to 2016 2016 to 2017
$19.
8m
$22.
3m
$35.
2m
$10.
5m
$8.6
m
$18.
5m
$30.
4m
$81.
4m
$49.
8m
$313
.7m
Upstate Downstate
Change in Local Sales Tax Collections by Region
Source: New York State Department of Taxation and Finance with OSC calculations. Notes: Includes county and city sales taxes. Annual growth rate is the compound annual growth rate. The total dollar amounts in year-over-year sales tax collection increases from 2016 to 2017 were in the millions for every region.
Figure 3
Capital Central Finger Mohawk North Southern Western Long Mid- New District NY Lakes Valley Country Tier NY Island Hudson York City
Upstate Downstate
3 January 2018 Division of Local Government and School Accountability
Motor Fuel Prices
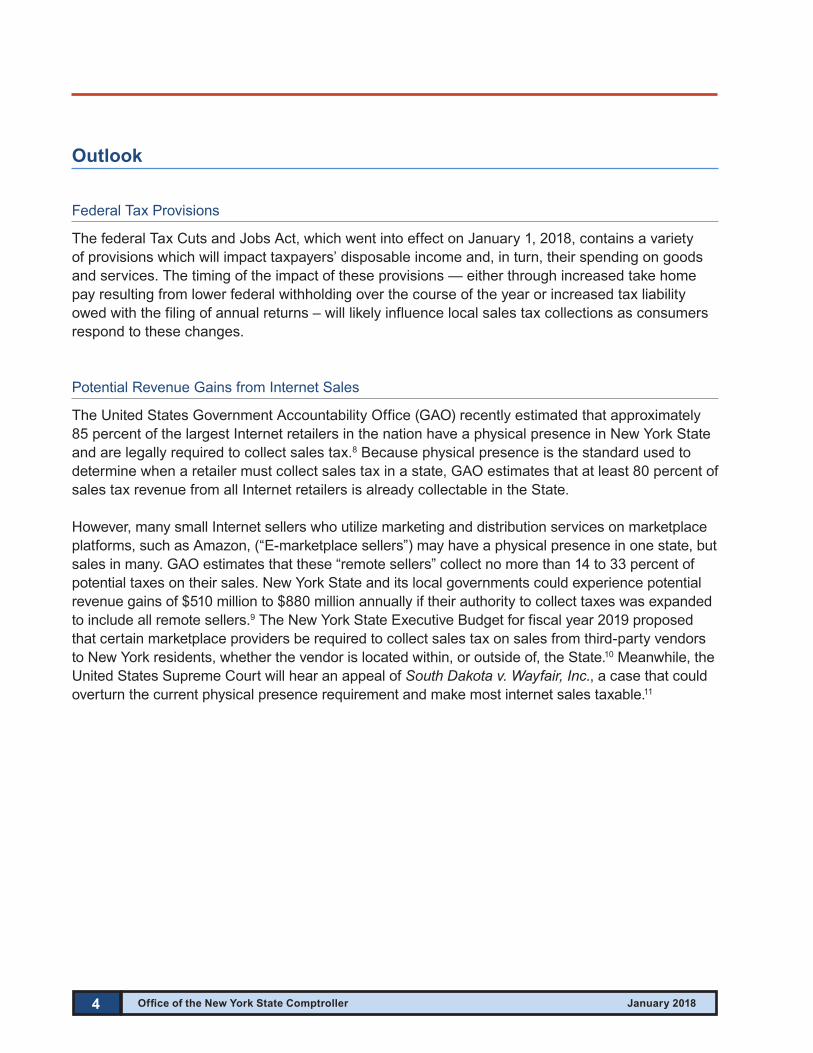
Motor fuel prices have a directly measureable effect on local sales tax collections. In 2017, tax collections from the sale of motor fuel increased statewide for the first time since 2012. (See Figure 4.) The motor fuel component of local sales tax collections rises and falls with gas prices. For example, when gas prices plunged 28.1 percent in 2015, sales tax collections related to motor fuel decreased by 25.4 percent in the same year. This is particularly important upstate, where motor fuel represents a higher percentage of total sales tax collections.4
Gas prices may also affect other consumer spending habits. In November, a little over one-third of New York State residents surveyed said that current gas prices had a very serious or somewhat serious impact on their finances. Nevertheless, consumer optimism was higher in the fourth quarter than it was in the previous year, even with rising gas prices.5
Holiday Retail Sales
Due to a significant upswing in retail sales during the holiday season, sales tax collections tend to be highest in the fourth quarter, particularly in the months of November and December. In 2017, consumer spending and retail sales conditions for the first three quarters were steady to modest.6 The fourth quarter year-over-year sales tax collections growth was a strong 5.7 percent, exceeding the National Retail Federation’s estimate for nationwide growth in consumer holiday spending of 3.4 percent in 2017.7
-26.9%
26.8%
-28.1%
10.9%
-29.0%
25.5%
-25.4%
13.6%
-40%
-30%
-20%
-10%
0%
10%
20%
30%
40%
2009 2010 2011 2012 2013 2014 2015 2016 2017
Gas Prices (New York)
Motor Fuels Sales Tax
Year-Over-Year Change in New York State Gas Prices and Motor Fuel Sales Tax Collections
Source: New York State Department of Taxation and Finance and United States Department of Energy, Energy Information Administration with OSC calculations.Notes: Quarterly gas price changes are based on an average of monthly prices.
Figure 4
4 Office of the New York State Comptroller January 2018
Outlook
Federal Tax Provisions
The federal Tax Cuts and Jobs Act, which went into effect on January 1, 2018, contains a variety of provisions which will impact taxpayers’ disposable income and, in turn, their spending on goods and services. The timing of the impact of these provisions — either through increased take home pay resulting from lower federal withholding over the course of the year or increased tax liability owed with the filing of annual returns – will likely influence local sales tax collections as consumers respond to these changes.
Potential Revenue Gains from Internet Sales
The United States Government Accountability Office (GAO) recently estimated that approximately 85 percent of the largest Internet retailers in the nation have a physical presence in New York State and are legally required to collect sales tax.8 Because physical presence is the standard used to determine when a retailer must collect sales tax in a state, GAO estimates that at least 80 percent of sales tax revenue from all Internet retailers is already collectable in the State.
However, many small Internet sellers who utilize marketing and distribution services on marketplace platforms, such as Amazon, (“E-marketplace sellers”) may have a physical presence in one state, but sales in many. GAO estimates that these “remote sellers” collect no more than 14 to 33 percent of potential taxes on their sales. New York State and its local governments could experience potential revenue gains of $510 million to $880 million annually if their authority to collect taxes was expanded to include all remote sellers.9 The New York State Executive Budget for fiscal year 2019 proposed that certain marketplace providers be required to collect sales tax on sales from third-party vendors to New York residents, whether the vendor is located within, or outside of, the State.10 Meanwhile, the United States Supreme Court will hear an appeal of South Dakota v. Wayfair, Inc., a case that could overturn the current physical presence requirement and make most internet sales taxable.11
5 January 2018 Division of Local Government and School Accountability
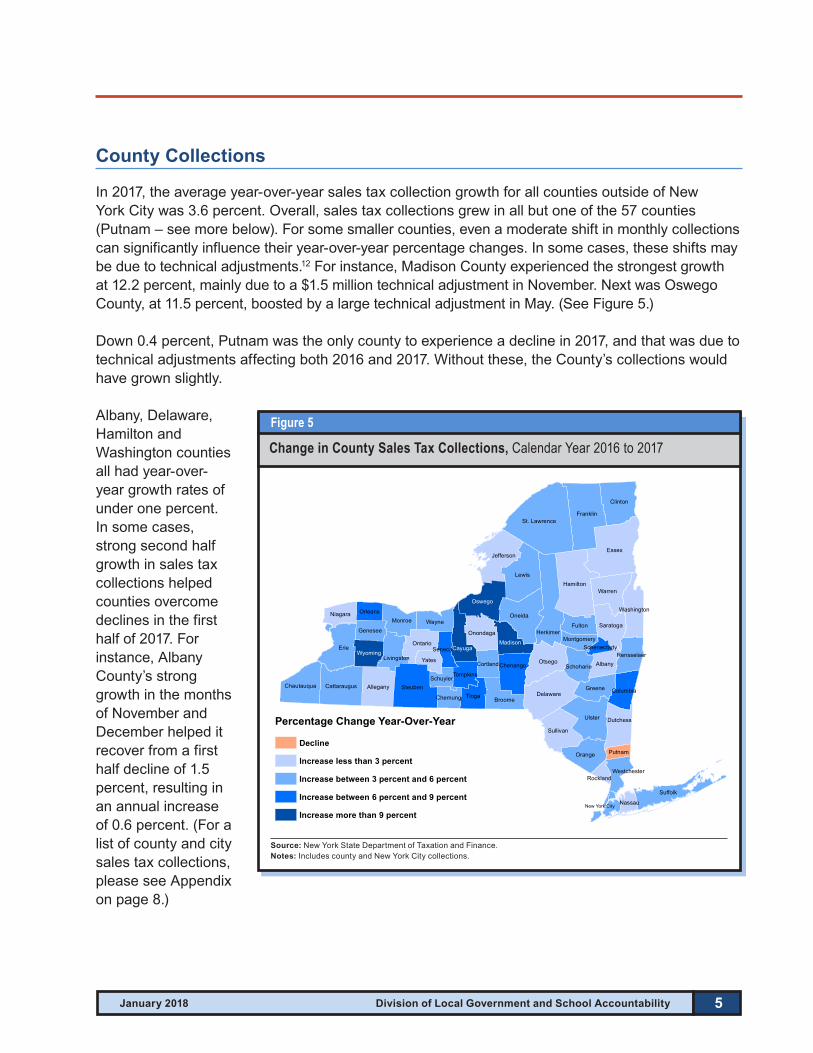
County Collections
In 2017, the average year-over-year sales tax collection growth for all counties outside of New York City was 3.6 percent. Overall, sales tax collections grew in all but one of the 57 counties (Putnam – see more below). For some smaller counties, even a moderate shift in monthly collections can significantly influence their year-over-year percentage changes. In some cases, these shifts may be due to technical adjustments.12 For instance, Madison County experienced the strongest growth at 12.2 percent, mainly due to a $1.5 million technical adjustment in November. Next was Oswego County, at 11.5 percent, boosted by a large technical adjustment in May. (See Figure 5.)
Down 0.4 percent, Putnam was the only county to experience a decline in 2017, and that was due to technical adjustments affecting both 2016 and 2017. Without these, the County’s collections would have grown slightly.
Albany, Delaware, Hamilton and Washington counties all had year-over-year growth rates of under one percent. In some cases, strong second half growth in sales tax collections helped counties overcome declines in the first half of 2017. For instance, Albany County’s strong growth in the months of November and December helped it recover from a first half decline of 1.5 percent, resulting in an annual increase of 0.6 percent. (For a list of county and city sales tax collections, please see Appendix on page 8.)
Essex
Erie
Lewis
St. LawrenceFranklin
Hamilton
Ulster
Oneida
Steuben
Herkimer
Clinton
Delaware
Otsego
Jefferson
Suffolk
Warren
Sullivan
Oswego
Allegany
Orange
Cattaraugus
Cayuga
Tioga
Saratoga
Broome
Ontario
Chautauqua
Dutchess
Wayne
Greene
Monroe
Chenango
Fulton
Madison
Albany
Onondaga
Yates
Niagara
Wyoming
Genesee
Orleans
Schuyler
Montgomery
Putnam
Washington
Columbia
LivingstonSchoharieCortland
Rensselaer
Tompkins
Seneca
Chemung
Westchester
Nassau
Rockland
Schenectady
New York City
Percentage Change Year-Over-Year
Decline
Increase less than 3 percent
Increase between 3 percent and 6 percent
Increase between 6 percent and 9 percent
Increase more than 9 percent
Change in County Sales Tax Collections, Calendar Year 2016 to 2017
Source: New York State Department of Taxation and Finance.Notes: Includes county and New York City collections.
Figure 5
6 Office of the New York State Comptroller January 2018
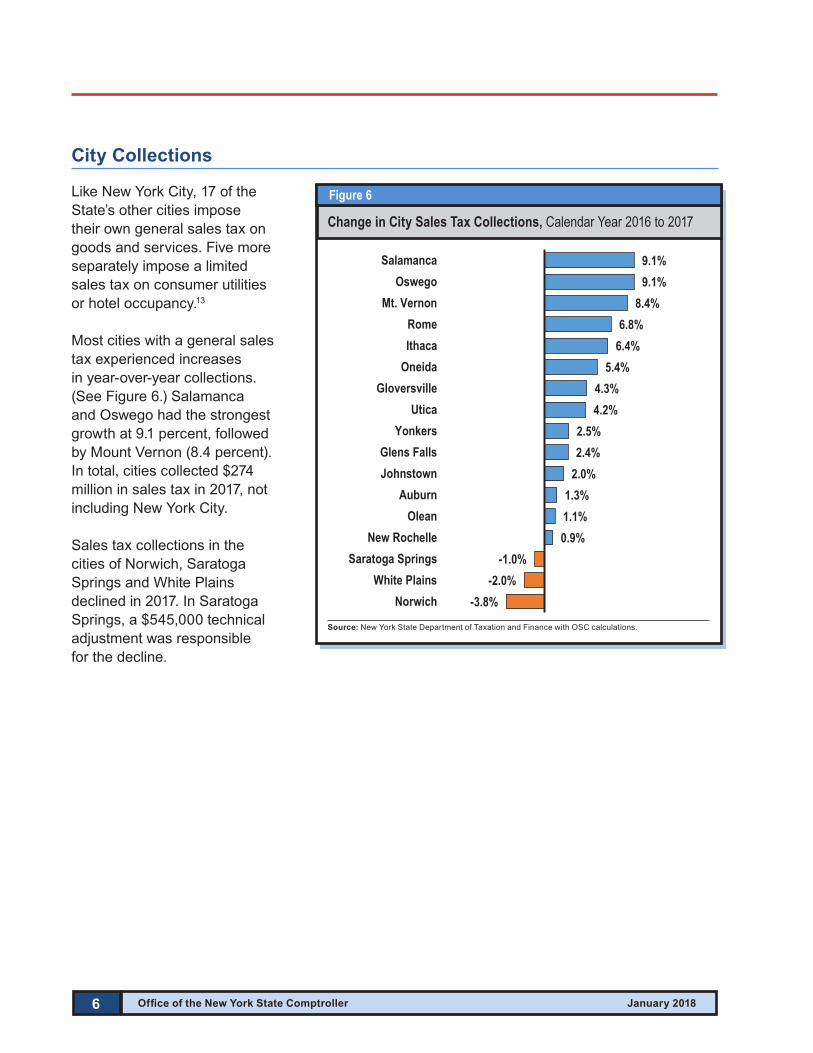
City Collections
Like New York City, 17 of the State’s other cities impose their own general sales tax on goods and services. Five more separately impose a limited sales tax on consumer utilities or hotel occupancy.13
Most cities with a general sales tax experienced increases in year-over-year collections. (See Figure 6.) Salamanca and Oswego had the strongest growth at 9.1 percent, followed by Mount Vernon (8.4 percent). In total, cities collected $274 million in sales tax in 2017, not including New York City.
Sales tax collections in the cities of Norwich, Saratoga Springs and White Plains declined in 2017. In Saratoga Springs, a $545,000 technical adjustment was responsible for the decline.
-3.8%-2.0%
-1.0%0.9%1.1%1.3%
2.0%2.4%2.5%
4.2%4.3%
5.4%6.4%6.8%
8.4%9.1%9.1%
NorwichWhite Plains
Saratoga SpringsNew Rochelle
OleanAuburn
JohnstownGlens Falls
YonkersUtica
GloversvilleOneidaIthacaRome
Mt. VernonOswego
Salamanca
Change in City Sales Tax Collections, Calendar Year 2016 to 2017
Source: New York State Department of Taxation and Finance with OSC calculations.
Figure 6
7 January 2018 Division of Local Government and School Accountability
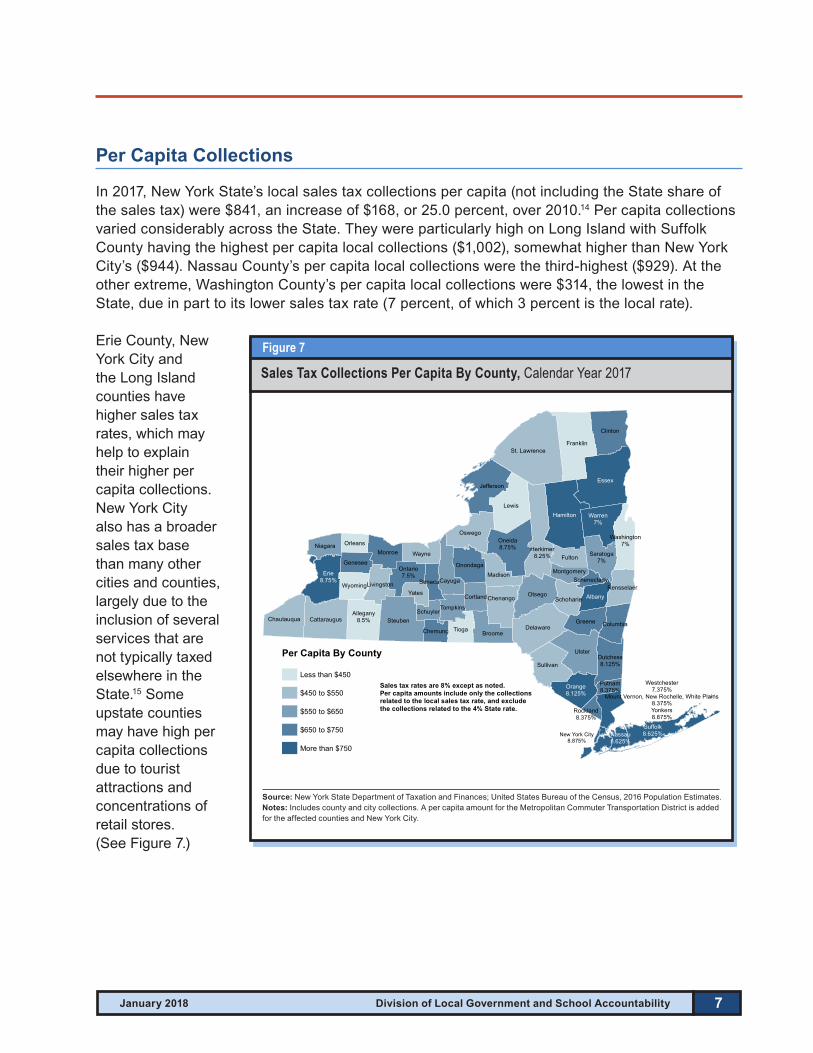
Per Capita Collections
In 2017, New York State’s local sales tax collections per capita (not including the State share of the sales tax) were $841, an increase of $168, or 25.0 percent, over 2010.14 Per capita collections varied considerably across the State. They were particularly high on Long Island with Suffolk County having the highest per capita local collections ($1,002), somewhat higher than New York City’s ($944). Nassau County’s per capita local collections were the third-highest ($929). At the other extreme, Washington County’s per capita local collections were $314, the lowest in the State, due in part to its lower sales tax rate (7 percent, of which 3 percent is the local rate).
Erie County, New York City and the Long Island counties have higher sales tax rates, which may help to explain their higher per capita collections. New York City also has a broader sales tax base than many other cities and counties, largely due to the inclusion of several services that are not typically taxed elsewhere in the State.15 Some upstate counties may have high per capita collections due to tourist attractions and concentrations of retail stores. (See Figure 7.)
New York City8.875%
Essex
Erie8.75%
Lewis
St. LawrenceFranklin
Hamilton
Ulster
Oneida8.75%
Steuben
Herkimer8.25%
Clinton
Delaware
Otsego
Jefferson
Suffolk8.625%
Warren7%
Sullivan
Oswego
Allegany8.5%
Orange8.125%
Cattaraugus
Cayuga
Tioga
Saratoga7%
Broome
Ontario7.5%
Chautauqua
Dutchess8.125%
Wayne
Greene
Monroe
Chenango
Fulton
Madison
Albany
Onondaga
Yates
Niagara
Wyoming
Genesee
Orleans
Schuyler
Montgomery
Putnam8.375%
Washington7%
Columbia
Livingston
SchoharieCortlandRensselaer
Tompkins
Seneca
Chemung
Westchester7.375%
Mount Vernon, New Rochelle, White Plains8.375%Yonkers8.875%
Nassau8.625%
Rockland8.375%
Schenectady
Per Capita By County
Less than $450
$450 to $550
$550 to $650
$650 to $750
More than $750
Sales tax rates are 8% except as noted.Per capita amounts include only the collectionsrelated to the local sales tax rate, and excludethe collections related to the 4% State rate.
Sales Tax Collections Per Capita By County, Calendar Year 2017
Source: New York State Department of Taxation and Finances; United States Bureau of the Census, 2016 Population Estimates. Notes: Includes county and city collections. A per capita amount for the Metropolitan Commuter Transportation District is added for the affected counties and New York City.
Figure 7
8 Office of the New York State Comptroller January 2018
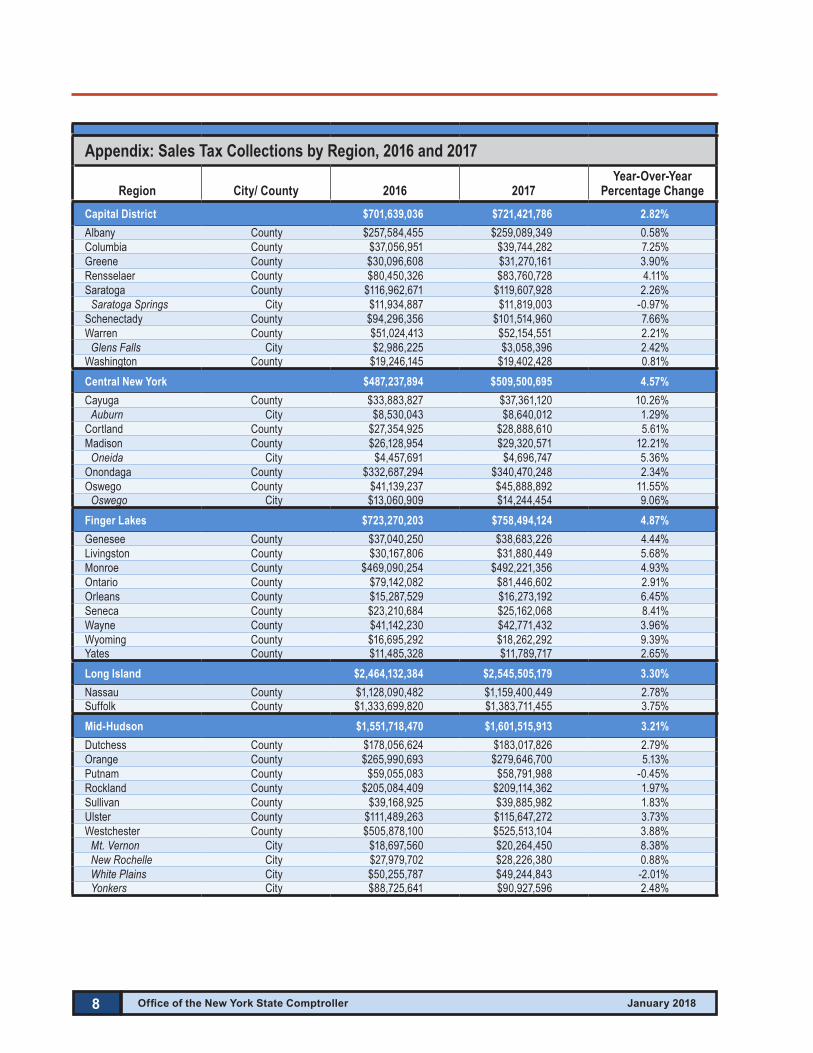
Appendix: Sales Tax Collections by Region, 2016 and 2017
Region City/ County 2016 2017Year-Over-Year
Percentage ChangeCapital District $701,639,036 $721,421,786 2.82%Albany County $257,584,455 $259,089,349 0.58%Columbia County $37,056,951 $39,744,282 7.25%Greene County $30,096,608 $31,270,161 3.90%Rensselaer County $80,450,326 $83,760,728 4.11%Saratoga County $116,962,671 $119,607,928 2.26%
Saratoga Springs City $11,934,887 $11,819,003 -0.97%Schenectady County $94,296,356 $101,514,960 7.66%Warren County $51,024,413 $52,154,551 2.21%
Glens Falls City $2,986,225 $3,058,396 2.42%Washington County $19,246,145 $19,402,428 0.81%Central New York $487,237,894 $509,500,695 4.57%Cayuga County $33,883,827 $37,361,120 10.26%
Auburn City $8,530,043 $8,640,012 1.29%Cortland County $27,354,925 $28,888,610 5.61%Madison County $26,128,954 $29,320,571 12.21%
Oneida City $4,457,691 $4,696,747 5.36%Onondaga County $332,687,294 $340,470,248 2.34%Oswego County $41,139,237 $45,888,892 11.55%
Oswego City $13,060,909 $14,244,454 9.06%Finger Lakes $723,270,203 $758,494,124 4.87%Genesee County $37,040,250 $38,683,226 4.44%Livingston County $30,167,806 $31,880,449 5.68%Monroe County $469,090,254 $492,221,356 4.93%Ontario County $79,142,082 $81,446,602 2.91%Orleans County $15,287,529 $16,273,192 6.45%Seneca County $23,210,684 $25,162,068 8.41%Wayne County $41,142,230 $42,771,432 3.96%Wyoming County $16,695,292 $18,262,292 9.39%Yates County $11,485,328 $11,789,717 2.65%Long Island $2,464,132,384 $2,545,505,179 3.30%Nassau County $1,128,090,482 $1,159,400,449 2.78%Suffolk County $1,333,699,820 $1,383,711,455 3.75%Mid-Hudson $1,551,718,470 $1,601,515,913 3.21%Dutchess County $178,056,624 $183,017,826 2.79%Orange County $265,990,693 $279,646,700 5.13%Putnam County $59,055,083 $58,791,988 -0.45%Rockland County $205,084,409 $209,114,362 1.97%Sullivan County $39,168,925 $39,885,982 1.83%Ulster County $111,489,263 $115,647,272 3.73%Westchester County $505,878,100 $525,513,104 3.88%
Mt. Vernon City $18,697,560 $20,264,450 8.38%New Rochelle City $27,979,702 $28,226,380 0.88%White Plains City $50,255,787 $49,244,843 -2.01%Yonkers City $88,725,641 $90,927,596 2.48%
9 January 2018 Division of Local Government and School Accountability
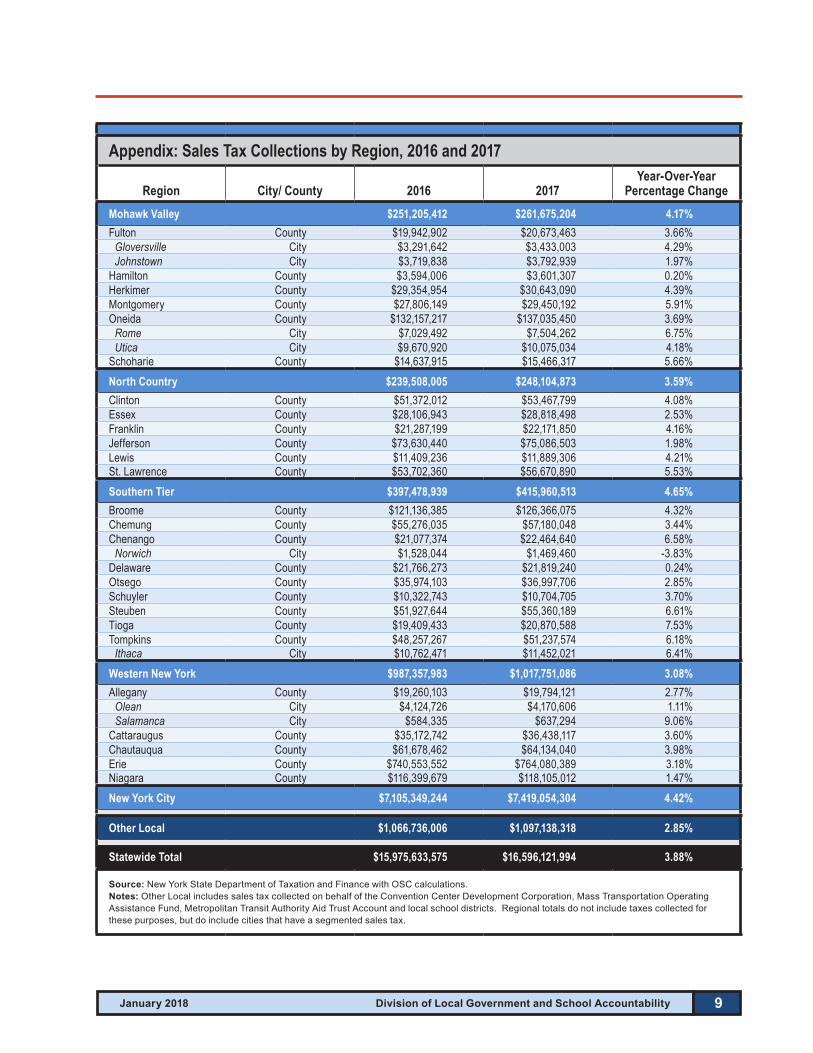
Appendix: Sales Tax Collections by Region, 2016 and 2017
Region City/ County 2016 2017Year-Over-Year
Percentage ChangeMohawk Valley $251,205,412 $261,675,204 4.17%Fulton County $19,942,902 $20,673,463 3.66%
Gloversville City $3,291,642 $3,433,003 4.29%Johnstown City $3,719,838 $3,792,939 1.97%
Hamilton County $3,594,006 $3,601,307 0.20%Herkimer County $29,354,954 $30,643,090 4.39%Montgomery County $27,806,149 $29,450,192 5.91%Oneida County $132,157,217 $137,035,450 3.69%
Rome City $7,029,492 $7,504,262 6.75%Utica City $9,670,920 $10,075,034 4.18%
Schoharie County $14,637,915 $15,466,317 5.66%North Country $239,508,005 $248,104,873 3.59%Clinton County $51,372,012 $53,467,799 4.08%Essex County $28,106,943 $28,818,498 2.53%Franklin County $21,287,199 $22,171,850 4.16%Jefferson County $73,630,440 $75,086,503 1.98%Lewis County $11,409,236 $11,889,306 4.21%St. Lawrence County $53,702,360 $56,670,890 5.53%Southern Tier $397,478,939 $415,960,513 4.65%Broome County $121,136,385 $126,366,075 4.32%Chemung County $55,276,035 $57,180,048 3.44%Chenango County $21,077,374 $22,464,640 6.58%
Norwich City $1,528,044 $1,469,460 -3.83%Delaware County $21,766,273 $21,819,240 0.24%Otsego County $35,974,103 $36,997,706 2.85%Schuyler County $10,322,743 $10,704,705 3.70%Steuben County $51,927,644 $55,360,189 6.61%Tioga County $19,409,433 $20,870,588 7.53%Tompkins County $48,257,267 $51,237,574 6.18%
Ithaca City $10,762,471 $11,452,021 6.41%Western New York $987,357,983 $1,017,751,086 3.08%Allegany County $19,260,103 $19,794,121 2.77%
Olean City $4,124,726 $4,170,606 1.11%Salamanca City $584,335 $637,294 9.06%
Cattaraugus County $35,172,742 $36,438,117 3.60%Chautauqua County $61,678,462 $64,134,040 3.98%Erie County $740,553,552 $764,080,389 3.18%Niagara County $116,399,679 $118,105,012 1.47%New York City $7,105,349,244 $7,419,054,304 4.42%
Other Local $1,066,736,006 $1,097,138,318 2.85%
Statewide Total $15,975,633,575 $16,596,121,994 3.88%
Source: New York State Department of Taxation and Finance with OSC calculations.Notes: Other Local includes sales tax collected on behalf of the Convention Center Development Corporation, Mass Transportation Operating Assistance Fund, Metropolitan Transit Authority Aid Trust Account and local school districts. Regional totals do not include taxes collected for these purposes, but do include cities that have a segmented sales tax.
10 Office of the New York State Comptroller January 2018
1 Unless otherwise noted, all sales tax collections data in this report are taken from the New York State Department of Taxation and Finance’s AS570 reports. The AS570 reports distributions, which are called collections in this report. The rates shown in Figures 1 and 2 have been adjusted for a major multiyear technical correction to New York City’s collections in 2015. For a more thorough discussion of this adjustment, see OSC, 2016 Local Sales Tax Collections, (January 31, 2017), www.osc.state.ny.us/reports/economic/2016-local-sales-tax-collections.pdf.
2 The fiscal year ending in 2010 represents the first full year after the last recession that ended in June 2009. Average annual growth rate is the compound annual growth rate.
3 U.S. Department of Labor, Bureau of Labor Statistics, Consumer Price Index, www.bls.gov/cpi/home.htm; New York State Department of Labor, Current Employment Statistics Survey: Hours and Earnings: New York State, www.labor.ny.gov/stats/ceshourearn2.asp; Siena College Research Institute, “Consumer Sentiment Remains Strong, Up this Quarter, Up from a Year Ago,” Siena College, January 4, 2018, www.siena.edu/news-events/article/consumer-sentiment-remains-strong-up-this-quarter-up-from-a-year-ago; New York State Department of Labor, Labor Area Unemployment Statistics Program: New York State, www.labor.ny.gov/stats/laus.asp.
4 For a more detailed discussion of the sales tax on motor fuels, see: Office of the New York State Comptroller, Local Sales Tax Collections Slow In First Half Of 2016: Decline in Motor Fuels Price a Continuing Drag on Sales Tax Growth, August 2016, pp. 3-4, www.osc.state.ny.us/localgov/pubs/research/localsalestaxcollections0816.pdf.
5 For the effect of gas prices and consumer sentiment, see: Siena College Research Institute, “Consumer Sentiment Remains Strong, Up this Quarter, Up from a Year Ago,” Siena College, January 4, 2018, www.siena.edu/news-events/article/consumer-sentiment-remains-strong-up-this-quarter-up-from-a-year-ago.
6 Board of Governors of the Federal Reserve System, The Beige Book: Summary of Commentary on Current Economic Conditions, September – November 2017, www.federalreserve.gov/monetarypolicy/beigebook2017.htm.
7 Ana Serafin Smith, “NRF Consumer Survey Points to Busy Holiday Season, Backs Up Economic Forecast and Import Numbers,” National Retail Federation, October 27, 2017, www.nrf.com/media/press-releases/nrf-consumer-survey-points-busy-holiday-season-backs-economic-forecast-and.
8 United States Government Accountability Office, Sales Tax: States Could Gain Revenue from Expanded Authority but Businesses Are Likely to Experience Compliance Costs, November 2017, www.gao.gov/products/GAO-18-114?utm_medium=email&utm_source=govdelivery.
9 The U.S. Supreme Court ruled in the case of Quill Corp. v. North Dakota, 504 U.S. 298 that a state can impose upon a seller the obligation to collect and remit the state’s use tax on sales to state customers only if the seller has a “substantial nexus” in the state, meaning, a physical presence as required by the Commerce Clause of the U.S. Constitution.
10 New York State Division of the Budget, FY 2019 New York State Executive Budget: Revenue Article VII Legislation, Part AA, www.budget.ny.gov/pubs/archive/fy19/exec/fy19artVIIs/REVENUEArticleVII.pdf.
11 Supreme Court of the United States, Granted & Noted List: Cases for Argument in October Term 2017, January 22, 2018, www.supremecourt.gov/orders/17grantednotedlist.pdf.
12 As used in this report, the term “technical adjustments” refers to any of a number of collection or distribution corrections made by the Department of Taxation and Finance that are not related to current economic activity, such as late filings or errors caught on later audit. See Department of Taxation and Finance, AS310 – Quarterly Cash and Collection Distributions with Variances for Assessments, Late-Filed Returns, Rate Adjustments and Prior Period Adjustments, www.tax.ny.gov/research/stats/statistics/sales_tax/government/as310.htm.
13 For a discussion of sales tax pre-emption by cities and segmented sales taxes, see: Office of the New York State Comptroller, Local Government Sales Taxes in New York State: 2015 Update, March 2015, p.6, www.osc.state.ny.us/localgov/pubs/research/salestax2015.pdf.
14 Population data taken from United States Bureau of the Census, 2016 Population Estimates. Sales tax collections include county and city collections. A per capita amount for the Metropolitan Commuter Transportation District was added to the per capita totals of New York City and of Dutchess, Nassau, Orange, Putman, Rockland, Suffolk and Westchester counties.
15 New York State Department of Taxation and Finance, Publication 750: A Guide to Sales Tax in New York State, p. 20, www.tax.ny.gov/pdf/publications/sales/pub750.pdf.
Notes

Like us on Facebook at facebook.com/nyscomptrollerFollow us on Twitter @nyscomptroller
ContactOffice of the New York State Comptroller Division of Local Government and School Accountability
110 State Street, 12th floor Albany, NY 12236 Tel: (518) 474-4037 Fax: (518) 486-6479 or email us: [email protected]
www.osc.state.ny.us/localgov/index.htm