Local Limits Development Guidance - Appendices · APPENDICES Appendix A - List of Supplemental...
128
Transcript of Local Limits Development Guidance - Appendices · APPENDICES Appendix A - List of Supplemental...


APPENDICES
Appendix A - List of Supplemental Documents . . . . . . . . . . . . . . . . . . . . . . . . . . . . . . . . . . . . . . . . . . . A-1
Appendix B - Industrial Categories with Pretreatment Standards . . . . . . . . . . . . . . . . . . . . . . . . . . . . . B-1
Appendix C - Pollutants Regulated by Categorical Pretreatment Standards . . . . . . . . . . . . . . . . . . . . . C-1
Appendix D - Clean Water Act Priority Pollutants and the Federal Water Quality Criteria . . . . . . . . . D-1
Appendix E - Federal Sewage Sludge Standards . . . . . . . . . . . . . . . . . . . . . . . . . . . . . . . . . . . . . . . . . . E-1
Appendix F - Toxicity Characteristic Leachate Procedure Limitations . . . . . . . . . . . . . . . . . . . . . . . . . F-1
Appendix G - Literature Inhibition Values . . . . . . . . . . . . . . . . . . . . . . . . . . . . . . . . . . . . . . . . . . . . . . . G-1
Appendix H - Closed-cup Flashpoints for Select Organic Compounds . . . . . . . . . . . . . . . . . . . . . . . . . H-1
Appendix I - Discharge Screening Levels and Henry’s Law Constants for Organic Compounds . . . . . I-1
Appendix J - OSHA, ACGIH and NIOSH Exposure Levels . . . . . . . . . . . . . . . . . . . . . . . . . . . . . . . . . J-1
Appendix K - Landfill Leachate Loadings . . . . . . . . . . . . . . . . . . . . . . . . . . . . . . . . . . . . . . . . . . . . . . . K-1
Appendix L - Hauled Waste Loadings . . . . . . . . . . . . . . . . . . . . . . . . . . . . . . . . . . . . . . . . . . . . . . . . . . L-1
Appendix M - Hazardous Waste Constituents - RCRA Appendix VIII . . . . . . . . . . . . . . . . . . . . . . . . M-1
Appendix N - Statistical Approach to Determining Sampling Frequency . . . . . . . . . . . . . . . . . . . . . . . N-1
Appendix O - Minimizing Contamination in Samples . . . . . . . . . . . . . . . . . . . . . . . . . . . . . . . . . . . . . . O-1
Appendix P - Methods for Calculating Removal Efficiency . . . . . . . . . . . . . . . . . . . . . . . . . . . . . . . . . P-1
Appendix Q - Methods for Handling Data Below Detection Level . . . . . . . . . . . . . . . . . . . . . . . . . . . . Q-1
Appendix R - Priority Pollutant Removal Efficiencies . . . . . . . . . . . . . . . . . . . . . . . . . . . . . . . . . . . . . . R-1
Appendix S - Specific Gravity of Sludge . . . . . . . . . . . . . . . . . . . . . . . . . . . . . . . . . . . . . . . . . . . . . . . . S-1
Appendix T - Sludge AHL Equations Using Flow (in metric units) . . . . . . . . . . . . . . . . . . . . . . . . . . . T-1
Appendix U - POTW Configurations . . . . . . . . . . . . . . . . . . . . . . . . . . . . . . . . . . . . . . . . . . . . . . . . . . . U-1
Appendix V - Domestic Pollutant Loadings . . . . . . . . . . . . . . . . . . . . . . . . . . . . . . . . . . . . . . . . . . . . . . V-1
Appendix W - Best Management Practices Mini-Case Studies . . . . . . . . . . . . . . . . . . . . . . . . . . . . . . W-1
Appendix X - Region 1, Reassessment of Technically Based Industrial Discharge Limits Checklist . . X-1
i

This page intentionally left blank.
ii

-- -- --
-- --
-- --
--
--
-- --
-- --
-- --
--
-- --
-- --
APPENDIX A -LIST OF SUPPLEMENTAL DOCUMENTS
GENERAL GUIDANCE ON PRETREATMENT
TITLE DATE EPA Number NTIS Number ERIC Number
CERCLA Site Discharges to POTWs Guidance Manual
August 1990 540-G-90-005 PB90-274531 W150
Control Authority Pretreatment Audit Checklist and Instructions
May 1992
Control of Slug Loadings To POTWs: Guidance Manual
February 1991 21W-4001
Environmental Regulations and Technology: The National Pretreatment Program
July 1986 625-10-86-005 PB90-246521 W350
Guidance for Conducting a Pretreatment Compliance Inspection
September 1991
300-R-92-009 PB94-120631 W273
Guidance For Developing Control Authority Enforcement Response Plans
September 1989
PB90-185083/AS
Guidance for Reporting and Evaluating POTW Noncompliance with Pretreatment Implementation Requirements
September 1987
PB95-157764 W304
Guidance Manual for POTW Pretreatment Program Development
Guidance Manual for POTWs to Calculate the Economic Benefit of Noncompliance
Guidance Manual for Preparation and Review of Removal Credit Applications
Guidance Manual for Preventing Interference at POTWs
Guidance Manual for the Control of Wastes Hauled to Publicly Owned Treatment Works
Guidance Manual for the Identification of Hazardous Wastes Delivered to Publicly Owned Treatment Works by Truck, Rail, or Dedicated Pipe
Guidance Manual for the Use of Production-Based Pretreatment Standards and the Combined Wastestream Formula
Guidance Manual on the Development and Implementation of Local Discharge Limitations Under the Pretreatment Program
Guidance on Evaluation, Resolution, and Documentation of Analytical Problems Associated with Compliance Monitoring
Guidance on the Privatization of Federally Funded Wastewater Treatment Works
Guidance to Protect POTW Workers From Toxic And Reactive Gases And Vapors
October 1983 PB93-186112 W639
September 1990
833-B-93-007
July 1985 833-B-85-200
September 1987
833-B-87-201 PB92-117969 W106
September 1999
833-B-98-003
June 1987 PB92-149251 W202
September 1985
833-B-85-201 PB92-232024 U095
December 1987
833-B-87-202 PB92-129188 W107
June 1993 821-B-93-001
August 2000 832-B-00-002
June 1992 812-B-92-001 PB92-173236 W115
A-1

-- --
-- --
-- --
-- --
-- --
-- -- --
-- --
-- -- --
-- --
GENERAL GUIDANCE ON PRETREATMENT
TITLE DATE EPA Number NTIS Number ERIC Number
Guides to Pollution Prevention: Municipal Pretreatment Programs
Industrial User Inspection and Sampling Manual For POTWs
Industrial User Permitting Guidance Manual
Metals Translator: Guidance for Calculating a Total Recoverable Permit Limit from a Dissolved Criterion
Model Pretreatment Ordinance
Multijurisdictional Pretreatment Programs: Guidance Manual
National Pretreatment Program: Report to Congress
NPDES Compliance Inspection Manual
Pollution Prevention (P2) Guidance Manual for the Pesticide Formulating, Packaging, and Repackaging Industry: Implementing the P2 Alternative
POTW Sludge Sampling and Analysis Guidance Document
Prelim User’s Guide, Documentation for the EPA Computer Program/Model for Developing Local Limits for Industrial Pretreatment Programs at Publicly Owned Treatment Works, Version 5.0
Pretreatment Compliance Inspection and Audit Manual For Approval Authorities
Pretreatment Compliance Monitoring and Enforcement Guidance and Software (Version 3.0)
Procedures Manual for Reviewing a POTW Pretreatment Program Submission
Procuring Analytical Services: Guidance for Industrial Pretreatment Programs
Region III Guidance for Setting Local Limits for a Pollutant Where the Domestic Loading Exceeds the Maximum Allowable Headworks Loading
Protecting the Nation's Waters Through Effective NPDES Permits: A Strategic Plan FY 2001 and Beyond
RCRA Information on Hazardous Wastes for Publicly Owned Treatment Works
Report to Congress on the Discharge of Hazardous Wastes to Publicly Owned Treatment Works
October 1993 625-R-93-006
April 1994 831-B-94-001 PB94-170271 W305
September 1989
833-B-89-001 PB92-123017 W109
June 1996 823-B-96-007
June 1992 833-B-92-003 PB93-122414 W108
June 1994 833-B-94-005 PB94-203544 W607
July 1991 21-W-4004 PB91-228726 W694
September 1994
300-B-94-014
June 1998 821-B-98-017
August 1989 833-B-89-100
January 1997
July 1986 833-B-86-100 PB90-183625 W277
(Manual) September 1986 (Software) September 1992
(Software) 831-F-92-001
(Software) PB94-118577
(Software) W269
October 1983 833-B-83-200 PB93-209880 W137
October 1998 833-B-98-004
June 1994
June 2001 833-R-01-001
September 1985
833-B-85-202 PB92-114396 W351
February 1986 530-SW-86-004 PB86-184017 & PB95-157228
W922 & W692
A-2
--
--
-- --
-- --
GENERAL GUIDANCE ON PRETREATMENT
TITLE DATE EPA Number NTIS Number ERIC Number
Supplemental Manual On the Development And Implementation of Local Discharge Limitations Under The Pretreatment Program
May 1991 21W-4002 PB93-209872 W113
Source: Updated, originally part of U.S. EPA’s Introduction to the National Pretreatment Program, EPA-833-B-98-002,February 1999, pp. 51-52
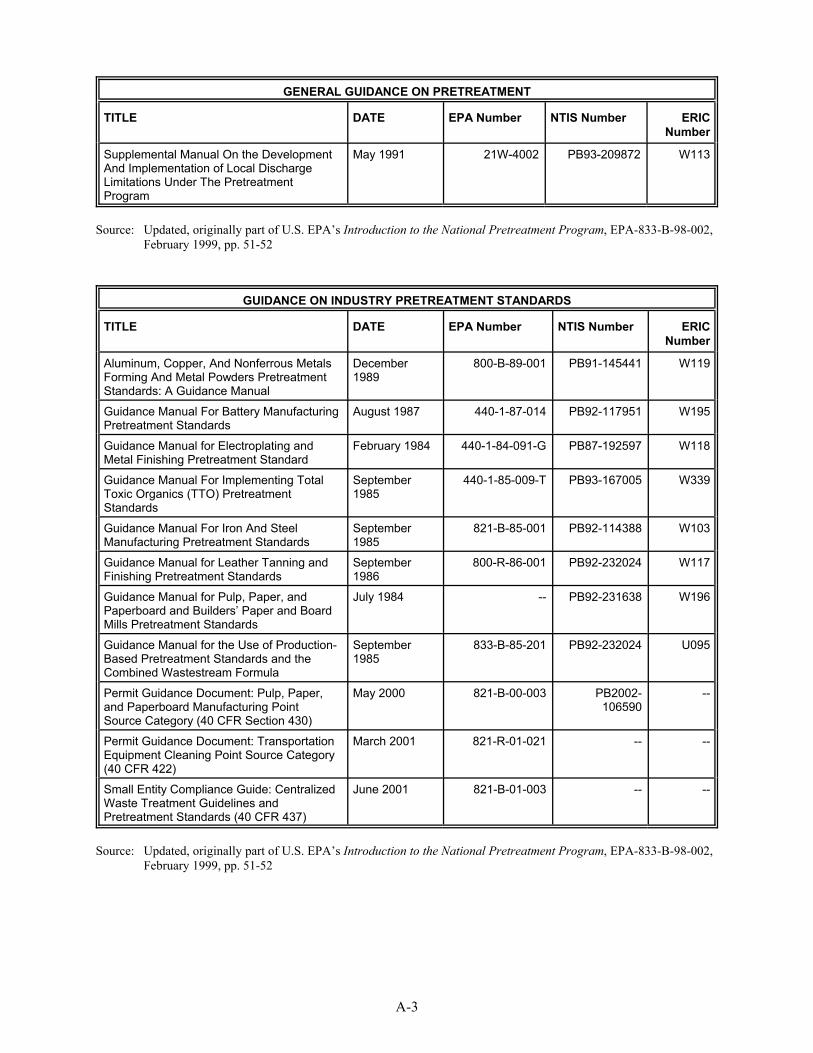
GUIDANCE ON INDUSTRY PRETREATMENT STANDARDS
TITLE DATE EPA Number NTIS Number ERIC Number
Aluminum, Copper, And Nonferrous Metals Forming And Metal Powders Pretreatment Standards: A Guidance Manual
December 1989
800-B-89-001 PB91-145441 W119
Guidance Manual For Battery Manufacturing Pretreatment Standards
August 1987 440-1-87-014 PB92-117951 W195
Guidance Manual for Electroplating and Metal Finishing Pretreatment Standard
February 1984 440-1-84-091-G PB87-192597 W118
Guidance Manual For Implementing Total Toxic Organics (TTO) Pretreatment Standards
September 1985
440-1-85-009-T PB93-167005 W339
Guidance Manual For Iron And Steel Manufacturing Pretreatment Standards
September 1985
821-B-85-001 PB92-114388 W103
Guidance Manual for Leather Tanning and Finishing Pretreatment Standards
September 1986
800-R-86-001 PB92-232024 W117
Guidance Manual for Pulp, Paper, and Paperboard and Builders’ Paper and Board Mills Pretreatment Standards
July 1984 PB92-231638 W196
Guidance Manual for the Use of Production-Based Pretreatment Standards and the Combined Wastestream Formula
September 1985
833-B-85-201 PB92-232024 U095
Permit Guidance Document: Pulp, Paper, and Paperboard Manufacturing Point Source Category (40 CFR Section 430)
May 2000 821-B-00-003 PB2002-106590
Permit Guidance Document: Transportation Equipment Cleaning Point Source Category (40 CFR 422)
March 2001 821-R-01-021
Small Entity Compliance Guide: Centralized Waste Treatment Guidelines and Pretreatment Standards (40 CFR 437)
June 2001 821-B-01-003
Source: Updated, originally part of U.S. EPA’s Introduction to the National Pretreatment Program, EPA-833-B-98-002,February 1999, pp. 51-52
A-3

This page intentionally left blank.
A-4

APPENDIX B -INDUSTRIAL CATEGORIES WITH PRETREATMENT STANDARDS
Source: U.S. EPA’s Introduction to the National Pretreatment Program, EPA-833-B-98-002, February 1999, Figure 13, p. 14. (Updated)
Category (SIC Codes)*
[NAICS Codes]**
40 CFR Part (Sub-
parts)
Type ofStandard*** Overview of Pretreatment Standards
Aluminum Forming (3353, 3354, 3355, 3357, 3363) [331315, 331316, 331319, 331521]
467(A-F) PSES PSNS
Limits are production-based, daily maximums and monthly averages. from certain operations.
Battery Manufacturing (3691, 3692) [335911, 335912]
461(A-G) PSES PSNS
Limits are production-based, daily maximums and monthly averages. ed from any process not specifically identified in the regulations.
Carbon Black Manufacturing (2895) [325182]
458 (A-D) PSNS Limits are for Oil & Grease only (no limit duration specified).
Centralized Waste Treatment (4953) [562211, 562219 ]
437 (A-D) PSES PSNS
Limits are concentration-based, daily maximums and monthly averages.
Coil Coating (3411, 3479, 3492) [332431, 332812]
465 (A-D) PSES PSNS
Limits are production-based, daily maximums and monthly averages.
Commercial Hazardous Waste Combustors (4953, 2819, 2869, 3241, 1422, 1429, 1459) [562213, 212312, 325188, 325199, 327310]
444 (A) PSES PSNS
Limits are concentration-based daily maximums or maximum monthly averages.
Concentrated Animal Feeding Operations (0211, 0213, 0214, 0241, 0251, 0252, 0253, 0254, 0259, 0272) [112112, 11221, 11241, 11242, 112111, 11212, 11232, 11231, 11233, 11234, 11239, 11292]
412 (B) PSNS Discharge of process wastewater is prohibited, except when there is an overflow resulting from a chronic or catastrophic rainfall event.
Copper Forming (3351, 3357, 3463) [331421, 331422, 332112]
468 (A) PSES PSNS
Limits are production-based, daily maximums and monthly averages.
Electrical and Electronic Components (3671, 3674, 3679) [334411, 334413, 334419]
469 (A-D) PSES PSNS
Limits are concentration-based, daily maximums and 30-day averages or monthly averages (varies per subpart and pollutant parameter). allowed in lieu of monitoring for certain pollutants when a management plan is approved and implemented.
Subpart C prohibits discharges
No discharge is allow
Certification is
B-1

Category (SIC Codes)*
[NAICS Codes]**
40 CFR Part (Sub-
parts)
Type of Standard*** Overview of Pretreatment Standards
Electroplating (3471, 3672) [332813, 334412]
413 (A-B, D-H)
PSES Limits are concentration-based (or alternative mass-based equivalents), daily maximums and four consecutive monitoring days averages. wo sets of limits exist, depending on if facility discharges more or less than 10,000 gallons per day of process wastewater. on is allowed in lieu of monitoring for certain pollutants when a management plan is approved and implemented.
Fertilizer Manufacturing (2873, 2874, 2875) [325311, 325312, 325314]
418 (A-G) PSNS Limits may specify zero discharge of wastewater pollutants (Subpart A), production-based daily maximums and 30-day averages (Subparts B-E) or concentration-based (Subparts F-G) with no limit duration specified.
Glass Manufacturing (3211, 3221, 3296) [327211, 327212, 327993]
426 (H, K-M)
PSNS Limits are either concentration- or production-based, daily maximums and monthly averages.
Grain Mills (2041, 2043, 2044, 2045, 2046, 2047) [311111, 311211, 311212, 311213, 311221, 311230]
406 (A) PSNS Discharge of process wastewater is prohibited at a flow rate or mass loading rate which is excessive over any time period during the peak load at a POTW.
Ink Formulating (2893) [325910]
447 (A) PSNS Regulations specify no discharge of process wastewater pollutants to the POTW.
Inorganic Chemicals Manufacturing (2812, 2813, 2816, 2819) [325120, 325131, 325181, 325188]
415 (A-BO) PSES PSNS
Limits vary for each subpart with a majority of the limits concentration-based, daily maximums and 30-day averages, or may specify no discharge of wastewater pollutants. Numerous subparts have no pretreatment standards.
Iron and Steel Manufacturing (3312, 3315, 3316, 3317, 3479) [331111, 331210, 331221, 331222, 332812]
420 (A-F, H-J, L, M)
PSES PSNS
Limits are production-based, daily maximums and 30 day averages, or may specify no discharge of wastewater pollutants.
Leather Tanning and Finishing (3111) [316110]
425 (A-I) PSES PSNS
Limits are concentration-based, daily maximums and monthly averages. volume dictates applicable pretreatment standards.
Metal Finishing (Industry groups: 34, 35, 36, 37, 38) [Industry Subsectors: 332, 333, 334, 336]
433 (A) PSES PSNS
Limits are concentration-based, daily maximums and monthly averages. ion is allowed for certain pollutants where a management plan is approved and implemented.
Metal Molding and Casting (3321, 3322, 3324, 3325, 3365, 3366, 3369) [331511, 331512, 331513, 331524, 331525, 331528]
464 (A-D) PSES PSNS
Limits are primarily production-based, daily maximums and monthly averages. certain processes are prohibited (Subparts A-C).
Nonferrous Metals Forming and Metal Powders (3356, 3357, 3363, 3497, 3499) [331491, 331422, 331521, 332117, 332999]
471 (A-J) PSES PSNS
Limits are production-based, daily maximums and monthly averages. regulations prohibit the discharge of wastewater pollutants.
T
Certificati
In certain instances, production
Certificat
Discharges from
In some instances, the
B-2

Category (SIC Codes)*
[NAICS Codes]**
40 CFR Part (Sub-
parts)
Type of Standard*** Overview of Pretreatment Standards
Nonferrous Metals Manufacturing (2819, 3331, 3334, 3339, 3341) [331311, 331312, 331314, 331411, 331419, 331423, 331492]
421 (B-AE) PSES PSNS
Limits are production-based, daily maximums and monthly averages. he majority of the Subparts have both existing and new source limits, with others having solely new source requirements. instances, the regulations prohibit the discharge of wastewater pollutants.
Oil and Gas Extraction (1311) [211111]
435 (D) PSES PSNS
Regulations specify no discharge of process wastewater (drilling fluieds, deck drainage, etc.) pollutants to the POTW.
Organic Chemicals, Plastics, and Synthetic Fibers (2821, 2823, 2824, 2865, 2869) [325211, 325221, 325222, 32511, 325132, 325192, 325188]]
414 (B-H, K) PSES PSNS
Limits are mass-based (concentration-based standards multiplied by process flow), daily maximums and monthly averages. metals and cyanide apply only to metal- or cyanide-bearing wastestreams.
Paint Formulating (2851) [325510]
446 (A) PSNS Regulations specify no discharge of process wastewater pollutants to the POTW.
Paving and Roofing Materials (Tars and Asphalt) (2951, 2952, 3996) [324121, 324122, 326192]
443 (A-D) PSNS Limits are for Oil & Grease only (no limit duration specified).
Pesticide Chemicals (2879) [325320]
455 (A, C, E)
PSES PSNS
Limits are mass-based (concentration-based standards multiplied by process flow), daily maximums and monthly averages. specifies no discharge of process wastewater pollutants but provides for pollution prevention alternatives. process wastewater pollutants.
Petroleum Refining (2911) [324110]
419 (A-E) PSES PSNS
Limits are concentration-based (or mass-based equivalent), daily maximums.
Pharmaceutical Manufacturing (2833, 2834) [325411, 325412]
439 (A-D) PSES PSNS
Limits are concentration-based, daily maximums and monthly averages. certify they do not use or generate cyanide in lieu of performing monitoring to demonstrate compliance.
Porcelain Enameling (3431, 3469, 3479, 3631, 3632, 3633, 3639) [332116, 332812, 332998, 335221, 335222, 335224, 335228]
466 (A-D) PSES PSNS
Limits are concentration-based (or alternative production-based), daily maximums and monthly averages. operations.
T
In some
Standards for
Subpart C
Subpart E specifies no discharge of
Subpart A and C facilities may
Subpart B prohibits discharges certain
Pulp, Paper, and Paperboard (2611, 2621, 2631) [322110, 322121, 322122, 322130]
430 (A-G, I-L)
PSES PSNS
Limits are production-based or concentration-based (or alternative production-based) daily maximums and monthly averages. hese facilities may certify they do not use certain compounds in lieu of performing monitoring to demonstrate compliance. Facilities subject to Subparts B and E must also implement Best Management Practices as identified.
Rubber Manufacturing (2822) [325212]
428 (E-K) PSNS Limits are concentration- or production-based, daily maximums and monthly averages.
T
B-3

Category (SIC Codes)*
[NAICS Codes]**
40 CFR Part (Sub-
parts)
Type of Standard*** Overview of Pretreatment Standards
Soap and Detergent Manufacturing (2841) [325611]
417 (O-R) PSNS Regulations specify no discharge of process wastewater pollutants to the POTW.
Steam Electric Power Generating (4911) [221112]
423 PSES PSNS
Limits are either concentration-based, daily maximums, or “maximums for any time,” or compliance can be demonstrated through engineering calculations. regulations prohibit the discharge of wastewater pollutants.
Timber Products Processing (2421, 2435, 2436, 2491, 2493, 2499) [321114, 321219, 321211, 321212]
429 (F-H) PSES PSNS
All PSNS (and PSES for Subpart F) prohibit the discharge of wastewater pollutants. Subparts G and H are concentration-based, daily maximums (with production-based alternatives).
Transportation Equipment Cleaning (4491, 4499, 4741, 7699) [484230, 488320, 488390, 488210]
442 (A-C) PSES PSNS
Limits are concentration-based daily maximums. Subpart A and B allow for a pollutant as an alternative to achieving PSES or PSNS.
In some instances, the
PSES for
* SIC = Standard Industrial Classification, 1987 SIC Manual ** NAICS = North American Industry Classification System, 1997 NAICS Manual. *** PSNS = Pretreatment Standard New Source; PSES = Pretreatment Standard Existing Source
B-4

C-1
APPENDIX C - POLLUTANTS REGULATED BY CATEGORICAL PRETREATMENTSTANDARDS
Alu
min
um F
orm
ing
Bat
tery
Man
ufac
turin
gC
arbo
n B
lack
Man
ufac
turin
gC
entra
lized
Was
te T
reat
men
tC
oil C
oatin
gC
oppe
r For
min
gE
lect
rical
and
Ele
ctro
nic
Com
pone
nts
Ele
ctro
plat
ing
Feed
lots
Ferti
lizer
Man
ufac
turin
gG
lass
Man
ufac
turin
gG
rain
Mill
sIn
k Fo
rmul
atin
gIn
orga
nic
Che
mic
als
Man
ufac
turin
gIro
n an
d S
teel
Man
ufac
turin
gLe
athe
r Tan
ning
and
Fin
ishi
ngM
etal
Fin
ishi
ngM
etal
Mol
ding
and
Cas
ting
Non
ferr
ous
Met
als
Form
./Met
al P
owde
rsN
onfe
rrou
s M
etal
s M
anuf
actu
ring
Oil
and
Gas
Org
anic
Che
ms.
, Pla
stic
s, a
nd S
yn.
Pai
nt F
orm
ulat
ing
Pav
ing
and
Roo
fing
Mat
eria
lsP
estic
ide
Che
mic
als
Pet
role
um R
efin
ing
Pha
rmac
eutic
al M
anuf
actu
ring
Por
cela
in E
nam
elin
gP
ulp,
Pap
er, a
nd P
aper
boar
dR
ubbe
r Man
ufac
turin
gS
oap
and
Det
erge
nt M
anuf
actu
ring
Ste
am E
lect
ric P
ower
Gen
erat
ing
Tim
ber P
rodu
cts
Pro
cess
ing
Tran
spor
tatio
n E
quip
. Cle
anin
g
Was
te C
ombu
stor
s
Flow RestrictionsOnly X X X X
Ammonia (as N) X X X X X X
BOD X
COD X X
Fluoride X X X X X X
Nitrate (as N) X
Oil and Grease X X X X X X X X X
Oil (mineral) X
Organic Nitrogen(as N) X
pH X X X
Phenols X X X
Phosphorus X X
Sulfide X
TSS X X
1,1-Dichloroethane X X X X
1,1-Dichloroethylene X X X X X X
1,1,1-Trichloroethane X X X X X X X X X
1,1,2-Trichloroethane X X X X X
1,1,2,2-Tetra-chloroethane X X X
1,2-Dichlorobenzene X X X X X X X
1,2-Dichloroethane X X X X X X X
1,2-Dichloropropane X X X X
1,2-Diphenyl-hydrazine X X X X
1,2-trans-Dichloroethylene X X X X
Fibe
rs
X
X
X
X
X
X
X

Alu
min
um F
orm
ing
Bat
tery
Man
ufac
turin
gC
arbo
n B
lack
Man
ufac
turin
gC
entra
lized
Was
te T
reat
men
tC
oil C
oatin
gC
oppe
r For
min
gE
lect
rical
and
Ele
ctro
nic
Com
pone
nts
Ele
ctro
plat
ing
Feed
lots
Ferti
lizer
Man
ufac
turin
gG
lass
Man
ufac
turin
gG
rain
Mill
sIn
k Fo
rmul
atin
gIn
orga
nic
Che
mic
als
Man
ufac
turin
gIro
n an
d S
teel
Man
ufac
turin
gLe
athe
r Tan
ning
and
Fin
ishi
ngM
etal
Fin
ishi
ngM
etal
Mol
ding
and
Cas
ting
Non
ferr
ous
Met
als
Form
./Met
al P
owde
rsN
onfe
rrou
s M
etal
s M
anuf
actu
ring
Oil
and
Gas
Org
anic
Che
ms.
, Pla
stic
s, a
nd S
yn.
Pai
nt F
orm
ulat
ing
Pav
ing
and
Roo
fing
Mat
eria
lsP
estic
ide
Che
mic
als
Pet
role
um R
efin
ing
Pha
rmac
eutic
al M
anuf
actu
ring
Por
cela
in E
nam
elin
gP
ulp,
Pap
er, a
nd P
aper
boar
dR
ubbe
r Man
ufac
turin
gS
oap
and
Det
erge
nt M
anuf
actu
ring
Ste
am E
lect
ric P
ower
Gen
erat
ing
Tim
ber P
rodu
cts
Pro
cess
ing
Tran
spor
tatio
n E
quip
. Cle
anin
g
Was
te C
ombu
stor
s
C-2
1,2,4-Trichloro-benzene X X X X X
1,3-Dichloro-benzene X X X X X
1,3-Dichloro-propene X X X X
1,4-Dichloro-benzene X X X X X X
2-Chloroethylvinyl ether(mixed)
X X
2-Chloro-naphthalene X X
2-Chlorophenol X X X X X
2-Nitrophenol X X X X
2,3-Dichloro-aniline X
2,3,4,6-Tetra-chlorophenol X
2,4-Dichlorophenol X X X X X
2,4-Dimethyl-phenol X X X
2,4-Dinitrophenol X X
2,4-Dinitro-toluene X X X
2,4,5-Trichloro-phenol X
2,4,6-Trichloro-phenol X X X X X X
2,6-Dinitro-toluene X X X
3,3-Dichloro-benzidine X X
3,4,5-Trichloro-catechol X
3,4,5-Trichloro-guaiacol X
3,4,6-Trichloro-catechol X
3,4,6-Trichloro-guaiacol X
4-Bromophenylphenyl ether X X
Fibe
rs
X
X
X
X
X
X
X
X
X
X
X
X

Alu
min
um F
orm
ing
Bat
tery
Man
ufac
turin
gC
arbo
n B
lack
Man
ufac
turin
gC
entra
lized
Was
te T
reat
men
tC
oil C
oatin
gC
oppe
r For
min
gE
lect
rical
and
Ele
ctro
nic
Com
pone
nts
Ele
ctro
plat
ing
Feed
lots
Ferti
lizer
Man
ufac
turin
gG
lass
Man
ufac
turin
gG
rain
Mill
sIn
k Fo
rmul
atin
gIn
orga
nic
Che
mic
als
Man
ufac
turin
gIro
n an
d S
teel
Man
ufac
turin
gLe
athe
r Tan
ning
and
Fin
ishi
ngM
etal
Fin
ishi
ngM
etal
Mol
ding
and
Cas
ting
Non
ferr
ous
Met
als
Form
./Met
al P
owde
rsN
onfe
rrou
s M
etal
s M
anuf
actu
ring
Oil
and
Gas
Org
anic
Che
ms.
, Pla
stic
s, a
nd S
yn.
Pai
nt F
orm
ulat
ing
Pav
ing
and
Roo
fing
Mat
eria
lsP
estic
ide
Che
mic
als
Pet
role
um R
efin
ing
Pha
rmac
eutic
al M
anuf
actu
ring
Por
cela
in E
nam
elin
gP
ulp,
Pap
er, a
nd P
aper
boar
dR
ubbe
r Man
ufac
turin
gS
oap
and
Det
erge
nt M
anuf
actu
ring
Ste
am E
lect
ric P
ower
Gen
erat
ing
Tim
ber P
rodu
cts
Pro
cess
ing
Tran
spor
tatio
n E
quip
. Cle
anin
g
Was
te C
ombu
stor
s
C-3
4-Chlorophenylphenyl ether X X
4-Nitrophenol X X X X X
4,4-DDD X X X
4,4-DDE X X X
4,4-DDT X X
4,5,6-Trichloro-quaiacol X
4,6-Dinitro-o-cresol X X X
Acenaphthene X X X X X
Acenaphthylene X X X X
Acetone X
Acrolein X X
Acrylonitrile X X
Aldrin X X
Alpha-BHC X X
Alpha-endosulfan X X
Anthracene X X X X X X X
Benzene X X X X X X X
Benzidine X X X
Benzo (b)fluoranthene X X X X
Benzo (a)anthracene X X X
Benzo (ghi)perylene X X X
Benzo (a) pyrene X X X X X X
Benzo (k)fluoranthene X X X
Beta-BHC X X X
Beta-endosulfan X X
Bis (2-chloro-ethoxy) methane X X
Bis (2-chloro-isopropyl) ether X X
Bis (2-chloro-ethyl) ether X X X
Bis (2-ethyl-hexyl) phthalate X X X X X X X X
Bromoform X X X X
Fibe
rs
X
X
X
X
X
X
X
X
X
X
X
X
X
X
X
X
X
X
X
X
X
X

Alu
min
um F
orm
ing
Bat
tery
Man
ufac
turin
gC
arbo
n B
lack
Man
ufac
turin
gC
entra
lized
Was
te T
reat
men
tC
oil C
oatin
gC
oppe
r For
min
gE
lect
rical
and
Ele
ctro
nic
Com
pone
nts
Ele
ctro
plat
ing
Feed
lots
Ferti
lizer
Man
ufac
turin
gG
lass
Man
ufac
turin
gG
rain
Mill
sIn
k Fo
rmul
atin
gIn
orga
nic
Che
mic
als
Man
ufac
turin
gIro
n an
d S
teel
Man
ufac
turin
gLe
athe
r Tan
ning
and
Fin
ishi
ngM
etal
Fin
ishi
ngM
etal
Mol
ding
and
Cas
ting
Non
ferr
ous
Met
als
Form
./Met
al P
owde
rsN
onfe
rrou
s M
etal
s M
anuf
actu
ring
Oil
and
Gas
Org
anic
Che
ms.
, Pla
stic
s, a
nd S
yn.
Pai
nt F
orm
ulat
ing
Pav
ing
and
Roo
fing
Mat
eria
lsP
estic
ide
Che
mic
als
Pet
role
um R
efin
ing
Pha
rmac
eutic
al M
anuf
actu
ring
Por
cela
in E
nam
elin
gP
ulp,
Pap
er, a
nd P
aper
boar
dR
ubbe
r Man
ufac
turin
gS
oap
and
Det
erge
nt M
anuf
actu
ring
Ste
am E
lect
ric P
ower
Gen
erat
ing
Tim
ber P
rodu
cts
Pro
cess
ing
Tran
spor
tatio
n E
quip
. Cle
anin
g
Was
te C
ombu
stor
s
C-4
Butyl benzylphthalate X X X X X
Carbontetrachloride X X X X X X
Carbazole X
Chlordane (tech.mix. &metabolites)
X X
Chlorobenzene X X X X X X X
Chlorodibromo-methane X X X
Chloroethane X X X
Chloroform X X X X X X X X X X X
Chrysene X X X X
Cresol X
Delta-BHC X X X
Di-n-butylphthalate X X X X X X X
Di-n-octylphthalate X X
Dibenzo (a,h)anthracene X X X
Dichlorobromo-methane X X X X X
Dieldrin X X
Diethyl phthalate X X X X X X
Diethylamine X
Dimethylphthalate X X X X
Endosulfansulfate X X X
Endrin X X X
Endrin aldehyde X X X X
Ethyl acetate X
Ethylbenzene X X X X X X X
Fluoranthene X X X X X X X
Fluorene X X X X X
Gamma-BHC X X X
Heptachlorepoxide X X
Heptachlor X X
Fibe
rs
X
X
X
X
X
X
X
X
X
X
X
X
X
X
X
X

Alu
min
um F
orm
ing
Bat
tery
Man
ufac
turin
gC
arbo
n B
lack
Man
ufac
turin
gC
entra
lized
Was
te T
reat
men
tC
oil C
oatin
gC
oppe
r For
min
gE
lect
rical
and
Ele
ctro
nic
Com
pone
nts
Ele
ctro
plat
ing
Feed
lots
Ferti
lizer
Man
ufac
turin
gG
lass
Man
ufac
turin
gG
rain
Mill
sIn
k Fo
rmul
atin
gIn
orga
nic
Che
mic
als
Man
ufac
turin
gIro
n an
d S
teel
Man
ufac
turin
gLe
athe
r Tan
ning
and
Fin
ishi
ngM
etal
Fin
ishi
ngM
etal
Mol
ding
and
Cas
ting
Non
ferr
ous
Met
als
Form
./Met
al P
owde
rsN
onfe
rrou
s M
etal
s M
anuf
actu
ring
Oil
and
Gas
Org
anic
Che
ms.
, Pla
stic
s, a
nd S
yn.
Pai
nt F
orm
ulat
ing
Pav
ing
and
Roo
fing
Mat
eria
lsP
estic
ide
Che
mic
als
Pet
role
um R
efin
ing
Pha
rmac
eutic
al M
anuf
actu
ring
Por
cela
in E
nam
elin
gP
ulp,
Pap
er, a
nd P
aper
boar
dR
ubbe
r Man
ufac
turin
gS
oap
and
Det
erge
nt M
anuf
actu
ring
Ste
am E
lect
ric P
ower
Gen
erat
ing
Tim
ber P
rodu
cts
Pro
cess
ing
Tran
spor
tatio
n E
quip
. Cle
anin
g
Was
te C
ombu
stor
s
C-5
Hexachloro-benzene X X X X
Hexachlorobuta-diene X X
Hexachlorocyclopentadiene X X X
Hexachloro-ethane X X X
Indeno (1,2,3-cd)pyrene X X X
Isobutylaldehyde X
Isophorone X X X X
Isopropyl acetate X
Isopropyl ether X
Methyl formate X
Methyl bromide X X X X
Methyl cellosolve X
Methyl IsobutylKetone X
Methyl chloride X X X X X
Methylenechloride X X X X X X X X X X
n-Amyl acetate X
n-Butyl acetate X
n-Decane X
n-Heptane X
n-Hexane X
N-nitrosodi-n-propylamine X X X X
N-nitrosodi-methylamine X X X
N-nitrosodi-phenylamine X X X X X
n-Octadecane X
Naphthalene X X X X X X X X X
Nitrobenzene X X X
Non-polarmaterial (SGT-HEM)
X
Parachloro-metacresol X X X X
PCB–1016 X X X X
Fibe
rs
X
X
X
X
X
X
X
X
X
X
X
X

Alu
min
um F
orm
ing
Bat
tery
Man
ufac
turin
gC
arbo
n B
lack
Man
ufac
turin
gC
entra
lized
Was
te T
reat
men
tC
oil C
oatin
gC
oppe
r For
min
gE
lect
rical
and
Ele
ctro
nic
Com
pone
nts
Ele
ctro
plat
ing
Feed
lots
Ferti
lizer
Man
ufac
turin
gG
lass
Man
ufac
turin
gG
rain
Mill
sIn
k Fo
rmul
atin
gIn
orga
nic
Che
mic
als
Man
ufac
turin
gIro
n an
d S
teel
Man
ufac
turin
gLe
athe
r Tan
ning
and
Fin
ishi
ngM
etal
Fin
ishi
ngM
etal
Mol
ding
and
Cas
ting
Non
ferr
ous
Met
als
Form
./Met
al P
owde
rsN
onfe
rrou
s M
etal
s M
anuf
actu
ring
Oil
and
Gas
Org
anic
Che
ms.
, Pla
stic
s, a
nd S
yn.
Pai
nt F
orm
ulat
ing
Pav
ing
and
Roo
fing
Mat
eria
lsP
estic
ide
Che
mic
als
Pet
role
um R
efin
ing
Pha
rmac
eutic
al M
anuf
actu
ring
Por
cela
in E
nam
elin
gP
ulp,
Pap
er, a
nd P
aper
boar
dR
ubbe
r Man
ufac
turin
gS
oap
and
Det
erge
nt M
anuf
actu
ring
Ste
am E
lect
ric P
ower
Gen
erat
ing
Tim
ber P
rodu
cts
Pro
cess
ing
Tran
spor
tatio
n E
quip
. Cle
anin
g
Was
te C
ombu
stor
s
C-6
PCB–1221 X X X
PCB–1232 X X X
PCB–1242 X X X X
PCB–1248 X X X X
PCB–1254 X X X
PCB–1260 X X X
Pentachloro-phenol X X X X X
Phenanthrene X X X X X X X X
Phenol X X X X X
Pyrene X X X X X
TCDF X
Tetrachloro-catechol X
Tetrachloro-ethylene X X X X X X X X X
Tetrachloro-guaiacol X
Tetrahydrofuran X
Toluene X X X X X X X X X X
Toxaphene X X
Trichloro-ethylene X X X X X X X X
Trichlorosyringol X
Triethylamine X
Vinyl chloride X X X X
Xylenes X
2,3,7,8-tetrachloro-dibenzo-p-dioxin
X X X
OrganicPesticide ActiveIngredients
X
Antimony X X X X X X
Arsenic X X X X X X
Asbestos X
Barium X
Beryllium X
Cadmium X X X X X X X X X X
Chromium, Total X X X X X X X X X X X X X X X X X X X X
Fibe
rs
X
X
X
X
X
X
X
X
X
X
X
X
X
X
X
Alu
min
um F
orm
ing
Bat
tery
Man
ufac
turin
gC
arbo
n B
lack
Man
ufac
turin
gC
entra
lized
Was
te T
reat
men
tC
oil C
oatin
gC
oppe
r For
min
gE
lect
rical
and
Ele
ctro
nic
Com
pone
nts
Ele
ctro
plat
ing
Feed
lots
Ferti
lizer
Man
ufac
turin
gG
lass
Man
ufac
turin
gG
rain
Mill
sIn
k Fo
rmul
atin
gIn
orga
nic
Che
mic
als
Man
ufac
turin
gIro
n an
d S
teel
Man
ufac
turin
gLe
athe
r Tan
ning
and
Fin
ishi
ngM
etal
Fin
ishi
ngM
etal
Mol
ding
and
Cas
ting
Non
ferr
ous
Met
als
Form
./Met
al P
owde
rsN
onfe
rrou
s M
etal
s M
anuf
actu
ring
Oil
and
Gas
Org
anic
Che
ms.
, Pla
stic
s, a
nd S
yn.
Pai
nt F
orm
ulat
ing
Pav
ing
and
Roo
fing
Mat
eria
lsP
estic
ide
Che
mic
als
Pet
role
um R
efin
ing
Pha
rmac
eutic
al M
anuf
actu
ring
Por
cela
in E
nam
elin
gP
ulp,
Pap
er, a
nd P
aper
boar
dR
ubbe
r Man
ufac
turin
gS
oap
and
Det
erge
nt M
anuf
actu
ring
Ste
am E
lect
ric P
ower
Gen
erat
ing
Tim
ber P
rodu
cts
Pro
cess
ing
Tran
spor
tatio
n E
quip
. Cle
anin
g
Was
te C
ombu
stor
s
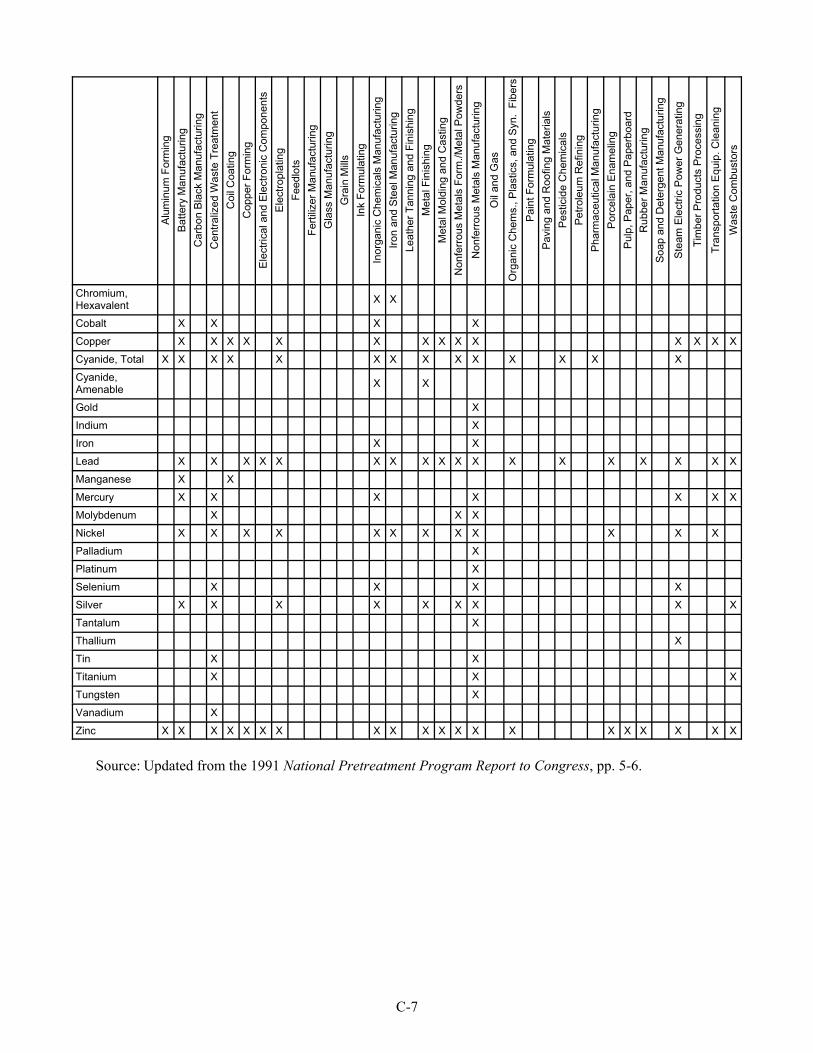
C-7
Chromium,Hexavalent X X
Cobalt X X X X
Copper X X X X X X X X X X X X X
Cyanide, Total X X X X X X X X X X X X X X
Cyanide,Amenable X
Gold X
Indium X
Iron X X
Lead X X X X X X X X X X X X X X X X X X
Manganese X X
Mercury X X X X X X X
Molybdenum X X X
Nickel X X X X X X X
Palladium X
Platinum X
Selenium X X X
Silver X X X X X X X
Tantalum X
Thallium X
Tin X X
Titanium X X X
Tungsten X
Vanadium X
Zinc X X X X X X X X X X X X X X X X X X X X
Source: Updated from the 1991 National Pretreatment Program Report to Congress, pp. 5-6.
Fibe
rs
X
X
XXX XX
X
X X

This page intentionally left blank.
C-8

APPENDIX D -CLEAN WATER ACT PRIORITY POLLUTANTS AND THE FEDERAL
WATER QUALITY CRITERIA
The appendix below lists, in three tables, the National Recommended Water Quality Criteria for:
• Specific chemical compounds that are identified by unique Chemical Abstract Service (CAS) registry numbers;
• Priority pollutants in the form of the Criteria Maximum Concentration (CMC) and Criterion Continuous Concentration (CCC);
• Non-priority pollutants in the form of the Criteria Maximum Concentration (CMC) and Criterion Continuous Concentration (CCC) for non-priority pollutants;
• Organoleptic effects in the form of Organoleptic Effect Criteria.
Please see page D-16 for further discussion and definitions of these criteria.
D-1

D-2
NA
TIO
NA
L R
EC
OM
ME
ND
ED
WA
TE
R Q
UA
LIT
Y C
RIT
ER
IA F
OR
PR
IOR
ITY
PO
LL
UT
AN
TS
Prio
rity
Pollu
tant
CA
SN
umbe
r
Fres
hwat
erSa
ltwat
erH
uman
Hea
lth F
orC
onsu
mpt
ion
of:
FRC
ite/S
ourc
eC
MC
( :g/
L)C
CC
(:g/
L)C
MC
(:g/
L)C
CC
(:g/
L)
Wat
er +
Org
anis
m( :
g/L)
Org
anis
mO
nly
( :g/
L)
1A
ntim
ony
7440
360
14 B
,Z43
00 B
57FR
6084
8
2A
rsen
ic74
4038
234
0 A
,D,K
150
A,D
,K69
A,D
,bb
36 A
,D,b
b0.
018
C,M
,S0.
14 C
,M,S
62FR
4216
057
FR60
848
3B
eryl
lium
7440
417
J,ZJ
62FR
4216
0
4C
adm
ium
7440
439
4.3
D,E
,K2.
2 D
,E,K
42 D
,bb
9.3
D,b
bJ,Z
J62
FR42
160
5aC
hrom
ium
III
1606
5831
570
D,E
,K74
D,E
,KJ,Z
Tot
alJ
EPA
820/
B-9
6-0
0162
FR42
160
5bC
hrom
ium
VI
1854
0299
16 D
,K11
D,K
1,10
0 D
,bb
50 D
,bb
J,Z T
otal
J62
FR42
160
6C
oppe
r74
4050
813
D,E
,K,c
c9.
0 D
,E,K
,cc
4.8
D,c
c,ff
3.1
D,c
c,ff
1,30
0 U
62FR
4216
0
7Le
ad74
3992
165
D,E
,bb,
gg2.
5 D
,E,b
b,gg
210
D,b
b8.
1 D
,bb
JJ
62FR
4216
0
8M
ercu
ry74
3997
61.
4 D
,K,h
h0.
77 D
,K,h
h1.
8 D
,ee,
hh0.
94 D
,ee,
hh0.
050
B0.
051
B62
FR42
160
9N
icke
l74
4002
047
0 D
,E,K
52 D
,E,K
74 D
,bb
8.2
D,b
b61
0 B
4,60
0 B
62FR
4216
0
10Se
leni
um77
8249
2L,
R,T
5.0
T29
0 D
,bb,
dd71
D,b
b,dd
170Z
11,0
0062
FR42
160
IRIS
09/
01/9
1
11Si
lver
7440
224
3.4
D,E
,G1.
9 D
,G62
FR42
160
12Th
alliu
m74
4028
01.
7 B
6.3
B57
FR60
848
13Zi
nc74
4066
612
0 D
,E,K
120
D,E
,K90
D,b
b81
D,b
b9,
100
U69
,000
U62
FR42
160
IRIS
10/
01/9
2

D-3
NA
TIO
NA
L R
EC
OM
ME
ND
ED
WA
TE
R Q
UA
LIT
Y C
RIT
ER
IA F
OR
PR
IOR
ITY
PO
LL
UT
AN
TS
Prio
rity
Pollu
tant
CA
SN
umbe
r
Fres
hwat
erSa
ltwat
erH
uman
Hea
lth F
orC
onsu
mpt
ion
of:
FR C
ite/S
ourc
eC
MC
( :g/
L)C
CC
(:g/
L)C
MC
(:g/
L)C
CC
(:g/
L)
Wat
er +
Org
anis
m( :
g/L)
Org
anis
mO
nly
( :g/
L)
14C
yani
de57
125
22 K
,Q5.
2 K
,Q1
Q,b
b1
Q,b
b70
0 B
,Z22
0,00
0 B
,HEP
A82
0/B
-96-
001
57FR
6084
8
15A
sbes
tos
1332
214
7 m
illio
nfib
ers/
L
57FR
6084
8
162,
3,7,
8-TC
DD
(Dio
xin)
1746
016
1.3E
-8 C
1.4E
-8 C
62FR
4216
0
17A
crol
ein
1070
2832
078
057
FR60
848
18A
cryl
onitr
ile10
7131
0.05
9 B
,C0.
66 B
,C57
FR60
848
19B
enze
ne71
432
1.2
B,C
71 B
,C62
FR42
160
20B
rom
ofor
m75
252
4.3
B,C
360
B,C
62FR
4216
0
21C
arbo
n Te
trach
lorid
e56
235
0.25
B,C
4.4
B,C
57FR
6084
8
22C
hlor
oben
zene
1089
0768
0 B
,Z21
,000
B,H
57FR
6084
8
23C
hlor
odib
rom
omet
hane
1244
810.
41 B
,C34
B,C
62FR
4216
0
24C
hlor
oeth
ane
7500
3
252-
Chl
oroe
thyl
viny
l Eth
er11
0758
26C
hlor
ofor
m67
663
5.7
B,C
470
B,C
62FR
4216
0
27D
ichl
orob
rom
omet
hane
7527
40.
56 B
,C46
B,C
62FR
4216
0
281,
1-D
ichl
oroe
than
e75
343
291,
2-D
ichl
oroe
than
e10
7062
0.38
B,C
99 B
,C57
FR60
848
301,
1-D
ichl
oroe
thyl
ene
7535
40.
057
B,C
3.2
B,C
57FR
6084
8
I

D-4
NA
TIO
NA
L R
EC
OM
ME
ND
ED
WA
TE
R Q
UA
LIT
Y C
RIT
ER
IA F
OR
PR
IOR
ITY
PO
LL
UT
AN
TS
Prio
rity
Pollu
tant
CA
SN
umbe
r
Fres
hwat
erSa
ltwat
erH
uman
Hea
lth F
orC
onsu
mpt
ion
of:
FRC
ite/S
ourc
eC
MC
(:g/
L)C
CC
(:g/
L)C
MC
(:g/
L)C
CC
(:g/
L)
Wat
er +
Org
anis
m( :
g/L)
Org
anis
mO
nly
( :g/
L)31
1,2-
Dic
hlor
opro
pane
7887
50.
52 B
,C39
B,C
62FR
4216
0
321,
3-D
ichl
orop
rope
ne54
2756
10 B
1,70
0 B
57FR
6084
8
33Et
hylb
enze
ne10
0414
3,10
0 B
,Z29
,000
B62
FR42
160
34M
ethy
l Bro
mid
e74
839
48 B
4000
B62
FR42
160
35M
ethy
l Chl
orid
e74
873
JJ
62FR
4216
0
36M
ethy
lene
Chl
orid
e75
092
4.7
B,C
1600
B,C
62FR
4216
0
371,
1,2,
2-Te
trach
loro
etha
ne79
345
0.17
B,C
11 B
,C57
FR60
848
38Te
trach
loro
ethy
lene
1271
840.
8 C
8.85
C57
FR60
848
39To
luen
e10
8883
6,80
0 B
,Z20
0,00
0 B
62FR
4216
0
401,
2-Tr
ans-
Dic
hlor
oeth
ylen
e15
6605
700
B,Z
140,
000
B62
FR42
160
411,
1,1-
Tric
hlor
oeth
ane
7155
6J,Z
J62
FR42
160
421,
1,2-
Tric
hlor
oeth
ane
7900
50.
60 B
,C42
B,C
57FR
6084
8
43Tr
ichl
oroe
thyl
ene
7901
62.
7 C
81 C
57FR
6084
8
44V
inyl
Chl
orid
e75
014
2.0
C52
5 C
57FR
6084
8
452-
Chl
orop
heno
l95
578
120
B,U
400
B,U
62FR
4216
0
462,
4-D
ichl
orop
heno
l12
0832
93 B
,U79
0 B
,U57
FR60
848
472,
4-D
imet
hylp
heno
l10
5679
540
B,U
2,30
0 B
,U62
FR42
160
482-
Met
hyl-4
,6-D
initr
ophe
nol
5345
2113
.476
557
FR60
848
492,
4-D
initr
ophe
nol
5128
570
B14
,000
B57
FR60
848
502-
Nitr
ophe
nol
8875
5
514-
Nitr
ophe
nol
1000
27
523-
Met
hyl-4
-Chl
orop
heno
l59
507
UU

D-5
NA
TIO
NA
L R
EC
OM
ME
ND
ED
WA
TE
R Q
UA
LIT
Y C
RIT
ER
IA F
OR
PR
IOR
ITY
PO
LL
UT
AN
TS
Prio
rity
Pollu
tant
CA
SN
umbe
r
Fres
hwat
erSa
ltwat
erH
uman
Hea
lth F
orC
onsu
mpt
ion
of:
FRC
ite/S
ourc
eC
MC
( :g/
L)C
CC
(:g/
L)C
MC
(:g/
L)C
CC
(:g/
L)
Wat
er +
Org
anis
m( :
g/L)
Org
anis
mO
nly
( :g/
L)
53Pe
ntac
hlor
ophe
nol
8786
519
F,K
15F,
K13
bb7.
9bb
0.28
B,C
8.2
B,C
,H62
FR42
160
54Ph
enol
1089
5221
,000
B,U
4,60
0,00
0B
,H,U
62FR
4216
057
FR60
848
552,
4,6-
Tric
hlor
ophe
nol
8806
22.
1 B
,C,U
6.5
B,C
62FR
4216
0
56A
cena
phth
ene
8332
91,
200
B,U
2,70
0 B
,U62
FR42
160
57A
cena
phth
ylen
e20
8968
58A
nthr
acen
e12
0127
9,60
0 B
110,
000
B62
FR42
160
59B
enzi
dine
9287
50.
0001
2 B
,C0.
0005
4 B
,C57
FR60
848
60B
enzo
(a) A
nthr
acen
e56
553
0.00
44 B
,C0.
049
B,C
62FR
4216
0
61B
enzo
(a) P
yren
e50
328
0.00
44 B
,C0.
049
B,C
62FR
4216
0
62B
enzo
(b) F
luor
anth
ene
2059
920.
0044
B,C
0.04
9 B
,C62
FR42
160
63B
enzo
(ghi
) Per
ylen
e19
1242
64B
enzo
(k) F
luor
anth
ene
2070
890.
0044
B,C
0.04
9 B
,C62
FR42
160
65B
is 2
-Chl
oroe
thox
y M
etha
ne11
1911
66B
is 2
-Chl
oroe
thyl
Eth
er11
1444
0.03
1 B
,C1.
4 B
,C57
FR60
848
67B
is 2
-Chl
oroi
sopr
opyl
Eth
er39
6383
291,
400
B17
0,00
0 B
62FR
4216
057
FR60
848
68B
is 2
-Eth
ylhe
xyl P
htha
late
X11
7817
1.8
B,C
5.9
B,C
57FR
6084
8
694-
Bro
mop
heny
l Phe
nyl E
ther
1015
53
70B
utyl
benz
yl P
htha
late
W85
687
3,00
0 B
5,20
0 B
62FR
4216
0
712-
Chl
oron
apht
hale
ne91
587
1,70
0 B
4,30
0 B
62FR
4216
0

D-6
NA
TIO
NA
L R
EC
OM
ME
ND
ED
WA
TE
R Q
UA
LIT
Y C
RIT
ER
IA F
OR
PR
IOR
ITY
PO
LL
UT
AN
TS
Prio
rity
Pollu
tant
CA
SN
umbe
r
Fres
hwat
erSa
ltwat
erH
uman
Hea
lth F
orC
onsu
mpt
ion
of:
FRC
ite/S
ourc
eC
MC
( :g/
L)C
CC
(:g/
L)C
MC
(:g/
L)C
CC
(:g/
L)
Wat
er +
Org
anis
m( :
g/L)
Org
anis
mO
nly
( :g/
L)
724-
Chl
orop
heny
l Phe
nyl E
ther
7005
723
73C
hrys
ene
2180
190.
0044
B,C
0.04
9 B
,C62
FR42
160
74D
iben
zo (a
,h) A
nthr
acen
e53
703
0.00
44 B
,C0.
049
B,C
62FR
4216
0
751,
2-D
ichl
orob
enze
ne95
501
2,70
0 B
,Z17
,000
B62
FR42
160
761,
3-D
ichl
orob
enze
ne54
1731
400
2,60
062
FR42
160
771,
4-D
ichl
orob
enze
ne10
6467
400
Z26
0062
FR42
160
783,
3'-D
ichl
orob
enzi
dine
9194
10.
04 B
,C0.
077
B,C
57FR
6084
8
79D
ieth
yl P
htha
late
W84
662
23,0
00 B
120,
000
B57
FR60
848
80D
imet
hyl P
htha
late
W13
1113
313,
000
2,90
0,00
057
FR60
848
81D
i-n-B
utyl
Pht
hala
te W
8474
22,
700
B12
,000
B57
FR60
848
822,
4-D
initr
otol
uene
1211
420.
11 C
9.1
C57
FR60
848
832,
6-D
initr
otol
uene
6062
02
84D
i-n-O
ctyl
Pht
hala
te11
7840
851,
2-D
iphe
nylh
ydra
zine
1226
670.
040
B,C
0.54
B,C
57FR
6084
8
86Fl
uora
nthe
ne20
6440
300
B37
0 B
62FR
4216
0
87Fl
uore
ne86
737
1,30
0 B
14,0
00 B
62FR
4216
0
88H
exac
hlor
oben
zene
1187
410.
0007
5 B
,C0.
0007
7 B
,C62
FR42
160
89H
exac
hlor
obut
adie
ne87
683
0.44
B,C
50 B
,C57
FR60
848
90H
exac
hlor
ocyc
lope
ntad
iene
7747
424
0 B
,U,Z
17,0
00 B
,H,U
57FR
6084
8
91H
exac
hlor
oeth
ane
6772
11.
9 B
,C8.
9 B
,C57
FR60
848

D-7
NA
TIO
NA
L R
EC
OM
ME
ND
ED
WA
TE
R Q
UA
LIT
Y C
RIT
ER
IA F
OR
PR
IOR
ITY
PO
LL
UT
AN
TS
Prio
rity
Pollu
tant
CA
SN
umbe
r
Fres
hwat
erSa
ltwat
erH
uman
Hea
lth F
orC
onsu
mpt
ion
of:
FRC
ite/S
ourc
eC
MC
( :g/
L)C
CC
(:g/
L)C
MC
(:g/
L)C
CC
(:g/
L)
Wat
er +
Org
anis
m( :
g/L)
Org
anis
mO
nly
( :g/
L)
92In
deno
(1,2
,3-c
d) P
yren
e19
3395
0.00
44 B
,C0.
049
B,C
62FR
4216
0
93Is
opho
rone
7859
136
B,C
2,60
0 B
,CIR
IS11
/01/
97
94N
apht
hale
ne91
203
95N
itrob
enze
ne98
953
17 B
1,90
0 B
,H,U
57FR
6084
8
96N
-Nitr
osod
imet
hyla
min
e62
759
0.00
069
B,C
8.1
B,C
57FR
6084
8
97N
-Nitr
osod
i-n-P
ropy
lam
ine
6216
470.
005
B,C
1.4
B,C
62FR
4216
0
98N
-Nitr
osod
iphe
nyla
min
e86
306
5.0
B,C
16 B
,C57
FR60
848
99Ph
enan
thre
ne85
018
100
Pyre
ne12
9000
960
B11
,000
B62
FR42
160
101
1,2,
4-Tr
ichl
orob
enze
ne12
0821
260
Z94
0IR
IS 1
1/01
/96
102
Ald
rin30
9002
3.0
G1.
3 G
0.00
013
B,C
0.00
014
B,C
62FR
4216
0
103
alph
a-B
HC
3198
460.
0039
B,C
0.01
3 B
,C62
FR42
160
104
beta
-BH
C31
9857
0.01
4 B
,C0.
046
B,C
62FR
4216
0
105
gam
ma-
BH
C (L
inda
ne)
5889
90.
95 K
0.16
G0.
019
C0.
063
C62
FR42
160
106
delta
-BH
C31
9868
107
Chl
orda
ne57
749
2.4G
0.00
43G
,aa
0.09
G0.
004G
,aa
0.00
21 B
,C0.
0022
B,C
62FR
4216
0IR
IS 0
2/07
/98
108
4,4-
DD
T50
293
1.1G
0.00
1G,a
a0.
13G
0.00
1G,a
a0.
0005
9 B
,C0.
0005
9 B
,C62
FR42
160
109
4,4-
DD
E72
559
0.00
059
B,C
0.00
059
B,C
62FR
4216
0
110
4,4-
DD
D72
548
0.00
083
B,C
0.00
084
B,C
62FR
4216
0

D-8
NA
TIO
NA
L R
EC
OM
ME
ND
ED
WA
TE
R Q
UA
LIT
Y C
RIT
ER
IA F
OR
PR
IOR
ITY
PO
LL
UT
AN
TS
Prio
rity
Pollu
tant
CA
SN
umbe
r
Fres
hwat
erSa
ltwat
erH
uman
Hea
lth F
orC
onsu
mpt
ion
of:
FRC
ite/S
ourc
eC
MC
( :g/
L)C
CC
(:g/
L)C
MC
(:g/
L)C
CC
(:g/
L)
Wat
er +
Org
anis
m( :
g/L)
Org
anis
mO
nly
( :g/
L)11
1D
ield
rin60
571
0.24
K0.
056K
,O0.
71G
0.00
19G
,aa
0.00
014
B,C
0.00
014
B,C
62FR
4216
011
2al
pha-
Endo
sulfa
n95
9988
0.22
G,Y
0.05
6G,Y
0.03
4G,Y
0.00
87G
,Y11
0 B
240
B62
FR42
160
113
beta
-End
osul
fan
3321
3659
0.22
G,Y
0.05
6G,Y
0.03
4G,Y
0.00
87G
,Y11
0 B
240
B62
FR42
160
114
Endo
sulfa
n Su
lfate
1031
078
110
B24
0 B
62FR
4216
011
5En
drin
7220
80.
086K
0.03
6K,O
0.03
7G0.
0023
G,a
a0.
76 B
0.81
B,H
62FR
4216
011
6En
drin
Ald
ehyd
e74
2193
40.
76 B
0.81
B,H
62FR
4216
011
7H
epta
chlo
r76
448
0.52
G0.
0038
G,a
a0.
053G
0.00
36G
,aa
0.00
021
B,C
0.00
021
B,C
62FR
4216
011
8H
epta
chlo
r Epo
xide
1024
573
0.52
G,V
0.00
38G
,V,
aa0.
053G
,V0.
0036
G,V
,aa
0.00
010
B,C
0.00
011
B,C
62FR
4216
0
119
Poly
chlo
rinat
ed B
iphe
nyls
PCB
s:0.
014
N,a
a0.
03 N
,aa
0.00
017
B,C
,P0.
0001
7 B
,C,P
62FR
4216
063
FR16
182
120
Toxa
phen
e80
0135
20.
730.
0002
aa0.
210.
0002
aa0.
0007
3B,C
0.00
075B
,C62
FR42
160
Foot
note
s:A
This
reco
mm
ende
d w
ater
qua
lity
crite
rion
was
der
ived
from
dat
a fo
r ars
enic
(III
), bu
t is a
pplie
d he
re to
tota
l ars
enic
, whi
ch m
ight
impl
y th
at a
rsen
ic (I
II)
and
arse
nic
(V) a
re e
qual
ly to
xic
to a
quat
ic li
fe a
nd th
at th
eir t
oxic
ities
are
add
itive
. A
440
/5-8
4-03
3, Ja
nuar
y 19
85),
Spec
ies M
ean
Acu
te V
alue
s are
giv
en fo
r bot
h ar
seni
c (I
II) a
nd a
rsen
ic (V
) for
five
spec
ies a
nd th
e ra
tios o
f the
SM
AV
s for
eac
h sp
ecie
s ran
ge fr
om 0
.6 to
1.7.
hr
onic
val
ues a
re a
vaila
ble
for b
oth
arse
nic
(III
) and
ars
enic
(V) f
or o
ne sp
ecie
s; fo
r the
fath
ead
min
now
, the
chr
onic
val
ue fo
r ars
enic
(V) i
s 0.2
9tim
es th
e ch
roni
c va
lue
for a
rsen
ic (I
II).
be
ava
ilabl
e co
ncer
ning
whe
ther
the
toxi
citie
s of t
he fo
rms o
f ars
enic
to a
quat
ic o
rgan
ism
sar
e ad
ditiv
e.B
This
crit
erio
n ha
s bee
n re
vise
d to
refle
ct T
he E
nviro
nmen
tal P
rote
ctio
n A
genc
y’s q
1* o
r RfD
, as c
onta
ined
in th
e In
tegr
ated
Ris
k In
form
atio
n Sy
stem
(IR
IS) a
s of A
pril
8, 1
998.
fa
ctor
(BC
F) fr
om th
e 19
80 A
mbi
ent W
ater
Qua
lity
Crit
eria
doc
umen
t was
reta
ined
in e
ach
case
.C
This
crit
erio
n is
bas
ed o
n ca
rcin
ogen
icity
of 1
0-6 ri
sk.
k le
vels
may
be
obta
ined
by
mov
ing
the
deci
mal
poi
nt (e
.g.,
for a
risk
leve
l of 1
0-5 ,
mov
e th
e de
cim
al p
oint
in th
e re
com
men
ded
crite
rion
one
plac
e to
the
right
).D
Fres
hwat
er a
nd sa
ltwat
er c
riter
ia fo
r met
als a
re e
xpre
ssed
in te
rms o
f the
dis
solv
ed m
etal
in th
e w
ater
col
umn.
ed
wat
er q
ualit
y cr
iteria
valu
e w
as c
alcu
late
d by
usi
ng th
e pr
evio
us 3
04(a
) aqu
atic
life
crit
eria
exp
ress
ed in
term
s of t
otal
reco
vera
ble
met
al, a
nd m
ultip
lyin
g it
by a
con
vers
ion
fact
or (C
F).
onve
rsio
n Fa
ctor
" (C
F) re
pres
ents
the
reco
mm
ende
d co
nver
sion
fact
or fo
r con
verti
ng a
met
al c
riter
ion
expr
esse
d as
the
tota
lre
cove
rabl
e fr
actio
n in
the
wat
er c
olum
n to
a c
riter
ion
expr
esse
d as
the
diss
olve
d fr
actio
n in
the
wat
er c
olum
n.
onve
rsio
n Fa
ctor
s for
saltw
ater
CC
Cs
are
not c
urre
ntly
ava
ilabl
e.
ater
CM
Cs h
ave
been
use
d fo
r bot
h sa
ltwat
er C
MC
s and
CC
Cs)
. Se
e "O
ffic
e of
Wat
erPo
licy
In th
e ar
seni
c cr
iteria
doc
umen
t (EP
CN
o da
ta a
re k
now
n to
The
fish
tissu
e bi
ocon
cent
ratio
n
Alte
rnat
e ris
The
reco
mm
end
The
term
"C
(CC
onve
rsio
n fa
ctor
s der
ived
for s
altw

hard
ness
of 1
00 m
g/L.
Crit
eria
val
ues f
or o
ther
har
dnes
s may
be
calc
ulat
ed fr
om th
e fo
llow
ing:
CM
C (d
isso
lved
) = e
xp{m
A [l
n( h
ardn
ess)
]+ b
A}
(CF)
, or
CC
C (d
isso
lved
) = e
xp{m
C [l
n (h
ardn
ess)
]+ b
C}
(CF)
and
the
para
met
ers s
peci
fied
in A
ppen
dix
B to
the
Prea
mbl
e- P
aram
eter
s for
Cal
cula
ting
Fres
hwat
er D
isso
lved
Met
als C
riter
ia T
hat A
re H
ardn
ess-
Dep
ende
nt.
This
reco
mm
ende
d w
ater
qua
lity
crite
rion
is e
xpre
ssed
in te
rms o
f tot
al re
cove
rabl
e m
etal
in th
e w
ater
col
umn.
It i
s sci
entif
ical
ly a
ccep
tabl
e to
use
the
This
val
ue w
as a
nnou
nced
(61F
R58
444-
5844
9, N
ovem
ber 1
4, 1
996)
as a
pro
pose
d G
LI 3
03(c
) aqu
atic
life
crit
erio
n. E
PA is
cur
rent
ly w
orki
ng o
n th
is
440/
5-80
-019
), C
hlor
dane
(EPA
440
/5-8
0-02
7), D
DT
(EPA
440
/5-8
0-03
8), E
ndos
ulfa
n (E
PA 4
40/5
-80-
046)
, End
rin (E
PA 4
40/5
-80-
047)
, Hep
tach
lor
(440
/5-8
0-05
2), H
exac
hlor
ocyc
lohe
xane
(EPA
440
/5-8
0-05
4), S
ilver
(EPA
440
/5-8
0-07
1).
The
Min
imum
Dat
a R
equi
rem
ents
and
der
ivat
ion
proc
edur
es w
ere
diff
eren
t in
the
1980
Gui
delin
es th
an in
the
1985
Gui
delin
es.
For e
xam
ple,
a “
CM
C”
deriv
ed u
sing
the
1980
Gui
delin
es w
as d
eriv
ed
to b
e us
ed a
s an
inst
anta
neou
s max
imum
. If
ass
essm
ent i
s to
be d
one
usin
g an
ave
ragi
ng p
erio
d, th
e va
lues
giv
en sh
ould
be
divi
ded
by 2
to o
btai
n a
valu
e th
at is
mor
e co
mpa
rabl
e to
a C
MC
der
ived
usi
ng th
e 19
85 G
uide
lines
. N
o cr
iterio
n fo
r pro
tect
ion
of h
uman
hea
lth fr
om c
onsu
mpt
ion
of a
quat
ic o
rgan
ism
s exc
ludi
ng w
ater
was
pre
sent
ed in
the
1980
crit
eria
doc
umen
t or i
n
PCB
s are
a c
lass
of c
hem
ical
s whi
ch in
clud
e ar
oclo
rs, 1
242,
125
4, 1
221,
123
2, 1
248,
126
0, a
nd 1
016,
CA
S nu
mbe
rs 5
3469
219,
110
9769
1, 1
1104
282,
This
reco
mm
ende
d cr
iterio
n is
bas
ed o
n a
304(
a) a
quat
ic li
fe c
riter
ion
that
was
issu
ed in
the
1995
Upd
ates
: Wat
er Q
ualit
y C
rite
ria
Doc
umen
ts fo
r the
The
CM
C =
1/[(
f1/C
MC
1) +
(f2/
CM
C2)
] whe
re f1
and
f2 a
re th
e fr
actio
ns o
f tot
al se
leni
um th
at a
re tr
eate
d as
sele
nite
and
sele
nate
, res
pect
ivel
y, a
nd
Prot
ectio
n of
Aqu
atic
Life
in A
mbi
ent W
ater
, (EP
A-8
20-B
-96-
001,
Sep
tem
ber 1
996)
. Th
is v
alue
was
der
ived
usi
ng th
e G
LI G
uide
lines
(6
0FR
1539
3-15
399,
Mar
ch 2
3, 1
995;
40C
FR13
2 A
ppen
dix
A);
the
diff
eren
ce b
etw
een
the
1985
Gui
delin
es a
nd th
e G
LI G
uide
lines
are
exp
lain
ed o
n pa
ge iv
of t
he 1
995
Upd
ates
. N
one
of th
e de
cisi
ons c
once
rnin
g th
e de
rivat
ion
of th
is c
riter
ion
wer
e af
fect
ed b
y an
y co
nsid
erat
ions
that
are
spec
ific
to
the
Gre
at L
akes
.
Fres
hwat
er a
quat
ic li
fe v
alue
s for
pen
tach
loro
phen
ol a
re e
xpre
ssed
as a
func
tion
of p
H, a
nd a
re c
alcu
late
d as
follo
ws:
CM
C =
exp
(1.0
05(p
H)-
4.86
9);
The
deriv
atio
n of
the
CC
C fo
r thi
s pol
luta
nt d
id n
ot c
onsi
der e
xpos
ure
thro
ugh
the
diet
, whi
ch is
pro
babl
y im
porta
nt fo
r aqu
atic
life
occ
upyi
ng u
pper
Nev
erth
eles
s, su
ffic
ient
info
rmat
ion
was
pre
sent
ed in
the
1980
doc
umen
t to
allo
w th
e ca
lcul
atio
n of
a c
riter
ion,
and
Tech
nica
l Gui
danc
e on
Inte
rpre
tatio
n an
d Im
plem
enta
tion
of A
quat
ic L
ife M
etal
s Crit
eria
,” O
ctob
er 1
, 199
3, b
y M
arth
a G
. Pro
thro
, Act
ing
Ass
ista
nt A
dmin
istra
tor f
or W
ater
, ava
ilabl
e fr
om th
e W
ater
Res
ourc
e C
ente
r, U
SEPA
, 401
M S
t., S
W, m
ail c
ode
RC
4100
, Was
hing
ton,
DC
204
60;
and
40C
FR§1
31.3
6(b)
(1).
Con
vers
ion
Fact
ors a
pplie
d in
the
tabl
e ca
n be
foun
d in
App
endi
x A
to th
e Pr
eam
ble-
Con
vers
ion
Fact
ors f
or D
isso
lved
M
etal
s.
EPA
has
not
cal
cula
ted
hum
an h
ealth
crit
erio
n fo
r thi
s con
tam
inan
t. H
owev
er, p
erm
it au
thor
ities
shou
ld a
ddre
ss th
is c
onta
min
ant i
n N
PDES
per
mit
EPA
is c
urre
ntly
reas
sess
ing
the
crite
ria fo
r ars
enic
. U
pon
com
plet
ion
of th
e re
asse
ssm
ent t
he A
genc
y w
ill p
ublis
h re
vise
d cr
iteria
as a
ppro
pria
te.
The
fres
hwat
er c
riter
ion
for t
his m
etal
is e
xpre
ssed
as a
func
tion
of h
ardn
ess (
mg/
L) in
the
wat
er c
olum
n. T
he v
alue
giv
en h
ere
corr
espo
nds t
o a
This
Crit
erio
n is
bas
ed o
n 30
4(a)
aqu
atic
life
crit
erio
n is
sued
in 1
980,
and
was
issu
ed in
one
of t
he fo
llow
ing
docu
men
ts: A
ldrin
/Die
ldrin
(EPA
This
crit
erio
n fo
r asb
esto
s is t
he M
axim
um C
onta
min
ant L
evel
(MC
L) d
evel
oped
und
er th
e Sa
fe D
rinki
ng W
ater
Act
(SD
WA
).
conv
ersi
on fa
ctor
of 0
.922
that
was
use
d in
the
GLI
to c
onve
rt th
is to
a v
alue
that
is e
xpre
ssed
in te
rms o
f dis
solv
ed m
etal
.
1114
1165
, 126
7229
6, 1
1096
825
and
1267
4112
resp
ectiv
ely.
The
aqu
atic
life
crit
eria
app
ly to
this
set o
f PC
Bs.
This
crit
erio
n ap
plie
s to
tota
l pcb
s, i.e
., th
e su
m o
f all
cong
ener
or a
ll is
omer
ana
lyse
s. Th
is re
com
men
ded
wat
er q
ualit
y cr
iterio
n is
exp
ress
ed a
s :g
free
cya
nide
(as C
N)/L
.
CC
C =
exp
(1.0
05(p
H)-
5.13
4).
Val
ues d
ispl
ayed
in ta
ble
corr
espo
nd to
a p
H o
f 7.8
.
even
thou
gh th
e re
sults
of s
uch
a ca
lcul
atio
n w
ere
not s
how
n in
the
docu
men
t.
This
reco
mm
ende
d w
ater
qua
lity
crite
rion
refe
rs to
the
inor
gani
c fo
rm o
nly.
cr
iterio
n an
d so
this
val
ue m
ight
cha
nge
subs
tant
ially
in th
e ne
ar fu
ture
.
CM
C1
and
CM
C2
are
185.
9 :g
/L a
nd 1
2.83
:g/
L, re
spec
tivel
y.
actio
ns u
sing
the
Stat
e's e
xist
ing
narr
ativ
e cr
iteria
for t
oxic
s.
the
1986
Qua
lity
Cri
teri
a fo
r Wat
er.
troph
ic le
vels
.
K
L M
N
O
P Q
R
S T F G
H
E I J
D-9

0.02
5 :g
/L g
iven
on
page
23
of th
e cr
iteria
doc
umen
t is b
ased
on
the
Fina
l Res
idue
Val
ue p
roce
dure
in th
e 19
85 G
uide
lines
. Si
nce
the
publ
icat
ion
of th
e G
reat
Th
is re
com
men
ded
wat
er q
ualit
y cr
iterio
n w
as d
eriv
ed o
n pa
ge 4
3 of
the
mer
cury
crit
eria
doc
umen
t (EP
A 4
40/5
-84-
026,
Janu
ary
1985
). Th
e sa
ltwat
er C
CC
of
Wat
er Q
ualit
y C
rite
ria
for t
he P
rote
ctio
n of
Aqu
atic
Org
anis
ms a
nd T
heir
Use
s, PB
85-2
2704
9, Ja
nuar
y 19
85) a
nd w
as is
sued
in o
ne o
f the
follo
win
g cr
iteria
do
cum
ents
: Ars
enic
(EPA
440
/5-8
4-03
3), C
adm
ium
(EPA
440
/5-8
4-03
2), C
hrom
ium
(EPA
440
/5-8
4-02
9), C
oppe
r (EP
A 4
40/5
-84-
031)
, Cya
nide
(EPA
440
/5-
84-0
28),
Lead
(EPA
440
/5-8
4-02
7), N
icke
l (EP
A 4
40/5
-86-
004)
, Pen
tach
loro
phen
ol (E
PA 4
40/5
-86-
009)
, Tox
aphe
ne, (
EPA
440
/5-8
6-00
6), Z
inc
(EPA
44
0/5-
87- 0
03).
1995
(60F
R15
393-
1539
9, M
arch
23,
199
5), t
he A
genc
y no
long
er u
ses t
he F
inal
Res
idue
Val
ue p
roce
dure
for d
eriv
ing
CC
Cs f
or n
ew o
r rev
ised
304
(a) a
quat
ic
life
crite
ria.
crite
ria.
It is
ant
icip
ated
that
indu
stry
inte
nds t
o pu
blis
h in
the
peer
revi
ewed
lite
ratu
re d
raft
aqua
tic li
fe c
riter
ia g
ener
ated
in a
ccor
danc
e w
ith E
PA G
uide
lines
. EP
A w
ill re
view
such
crit
eria
for p
ossi
ble
issu
ance
as n
atio
nal W
QC
.
Alth
ough
EPA
has
not
pub
lishe
d a
final
crit
eria
doc
umen
t for
this
com
poun
d it
is E
PA’s
und
erst
andi
ng th
at su
ffic
ient
dat
a ex
ist to
allo
w c
alcu
latio
n of
aqu
atic
This
reco
mm
ende
d w
ater
qua
lity
crite
rion
was
der
ived
from
dat
a fo
r ino
rgan
ic m
ercu
ry (I
I), b
ut is
app
lied
here
to to
tal m
ercu
ry.
If a
subs
tant
ial p
ortio
n of
the
This
wat
er q
ualit
y cr
iterio
n is
bas
ed o
n a
304(
a) a
quat
ic li
fe c
riter
ion
that
was
der
ived
usi
ng th
e 19
85 G
uide
lines
(Gui
delin
es fo
r Der
ivin
g N
umer
ical
Nat
iona
l
This
CC
C is
bas
ed o
n th
e Fi
nal R
esid
ue V
alue
pro
cedu
re in
the
1985
Gui
delin
es.
Sinc
e th
e pu
blic
atio
n of
the
Gre
at L
akes
Aqu
atic
Life
Cri
teri
a G
uide
lines
in
mer
cury
in th
e w
ater
col
umn
is m
ethy
lmer
cury
, thi
s crit
erio
n w
ill p
roba
bly
be u
nder
pro
tect
ive.
In
addi
tion,
eve
n th
ough
inor
gani
c m
ercu
ry is
con
verte
d to
m
ethy
lmer
cury
and
met
hylm
ercu
ry b
ioac
cum
ulat
es to
a g
reat
ext
ent,
this
crit
erio
n do
es n
ot a
ccou
nt fo
r upt
ake
via
the
food
cha
in b
ecau
se su
ffic
ient
dat
a w
ere
not a
vaila
ble
whe
n th
e cr
iterio
n w
as d
eriv
ed.
The
sele
nium
crit
eria
doc
umen
t (EP
A 4
40/5
-87-
006,
Sep
tem
ber 1
987)
pro
vide
s tha
t if s
elen
ium
is a
s tox
ic to
saltw
ater
fish
es in
the
field
as i
t is t
o fr
eshw
ater
fis
hes i
n th
e fie
ld, t
he st
atus
of t
he fi
sh c
omm
unity
shou
ld b
e m
onito
red
whe
neve
r the
con
cent
ratio
n of
sele
nium
exc
eeds
5.0
:g/
L in
salt
wat
er b
ecau
se th
e
A m
ore
strin
gent
MC
L ha
s bee
n is
sued
by
EPA
. R
efer
to d
rinki
ng w
ater
regu
latio
ns (4
0 C
FR 1
41) o
r Saf
e D
rinki
ng W
ater
Hot
line
(1-8
00-4
26-4
791)
for
Lake
s Aqu
atic
Life
Cri
teri
a G
uide
lines
in 1
995
(60F
R15
393-
1539
9, M
arch
23,
199
5), t
he A
genc
y no
long
er u
ses t
he F
inal
Res
idue
Val
ue p
roce
dure
for
deriv
ing
CC
Cs f
or n
ew o
r rev
ised
304
(a) a
quat
ic li
fe c
riter
ia.
This
val
ue w
as d
eriv
ed fr
om d
ata
for h
epta
chlo
r and
the
crite
ria d
ocum
ent p
rovi
des i
nsuf
ficie
nt d
ata
to e
stim
ate
the
rela
tive
toxi
citie
s of h
epta
chlo
r and
This
reco
mm
ende
d w
ater
qua
lity
crite
rion
was
der
ived
in A
mbi
ent W
ater
Qua
lity
Cri
teri
a Sa
ltwat
er C
oppe
r Add
endu
m (D
raft,
Apr
il 14
, 199
5) a
nd w
as
Whe
n th
e co
ncen
tratio
n of
dis
solv
ed o
rgan
ic c
arbo
n is
ele
vate
d, c
oppe
r is s
ubst
antia
lly le
ss to
xic
and
use
of W
ater
-Eff
ect R
atio
s mig
ht b
e ap
prop
riate
.
This
val
ue w
as d
eriv
ed fr
om d
ata
for e
ndos
ulfa
n an
d is
mos
t app
ropr
iate
ly a
pplie
d to
the
sum
of a
lpha
-end
osul
fan
and
beta
-end
osul
fan.
EPA
is a
ctiv
ely
wor
king
on
this
crit
erio
n an
d so
this
reco
mm
ende
d w
ater
qua
lity
crite
rion
may
cha
nge
subs
tant
ially
in th
e ne
ar fu
ture
.
Ther
e is
a fu
ll se
t of a
quat
ic li
fe to
xici
ty d
ata
that
show
that
DEH
P is
not
toxi
c to
aqu
atic
org
anis
ms a
t or b
elow
its s
olub
ility
lim
it.
prom
ulga
ted
in th
e In
terim
fina
l Nat
iona
l Tox
ics R
ule
(60F
R22
228-
2222
37, M
ay 4
, 199
5).
saltw
ater
CC
C d
oes n
ot ta
ke in
to a
ccou
nt u
ptak
e vi
a th
e fo
od c
hain
.
hept
achl
or e
poxi
de.
valu
es.
V
W
X
Y
Z aa
bb
cc
dd
ee
ff
gg
hh
D-10

D-11
NA
TIO
NA
L R
EC
OM
ME
ND
ED
WA
TE
R Q
UA
LIT
Y C
RIT
ER
IA F
OR
NO
N-P
RIO
RIT
Y P
OL
LU
TA
NT
S
Prio
rity
Pollu
tant
CA
S N
umbe
r
Fres
hwat
erSa
ltwat
erH
uman
Hea
lth F
orC
onsu
mpt
ion
of:
FR C
ite/S
ourc
eC
MC
(:g/
L)C
CC
(:g/
L)C
MC
(:g/
L)C
CC
(:g/
L)
Wat
er +
Org
anis
m(:
g/L)
Org
anis
mO
nly
(:g/
L)
1A
lkal
inity
--*
2000
0 F
*G
old
Boo
k
2A
lum
inum
pH
6.5
- 9.
074
2990
575
0 G
,I87
G,I,
L*
53FR
3317
8
3A
mm
onia
7664
417
FRES
HW
ATE
R C
RIT
ERIA
AR
E pH
DEP
END
ENT
-- S
EE D
OC
UM
ENT
SALT
WA
TER
CR
ITER
IA A
RE
pH A
ND
TEM
PER
ATU
RE
DEP
END
ENT
EPA
822-
R-9
8-00
8EP
A44
0/5-
88-0
04
4A
esth
etic
Qua
litie
s--
NA
RR
ATI
VE
STA
TEM
ENT
-- S
EE D
OC
UM
ENT
Gol
d B
ook
5B
acte
ria--
FOR
PR
IMA
RY
REC
REA
TIO
N A
ND
SH
ELLF
ISH
USE
S --
SEE
DO
CU
MEN
TG
old
Boo
k
6B
ariu
m74
4039
31,
000
AG
old
Boo
k
7B
oron
--N
AR
RA
TIV
E ST
ATE
MEN
T --
SEE
DO
CU
MEN
TG
old
Boo
k
8C
hlor
ide
1688
7006
8600
00 G
2300
00 G
53FR
1902
8
9C
hlor
ine
7782
505
1911
137.
5C
Gol
d B
ook
10C
hlor
ophe
noxy
Her
bici
de2,
4,5,
-TP
9372
110
AG
old
Boo
k
11C
hlor
ophe
noxy
Her
bici
de2,
4-D
9475
710
0 A
,CG
old
Boo
k
12C
hlor
pyrif
os29
2188
20.
083
G0.
041
G0.
011
G0.
0056
GG
old
Boo
k
13C
olor
--N
AR
RA
TIV
E ST
ATE
MEN
T --
SEE
DO
CU
MEN
T
Gol
d B
ook
14D
emet
on80
6548
30.
1 F
0.1
FG
old
Boo
k
15Et
her,
Bis
Chl
orom
ethy
l54
2881
0.00
013
E0.
0007
8 E
IRIS
01/
01/9
1
16G
ases
, Tot
al D
isso
lved
--N
AR
RA
TIV
E ST
ATE
MEN
T --
SEE
DO
CU
MEN
T
Gol
d B
ook
17G
uthi
on86
500
0.01
F0.
01 F
Gol
d B
ook
18H
ardn
ess
--N
AR
RA
TIV
E ST
ATE
MEN
T --
SEE
DO
CU
MEN
TG
old
Boo
k
**
*
**
*
D
F F

D-12
NA
TIO
NA
L R
EC
OM
ME
ND
ED
WA
TE
R Q
UA
LIT
Y C
RIT
ER
IA F
OR
NO
N-P
RIO
RIT
Y P
OL
LU
TA
NT
S
Prio
rity
Pollu
tant
CA
S N
umbe
r
Fres
hwat
erSa
ltwat
erH
uman
Hea
lth F
orC
onsu
mpt
ion
of:
FR C
ite/S
ourc
eC
MC
(:g/
L)C
CC
(:g/
L)C
MC
(:g/
L)C
CC
(:g/
L)
Wat
er +
Org
anis
m(:
g/L)
Org
anis
mO
nly
(:g/
L)
19H
exac
hlor
ocyc
lo-h
exan
e-Te
chni
cal
3198
680.
0123
0.04
14G
old
Boo
k
20Ir
on74
3989
610
00 F
300
AG
old
Boo
k
21M
alat
hion
1217
550.
1 F
0.1
FG
old
Boo
k
22M
anga
nese
7439
965
50 A
100
AG
old
Boo
k
23M
etho
xych
lor
7243
50.
03 F
0.03
F10
0 A
,CG
old
Boo
k
24M
irex
2385
855
0.00
1 F
0.00
1 F
Gol
d B
ook
25N
itrat
es14
7975
5810
,000
AG
old
Boo
k
26N
itros
amin
es--
0.00
081.
24
27D
initr
ophe
nols
2555
0587
7014
,000
Gol
d B
ook
28N
itros
odib
utyl
amin
e,N
9241
630.
0064
A0.
587
AG
old
Boo
k
29N
itros
odie
thyl
amin
e,N
5518
50.
0008
A1.
24 A
Gol
d B
ook
30N
itros
opyr
rolid
ine,
N93
0552
0.01
691
.9G
old
Boo
k
31O
il an
d G
reas
e--
NA
RR
ATI
VE
STA
TEM
ENT
-- S
EE D
OC
UM
ENT
G
old
Boo
k
32O
xyge
n, D
isso
lved
7782
447
WA
RM
WA
TER
AN
D C
OLD
WA
TER
MA
TRIX
-- S
EE D
OC
UM
ENT
G
old
Boo
k
33Pa
rath
ion
5638
20.
065
J0.
013
JG
old
Boo
k
34Pe
ntac
hlor
oben
zene
6089
353.
5 E
4.1
EIR
IS 0
3/01
/88
35pH
--6.
5 - 9
F6.
5 - 8
.5 F
,K5
- 9G
old
Boo
k
36Ph
osph
orus
Ele
men
tal
7723
140
0.1
F,K
Gol
d B
ook
37Ph
osph
ate
Phos
phor
us--
NA
RR
ATI
VE
STA
TEM
ENT
-- S
EE D
OC
UM
ENT
Gol
d B
ook
F
O

D-13
NA
TIO
NA
L R
EC
OM
ME
ND
ED
WA
TE
R Q
UA
LIT
Y C
RIT
ER
IA F
OR
NO
N-P
RIO
RIT
Y P
OL
LU
TA
NT
S
Prio
rity
Pollu
tant
CA
S N
umbe
r
Fres
hwat
erSa
ltwat
erH
uman
Hea
lth F
orC
onsu
mpt
ion
of:
FR C
ite/S
ourc
eC
MC
(:g/
L)C
CC
(:g/
L)C
MC
(:g/
L)C
CC
(:g/
L)
Wat
er +
Org
anis
m(:
g/L)
Org
anis
mO
nly
(:g/
L)
38So
lids D
isso
lved
and
Salin
ity--
250,
000
AG
old
Boo
k
39So
lids S
uspe
nded
and
Turb
idity
--N
AR
RA
TIV
E ST
ATE
MEN
T --
SEE
DO
CU
MEN
T
Gol
d B
ook
40Su
lfide
-Hyd
roge
n Su
lfide
7783
064
2.0
F2.
0 F
Gol
d B
ook
41Ta
intin
g Su
bsta
nces
--N
AR
RA
TIV
E ST
ATE
MEN
T --
SEE
DO
CU
MEN
TG
old
Boo
k
42Te
mpe
ratu
re--
SPEC
IES
DEP
END
ENT
CR
ITER
IA --
SEE
DO
CU
MEN
T
Gol
d B
ook
43Te
trach
loro
benz
ene,
1,2,
4,5-
9594
32.
3 E
2.9
EIR
IS03
/01/
91
44Tr
ibut
yltin
TB
T--
0.46
N0.
063
N0.
37 N
0.01
0 N
62FR
4255
4
45Tr
ichl
orop
heno
l,2,4
,5-
9595
42,
600
B,E
9800
B,E
IRIS
03/
01/8
8Fo
otno
tes:
ATh
is h
uman
hea
lth c
riter
ion
is th
e sa
me
as o
rigin
ally
pub
lishe
d in
the
Red
Boo
k w
hich
pre
date
s the
198
0 m
etho
dolo
gy a
nd d
id n
ot u
tiliz
e th
e fis
h in
gest
ion
BC
F ap
proa
ch.
lue
is n
ow p
ublis
hed
in th
e G
old
Boo
k.B
The
orga
nole
ptic
eff
ect c
riter
ion
is m
ore
strin
gent
than
the
valu
e pr
esen
ted
in th
e no
n pr
iorit
y po
lluta
nts t
able
.C
A m
ore
strin
gent
Max
imum
Con
tam
inan
t Lev
el (M
CL)
has
bee
n is
sued
by
EPA
und
er th
e Sa
fe D
rinki
ng W
ater
Act
. w
ater
regu
latio
ns40
CFR
141
or S
afe
Drin
king
Wat
er H
otlin
e (1
-800
-426
-479
1) fo
r val
ues.
DA
ccor
ding
to th
e pr
oced
ures
des
crib
ed in
the
Gui
delin
es fo
r Der
ivin
g N
umer
ical
Nat
iona
l Wat
er Q
ualit
y C
rite
ria
for t
he P
rote
ctio
n of
Aqu
atic
Org
anis
ms a
ndTh
eir U
ses,
exce
pt p
ossi
bly
whe
re a
ver
y se
nsiti
ve sp
ecie
s is i
mpo
rtant
at a
site
, fre
shw
ater
aqu
atic
life
shou
ld b
e pr
otec
ted
if bo
th c
ondi
tions
spec
ified
inA
ppen
dix
C to
the
Prea
mbl
e--C
alcu
latio
n of
Fre
shw
ater
Am
mon
ia C
riter
ion
are
satis
fied.
ETh
is c
riter
ion
has b
een
revi
sed
to re
flect
The
Env
ironm
enta
l Pro
tect
ion
Age
ncy’
s q1*
or R
fD, a
s con
tain
ed in
the
Inte
grat
ed R
isk
Info
rmat
ion
Syst
em (I
RIS
) as
of A
pril
8, 1
998.
us
ed to
der
ive
the
orig
inal
crit
erio
n w
as re
tain
ed in
eac
h ca
se.
FTh
e de
rivat
ion
of th
is v
alue
is p
rese
nted
in th
e R
ed B
ook
(EPA
440
/9-7
6-02
3, Ju
ly, 1
976)
.G
This
val
ue is
bas
ed o
n a
304(
a) a
quat
ic li
fe c
riter
ion
that
was
der
ived
usi
ng th
e 19
85 G
uide
lines
(Gui
delin
es fo
r Der
ivin
g N
umer
ical
Nat
iona
l Wat
er Q
ualit
yC
rite
ria
for t
he P
rote
ctio
n of
Aqu
atic
Org
anis
ms a
nd T
heir
Use
s, PB
85-2
2704
9, Ja
nuar
y 19
85) a
nd w
as is
sued
in o
ne o
f the
follo
win
g cr
iteria
doc
umen
ts:
Alu
min
um (E
PA 4
40/5
-86-
008)
; Chl
orid
e (E
PA 4
40/5
-88-
001)
; Chl
orpy
rifos
(EPA
440
/5-8
6-00
5).
ITh
is v
alue
is e
xpre
ssed
in te
rms o
f tot
al re
cove
rabl
e m
etal
in th
e w
ater
col
umn.
JTh
is v
alue
is b
ased
on
a 30
4(a)
aqu
atic
life
crit
erio
n th
at w
as is
sued
in th
e 19
95 U
pdat
es: W
ater
Qua
lity
Cri
teri
a D
ocum
ents
for t
he P
rote
ctio
n of
Aqu
atic
Life
in A
mbi
ent W
ater
(EPA
-820
-B-9
6-00
1).
Gui
delin
es (6
0FR
1539
3-15
399,
Mar
ch 2
3, 1
995;
40C
FR13
2 A
ppen
dix
A);
the
diff
eren
ces b
etw
een
the
1985
Gui
delin
es a
nd th
e G
LI G
uide
lines
are
exp
lain
ed o
n pa
ge iv
of t
he 1
995
Upd
ates
. rn
ing
this
crit
erio
n w
asaf
fect
ed b
y an
y co
nsid
erat
ions
that
are
spec
ific
to th
e G
reat
Lak
es.
F
M
This
sam
e cr
iterio
n va
Ref
er to
drin
king
The
fish
tissu
e bi
ocon
cent
ratio
n fa
ctor
(BC
F)
This
val
ue w
as d
eriv
ed u
sing
the
GLI
N
o de
cisi
on c
once

For o
pen
ocea
n w
ater
s whe
re th
e de
pth
is su
bsta
ntia
lly g
reat
er th
an th
e eu
phot
ic z
one,
the
pH sh
ould
not
be
chan
ged
mor
e th
an 0
.2 u
nits
from
the
natu
rally
oc
curr
ing
varia
tion
or a
ny c
ase
outs
ide
the
rang
e of
6.5
to 8
.5.
For s
hallo
w, h
ighl
y pr
oduc
tive
coas
tal a
nd e
stua
rine
area
s whe
re n
atur
ally
occ
urrin
g pH
va
riatio
ns a
ppro
ach
the
leth
al li
mits
of s
ome
spec
ies,
chan
ges i
n pH
shou
ld b
e av
oide
d bu
t in
any
case
shou
ld n
ot e
xcee
d th
e lim
its e
stab
lishe
d fo
r fre
sh
wat
er, i
.e.,
6.5-
9.0.
This
val
ue w
as a
nnou
nced
(62F
R42
554,
Aug
ust 7
, 199
7) a
s a p
ropo
sed
304(
a) a
quat
ic li
fe c
riter
ion.
Alth
ough
EPA
has
not
resp
onde
d to
pub
lic c
omm
ent,
EPA
bass
in w
ater
with
pH
= 6.
5-6.
6 an
d ha
rdne
ss <
10 m
g/L.
Dat
a in
“A
lum
inum
Wat
er-E
ffec
t Rat
io fo
r the
3M
Pla
nt E
fflu
ent D
isch
arge
, Mid
dlew
ay, W
est
Virg
inia
” (M
ay 1
994)
indi
cate
that
alu
min
um is
subs
tant
ially
less
toxi
c at
hig
her p
H a
nd h
ardn
ess,
but t
he e
ffec
ts o
f pH
and
har
dnes
s are
not
wel
l qua
ntifi
ed a
t th
is ti
me.
(2)
In te
sts w
ith th
e br
ook
trout
at l
ow p
H a
nd h
ardn
ess,
effe
cts i
ncre
ased
with
incr
easi
ng c
once
ntra
tions
of t
otal
alu
min
um e
ven
thou
gh th
e co
ncen
tratio
n of
dis
solv
ed a
lum
inum
was
con
stan
t, in
dica
ting
that
tota
l rec
over
able
is a
mor
e ap
prop
riate
mea
sure
men
t tha
n di
ssol
ved,
at l
east
whe
n pa
rticu
late
al
umin
um is
prim
arily
alu
min
um h
ydro
xide
par
ticle
s. In
surfa
ce w
ater
s, ho
wev
er, t
he to
tal r
ecov
erab
le p
roce
dure
mig
ht m
easu
re a
lum
inum
ass
ocia
ted
with
cl
ay p
artic
les,
whi
ch m
ight
be
less
toxi
c th
an a
lum
inum
ass
ocia
ted
with
alu
min
um h
ydro
xide
. (3
) EPA
is a
war
e of
fiel
d da
ta in
dica
ting
that
man
y hi
gh q
ualit
y w
ater
s in
the
U.S
. con
tain
mor
e th
an 8
7 :g
alu
min
um/L
, whe
n ei
ther
tota
l rec
over
able
or d
isso
lved
is m
easu
red.
Ther
e ar
e th
ree
maj
or re
ason
s why
the
use
of W
ater
-Eff
ect R
atio
s mig
ht b
e ap
prop
riate
. (1
) The
val
ue o
f 87 :g
/L is
bas
ed o
n a
toxi
city
test
with
the
strip
ed
U.S
. EPA
. 197
3. W
ater
Qua
lity
Cri
teri
a 19
72. E
PA-R
3-73
-033
. Nat
iona
l Tec
hnic
al In
form
atio
n Se
rvic
e, S
prin
gfie
ld, V
A.;
U.S
. EPA
. 197
7. T
empe
ratu
re
U.S
. EPA
. 198
6. A
mbi
ent W
ater
Qua
lity
Cri
teri
a fo
r Dis
solv
ed O
xyge
n. E
PA 4
40/5
-86-
003.
Nat
iona
l Tec
hnic
al In
form
atio
n Se
rvic
e, S
prin
gfie
ld, V
A.
is p
ublis
hing
this
as a
304
(a) c
riter
ion
in to
day’
s not
ice
as g
uida
nce
for S
tate
s and
Trib
es to
con
side
r whe
n ad
optin
g w
ater
qua
lity
crite
ria.
Cri
teri
a fo
r Fre
shw
ater
Fis
h: P
roto
col a
nd P
roce
dure
s. EP
A-6
00/3
-77-
061.
Nat
iona
l Tec
hnic
al In
form
atio
n Se
rvic
e, S
prin
gfie
ld, V
A.
Acc
ordi
ng to
pag
e 18
1 of
the
Red
Boo
k:K
L M
N
O
D-14

D-15
NA
TIO
NA
L R
EC
OM
ME
ND
ED
WA
TE
R Q
UA
LIT
Y C
RIT
ER
IA F
OR
OR
GA
NO
LE
PTIC
EFF
EC
TS
Pollu
tant
CA
S N
umbe
rO
rgan
olep
tic E
ffec
t Crit
eria
(:g/
L)FR
Cite
/Sou
rce
1A
cena
phth
ene
8332
920
Gol
d B
ook
2M
onoc
hlor
oben
zene
1089
0720
Gol
d B
ook
33-
Chl
orop
heno
l--
0.1
Gol
d B
ook
44-
Chl
orop
heno
l10
6489
0.1
Gol
d B
ook
52,
3-D
ichl
orop
heno
l--
0.04
Gol
d B
ook
62,
5-D
ichl
orop
heno
l--
0.5
Gol
d B
ook
72,
6-D
ichl
orop
heno
l--
0.2
Gol
d B
ook
83,
4-D
ichl
orop
heno
l--
0.3
Gol
d B
ook
92,
4,5-
Tric
hlor
ophe
nol
9595
41
Gol
d B
ook
102,
4,6-
Tric
hlor
opeh
nol
8806
22
Gol
d B
ook
112,
3,4,
6-Te
trach
loro
phen
ol--
1G
old
Boo
k
122-
Met
hyl-4
-Chl
orop
heno
l--
1800
Gol
d B
ook
133-
Met
hyl-4
-Chl
orop
heno
l59
507
3000
Gol
d B
ook
143-
Met
hyl-6
-Chl
orop
heno
l--
20G
old
Boo
k
152-
Chl
orop
heno
l95
578
0.1
Gol
d B
ook
16C
oppe
r74
4050
810
00G
old
Boo
k
172,
4-D
ichl
orop
heno
l12
0832
0.3
Gol
d B
ook
182,
4-D
imet
hylp
heno
l10
5679
400
Gol
d B
ook
19H
exac
hlor
ocyc
lope
ntad
iene
7747
41
Gol
d B
ook
20N
itrob
enze
ne98
953
30G
old
Boo
k

be e
xpos
ed b
riefly
with
out r
esul
ting
in a
n un
acce
ptab
le e
ffec
t. Th
e C
riter
ion
Con
tinuo
us C
once
ntra
tion
(CC
C) i
s an
estim
ate
of th
e hi
ghes
t con
cent
ratio
n of
a
The
CM
C a
nd C
CC
are
just
two
ofm
ater
ial i
n su
rfac
e w
ater
to w
hich
an
aqua
tic c
omm
unity
can
be
expo
sed
inde
finite
ly w
ithou
t res
ultin
g in
an
unac
cept
able
eff
ect.
the
six
parts
of a
aqu
atic
life
crit
erio
n; th
e ot
her f
our p
arts
are
the
acut
e av
erag
ing
perio
d, c
hron
ic a
vera
ging
per
iod,
acu
te fr
eque
ncy
of a
llow
ed e
xcee
denc
e, a
nd
chro
nic
freq
uenc
y of
allo
wed
exc
eede
nce.
Bec
ause
304
(a) a
quat
ic li
fe c
riter
ia a
re n
atio
nal g
uida
nce,
they
are
inte
nded
to b
e pr
otec
tive
of th
e va
st m
ajor
ity o
f the
aq
uatic
com
mun
ities
in th
e U
nite
d St
ates
.
This
com
pila
tion
lists
all
prio
rity
toxi
c po
lluta
nts a
nd so
me
non
prio
rity
toxi
c po
lluta
nts,
and
both
hum
an h
ealth
eff
ect a
nd o
rgan
olep
tic e
ffec
t crit
eria
is
sued
pur
suan
t to
CW
A §
304(
a).
Bla
nk sp
aces
indi
cate
that
EPA
has
no
CW
A §
304(
a) c
riter
ia re
com
men
datio
ns.
For a
num
ber o
f non
-prio
rity
toxi
c po
lluta
nts n
ot
liste
d, C
WA
§30
4(a)
“w
ater
+ o
rgan
ism
” hu
man
hea
lth c
riter
ia a
re n
ot a
vaila
ble,
but
, EPA
has
pub
lishe
d M
CLs
und
er th
e SD
WA
that
may
be
used
in e
stab
lishi
ng
wat
er q
ualit
y st
anda
rds t
o pr
otec
t wat
er su
pply
des
igna
ted
uses
. B
ecau
se o
f var
iatio
ns in
che
mic
al n
omen
clat
ure
syst
ems,
this
list
ing
of to
xic
pollu
tant
s doe
s not
du
plic
ate
the
listin
g in
App
endi
x A
of 4
0 C
FR P
art 4
23.
Als
o lis
ted
are
the
Che
mic
al A
bstra
cts S
ervi
ce C
AS
regi
stry
num
bers
, whi
ch p
rovi
de a
uni
que
iden
tific
atio
n fo
r eac
h ch
emic
al.
The
Crit
eria
Max
imum
Con
cent
ratio
n (C
MC
) is a
n es
timat
e of
the
high
est c
once
ntra
tion
of a
mat
eria
l in
surf
ace
wat
er to
whi
ch a
n aq
uatic
com
mun
ity c
an
The
hum
an h
ealth
crit
eria
for t
he p
riorit
y an
d no
n pr
iorit
y po
lluta
nts a
re b
ased
on
carc
inog
enic
ity o
f 10
-6 ri
sk.
Alte
rnat
e ris
k le
vels
may
be
obta
ined
by
mov
ing
the
deci
mal
poi
nt (e
.g.,
for a
risk
leve
l of 1
0 -5
, m
ove
the
deci
mal
poi
nt in
the
reco
mm
ende
d cr
iterio
n on
e pl
ace
to th
e rig
ht).
Bec
ause
of v
aria
tions
in c
hem
ical
nom
encl
atur
e sy
stem
s, th
is li
stin
g of
pol
luta
nts d
oes
not d
uplic
ate
the
listin
g in
App
endi
x A
of 4
0 C
FR P
art 4
23.
Als
o lis
ted
are
the
Che
mic
al A
bstra
cts S
ervi
ce (C
AS)
regi
stry
num
bers
, whi
ch p
rovi
de a
un
ique
iden
tific
atio
n fo
r eac
h ch
emic
al. NA
TIO
NA
L R
EC
OM
ME
ND
ED
WA
TE
R Q
UA
LIT
Y C
RIT
ER
IA
FR C
ite/S
ourc
e
NA
TIO
NA
L R
EC
OM
ME
ND
ED
WA
TE
R Q
UA
LIT
Y C
RIT
ER
IA F
OR
OR
GA
NO
LE
PTIC
EFF
EC
TS
45FR
7934
1
Gol
d B
ook
Gol
d B
ook
Org
anol
eptic
Eff
ect C
riter
ia
CA
S N
umbe
r
Cri
teri
a R
ecom
men
datio
ns fo
r Pr
iori
ty P
ollu
tant
s, N
on P
rior
ity P
ollu
tant
s and
Org
anol
eptic
Eff
ects
(:g/
L)
5000
30
300
Cri
teri
a M
axim
um C
once
ntra
tion
and
Cri
teri
on C
ontin
uous
Con
cent
ratio
n
Thes
e cr
iteria
are
bas
ed o
n or
gano
lept
ic (t
aste
and
odo
r) e
ffec
ts.
7440
666
8786
5
1089
52
Hum
an H
ealth
Ris
k
Pollu
tant
Pent
achl
orop
heno
l
Add
ition
al N
otes
:
Gen
eral
Not
es:
Phen
ol
Zinc
21
22
23
1.
1.
2.
3.
D-16

The
com
pila
tion
cont
ains
304
(a) c
riter
ia fo
r pol
luta
nts w
ith to
xici
ty-b
ased
crit
eria
as w
ell a
s non
-toxi
city
bas
ed c
riter
ia.
The
basi
s for
the
non-
toxi
city
bas
ed
crite
ria a
re o
rgan
olep
tic e
ffec
ts (e
.g.,
tast
e an
d od
or) w
hich
wou
ld m
ake
wat
er a
nd e
dibl
e aq
uatic
life
unp
alat
able
but
not
toxi
c to
hum
ans.
The
tabl
e in
clud
es c
riter
ia
for o
rgan
olep
tic e
ffec
ts fo
r 23
pollu
tant
s. Po
lluta
nts w
ith o
rgan
olep
tic e
ffec
t crit
eria
mor
e st
ringe
nt th
an th
e cr
iteria
bas
ed o
n to
xici
ty (e
.g.,
incl
uded
in b
oth
the
prio
rity
and
non-
prio
rity
pollu
tant
tabl
es) a
re fo
otno
ted
as su
ch.
The
Che
mic
al A
bstra
ct S
ervi
ces n
umbe
r (C
AS)
for B
is(2
-Chl
oroi
sopr
opyl
) Eth
er, h
as b
een
corr
ecte
d in
the
tabl
e. T
he c
orre
ct C
AS
num
ber f
or th
is c
hem
ical
is
3963
8-32
-9.
Prev
ious
pub
licat
ions
list
ed 1
08-6
0-1
as th
e C
AS
num
ber f
or th
is c
hem
ical
.
In th
e 19
80 S
elen
ium
doc
umen
t, a
crite
rion
for t
he p
rote
ctio
n of
hum
an h
ealth
from
con
sum
ptio
n of
wat
er a
nd o
rgan
ism
s was
cal
cula
ted
base
d on
a B
CF
of 6
.0
L/kg
and
a m
axim
um w
ater
-rel
ated
con
tribu
tion
of 3
5 m
g Se
/day
. Su
bseq
uent
ly, t
he E
PA O
ffic
e of
Hea
lth a
nd E
nviro
nmen
tal A
sses
smen
t iss
ued
an e
rrat
a no
tice
(Feb
ruar
y 23
, 198
2), r
evis
ing
the
BC
F fo
r sel
eniu
m to
4.8
L/k
g. I
n 19
88, E
PA is
sued
an
adde
ndum
(EC
AO
-CIN
-668
) rev
isin
g th
e hu
man
hea
lth c
riter
ia fo
r se
leni
um.
Late
r in
the
final
Nat
iona
l Tox
ic R
ule
(NTR
, 57
FR 6
0848
), EP
A w
ithdr
ew p
revi
ousl
y pu
blis
hed
sele
nium
hum
an h
ealth
crit
eria
, pen
ding
Age
ncy
revi
ew
of n
ew e
pide
mio
logi
cal d
ata.
The
304(
a) c
riter
ia fo
r met
als,
show
n as
dis
solv
ed m
etal
s, ar
e ca
lcul
ated
in o
ne o
f tw
o w
ays.
For f
resh
wat
er m
etal
s crit
eria
that
are
har
dnes
s-de
pend
ent,
the
diss
olve
d m
etal
crit
eria
wer
e ca
lcul
ated
usi
ng a
har
dnes
s of 1
00 m
g/L
as C
aCO
3 fo
r illu
stra
tive
purp
oses
onl
y. S
altw
ater
and
fres
hwat
er m
etal
s’ c
riter
ia th
at a
re n
ot
hard
ness
-dep
ende
nt a
re c
alcu
late
d by
mul
tiply
ing
the
tota
l rec
over
able
crit
eria
bef
ore
roun
ding
by
the
appr
opria
te c
onve
rsio
n fa
ctor
s. Th
e fin
al d
isso
lved
met
als’
cr
iteria
in th
e ta
ble
are
roun
ded
to tw
o si
gnifi
cant
figu
res.
Info
rmat
ion
rega
rdin
g th
e ca
lcul
atio
n of
har
dnes
s dep
ende
nt c
onve
rsio
n fa
ctor
s are
incl
uded
in th
e fo
otno
tes.
The
com
pila
tion
incl
udes
foot
note
s for
pol
luta
nts w
ith M
axim
um C
onta
min
ant L
evel
s (M
CLs
) mor
e st
ringe
nt th
an th
e re
com
men
ded
wat
er q
ualit
y cr
iteria
in
the
com
pila
tion.
MC
Ls fo
r the
se p
ollu
tant
s are
not
incl
uded
in th
e co
mpi
latio
n, b
ut c
an b
e fo
und
in th
e ap
prop
riate
drin
king
wat
er re
gula
tions
(40
CFR
141
.11-
16
Man
y of
the
valu
es in
the
com
pila
tion
wer
e pu
blis
hed
in th
e pr
opos
ed C
alifo
rnia
Tox
ics R
ule
(CTR
, 62F
R42
160)
. A
lthou
gh su
ch v
alue
s wer
e pu
blis
hed
purs
uant
to S
ectio
n 30
3(c)
of t
he C
WA
, the
y re
pres
ent t
he A
genc
y’s m
ost r
ecen
t cal
cula
tion
of w
ater
qua
lity
crite
ria a
nd th
us a
re p
ublis
hed
toda
y as
the
Age
ncy’
s 30
4(a)
crit
eria
. W
ater
qua
lity
crite
ria p
ublis
hed
in th
e pr
opos
ed C
TR m
ay b
e re
vise
d w
hen
EPA
take
s fin
al a
ctio
n on
the
CTR
.
In th
e 19
80 c
riter
ia d
ocum
ents
, cer
tain
reco
mm
ende
d w
ater
qua
lity
crite
ria w
ere
publ
ishe
d fo
r cat
egor
ies o
f pol
luta
nts r
athe
r tha
n fo
r ind
ivid
ual p
ollu
tant
s w
ithin
that
cat
egor
y. S
ubse
quen
tly, i
n a
serie
s of s
epar
ate
actio
ns, t
he A
genc
y de
rived
crit
eria
for s
peci
fic p
ollu
tant
s with
in a
cat
egor
y. T
here
fore
, in
this
co
mpi
latio
n EP
A is
repl
acin
g cr
iteria
repr
esen
ting
cate
gorie
s with
indi
vidu
al p
ollu
tant
crit
eria
(e.g
., 1,
3-di
chlo
robe
nzen
e, 1
,4-d
ichl
orob
enze
ne a
nd
1,2-
dich
loro
benz
ene)
.
and
141.
60-6
3), o
r can
be
acce
ssed
thro
ugh
the
Safe
Drin
king
Wat
er H
otlin
e (8
00-4
26-4
791)
or t
he In
tern
et (h
ttp://
ww
w.e
pa.g
ov/o
st/to
ols/
dwst
ds-s
.htm
l).
Wat
er Q
ualit
y C
rite
ria
publ
ishe
d pu
rsua
nt to
Sec
tion
304(
a) o
r Se
ctio
n 30
3(c)
of t
he C
WA
Cor
rect
ion
of C
hem
ical
Abs
trac
t Ser
vice
s Num
ber
Cal
cula
tion
of D
isso
lved
Met
als C
rite
ria
Max
imum
Con
tam
inan
t Lev
els
Spec
ific
Che
mic
al C
alcu
latio
ns
Hum
an H
ealth
Org
anol
eptic
Eff
ects
Cat
egor
y C
rite
ria
Sele
nium
(1
) A
.
9.
10.
4.
5.
6.
7.
8.
D-17

This
com
pila
tion
incl
udes
hum
an h
ealth
crit
eria
for s
elen
ium
, cal
cula
ted
usin
g a
BC
F of
4.8
L/k
g al
ong
with
the
curr
ent I
RIS
RfD
of 0
.005
mg/
kg/d
ay.
EPA
in
clud
ed th
ese
reco
mm
ende
d w
ater
qua
lity
crite
ria in
the
com
pila
tion
beca
use
the
data
nec
essa
ry fo
r cal
cula
ting
a cr
iteria
in a
ccor
danc
e w
ith E
PA’s
198
0 hu
man
he
alth
met
hodo
logy
are
ava
ilabl
e.
Aqu
atic
Life
(2)
This
com
pila
tion
cont
ains
aqu
atic
life
crit
eria
for s
elen
ium
that
are
the
sam
e as
thos
e pu
blis
hed
in th
e pr
opos
ed C
TR.
In th
e C
TR, E
PA p
ropo
sed
an a
cute
cr
iterio
n fo
r sel
eniu
m b
ased
on
the
crite
rion
prop
osed
for s
elen
ium
in th
e W
ater
Qua
lity
Gui
danc
e fo
r the
Gre
at L
akes
Sys
tem
(61
FR 5
8444
). Th
e G
LI a
nd C
TR
prop
osal
s tak
e in
to a
ccou
nt d
ata
show
ing
that
sele
nium
’s tw
o m
ost p
reva
lent
oxi
datio
n st
ates
, sel
enite
and
sele
nate
, pre
sent
diff
erin
g po
tent
ials
for a
quat
ic to
xici
ty,
as w
ell a
s new
dat
a in
dica
ting
that
var
ious
form
s of s
elen
ium
are
add
itive
. Th
e ne
w a
ppro
ach
prod
uces
a d
iffer
ent s
elen
ium
acu
te c
riter
ion
conc
entra
tion,
or C
MC
, de
pend
ing
upon
the
rela
tive
prop
ortio
ns o
f sel
enite
, sel
enat
e, a
nd o
ther
form
s of s
elen
ium
that
are
pre
sent
. EP
A n
otes
it is
cur
rent
ly u
nder
taki
ng a
reas
sess
men
t of s
elen
ium
, and
exp
ects
the
304(
a) c
riter
ia fo
r sel
eniu
m w
ill b
e re
vise
d ba
sed
on th
e fin
al re
asse
ssm
ent
(63F
R26
186)
. H
owev
er, u
ntil
such
tim
e as
revi
sed
wat
er q
ualit
y cr
iteria
for s
elen
ium
are
pub
lishe
d by
the
Age
ncy,
the
reco
mm
ende
d w
ater
qua
lity
crite
ria in
this
co
mpi
latio
n ar
e EP
A’s
cur
rent
304
(a) c
riter
ia.
1,2,
4-T
rich
loro
benz
ene
and
Zin
cB
. H
uman
hea
lth c
riter
ia fo
r 1,2
,4-tr
ichl
orob
enze
ne a
nd z
inc
have
not
bee
n pr
evio
usly
pub
lishe
d. S
uffic
ient
info
rmat
ion
is n
ow a
vaila
ble
for c
alcu
latin
g w
ater
qu
ality
crit
eria
for t
he p
rote
ctio
n of
hum
an h
ealth
from
the
cons
umpt
ion
of a
quat
ic o
rgan
ism
s and
the
cons
umpt
ion
of a
quat
ic o
rgan
ism
s and
wat
er fo
r bot
h th
ese
com
poun
ds.
Ther
efor
e, E
PA is
pub
lishi
ng c
riter
ia fo
r the
se p
ollu
tant
s in
this
com
pila
tion.
Chr
omiu
m (I
II)
C.
The
reco
mm
ende
d aq
uatic
life
wat
er q
ualit
y cr
iteria
for c
hrom
ium
(III
) inc
lude
d in
the
com
pila
tion
are
base
d on
the
valu
es p
rese
nted
in th
e do
cum
ent t
itled
: 19
95 U
pdat
es: W
ater
Qua
lity
Cri
teri
a D
ocum
ents
for t
he P
rote
ctio
n of
Aqu
atic
Life
in A
mbi
ent W
ater
, how
ever
, thi
s doc
umen
t con
tain
s crit
eria
bas
ed o
n th
e to
tal
reco
vera
ble
frac
tion.
The
chr
omiu
m (I
II) c
riter
ia in
this
com
pila
tion
wer
e ca
lcul
ated
by
appl
ying
the
conv
ersi
on fa
ctor
s use
d in
the
Fina
l Wat
er Q
ualit
y G
uida
nce
for t
he G
reat
Lak
es S
yste
m (6
0 FR
153
66) t
o th
e 19
95 U
pdat
e do
cum
ent v
alue
s.
Eth
er, B
is (C
hlor
omet
hyl),
Pen
tach
loro
benz
ene,
Tet
rach
loro
benz
ene
1,2,
4,5-
, Tri
chlo
rphe
nol
D.
Hum
an h
ealth
crit
eria
for t
hese
pol
luta
nts w
ere
last
pub
lishe
d in
EPA
’s Q
ualit
y C
riter
ia fo
r Wat
er 1
986
or “
Gol
d B
ook”
. So
me
of th
ese
crite
ria w
ere
calc
ulat
ed
usin
g A
ccep
tabl
e D
aily
Inta
ke (A
DIs
) rat
her t
han
RfD
s. U
pdat
ed q
1*s a
nd R
fDs a
re n
ow a
vaila
ble
in IR
IS fo
r eth
er, b
is (c
hlor
omet
hyl),
pen
tach
loro
benz
ene,
te
trach
loro
benz
ene
1,2,
4,5-
, and
tric
hlor
ophe
nol,
and
wer
e us
ed to
revi
se th
e w
ater
qua
lity
crite
ria fo
r the
se c
ompo
unds
. Th
e re
com
men
ded
wat
er q
ualit
y cr
iteria
for
ethe
r, bi
s (ch
loro
met
hyl)
wer
e re
vise
d us
ing
an u
pdat
ed q
1*, w
hile
crit
eria
for p
enta
chlo
robe
nzen
e, a
nd te
trach
loro
benz
ene
1,2,
4,5-
, and
tric
hlor
ophe
nol w
ere
deriv
ed u
sing
an
upda
ted
RfD
val
ue.
PCB
sE
. Th
ese
crite
ria re
plac
e th
eIn
this
com
pila
tion
EPA
is p
ublis
hing
aqu
atic
life
and
hum
an h
ealth
crit
eria
bas
ed o
n to
tal P
CB
s rat
her t
han
indi
vidu
al a
roch
lors
. pr
evio
us c
riter
ia fo
r the
seve
n in
divi
dual
aro
chlo
rs.
Thus
, the
re a
re c
riter
ia fo
r a to
tal o
f 102
of t
he 1
26 p
riorit
y po
lluta
nts.
D-18

----
---- --
--
Con
vers
ion
Fact
ors f
or D
isso
lved
Met
als
Met
al
Con
vers
ion
Fact
or
fres
hwat
er C
MC
C
onve
rsio
n Fa
ctor
fr
eshw
ater
CC
C
Con
vers
ion
Fact
or
saltw
ater
CM
C
Con
vers
ion
Fact
or
saltw
ater
CC
C1
Ars
enic
1.
000
1.00
0 1.
000
1.00
0
Cad
miu
m
1.13
6672
-[(ln
ha
rdne
ss)(
0.04
1838
)]
1.10
1672
-[(ln
ha
rdne
ss)(
0.04
1838
)]
0.99
4 0.
994
Chr
omiu
m II
I 0.
316
0.86
0
Chr
omiu
m V
I 0.
982
0.96
2 0.
993
0.99
3
Cop
per
0.96
0 0.
960
0.83
0.
83
Lead
1.
4620
3-[(
ln
hard
ness
)(0.
1457
12)]
1.
4620
3-[(
ln
hard
ness
)(0.
1457
12)]
0.
951
0.95
1
Mer
cury
0.
85
0.85
0.
85
0.85
Nic
kel
0.99
8 0.
997
0.99
0 0.
990
Sele
nium
0.
998
0.99
8
Silv
er
0.85
0.
85
Zinc
0.
978
0.98
6 0.
946
0.94
6
D-19

----
--
Par
amet
ers*
for
Cal
cula
ting
Fres
hwat
er D
isso
lved
Met
als C
rite
ria
Tha
t Are
Har
dnes
s-D
epen
dent
Che
mic
al
mA
b A
m
C
b C
Fres
hwat
er C
onve
rsio
n Fa
ctor
s (C
F)
Acu
te
Chr
onic
C
adm
ium
1.
128
-3.6
867
0.78
52
-2.7
15
1.13
6672
-[ln
(h
ardn
ess)
(0.0
4183
8)]
1.10
1672
-[ln
(h
ardn
ess)
(0.0
4183
8)]
Chr
omiu
m II
I 0.
8190
3.
7256
0.
8190
0.
6848
0.
316
0.86
0 C
oppe
r 0.
9422
-1
.700
0.
8545
-1
.702
0.
960
0.96
0 Le
ad
1.27
3 -1
.460
1.
273
-4.7
05
1.46
203-
[ln
(har
dnes
s)(0
.145
712)
] 1.
4620
3-[ln
(h
ardn
ess)
(0.1
4571
2)]
Nic
kel
0.84
60
2.25
5 0.
8460
0.
0584
0.
998
0.99
7 Si
lver
1.
72
-6.5
2 0.
85
Zinc
0.
8473
0.
884
0.84
73
0.88
4 0.
978
0.98
6
*
Whe
re m
A a
nd b
A a
re c
onve
rsio
n fa
ctor
s to
cal
cula
te C
MC
and
mC a
nd b
C ar
e co
nver
sion
fact
ors n
eces
sary
to c
alcu
late
CC
C
D-20

Appendix C - Calculation of Freshwater Ammonia Criterion
1. The one-hour average concentration of total ammonia nitrogen (in mg N/L) does not exceed, more than once every three years on the average, the CMC calculated using the following equation:
0.275 39.0CMC =
1 107.204− pH + 1 10pH − 7.204+ +
In situations where salmonids do not occur, the CMC may be calculated using the following equation:
0.411 58.4CMC =
1 107.204− pH + 1 10pH − 7.204+ +
2. The thirty-day average concentration of total ammonia nitrogen (in mg N/L) does not exceed, more than once every three years on the average, the CCC calculated using the following equation:
0.0858 3.70CCC =
1 107.688− pH + 1 10pH − 7.688+ +
and the highest four-day average within the 30-day period does not exceed twice the CCC.
Source: U.S. EPA’s National Recommended Water Quality Criteria-Correction, EPA-822-Z-99-001, April 1999, pp. 7-25; http://www.epa.gov/OST/standards/wqcriteria.html
D-21

This page intentionally left blank.
D-22

APPENDIX E -FEDERAL SEWAGE SLUDGE STANDARDS
Pollu
tant
C
eilin
g C
once
ntra
tion*
M
onth
ly A
vera
ge P
ollu
tant
C
once
ntra
tion*
C
umul
ativ
e Po
lluta
nt
Load
ing
Rat
es*
Ann
ual P
ollu
tant
Loa
ding
Rat
e*
(Tab
le 1
, 40
CFR
503
.13)
(T
able
3, 4
0 C
FR 5
03.1
3)
(Tab
le 2
, 40
CFR
503
.13)
(T
able
4, 4
0 C
FR 5
03.1
3)
mg/
kg
lbs/
1000
lbs
mg/
kg
lbs/
1000
lbs
kg/h
ecta
re
lbs/
acre
**
kg/h
ecta
re/
365-
day
perio
d lb
s/ac
re/
365-
day
perio
d**
Ars
enic
75
75
41
41
41
37
2
1.8
Cad
miu
m
85
85
39
39
39
35
1.9
1.7
Cop
per
4,30
0 4,
300
1,50
0 1,
500
1,50
0 1,
338
75
67
Lead
84
0 84
0 30
0 30
0 30
0 26
8 15
13
Mer
cury
57
57
17
17
17
15
0.
85
0.76
Mol
ybde
num
75
75
-
--
--
-
Nic
kel
420
420
420
420
420
375
21
19
Sele
nium
10
0 10
0 10
0 10
0 10
0 89
5
4.5
Zinc
7,
500
7,50
0 2,
800
2,80
0 2,
800
2,49
8 14
0 12
5
Bio
solid
s La
nd A
pplic
atio
n Li
mita
tions
* **
Cal
cula
ted
usin
g m
etric
stan
dard
s spe
cifie
d in
40
CFR
503
.13
mul
tiplie
d by
the
conv
ersi
on fa
ctor
of 0
.892
2.
Dry
wei
ght.
Sour
ce:
40 C
FR §
503.
13, T
able
s 1-4
, Oct
ober
25,
199
5
E-1

Surface Disposal
Distance from the Boundary of Active Biosolids Unit to Surface Disposal Site Property Line (meters)
Pollutant Concentration*
Arsenic (mg/kg)
Chromium (mg/kg)
Nickel (mg/kg)
0 to less than 25 30 200 210
25 to less than 50 34 220 240
50 to less than 75 39 260 270
75 to less than 100 46 300 320
100 to less than 125 53 360 390
125 to less than 150 62 450 420
Equal to or greater than 150 73 600 420
* Dry-weight.
Source: 40 CFR Part 503.23 Table 1 and 2.
Conversion Factors
pounds per acre (lbs/ac) x 1.121 = kilograms per hectare (kg/ha)
kilograms per hectare (kg/ha) x 0.8922 = pounds per acre (lbs/ac)
pound (lb) = 0.4536 kilogram (kg)
kilogram (kg) = 2.205 pounds (lbs)
English ton = 0.9072 metric tonne
metric tonne = 1.102 English ton
E-2

APPENDIX F -TOXICITY CHARACTERISTIC LEACHATE PROCEDURE
LIMITATIONS
EPA Hazardous Waste No. Contaminant CAS No. 1 Regulatory Level (mg/L)
D004 Arsenic 7440–38–2 5.0 D005 Barium 7440–39–3 100.0 D018 Benzene 71–43–2 0.5 D006 Cadmium 7440–43–9 1.0 D019 Carbon tetrachloride 56–23–5 0.5 D020 Chlordane 57–74–9 0.03 D021 Chlorobenzene 108–90–7 100.0 D022 Chloroform 67–66–3 6.0 D007 Chromium 7440–47–3 5.0 D024 o-Cresol 95-48-7 200.0 2
D024 m-Cresol 108–39–4 200.0 2
D025 p-Cresol 106–44–5 200.0 2
D026 Cresols 200.0 2
D016 2,4-D 94–75–7 10.0 D027 1,4-Dichlorobenzene 106–46–7 7.5 D028 1,2-Dichloroethane 107–06–2 0.5 D029 1,1-Dichloroethylene 75–35–4 0.7 D030 2,4-Dinitrotoluene 121–14–2 0.13 3
D012 Endrin 72–20–8 0.02 D031 Heptachlor (and its
epoxide) 76–44–8 0.008
D032 Hexachlorobenzene 118–74–1 0.13 3
D033 Hexachlorobutadiene 87–68–3 0.5 D034 Hexachloroethane 67–72–1 3.0 D008 Lead 7439–92–1 5.0 D013 Lindane 58–89–9 0.4 D009 Mercury 7439–97–6 0.2 D014 Methoxychlor 72–43–5 10.0 D035 Methyl ethyl ketone 78–93–3 200.0
D036 Nitrobenzene 98–95–3 2.0 D037 Pentachlorophenol 87–86–5 100.0 D038 ridine 110–86–1 5.0 3
D010 Selenium 7782–49–2 1.0 D011 Silver 7440–22–4 5.0 D039 Tetrachloroethylene 127–18–4 0.7 D015 Toxaphene 8001–35–2 0.5 D040 Trichloroethylene 79–01–6 0.5
Py
F-1

EPA Hazardous Waste No. Contaminant CAS No. 1 Regulatory Level (mg/L)
D041 2,4,5-Trichlorophenol 95–95–4 400.0 D042 2,4,6-Trichlorophenol 88–06–2 2.0 D017 2,4,5-TP (Silvex) 93–72–1 D043 Vinyl chloride 75–01–4
1.0 0.2
1 Chemical Abstracts Service number.
2 If o-, m-, and p-Cresol concentrations cannot be differentiated, the total cresol (D026) concentration is used. The regulatory level of total cresol is 200 mg/L.
3 Quantitation limit is greater than the calculated regulatory level. The quantitation limit therefore becomes the regulatory level.
Source: 40 CFR 261.24
F-2

APPENDIX G -LITERATURE INHIBITION VALUES
Pollutant Reported Range of Activated Sludge
Inhibition Threshold Levels, mg/L
References*
METALS/NONMETAL INORGANICS Ammonia 480 (4) Arsenic 0.1 (1), (2), (3) Cadmium 1 - 10 (2), (3) Chromium (VI) 1 (2), (3) Chromium (III) 10 - 50 (2), (3) Chromium (Total) 1 - 100 (1) Copper 1 (2), (1), (3) Cyanide 0.1 - 5
5 (1), (2), (3)
(1) Iodine 10 (4) Lead 1.0 - 5.0
10 - 100 (3) (1)
Mercury 0.1 - 1 2.5 as
(2), (3) (1)
Nickel 1.0 - 2.5 5
(2), (3) (1)
Sulfide 25 -30 (4) Zinc 0.3 - 5
5 - 10 (3) (1)
Hg (II)
ORGANICS Anthracene 500 (1) Benzene 100 - 500
125 - 500 (3) (1)
2-Chlorophenol 5 20 - 200
(2) (3)
1,2 Dichlorobenzene 5 (2) 1,3 Dichlorobenzene 5 (2) 1,4 Dichlorobenzene 5 (2)
2,4-Dichlorophenol 64 (3) 2,4 Dimethylphenol 40 - (3) 2,4 Dinitrotoluene 5 (2) 1,2-Diphenylhydrazine 5 (2) Ethylbenzene 200 (3) Hexachlorobenzene 5 (2) Naphthalene 500
500 500
(1) (2) (3)
Nitrobenzene 30 - 500 500 500
(3) (1) (2)
200
G-1

Reported Range of Activated Sludge Pollutant Inhibition Threshold References*
Levels, mg/L
Pentachlorophenol 0.95 (2) 50 (3)
75 - 150 (1) 500 (1) 500 (2)
50 - 200 (3) 200 (2) 200 (1) 200 (3)
50 - 100 (1) Surfactants 100 - 500 (4)
Phenanthrene
Phenol
Toluene 2,4,6 Trichlorophenol
Pollutant Reported Range of Trickling Filter References*Inhibition Threshold Levels, mg/L
Chromium (III) 3.5 - 67.6 (1) Cyanide 30 (1)
Pollutant Reported Range of Nitrification Inhibition Threshold Levels, mg/L References*
METALS/NONMETAL INORGANICS Arsenic 1.5 (2) Cadmium 5.2 (1), (2) Chloride 180 (4) Chromium (VI) 1 - 10 [as (CrO4 )2-] (1) Chromium (T) 0.25 - 1.9
1 - 100 (trickling filter)
(1), (2), (3) (1)
Copper 0.05 - 0.48 (2), (3) Cyanide 0.34 - 0.5 (2), (3) Lead 0.5 (2), (3) Nickel 0.25 - 0.5
5 (2), (3)
(1) Zinc 0.08 - 0.5 (2), (3)
ORGANICS Chloroform 10 (2) 2,4-Dichlorophenol 64 (3) 2,4-Dinitrophenol 150 (2) Phenol 4
4 - 10 (2) (3)
G-2

Pollutant Reported Range of Anaerobic Digestion Inhibition Threshold
Levels, mg/L References*
METALS/NONMETAL INORGANICS Ammonia 1500 - 8000 (4) Arsenic 1.6 (1) Cadmium 20 (3) Chromium (III) 130 (3) Chromium (VI) 110 (3) Copper 40 (3) Cyanide 4 - 100
1 - 4 (1)
(2), (3) Lead 340 (3) Nickel 10
136 (2), (3)
(1) Silver 13 - 65** (3) Sulfate 500 - 1000 (4) Sulfide 50 - 100 (4) Zinc 400 (3)
ORGANICS Acrylonitrile 5
5 (3) (2)
Carbon Tetrachloride 2.9 - 159.4 10 - 20
2.0
(1) (3) (2)
Chlorobenzene 0.96 - 3 0.96
(1) (2)
Chloroform 1 5 - 16
10 - 16
(2) (1) (3)
1,2-Dichlorobenzene 0.23 - 3.8 0.23
(1) (2)
1,4-Dichlorobenzene 1.4 - 5.3 1.4
(1) (2)
Methyl chloride 3.3 - 536.4 100
(1) (2)
Pentachlorophenol 0.2 0.2 -
(2) (1)
Tetrachloroethylene 20 (2) Trichloroethylene 1 - 20
20 20
(1) (2) (3)
Trichlorofluoromethane - (2)
1.8
* Total pollutant inhibition levels, unless otherwise indicated.** Dissolved metal inhibition levels.
(1) Jenkins, D.I., and Associates. 1984. Impact of Toxics on Treatment Literature Review.
G-3

(2) Russell, L. L., C. B. Cain, and D.I. Jenkins. 1984. Impacts of Priority Pollutants on Publicly Owned Treated Works Processes: A Literature Review. 1984 Purdue Industrial Waste Conference.
(3) Anthony, R. M., and L. H. Briemburst. 1981. Determining Maximum Influent Concentrations of Priority Pollutants for Treatment Plants. Journal Water Pollution Control Federation 53(10):1457-1468.
(4) U.S. EPA. 1986, Working Document; Interferences at Publicly Owned Treatment Works. September 1986.
Source: EPA’s Guidance Manual on the Development and Implementation of Local Discharge Limitations Under the Pretreatment Program, December 1987, pp. 3-44 to 3-49.
G-4

APPENDIX H -CLOSED-CUP FLASHPOINTS FOR SELECT ORGANIC COMPOUNDS
Pollutant Closed Cup Flashpoint (/F)
Acrolein -15 Acrylonitrile 30 Benzene 12 Chlorobenzene 82 Chloroethane (Ethyl chloride) -58 1,1-Dichloroethane 2 1,2-Dichloroethane (Ethylene dichloride) 56 1,1-Dichloroethylene (Vinylidene chloride) -2 Trans-1,2-Dichloroethylene, (1,2-Dichloroethylene) 36-39 1,2-Dichloropropane (Propylene dichloride) 60 Ethylbenzene 55 Toluene 40
Source: Online NIOSH Pocket Guide to Chemical Hazards at http://www.cdc.gov/niosh/npg/npg.html.
H-1

This page intentionally left blank.
H-2

APPENDIX I -DISCHARGE SCREENING LEVELS AND HENRY’S LAW CONSTANTS
FOR ORGANIC COMPOUNDS
Discharge Screening Levels Based on Explosivity
Pollutant LELs(1) % volume /
volume
LELs (mol/m3)
Acrolein 2.8 1.15 Acrylonitrile Benzene Chlorobenzene 1.3 Chloroethane 3.8 1,1-Dichloroethane 5.4 1,2-Dichloroethane 6.2 1,1-Dichloroethylene 6.5 Trans-1,2-Dichloroethylene 5.6 1,2-Dichloropropane 3.4 Ethyl benzene 0.8 Hydrogen Cyanide 5.6 Hydrogen Sulfide 4.0 Methyl bromide 10.0 Methyl chloride 8.1 Methylene Chloride 13.0 Toluene 1.1 1,1,2-Trichloroethane 6.0 1,1,1-Trichloroethane 7.5
3.0 1.2
Trichloroethylene 8.0 (F) Vinyl Chloride 3.6
1.23 0.49 0.53 1.55 2.21 2.54 2.66 2.29 1.39 0.33 2.30 1.64 4.09 3.31 5.32 0.45 2.45 3.07 3.20 1.47
Henry's Law Constant
(mol/m3)/(mg/L)
8.7E-05 8.4E-05 2.9E-03 1.3E-03 7.0E-03 2.4E-03 4.9E-04 1.2E-02 4.0E-03 1.0E-03 3.1E-03 1.7E-4 1.7E-2
2.7E-03 7.4E-03 1.2E-03 3.0E-03 2.6E-04 5.2E-03 3.1E-03 1.7E-02
MW (g/mol)
Discharge Screening
Level (mg/L)
56.1 13163 53.1 14586 78.1 169
112.6 395 65.5 222
99 909 99 5221 97 215 97 571
113 1326 106.2 106
27 13529 34 96 95 1521
50.5 450 84.9 4307 92.1 152
133.4 9611 133.4 591 131.4 1029 62.5 88
Lower Explosive Limits (LELs) assumed for 25°C unless noted otherwise. MW = molecular weight
Source: Updated in 2002 via the online NIOSH Pocket Guide to Chemical Hazards at http://www.cdc.gov/niosh/npg/npg.html
I-1

Discharge Screening Levels Based upon Fume Toxicity
Pollutant Exposure
Limit* (mg/m3)
Henry's Law
Constant (mg/m3/ mg/L)
Discharge Screening
Level (mg/L)
Acrolein 0.23 4.9 0.047 Acrylonitrile 21.70 4.5 4.822 Benzene 228.0 0.014 Bromoform 5.17 22.8 0.227 Carbon Tetrachloride 12.58 1185.0 0.011 Chlorobenzene 345.75 151.0 2.290 Chloroethane 2,640.00 449.0 5.880 Chloroform 9.76 163.5 0.060 Dichloroethane, 1,1- 405.00 240.4 1.685 Dichloroethane,1,2- 8.10 48.1 0.168 Dichloroethylene, 1,1- 19.80 1202.1 0.016 Trans-Dichloroethylene,1,2- 794.00 389.3 2.040 Dichloropropane,1,2 20 118.5 4.289 Ethyl benzene 542.50 327.0 1.659 Hydrogen Cyanide 5.17 4.5 1.149 Hydrogen Sulfide 14.00 414.4 0.034 Methyl bromide 77.80 255.5 0.305 Methyl chloride 207.00 371.6 0.557 Methylene Chloride 433.75 104.8 4.139 Tetrachlorethane, 1,1,2,2- 34.35 18.6 1.847 Tetrachloroethylene 678.00 717.1 0.945 Toluene 565.50 272.5 2.075 Trichloroethane, 1,1,2- 54.60 34.1 1.601 Trichloroethane, 1,1,1 1,911.00 692.7 2.759 Trichloroethylene 10.74 408.7 0.026 Vinyl Chloride 12.80 1048.0 0.012
3.19
508.
Source
TLV-STEL PEL-Ceiling, REL- Ceiling REL-STEL PEL-TWA, TLV-TWA, REL-TWA REL-STEL PEL-TWA PEL-TWA REL-STEL PEL-TWA, TLV-TWA, REL-TWA REL-STEL TLV-TWA PEL-TWA, TLV-TWA, REL-TWA TLV-STEL TLV-STEL, REL-STEL TLV-Ceiling, REL-STEL REL-Ceiling PEL-Ceiling TLV-STEL PEL-STEL PEL-TWA TLV-STEL REL-STEL PEL-TWA, TLV-TWA, REL-TWA REL-Ceiling REL-Ceiling PEL Ceiling
*Exposure limits are lowest of acute toxicity data (NIOSH REL-STEL, ACGIH TLV-STEL, OSHA PELSTEL, NIOSH REL-Ceiling, ACGIH TLV-Ceiling, OSHA PEL-Ceiling) converted from ppm to mg/m3
through conversion factor. If acute toxicity data were not available, the highest chronic exposure limit (NIOSH REL-TWA, ACGIH TLV-TWA, OSHA PEL-TWA) was used. See Appendix J of this manual for full list of acute and chronic exposure data.
Discharge Screening Level = Exposure Limit / Henry’s Law Constant.
I-2

Henry's Law Constants Expressed in Alternate Units
Pollutant Henry's Law Constant(2)
M/atm @ 298 K (25°C)
Henry's Law Constant
(atm m3 / mol)
Henry's Law Constant
(mol/m3 / mg/L)
Henry's Law Constant
(mg/m3 / mg/L)
Acrolein 8.2 0.00012 0.000087 4.9 Acrylonitrile 0.00011 0.000084 4.5 Benzene 0.0056 0.0029 228 Bromoform 0.00056 0.000091 23 Carbon Tetrachloride 0.029 0.0077 1185 Chlorobenzene 0.27 0.0037 0.0013 151 Chloroethane 0.089 0.011 0.007 449 Chloroform 0.25 0.004 0.00137 164 1,1-Dichloroethane 0.17 0.0059 0.0024 240 1,2-Dichloroethane 0.85 0.0012 0.00049 48 1,1-Dichloroethylene 0.034 0.029 0.012 1202 Trans-1,2-Dichloroethylene 0.105 0.0095 0.004 389 1,2-Dichloropropane 0.345 0.0029 0.001 119 Ethyl benzene 0.125 0.008 0.0031 327 Hydrogen Cyanide 9.3 0.00011 0.00017 4.5 Hydrogen Sulfide 0.1 0.01 0.017 414.4 Methyl bromide 0.16 0.0063 0.0027 256 Methyl chloride 0.11 0.0091 0.0074 372 Methylene Chloride 0.39 0.0026 0.0012 105 1,1,2,2,-Tetrachlorethane 2.2 0.00045 0.00011 19 Tetrachloroethylene 0.057 0.018 0.00432 717 Toluene 0.15 0.0067 0.003 273 1,1,2-Trichloroethane 1.2 0.00083 0.00026 34 1,1,1-Trichloroethane 0.059 0.017 0.0052 693 Trichloroethylene 0.1 0.01 0.0031 409 Vinyl Chloride 0.039 0.026 0.017 1048
9.15 0.18 1.8
0.034
Source: Compilation of Henry’s Law Constants for Inorganic and Organic Species of Potential Importance in Environmental Chemistry, R. Sanders 1999 (version 3).
H (atm m3/mol) = [986.9 * H (M/atm)]-1 H (mg/m3 / mg/L) = 40,893 * H(atm m3 / mol) H (mol/m3 mg/L) = H (mg/m3 / mg/L) / (1000 * MW) MW = molecular weight in grams per mole
I-3

This page intentionally left blank.
I-4

APPENDIX J -OSHA, ACGIH AND NIOSH EXPOSURE LEVELS
EXPOSURE LIMITS FROM VARIOUS AGENCIES FOR VOLATILE ORGANIC PRIORITY POLLUTANTS
OSHA Permissible Exposure Limits
ACGIH Threshold Limit Values
NIOSH Recommended
Exposure Limits
Volatile Organic Compounds
mg/m3
per ppm TWA ppm
STEL ppm
TVA ppm
STEL ppm
TWA ppm
STEL ppm
Acrolein 2.29 0.1 0.1 0.1 0.3 Acrylonitrile 2.17 2 C 10 2 1 C 10 Benzene 3.19 1 5 .5 2.5 0.1 1 Bromoform 10.34 0.5 0.5 Carbon Tetrachloride 6.29 10 C 25 5 10 2 Chlorobenzene 4.61 75 Chloroethane (Ethyl chloride) 2.64 1000
Chloroform 4.88 C 50 10 2 Dichloroethane, 1,1- 4.05 100 100 Dichloroethane,1,2-(Ethylene dichloride) 4.05 50 C 100 10 1 2
Dichloroethylene, 1,1-(Vinylidene chloride) 3.96 5
trans-Dichloroethylene,1,2-(1,2-Dichloroethylene)
3.97 200 200 200
Dichloropropane,1,2-(Propylene dichloride) 4.62 75 75 110
Ethyl benzene 4.34 100 100 100 125 Hydrogen Cyanide 1.10 10 C 4.7 4.7 Hydrogen Sulfide 1.40 C 20 10 15 C 10 Methyl bromide 3.89 C 20 1 Methyl chloride 2.07 100 C 200 50 100 Methylene Chloride (Dichloromethane) 3.47 25 125 50
Tetrachlorethane, 1,1,2,2- 6.87 5
Tetrachloroethylene (Perchloroethylene) 6.78 100 C 200 25 100
Toluene 3.77 200 C 300 50 100 150 Trichloroethane, 1,1,2- 5.46 10 10 Trichloroethane, 1,1,1 (Methyl Chloroform) 5.46 350 350 450 350
Trichloroethylene 5.37 100 C 200 50 100 25 C 2 Vinyl Chloride 2.56 1 5
C
0.5
10
100
100
125
1
10
C
C 5
J-1

Occupational Safety and Health Administration Permissible Exposure Limits (PELs) (29 CFR 1910.1000) PEL time-weighted average (TWA) concentrations must not be exceeded during any 8-hour workshift of a 40-hour workweek. PEL short-term exposure limit (STEL) must not be exceeded over a 15-minute period unless noted otherwise. PEL ceiling concentrations (designated by “C” preceding the value in the STEL column) must not be exceeded during any part of the workday; if instantaneous monitoring is not feasible, the ceiling must be assessed as a 15-minute TWA exposure. OSHA values were updated in 2002 via the online NIOSH Pocket Guide to Chemical Hazards. http://www.cdc.gov/niosh/npg/npg.html.
American Conference of Governmental Industrial Hygienists (ACGIH) Threshold Limit Values (TLVs) TLV Time-weighted average (TVA) concentrations are for a conventional 8-hour workday and a 40-hour workweek for which it is believed that nearly all workers may be repeatedly exposed, day after day, without adverse effect. TLV short-term exposure limit (STEL) concentrations are the 15-minute TWA exposure which should not be exceeded at any time during a workday even if the 8-hour TWA is within the TLV-TWA. TLV ceiling concentrations (designated by a “C” preceding the value in the STEL column) should not be exceeded during any part of the working exposure. ACGIH values found in the ACGIH 2002 TLVs and BEIs.
National Institute for Occupational Safety and Health (NIOSH) Recommended Exposure Limits (RELs) REL time-weighted average (TWA) concentrations must not be exceeded over a 10-hour workday during a 40-hour workweek. REL short-term exposure limits (STELs) are a 15-minute TWA exposure that should not be exceeded at any time during a workday. A ceiling REL, designated by “C” preceding the value in the STEL column, should not be exceeded at any time. NIIOSH values updated in 2003 via the online NIOSH Pocket Guide to Chemical Hazards at http://www.cdc.gov/niosh/npg/npg.html.
J-2

APPENDIX K -LANDFILL LEACHATE LOADINGS
Landfill Leachate Monitoring Data*
MaximumPollutant Minimum Concentration (mg/L)
Antimony
Arsenic
Barium
Cadmium
Chromium (T)CopperCyanide
Iron
Lead
Manganese
Mercury
NickelSelenium
SilverZinc
Acetone
Benzene
Benzoic Acid
Chlorobenzene
Chloroethane
p-chloro-m-Cresol1,4-Dichlorobenzene
1,1-Dichloroethane
1,2-Dichloroethane
Ethylbenzene
Methyl Butyl Ketone
Methyl Ethyl Ketone
4-MethylphenolNaphthalene
N-Nitrosodiphenylamine
PentachlorophenolPhenol
Concentration (mg/L)
INORGANICS 0.008 0.002 <0.1
< 0.001 0.007 0.007 0.04 1.5
0.005 0.63
< 0002 0.003 < 002 < 0.01 < 01
0.3 0.13 0.55 1.25 12.1
10.87 0.05 4500 9.8 73.2
0.002 12.09 0.02 0.05 58
ORGANICS 2.8
< 0.002 0.02
0.011 < 0.001 0.018
< 0.005 < 0.001 < 0.005 0.017 0.028 5.3
0.065 < 0.01 0.011 0.016 0.008
2.8 0.031 < 0.4 0.011 < 0.1 0.018 < 0.4 0.052 6.8 0.54 0.16 29
0.065 <0.4 0.011 0.016
2.9
Average Concentration (mg/L)
0.142 0.042 0.201 0.03
0.633 0.395 0.029 33.8
0.156 13.224 0.002 0.55 0.01
0.019 12.006
2.8 0.025 0.19
0.011 0.021 0.018 0.101 0.002 1.136 0.171 0.094 13.633 0.065 0.113 0.011 0.016 1.06
K-1

Pollutant Minimum Concentration (mg/L)
Toluene Trichloroethene 1,1,1-Trichloroethane 2,4-Dimethyl Phenol Diethyl Phthalate Dimethyl Phthalate Di-N-Butyl Phthalate Vinyl Acetate Vinyl Chloride
0.0082 < 0.001 0.011 0.005 0.11
0.0049 0.0044
0.25 < 0.002
Maximum Concentration (mg/L)
1.6 < 0.1 0.022 < 0.4 0.11
0.0049 0.0044 0.25 0.21
Average Concentration (mg/L)
0.735 0.025 0.019 0.107 0.11
0.0049 0.0044 0.25
0.067
* Number of detections/number of observations could not be determined from data provided.
Source: U.S. EPA’s Supplemental Manual on the Development and Implementation of Local Discharge Limitations Under the Pretreatment Programs, May 1991, pp. 1-30 and 1-31. “Pollutant levels reported below specified detection limit were considered in the data analysis and, for the purpose of statistical analysis, were considered to be equal to the detection limit.”
Most Common Landfill Leachates*
Pollutant Concentration Range (parts per million)
INORGANICS** Arsenic 0.0002 - 0.982 Barium 0.11 - 5 Cadmium 0.007 - 0.15 Chloride 31 - 5,475 Chromium (Total) 0.0005 - 1.9 Copper 0.03 - 2.8 Iron 0.22 - 2,280 Lead 0.005 - 1.6 Manganese 0.03 - 79 Nickel 0.02 - 2.2 Nitrate 0.01 - 51 Sodium 12 - 2,574 Sulfate 8 - 1,400
ORGANICS*** 1,1-Dichloroethane 0.004 - 44 Trans-1,2-Dichloroethylene 0.002 - 4.8 Ethylbenzene 0.006 - 4.9 Methylene Chloride 0.002 - 220 Phenol 0.007 - 28.8 Toluene 0.006 - 18
K-2
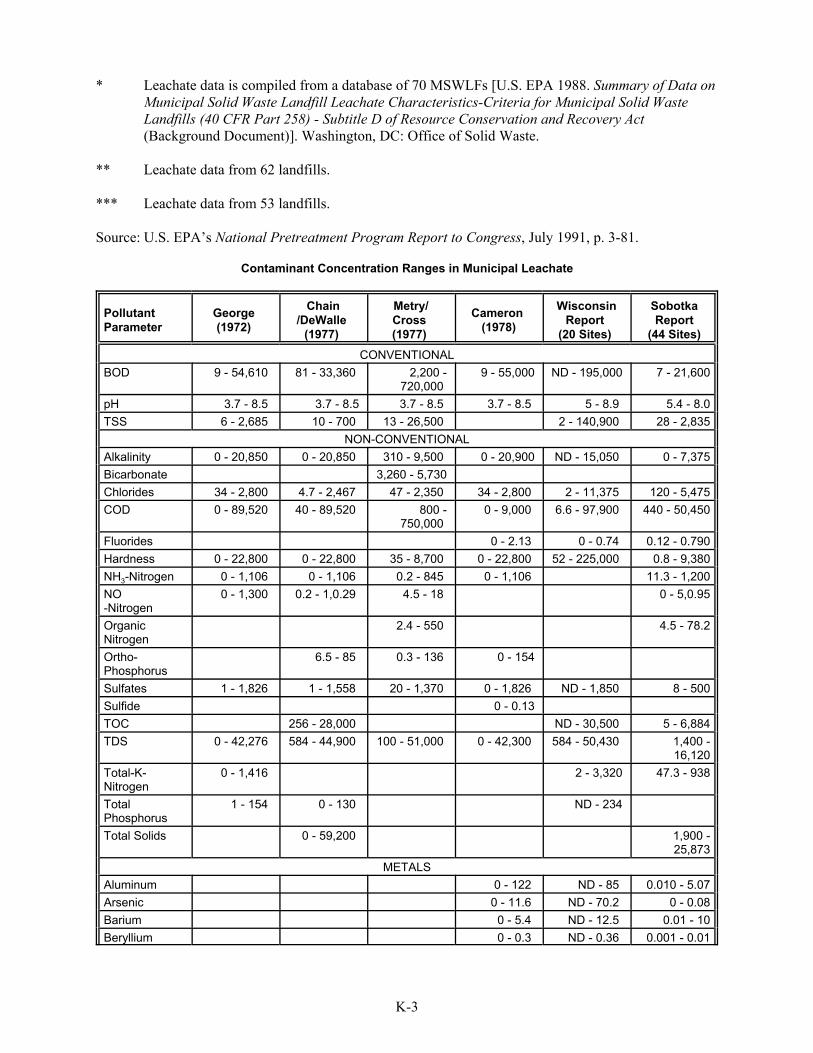
* Leachate data is compiled from a database of 70 MSWLFs [U.S. EPA 1988. Summary of Data on Municipal Solid Waste Landfill Leachate Characteristics-Criteria for Municipal Solid Waste Landfills (40 CFR Part 258) - Subtitle D of Resource Conservation and Recovery Act (Background Document)]. Washington, DC: Office of Solid Waste.
** Leachate data from 62 landfills.
*** Leachate data from 53 landfills.
Source: U.S. EPA’s National Pretreatment Program Report to Congress, July 1991, p. 3-81.
Contaminant Concentration Ranges in Municipal Leachate
Pollutant Parameter
George (1972)
Chain/DeWalle
(1977)
BOD
pH TSS
9 - 54,610
3.7 - 8.5 6 - 2,685
Alkalinity 0 - 20,850 Bicarbonate Chlorides COD
Fluorides Hardness 0 - 22,800 NH3-Nitrogen 0 - 1,106 NO -Nitrogen
34 - 2,800 0 - 89,520
Organic Nitrogen Ortho-Phosphorus Sulfates Sulfide TOC TDS
Total-K-Nitrogen Total Phosphorus Total Solids
0 - 1,300
1 - 1,826
0 - 42,276
0 - 1,416
1 - 154
Aluminum Arsenic Barium Beryllium
81 - 33,360 2,200 -720,000
3.7 - 8.5 3.7 - 8.5 10 - 700 13 - 26,500
Metry/ Cross (1977)
CONVENTIONAL
Cameron (1978)
Wisconsin Report
(20 Sites)
Sobotka Report
(44 Sites)
9 - 55,000 ND - 195,000 7 - 21,600
3.7 - 8.5 5 - 8.9 5.4 - 8.0 2 - 140,900 28 - 2,835
NON-CONVENTIONAL 0 - 20,850 310 - 9,500 0 - 20,900 ND - 15,050 0 - 7,375
3,260 - 5,730 4.7 - 2,467 47 - 2,350 34 - 2,800 2 - 11,375 120 - 5,475
40 - 89,520 800 -750,000
0 - 9,000 6.6 - 97,900 440 - 50,450
0 - 2.13 0 - 0.74 0.12 - 0.790 0 - 22,800 35 - 8,700 0 - 22,800 52 - 225,000 0.8 - 9,380 0 - 1,106 0.2 - 845 0 - 1,106 11.3 - 1,200
0.2 - 1,0.29 4.5 - 18 0 - 5,0.95
2.4 - 550 4.5 - 78.2
6.5 - 85 0.3 - 136 0 - 154
1 - 1,558 20 - 1,370 0 - 1,826 ND - 1,850 8 - 500 0 - 0.13
256 - 28,000 ND - 30,500 5 - 6,884 584 - 44,900 100 - 51,000 0 - 42,300 584 - 50,430 1,400 -
16,120 2 - 3,320 47.3 - 938
0 - 130 ND - 234
0 - 59,200 1,900 -25,873
METALS 0 - 122 ND - 85 0.010 - 5.07
0 - 11.6 ND - 70.2 0 - 0.08 0 - 5.4 ND - 12.5 0.01 - 10 0 - 0.3 ND - 0.36 0.001 - 0.01
K-3

Pollutant Parameter
George (1972)
Chain /DeWalle
(1977)
Metry/ Cross (1977)
Cameron (1978)
Wisconsin Report
(20 Sites)
Sobotka Report
(44 Sites) Boron 0.3 - 73 0.867 - 13 Cadmium 0.03 - 17 0 - 0.19 ND - 0.04 0 - 0.1 Calcium 5 - 4,080 60 - 7,200 240 - 2,570 5 - 4,000 200 - 2,500 95.5 - 2,100 Total Chromium
0 - 33.4 ND - 5.6 0.001 - 1.0
Copper 0 - 9.9 0 - 9.9 0 - 10 ND - 4.06 0.003 - 0.32 Cyanide 0 - 0.11 ND - 6 0 - 4.0 Iron 0.2 - 5,500 0 - 2,820 0.12 - 1,700 0.2 - 5,500 ND - 1,500 0.22 - 1,400 Lead 0 - 0.5 <0.10 - 2.0 0 - 5.0 0 - 14.2 0.001 - 1.11 Magnesium 16.5 - 15,600 17 - 15,600 64 - 547 16.5 - 15,600 ND - 780 76 - 927 Manganese 0.06 - 1,400 0.09 - 125 13 0.06 - 1,400 ND - 31.1 0.03 - 43 Mercury 0 - 0.064 ND - 0.01 0 - 0.02 Molybdenum 0 - 0.52 0.01 - 1.43 Nickel 0.01 - 0.8 ND - 7.5 0.01 - 1.25 Potassium 2.8 - 3,770 28 - 3,770 28 - 3,800 2.8 - 3,770 ND - 2,800 30 - 1,375 Sodium 0 - 7,700 0 - 7,700 85 - 3,800 0 - 7,700 12 - 6,010 Titanium 0 - 5.0 <0.01 Vanadium 0 - 1.4 0.01 Zinc 0 - 1,000 0 - 370 0.03 - 135 0 - 1,000 ND - 731 0.01 - 67
All concentrations in mg/L, except pH (standard units). ND = Non-detect
Source: U.S. EPA’s Technical Development Document for Proposed Effluent Limitations Guidelines and Standards for the Landfills Point Source Category, EPA 821-R-97-022, January 1998, Table 6-3.
* Literature sources were:
George, J. A., Sanitary Landfill-Gas and Leachate Control, the National Perspective, Office of Solid Waste Management Programs, U.S. EPA, 1972.
Chian, E. S., and F. B. DeWalle, Evaluation of Leachate Treatment, Volume I, Characterization of Leachate, EPA-600/2-77-186a.
Metry, A. A., and F. L. Cross, Leachate Control and Treatment, Volume 7, Environmental Monograph Series, Technomic Publishing Co., Westport, CT, 1977.
Cameron, R. D., The Effect of Solid Waste Landfill Leachates on Receiving Waters, Journal AWWA, March 1978.
McGinley, Paul M., and Peter Met. Formation, Characteristics, Treatment and Disposal of Leachate from Municipal Solid Waste Landfills, Wisconsin Department of Natural Resources Special Report, August 1, 1984.
Sobotka & Co., Inc., Case History Data Compiled and Reported to the U.S. Environmental Protection Agency Economic Analysis Branch, Office of Solid Waste, 1986.
K-4

APPENDIX L -HAULED WASTE LOADINGS
Septage Hauler Monitoring Data
Pollutant Number of Detections
Number of Samples
Minimum Concentration
(mg/L)
Maximum Concentration
(mg/L)
AverageConcentration
(mg/L)
INORGANICS 144 145 0 3.5 0.141 128 128 0.002 202 5.758 825 1097 0.005 8.1 0.097 931 1019 0.01 34 0.49
16 32 < 0.003 3.45 0.406 963 971 0.01 260.9 4.835 575 577 0.001 1.53 0.469 464 464 0.2 2740 39.287 962 1067 < 0.025 118 1.21
5 5 0.55 17.05 6.088 582 703 0.0001 0.742 0.005 813 1030 0.01 37 0.526 237 272 < 0.003 5 0.099
11 25 < 015 1 0.076 959 967 < 0.001 444 9.971
Arsenic
Barium
Cadmium
Chromium (T)CobaltCopperCyanide
Iron
Lead
Manganese
Mercury
NickelSilverTin
Zinc
COD
Acetone
Benzene
Ethylbenzene
Isopropyl AlcoholMethyl AlcoholMethyl Ethyl Ketone
Methylene Chloride
Toluene Xylene
NONCONVENTIONALS
ORGANICS 183 510
118 112 115 117 117 115 115 113
87
118 0 112 0.005 115 0.005 117 1 117 1 115 1 115 0.005 113 0.005 87 0.005
183 117500 21247.951
210 3.1 1.7
391 396 240 2.2
1.95 0.72
10.588 0.062 0.067
14.055 15.84 3.65
0.101 0.17
0.051
Source: U.S. EPA’s Supplemental Manual on the Development and Implementation of Local Discharge Limitations Under the Pretreatment Programs, 21W-4002, May 1991, pp. 1-27 and 1-28. “Pollutant levels reported below specified detection limit were considered in the data analysis and, for the purpose of statistical analysis, were considered equal to the detection limit.”
L-1

This page intentionally left blank.
L-2

APPENDIX M -HAZARDOUS WASTE CONSTITUENTS - RCRA APPENDIX VIII
Constituent CAS No. Hazardous Waste No.
A2213 30558-43-1 U394 Acetonitrile 75-05-8 U003 Acetophenone 98-86-2 U004 2-Acetylaminefluarone 53-96-3 U005 Acetyl chloride 75-36-5 U006 1-Acetyl-2-thiourea 591-08-2 P002 Acrolein 107-02-8 P003 Acrylamide 79-06-1 U007 Acrylonitrile 107-13-1 U009 Aflatoxins 1402-68-2 -Aldicarb 116-06-3 P070 Aldicarb sulfone 1646-88-4 P203 Aldrin 309-00-2 P004 Allyl alcohol 107-18-6 P005 Allyl chloride 107-18-6 -Aluminum phosphide 20859-73-8 P006 4-Aminobiphenyl 92-67-1 -5-(Aminomethyl)-3-isoxazolol 2763-96-4 P007 4-Aminopyridine 504-24-5 P008 Amitrole 61-82-5 U011 Ammonium vanadate 7803-55-6 P119 Aniline 62-53-3 U012 Antimony 7440-36-0 -Antimony compounds, N.O.S. - -Aramite 140-57-8 -Arsenic 7440-38-2 -Arsenic compounds, N.O.S. - -Arsenic acid 7778-39-4 P010 Arsenic pentoxide 1303-28-2 P011 Arsenic trioxide 1327-53-3 P012 Auramine 492-80-8 U014 Azaserine 115-02-6 U015 Barban 101-27-9 U280 Barium 7440-39-3 -Barium compounds, N.O.S. - -Barium cyanide 542-62-1 P013 Bendiocarb 22781-23-3 U278 Bendiocarb phenol 22961-82-6 U364 Benomyl 17804-35-2 U271 Benz[c]acridine 225-51-4 U016 Benz[a]anthracene 56-55-3 U018 Benzal chloride 98-87-3 U017 Benzene 71-43-2 U019 Benzenearsonic acid 98-05-5 -Benzidine 92-87-5 U021 Benzo[b]fluoranthene 205-99-2 -Benzo[j]fluoranthene 205-82-3 -Benzo(k)fluoranthene 207-08-9 -Benzo[a]pyrene 50-32-8 U022 p-Benzoquinone 106-51-4 U197 Benzotrichloride 98-07-7 U023 Benzyl chloride 100-44-7 P028 Beryllium powder 7440-41-7 P015 Beryllium compounds, not otherwise specified (NOS) - -
M-1

Constituent CAS No. Hazardous Waste No.
Bis(pentamethylene)-thiuram tetrasulfide 120-54-7 -Bromoacetone 598-31-2 P017 Bromoform 75-25-2 U225 4-Bromophenyl phenyl ether 101-55-3 U030 Brucine 357-57-3 P018 Butyl benzyl phthalateButylateCacodylic acidCadmium
85-68-7 -2008-41-5 -
75-60-5 U136 7440-43-9 -
Cadmium compounds, NOS Calcium chromate
-13765-19-0
-U032
Carbofuran Carbofuran phenol Carbon disulfide Carbon oxyfluoride Carbon tetrachloride Carbosulfan Chloral
Calcium cyanide Carbaryl Carbendazim
592-01-8 P021 63-25-2 U279
10605-21-7 U372 1563-66-2 P127 1563-38-8 U367
75-15-0 P022 353-50-4 U033 56-23-5 U211
55285-14-8 P189 75-87-6 U034
305-03-3 U035 57-74-9 U036
Chlorambucil Chlordane Chlordane (alpha and gamma isomers) Chlorinated benzenes, NOS
- U036 - -
Chlorinated ethane, NOS Chlorinated fluorocarbons, NOS
--
--
Chlorobenzene Chlorobenzilate p-Chloro-m-cresol2-Chloroethyl vinyl etherChloroformChloromethyl methyl etherbeta-Chloronaphthaleneo-Chlorophenol1-(o-Chlorophenyl)thioureaChloroprene3-ChloropropionitrileChromiumChromium compounds, NOSChryseneCitrus red No. 2Coal tar creosoteCopper cyanideCopper dimethyldithiocarbamateCreosoteCresol (Cresylic acid)Crotonaldehydem-Cumenyl methylcarbamate Cyanides (soluble salts and complexes), NOS - P030 Cyanogen 460-19-5 P031 Cyanogen bromide 506-68-3 U246 Cyanogen chloride 506-77-4 P033
Chlorinated naphthalene, NOS Chlorinated phenol, NOS Chlornaphazin Chloroacetaldehyde Chloroalkyl ethers, NOS p-Chloroaniline
- -- -
494-03-1 U026 107-20-0 P023
- -106-47-8 P024 108-90-7 U037 510-15-6 U038 59-50-7 U039
110-75-8 U042 67-66-3 U044
107-30-2 U046 91-58-7 U047 95-57-8 U048
5344-82-1 P026 126-99-8 -542-76-7 P027
7440-47-3 -- -
218-01-9 U050 6358-53-8 -8007-45-2 -
544-92-3 P029 137-29-1 -
- U051 1319-77-3 U052 4170-30-3 U053
64-00-6 P202
M-2

Constituent CAS No. Hazardous Waste No.
Cycasin 14901-08-7 -1134-23-2 -131-89-5 P034
50-18-0 U058 94-75-7 U240
Cycloate2-Cyclohexyl-4,6-dinitrophenolCyclophosphamide2,4-D2,4-D, salts, esters Daunomycin Dazomet
- U240 20830-81-3 U059
533-74-4 -72-54-8 U060 72-55-9 -50-29-3 U061
2303-16-4 U062 226-36-8 -
DDD DDE DDT Diallate Dibenz[a,h]acridine Dibenz[a,j]acridine Dibenz[a,h]anthracene 7H-Dibenzo[c,g]carbazole Dibenzo[a,e]pyrene Dibenzo[a,h]pyrene Dibenzo[a,i]pyrene 1,2-Dibromo-3-chloropropane Dibutyl phthalate
224-42-0 -53-70-3 U063
194-59-2 -192-65-4 -189-64-0 -189-55-9 U064 96-12-8 U066 84-74-2 U069 95-50-1 U070
541-73-1 U071 o-Dichlorobenzene m-Dichlorobenzene p-Dichlorobenzene Dichlorobenzene, NOS
106-46-7 U072 25321-22-6 -
3,3’-Dichlorobenzidine 1,4-Dichloro-2-butene
91-94-1 U073 764-41-0 U074
Dichlorodifluoromethane Dichloroethylene, NOS 1,1-Dichloroethylene 1,2-Dichloroethylene Dichloroethyl ether Dichloroisopropyl ether Dichloromethoxy ethane Dichloromethyl ether 2,4-Dichlorophenol 2,6-Dichlorophenol Dichlorophenylarsine Dichloropropane, NOS Dichloropropanol, NOS Dichloropropene, NOS 1,3-Dichloropropene Dieldrin
75-71-8 U075 25323-30-2 -
75-35-4 U078 156-60-5 U079 111-44-4 U025 108-60-1 U027 111-91-1 U024 542-88-1 P016 120-83-2 U081 87-65-0 U082
696-28-6 P036 26638-19-7 -26545-73-3 -26952-23-8 -
542-75-6 U084 60-57-1 P037
1,2:3,4-DiepoxybutaneDiethylarsineDiethylene glycol, dicarbamate1,4-DiethyleneoxideDiethylhexyl phthalateN,N'-DiethylhydrazineO,O-Diethyl S-methyl dithiophosphateDiethyl-p-nitrophenyl phosphateDiethyl phthalateO,O-Diethyl O-pyrazinyl phosphoro- thioateDiethylstilbesterolDihydrosafroleDiisopropylfluorophosphate (DFP)Dimethoate
1464-53-5 U085 692-42-2 P038
5952-26-1 U395 123-91-1 U108 117-81-7 U028
1615-80-1 U086 3288-58-2 U087 311-45-5 P041
84-66-2 U088 297-97-2 P040
56-53-1 U089 94-58-6 U090 55-91-4 P043 60-51-5 P044
3,3'-Dimethoxybenzidine 119-90-4 U091 p-Dimethylaminoazobenzene 60-11-7 U093
M-3

Constituent CAS No. Hazardous Waste No.
7,12-Dimethylbenz[a]anthracene 57-97-6 U094 119-93-7 U095 79-44-7 U097 57-14-7 U098
540-73-8 U099 122-09-8 P046 105-67-9 U101
3,3'-DimethylbenzidineDimethylcarbamoyl chloride1,1-Dimethylhydrazine1,2-Dimethylhydrazinealpha,alpha-Dimethylphenethylamine2,4-DimethylphenolDimethyl phthalateDimethyl sulfate
131-11-3 U102 77-78-1 U103
644-64-4 P191 25154-54-5 -
Dimetilan Dinitrobenzene, NOS 4,6-Dinitro-o-cresol 4,6-Dinitro-o-cresol salts
534-52-1 P047 - P047
2,4-Dinitrophenol 2,4-Dinitrotoluene
51-28-5 P048 121-14-2 U105
2,6-Dinitrotoluene Dinoseb
606-20-2 88-85-7
U106 P020
Di-n-octyl phthalate Diphenylamine 1,2-Diphenylhydrazine Di-n-propylnitrosamine Disulfiram
117-84-0 U017 122-39-4 -122-66-7 U109 621-64-7 U111
97-77-8 -298-04-4 P039 541-53-7 P049 115-29-7 P050 145-73-3 P088 72-20-8 P051
- P051 106-89-8 U041
Disulfoton Dithiobiuret Endosulfan Endothall Endrin Endrin metabolites Epichlorohydrin Epinephrine EPTC
51-43-4 P042 759-94-4 -
Fluoroacetic acid, sodium saltFormaldehydeFormetanate hydrochlorideFormic acidFormparanateGlycidylaldehyde
U238 P101
-U114 U114 U067 U077 U359 P054 U115 U116 U076 U118 U119 P097
-206-44-0 U120
7782-41-4 P056 640-19-7 P057
62-74-8 P058 50-00-0 U122
23422-53-9 P198 64-18-6 U123
17702-57-7 P197 765-34-4 U126
Ethyl carbamate (urethane)Ethyl cyanideEthyl ZiramEthylenebisdithiocarbamic acidEthylenebisdithiocarbamic acid, salts and estersEthylene dibromideEthylene dichlorideEthylene glycol monoethyl etherEthyleneimineEthylene oxideEthylenethioureaEthylidene dichlorideEthyl methacrylateEthyl methanesulfonateFamphurFerbam
51-79-6 107-12-0
14324-55-1 111-54-6
-106-93-4 107-06-2 110-80-5 151-56-4
75-21-8 96-45-7 75-34-3 97-63-2 62-50-0 52-85-7
14484-64-1 Fluoranthene Fluorine Fluoroacetamide
M-4

Constituent CAS No. Hazardous Waste No.
Halomethanes, NOS - -HeptachlorHeptachlor epoxideHeptachlor epoxide (alpha, beta, and gamma isomers)HeptachlorodibenzofuransHeptachlorodibenzo-p-dioxinsHexachlorobenzene
76-44-8 P059 1024-57-3 -
- -- -- -
118-74-1 U127 Hexachlorobutadiene Hexachlorocyclopentadiene Hexachlorodibenzo-p-dioxins Hexachlorodibenzofurans
87-68-3 U128 77-47-4 U130
- -- -
Hexachloroethane HexachloropheneHexachloropropeneHexaethyl tetraphosphateHydrazineHydrogen cyanideHydrogen fluorideHydrogen sulfideIndeno[1,2,3-cd]pyrene3-Iodo-2-propynyl n-butylcarbamateIsobutyl alcoholIsodrin
67-72-1 U131 70-30-4 U132
1888-71-7 U243 757-58-4 P062 302-01-2 U133
74-90-8 P063 7664-39-3 U134 7783-06-4 U135
193-39-5 U137 55406-53-6 -
78-83-1 U140 465-73-6 P060 119-38-0 P192 120-58-1 U141
Isolan Isosafrole Kepone Lasiocarpine Lead
143-50-0 U142 303-34-1 U143
7439-92-1 -- -
301-04-2 U144 7446-27-7 U145 1335-32-6 U146
58-89-9 U129
Lead compounds, NOS Lead acetate Lead phosphate Lead subacetate Lindane Maleic anhydride Maleic hydrazide Malononitrile
108-31-6 U147 123-33-1 U148 109-77-3 U149
15339-36-3 P196Manganese dimethyldithiocarbamateMelphalanMercuryMercury compounds, NOSMercury fulminateMetam Sodium
148-82-3 U150 7439-97-6 U151
- -628-86-4 P065 137-42-8 -126-98-7 U152Methacrylonitrile
Methapyrilene Methiocarb
91-80-5 U155 2032-65-7 P199
Methomyl Methoxychlor Methyl bromide 74-83-9 U029 Methyl chloride 74-87-3 U045 Methyl chlorocarbonate 79-22-1 U156 Methyl chloroform 71-55-6 U226 3-Methylcholanthrene 56-49-5 U157 4,4’-Methylenebis(2-chloroaniline) 101-14-4 U158 Methylene bromide 74-95-3 U068 Methylene chloride 75-09-2 U080 Methyl ethyl ketone (MEK) 78-93-3 U159 Methyl ethyl ketone peroxide 1338-23-4 U160 Methyl hydrazine 60-34-4 P068 Methyl iodide 74-88-4 U138
16752-77-5 P066 72-43-5 U247
M-5

Constituent CAS No. Hazardous Waste No.
Methyl isocyanate 624-83-9 P064 75-86-5 P069 80-62-6 U162 66-27-3 -
298-00-0 P071 56-04-2 U164
1129-41-5 P190
2-Methyllactonitrile Methyl methacrylate Methyl methanesulfonate Methyl parathion Methylthiouracil Metolcarb
Mitomycin C MNNG
315-18-4 P128 50-07-7 U010 70-25-7 U163
2212-67-1 -
Mexacarbate
Molinate Mustard gas Naphthalene 1,4-Naphthoquinone alpha-Naphthylamine beta-Naphthylamine alpha-Naphthylthiourea Nickel
505-60-2 -91-20-3 U165
130-15-4 U166 134-32-7 U167 91-59-8 U168 86-88-4 P072
7440-02-0 -- -Nickel compounds, NOS
Nickel carbonylNickel cyanideNicotine
13463-39-3 P073 557-19-7 P074 54-11-5 P075
- P075 10102-43-9 P076
100-01-6 P077 98-95-3 U169
10102-44-0 P078
Nicotine salts Nitric oxide p-Nitroaniline Nitrobenzene Nitrogen dioxideNitrogen mustardNitrogen mustard, hydrochloride saltNitrogen mustard N-oxideNitrogen mustard, N-oxide, hydro- chloride saltNitroglycerinp-Nitrophenol2-Nitropropane
Nitrosamines, NOS
51-75-2 -- -
126-85-2 -- -
55-63-0 P081 100-02-7 U170 79-46-9 U171
35576-91-1D -N-Nitrosodi-n-butylamine N-Nitrosodiethanolamine
924-16-3 1116-54-7
U172 U173
N-Nitrosodiethylamine N-Nitrosodimethylamine N-Nitroso-N-ethylurea N-Nitrosomethylethylamine N-Nitroso-N-methylurea N-Nitroso-N-methylurethane N-Nitrosomethylvinylamine N-Nitrosomorpholine N-Nitrosonornicotine
55-18-5 U174 62-75-9 P082
759-73-9 U176 10595-95-6 -
684-93-5 U177 615-53-2 U178
4549-40-0 P084 59-89-2 -
16543-55-8 -100-75-4 U179N-Nitrosopiperidine
N-Nitrosopyrrolidine N-Nitrososarcosine
930-55-2 U180 13256-22-9 -
Octamethylpyrophosphoramide Osmium tetroxide
99-55-8 U181 152-16-9 P085
20816-12-0 P087 23135-22-0 P194
5-Nitro-o-toluidine
Oxamyl Paraldehyde Parathion
123-63-7 U182 56-38-2 P089
Pebulate Pentachlorobenzene
1114-71-2 -608-93-5 U183
- -- -
Pentachlorodibenzo-p-dioxins Pentachlorodibenzofurans
M-6

Constituent CAS No. Hazardous Waste No.
Pentachloroethane 76-01-7 U184 Pentachloronitrobenzene (PCNB)PentachlorophenolPhenacetin
82-68-8 U185 87-86-5 F027 62-44-2 U187
108-95-2 U188Phenol PhenylenediaminePhenylmercury acetatePhenylthioureaPhosgenePhosphinePhorate
25265-76-3 -62-38-4 P092
103-85-5 P093 75-44-5 P095
7803-51-2 P096 298-02-2 P094
Phthalic acid esters, NOS Phthalic anhydride Physostigmine Physostigmine salicylate 2-Picoline
- -85-44-9 U190 57-47-6 P204 57-64-7 P188
109-06-8 U191 -Polychlorinated biphenyls, NOS
Potassium cyanidePotassium dimethyldithiocarbamatePotassium n-hydroxymethyl-n-methyl-dithiocarbamatePotassium n-methyldithiocarbamate
151-50-8 P098 128-03-0 -
51026-28-9 -137-41-7 -7778736 -506-61-6 P099
2631-37-0 P201 23950-58-5 U192
Potassium pentachlorophenate Potassium silver cyanide Promecarb Pronamide 1,3-Propane sultonen-PropylaminePropargyl alcoholProphamPropoxurPropylene dichloride1,2-PropyleniminePropylthiouracilProsulfocarb
1120-71-4 U193 107-10-8 U194 107-19-7 P102 122-42-9 U373 114-26-1 U411 78-87-5 U083 75-55-8 P067 51-52-5 -
52888-80-9 U387 110-86-1 U196Pyridine
Reserpine Resorcinol
50-55-5 U200 108-46-3 U201
Selenium compounds, NOS Selenium dioxide
81-07-2 U202 - U202
94-59-7 U203 7782-49-2 -
- -7783-00-8 U204 7488-56-4 U205 144-34-3 -630-10-4 P103
7440-22-4 -- -
506-64-9 P104
Saccharin Saccharin salts Safrole Selenium
Selenium sulfide Selenium, tetrakis(dimethyl-dithiocarbamate) Selenourea Silver Silver compounds, NOSSilver cyanideSilvex (2,4,5-TP)Sodium cyanideSodium dibutyldithiocarbamateSodium diethyldithiocarbamateSodium dimethyldithiocarbamateSodium pentachlorophenateStreptozotocinStrychnine
93-72-1 F027 143-33-9 P106 136-30-1 -148-18-5 -128-04-1 -
131522 None 18883-66-4 U206
57-24-9 P108 - P108
95-06-7 -Strychnine salts Sulfallate
M-7

Constituent CAS No. Hazardous Waste No.
TCDD 1746-01-6 -Tetrabutylthiuram disulfide 1,2,4,5-Tetrachlorobenzene
1634-02-2 -95-94-3 U207
Tetrachlorodibenzo-p-dioxins Tetrachlorodibenzofurans
--
--
Tetrachloroethane, NOS 1,1,1,2-Tetrachloroethane
25322-20-7 -630-20-6 U208
2,3,4,6-Tetrachlorophenol2,3,4,6-tetrachlorophenol, potassium salt2,3,4,6-tetrachlorophenol, sodium saltTetraethyldithiopyrophosphateTetraethyl leadTetraethyl pyrophosphateTetramethylthiuram monosulfideTetranitromethane
79-34-5 U209 127-18-4 U210
58-90-2 F027 53535276 -25567559 -3689-24-5 P109
78-00-2 P110 107-49-3 P111
97-74-5 -509-14-8 P112
7440-28-0 -- -
1314-32-5 P113 563-68-8 U214
1,1,2,2-Tetrachloroethane Tetrachloroethylene
Thallium Thallium compounds, NOS Thallic oxide Thallium(I) acetate Thallium(I) carbonate Thallium(I) chloride Thallium(I) nitrate Thallium selenite
6533-73-9 U215 7791-12-0 U216
10102-45-1 U217 12039-52-0 P114
Thallium(I) sulfate Thioacetamide
7446-18-6 62-55-5
P115 U218
59669-26-0 U410 39196-18-4 P045
74-93-1 U153 23564-05-8 U409
Thiodicarb Thiofanox Thiomethanol Thiophanate-methyl Thiophenol Thiosemicarbazide
108-98-5 P014 79-19-6 P116
Thiourea 62-56-6 U219 Thiram 137-26-8 U244 Tirpate 26419-73-8 P185 Toluene 108-88-3 U220 Toluenediamine 25376-45-8 U221 Toluene-2,4-diamine 95-80-7 -Toluene-2,6-diamine 823-40-5 -Toluene-3,4-diamine 496-72-0 -Toluene diisocyanate 26471-62-5 U223 o-Toluidine 95-53-4 U328 o-Toluidine hydrochloride 636-21-5 U222 p-Toluidine 106-49-0 U353 Toxaphene 8001-35-2 P123 Triallate 2303-17-5 U389 2,4,6-Tribromophenol 118-79-6 U408 1,2,4-Trichlorobenzene 120-82-1 -1,1,2-Trichloroethane 79-00-5 U227 Trichloroethylene 79-01-6 U228 Trichloromethanethiol 75-70-7 P118 Trichloromonofluoromethane 75-69-4 U121 2,4,5-Trichlorophenol 95-95-4 F027 2,4,6-Trichlorophenol 88-06-2 F027 2,4,5-T 93-76-5 F027
M-8

Constituent CAS No. Hazardous Waste No.
Trichloropropane, NOS 25735-29-9 -1,2,3-Trichloropropane 96-18-4 -Triethylamine 121-44-8 U404 O,O,O-Triethyl phosphorothioate 126-68-1 -1,3,5-Trinitrobenzene 99-35-4 U234 Tris(1-aziridinyl)phosphine sulfide 52-24-4 -Tris(2,3-dibromopropyl) phosphate 126-72-7 U235 Trypan blue 72-57-1 U236 Uracil mustard 66-75-1 U237 Vanadium pentoxide 1314-62-1 P120 Vernolate 1929-77-7 -Vinyl chloride 75-01-4 U043 Warfarin, concentrations less than 0.3% 81-81-2 U248 Warfarin, concentrations greater than 0.3% 81-81-2 P001 Warfarin salts, when present at concentrations less than 0.3%. - U248
Warfarin salts, when present at concentrations greater than 0.3%. - P001
Zinc cyanide 557-21-1 P121 Zinc phosphide, when present at concentrations greater than 10%. 1314-84-7 P122
Zinc phosphide, when present at concentrations of 10% or less. 1314-84-7 U249
Ziram 137-30-4 P205
Source: 40 CFR Part 261, Subpart D and Appendix VIII - Hazardous Constituents.
M-9

This page intentionally left blank.
M-10

APPENDIX N -STATISTICAL APPROACH TO DETERMINING SAMPLING
FREQUENCY
The use of statistical analyses can help establish an acceptable minimum number of samples needed to adequately represent a population of pollutants influent and effluent at an acceptable confidence level.
The procedure for establishing an acceptable minimum number of samples is calculated using the technique described in: Statistical Methods for Environmental Pollution Monitoring (Gilbert, 1987). This text is frequently cited in environmentally related statistical work. The method utilizes Equation 1 to calculate the sample size required to estimate the true mean of a population, based on the coefficient of variation, a confidence level, and a relative error. The method assumes a normal distribution of samples.
n = (Z1-"/20/dr)2
Where:n = Sample size required for estimating the true mean, :Z1-"/2 = Normal deviate of desired confidence level0 = Coefficient of variationdr = Relative error
The coefficient of variation is determined by Equation 2.
0 = s /0
Where: s = Standard deviation0 = Mean
The sample standard deviation is determined by Equation 3.
Eq. 1
Eq. 2
Eq. 3
The mean and standard deviation used above should be taken from an acceptable past available sample. Both an acceptable confidence level and an acceptable relative error must be selected, each of which will vary depending on the type of pollutant being measured. Selection of both levels should be determined by the POTW based on the situation. The confidence level expresses the certainty of the estimated mean while the relative error indicates the accuracy of the estimated mean compared to the true mean.
Table 1-1 is an example matrix which applies Equation 1 to calculate sample size.
N-1

Table 1-1.
Confidence Level
(1-")
0.80 (Z0.90 = 1.28)
Relative Error
Sample Sizes Required for Estimating the True Mean
Coefficient of Variation (0)
0.10 0.30 0.50 1.00 1.50 2.00
2 15 41 164 369 656
0.90 (Z0.975 = 1.645)
1083
7
11
(dr)
0.10
0.25 - 3 7 27 59 105
0.50 - 1 2 7 15 27
1 - - - 2 4
0.10 3 25 68 271 609
0.25 - 4 11 44 98 174
0.50 - 1 3 11 25 44
1 - - 1 3 7
As shown in Table 1-1, establishing the number of samples needed to estimate the true mean is critically dependent on a data set’s coefficient of variation (CV).
For example, a past, reliable sample produced a data set with standard deviation of 2 mg/L and a mean of 2 mg/L, resulting in CV equal to one. If a confidence level of 0.80 (with a corresponding Z1-"/2 = 1.28) and a relative error of 0.25 are determined to be adequate, then Equation 1 is used as follows:
n = (1.28 * 1 / .25)2 = 26.21
The sample size must then be rounded to the next whole number, in this case, 27. The 27 samples may be taken throughout the year if desired, or as determined by the POTW. In the case of taking the samples throughout the year, the POTW might take two samples per month and an additional three samples at random times during the year. One sample may be evaluated for multiple contaminants; however, each location would need to be sampled independently.
Under these conditions, there would be 80% confidence that the estimated mean from 27 samples (as illustrated in Table 1-1) would be within + 25% of the true mean. Therefore, if the estimated mean is 4 mg/L, there would be 80% confidence that the true mean is within the interval of 3 to 5 (i.e., 4 + 1). If a confidence level of 0.90 and relative error of 0.10 were desired, the number of samples would increase substantially. Under these conditions, there would be 90% confidence that the estimated mean from 271 samples (as illustrated in Table 1-1) would be within + 10% of the true mean. Therefore, if the estimated mean was 2 mg/L, there would be 90% confidence that the true mean was within the interval of 1.8 to 2.2 (i.e., 2 + 0.2).
Source: SAIC. 1998. POTW Metals Analysis Project, Task 3 Deliverable to U.S. EPA Region VIII, EPA, Contract No. 68-C4-0068; Work Assignment Number PS-3-1, SAIC Project Number 01-0833-08-2696-800, August 25, 1998.
N-2

APPENDIX O -MINIMIZING CONTAMINATION IN SAMPLES
Some of the data reported as below the detection level (BDL) may be the result of the POTW sampling techniques and chosen analytical methods. With the need to accurately detect trace levels of pollutants, POTWs should thoroughly examine potential sources of gross and trace contamination and select analytical methods that can detect very low levels of pollutants. EPA has established new performance based1 sampling and analysis methods (1600 series) for measuring 13 toxic metals in the low ppt to ppb range. While these methods were developed for ambient water quality monitoring, POTWs may apply some of the concepts in Method 1669, Sampling Ambient Water for Determination of Metals at EPA Water Quality Criteria Levels, to improve the reliability of data collected, potentially even utilizing analytical methods 1631, 1632, 1636-40.
Excerpts from Section 4.2.2 of Method 1669 are provided below.
Minimizing Contamination: Sampling Location, Sampling Equipment and Materials, and Chemicals:
C Where possible, limit exposure of the sample and equipment in areas of higher contamination, e.g., downwind from the sludge beds.
C Minimize contact with airborne dust, dirt, particulate matter, or vapors from automobile exhaust; cigarette smoke; nearby corroded or rusted bridges, pipes, poles, or wires; nearby roads; and even human breath. Areas where nearby soil is bare and subject to wind erosion should be avoided.
C Clean the sampling equipment and minimize the time between cleaning of equipment and use.
C Use metal-free equipment, i.e., equipment should be nonmetallic and free of material that may contain metals of interest. When it is not possible to obtain equipment that is completely free of the metal(s) of interest, the sample should not come into direct contact with the equipment.
C Do not use sampling equipment where there are indications that it may not be clean, e.g., sampler tubing or collection bottle is stained, has not been changed out in some time, was used to collected a sample of a slug load that hit the WWTP, etc.
C Avoid contamination by carryover. Contamination may occur when a sample containing low concentrations of metals is processed immediately after a sample containing relatively high concentrations of these metals.
C Where possible, do not collect, process, or ship samples containing high concentrations of metals (e.g., untreated effluents, in-process waters, landfill leachates) at the same time as samples being collected for trace metals determinations.
C Wear clean, non-talc dusted gloves during all operations involving handling of equipment, samples, and blanks. Change gloves once they have become contaminated.
1An alternate procedure or technique may be used so long as neither samples nor blanks are contaminated when following alternate procedures.
O-1

C Fluoropolymer (FEP, PTFE), conventional or l inear polyethylene, polycarbonate, polysulfone, polypropylene, or ultrapure quartz are the preferred materials for coming in contact with samples. Fluoropolymer or glass containers are preferred for samples that will be analyzed for mercury because mercury vapors can diffuse in or out of other materials, resulting either in contamination or low-biased results.
Lot Analyses of Metals in Different Grades of Nitric Acid (SOURCE-FISHER-INTERNET) Highest Grade Higher Grade High Grade
Antimony <0.01 ppb <0.1 ppb Arsenic <0.1 ppb <0.3 ppb #4 ppb Cadmium <0.005 ppb <0.1 ppb Chromium <0.03 ppb #9 ppb #100 ppb Copper #0.05 ppb <1 ppb #50 ppb Lead #0.01 ppb <0.3 ppb #100 ppb Mercury <0.1 ppb <0.5 ppb Nickel #0.1 ppb <1 ppb #50 ppb Selenium <0.5 ppb Silver <0.005 ppb <0.1 ppb
C The following materials have been found to contain trace metals: Pyrex, Kimax, methacrylate, polyvinyl chloride, nylon, Vycor, highly colored plastics, paper cap liners, pigments used to mark increments on plastics, and rubber. It is recommended that these materials not be used to hold liquids that come in contact with the sample or must not contact the sample.
C Use an appropriate grade of chemicals when prepping equipment/materials and chemically preserving samples.
Quality Control:
C Serial numbers should be indelibly marked or etched on each piece of Apparatus so that contamination can be traced, and logbooks should be maintained to track the sample from the container through the sampling process to shipment to the laboratory. Chain-of-custody procedures should be used so that contamination can be traced to particular handling procedures or lab personnel.
C Equipment blanks should be periodically generated and analyzed to identify contamination that may result from improper preparation or handling of sampling equipment and bottles in the laboratory. Equipment blanks include processing reagent water (i.e., water known not to contain pollutants at detectable levels) through sampling equipment and sample bottle(s) prior to taking the equipment or bottle(s) to the field.
C A trip blank should be periodically generated and analyzed to identify incidental contamination that may occur to sampling equipment/bottles while in transit to and from the sampling location. Essential, reagent water is place in a sample bottle prior to going to the field.
C Field blanks should be periodically generated and analyzed to identify contamination that may occur to sampling equipment/bottles while in the field. Like equipment blanks, it involves process reagent water through the sampling equipment/bottle.
O-2

APPENDIX P -METHODS FOR CALCULATING REMOVAL EFFICIENCY
There are three methods of calculating removal efficiencies: average daily removal efficiency (ADRE) method, mean removal efficiency (MRE) method, and the decile approach. ADRE across a plant is defined as:
Where: Rpotw = Plant removal efficiency from headworks to plant effluent (as decimal) I n = POTW g/L Epotw, n = POTW n = Paired observations, numbered 1 to N
As defined in Equation 5.2, the MRE across a plant is defined as:
Where: Rpotw = Plant removal efficiency from headworks to plant effluent (as decimal) Ir = POTW g/L Epotw, t = POTW g/L t = Plant effluent samples, numbered 1 to T r = Plant influent samples, numbered 1 to R
It is important to realize that the portion of the pollutant removed through a treatment process is transferred to another wastestream, typically the sludge. For conservative pollutants, such as metals, all the pollutant from the influent ends up in either the effluent or the sludge. ple, a 93% overall plant removal means that 93% of the cadmium in the influent is transferred to the sludge, while 7% remains in the effluent wastewater.
1. REVIEW OF THE DATA SET AND EXCLUSION OF CERTAIN DATA
A good first step in determining removal efficiencies is to review the data set. identify any data values that are extremely high or low. e isolated extreme values, there are formal statistical procedures that can be applied to evaluate whether a value can be classified as an “outlier” relative to the rest of the data set. ethods most widely used to make this determination are described in the following two paragraphs.
If the data is known to closely follow a normal distribution, then any data point that lies more than two standard deviations from the mean is considered an outlier. Consider, for example, the DRE data values
As defined in Equation 5.1, the
influent pollutant concentration at headworks , meffluent pollutant concentration
influent pollutant concentration at headworks, meffluent pollutant concentration, m
For exam
This review can If there ar
Two m
P-1

located in Table 1 of this appendix, and assume that this data is from a normal distribution. The 15 observations have a mean of 52.69 and a standard deviation of 34.65. Using this method, any data point that lies outside of the range -16.61 to 121.99, or 52.69 ± 2*34.65, can be considered an outlier. In this case, one value, -20.25, falls outside of the range and can be determined to be an outlier.
However, the DRE data values do not approximate a “bell-shaped” normal distribution. In this case, outliers can be determined based on the interquartile range (IQR) of the data set. First, order the data from smallest to largest and locate the data points that fall at the 25th percentile (also referred to as the first quartile or Q1), and the 75th percentile (also referred to as the third quartile or Q3). The IQR is equal to the value of the observation at Q3 minus the value of the observation at Q1. Any data point that lies more than 1.5 times this IQR below Q1, or above Q3, is considered an outlier. Again, consider the data in Table 1, but now make no assumptions about the distribution of the population from which the sample was taken. The Q1 and Q3 of this data set are located at 38.04 and 78.5 respectively. Based on these values, the IQR is equal to 40.46 (78.5 - 38.04). Any value that falls below -22.65 (38.04 - 1.5*40.46), or above 139.19 (78.5 + 1.5*40.46), can be considered an outlier. In this case, there are no values that fall outside of the range and, consequently, no values should be determined to be outliers.
Both of these methods are meant to determine any values that may be candidates for exclusion from the data set. Data exclusion should be performed only if technical justification exists to support such action (e.g., poor removals due to temporary maintenance or operational problems or known sampling problems). For example, if an examination of the data set shows that an unusually high influent value is from the same sampling day/event as an unusually high effluent value, this occurrence of corresponding extreme values should be investigated to determine if the data values can be explained by technical or operational problems not related to treatment system performance (e.g., maintenance, repair, or sampling problems). If this is the case, dropping the data pair from the data set may be appropriate.
Review of the data may also show patterns such as increasing effluent values over time. If a similar pattern is not observed for the influent values, this will generate a pattern of decreasing DREs over time. A graph or plot of DRE against sampling day/event (in order from first to most recent sample) can help identify such trends. This may alert the POTW to operational problems that should be investigated. A plot can also highlight unusually low DREs that call for further review, such as checking laboratory quality control samples to determine if blank or duplicate samples indicate anything out of the ordinary. If abnormalities are found in laboratory QA/QC (quality assurance/quality control) data, the POTW may consider excluding the affected values from the data set.
Table 1 contains an example data set of 15 influent and effluent sample pairs for zinc. The influent and effluent concentrations have been converted to loadings using the POTW flows for the sample days. The influent and effluent concentrations may be used instead of converting to loadings. Whether loadings or concentrations are used will likely have little impact on the results of the ADRE and decile approaches.
Influent and effluent flows are probably similar (if not the same) for a data pair and therefore will have little effect on the relative size of the influent and effluent values, so DREs will change little. However, converting to loadings may have a noticeable impact on the MRE method if a POTW has high variability in its flows. Because influent and effluent loadings for high flow days will increase more relative to influent and effluent loadings for low flow days, the net effect is to give greater weight to the removal rates on those days with high flows. If the POTW has high variability in its flows, it should evaluate whether its removal rates tend to go up and down in relation to flow. If so, the POTW should consider calculating an MRE using both concentrations and loadings and evaluating which is more appropriate.
P-2

123456789
101112131415
Table 1. Removal Efficiency Example
Sample Day Date
Influent Load (lbs/day)
Effluent Load (lbs/day)
DRE (%)
3/4/99 518.22 111.41 78.50 3/5/99 163.98 173.99 -6.10 3/6/99 110.15 97.64 11.36 3/7/99 1739.93 474.41 72.73 3/8/99 266.48 320.45 -20.25 4/15/99 170.48 105.15 38.32 5/11/99 473.16 132.67 71.96 5/12/99 314.19 148.96 52.59 5/13/99 306.68 132.69 56.73 5/14/99 232.57 92.63 60.17 5/15/99 226.52 72.60 67.95 6/15/99 533.25 98.87 81.46 7/1/99 141.43 87.63 38.04 7/15/99 1166.77 103.90 91.10 8/1/99 2301.00 97.88 95.75
Average 577.65 150.06 52.69
Review of the data shows that:
C The data set does not require removal of outliers. C The three particularly high influent values (sample days 4, 14, and 15) all have
DREs of more than 70%, so the high influent values do not appear to make the data candidates for elimination.
C There are two effluent values (sample days 4 and 5) that are significantly higher than the others. For one, the corresponding influent value is also high and the DRE is 73%. For the other day, the DRE is negative (-20%) because the influent value is relatively low. These results are from samples taken on two consecutive days (March 7 and March 8), which may indicate that the POTW treatment system was experiencing some operational difficulties or interference at the time. The POTW should investigate the matter to determine if there are valid reasons for dropping these data from the removal calculations data set.
C There are two negative DREs (one for March 8) calculated from the influent and effluent data pairs. They occurred three days apart and may indicate temporary operational problems, so the POTW should investigate the matter (as noted above).
A plot of the data may help the POTW identify any data concerns that should be investigated. Based on the review of data for this example, it was determined that no justification exists for excluding any of the data from the data set.
2. CALCULATION OF REMOVAL EFFICIENCIES
Once the data set has been reviewed, the POTW can proceed to calculating removal efficiencies. The following sections describe each of the methods for calculating removal efficiencies and perform the calculations using the example data set in Table 1.
P-3

2.1 Average Daily Removal Efficiency (ADRE)
The ADRE is calculated by first calculating a DRE for each pair of influent and effluent values (i.e., an influent value and an effluent value from the same sampling day/event are used to calculate a DRE). This set of DREs is then averaged to determine the ADRE for a pollutant. Use of the ADRE method requires that a POTW only use data for the sampling days/events for which it has both an influent and an effluent value, and the influent value is greater than zero.
Example
For the example data set in Table 1, the ADRE is calculated as:
ADRE = [78.5+(-6.1)+11.36+72.73+(-20.25)+38.32+71.96+52.59+56.73+60.17+67.95+81.46+38.04 +91.10+95.75)]/15 = 52.69%
2.2 Mean Removal Efficiency (MRE)
The MRE is calculated by using the same formula as for the DRE (shown at the beginning of the Appendix), but instead of using individual influent and effluent values from sampling days/events, the set of influent values is first averaged to determine the average influent value and the same is done for the set of effluent values (either concentrations or loadings). These average values are then used in the DRE equation to result in the MRE for a pollutant. Unlike the ADRE method, the MRE method does not require paired influent and effluent values from the same sampling days/events. The MRE can be based on influent and effluent sample values that are not always paired (e.g., one effluent sample is lost or destroyed, so the influent average is based on one more value than the effluent average). However, the POTW should use caution in building the data sets for calculating influent and effluent averages because if too many unpaired values are used the removal efficiencies may be meaningless because the influent data and effluent data may represent different time periods, and treatment plant conditions do vary over time.
Example
For the example data set in Table 1, the MRE is calculated as:
Average of the influent values = 577.65 lbs/day Average of the effluent values = 150.06 lbs/day MRE = 100*(577.65-150.06)/577.65 = 74.02%
2.3 Comparison of Results from ADRE and MRE Methods
Note that the MRE (74.02%) is higher than the ADRE (52.69%). The three days with the highest influent loadings have relatively high DREs and the two negative DREs (Day 2 and Day 5) occur on days with values that are not significantly greater than the other days. In the ADRE calculation, each day/DRE is given the same weight as the others, while the MRE method gives greater weight to the days with greater loadings. This means that the high removals on the days with high influent loadings affect the MRE more than the other days do, leading to a higher MRE, while the negative values do not have as great an impact because they occur on days with less elevated influent and effluent values If each DRE were to be weighted by its proportion of the total loading, the result would be the same as with the MRE method.
P-4

Usually, the MRE and ADRE are slightly different from each other, and can be quite different (as in the example presented here). The POTW can calculate both and decide if one of the estimates is the most appropriate for use in AHL calculations. The POTW can also use the decile approach to determine representative removal efficiencies.
2.4 Decile Approach
The decile approach, unlike the above methods, considers how often the actual DRE will be above or below a specified removal rate, thereby taking into account the variability of POTW removal efficiencies over time. The decile approach involves putting the set of DREs (calculated using the formula presented at the beginning of this appendix) in order from least to greatest and then determining nine decile values. Each decile is the value below which a certain percentage of the DREs fall. For example, the first decile is the value below which 10% of the DREs fall. Similarly, the second decile is the value below which 20% of the DREs fall, on up to the ninth decile, which is the value below which 90% of the DREs fall. The fifth decile is the median and half of the DREs fall below this number. To apply the decile approach, a minimum of nine DREs are required. If exactly nine DREs are available, the nine estimated deciles are simply the nine DREs. If more then nine DREs are used, the POTW needs to calculate the nine decile estimates.
Tables 2 and 3 below illustrate use of the decile approach for the example zinc data set. The steps are:
C Step 1: Take the set of DREs and put the values in order from smallest to largest (see Table 2).
C Step 2: The entries for Column 1 are obtained by performing the two calculations. First, define the location for the first decile and then calculate the next eight multiples of that location value to determine the location for the second through ninth deciles. The first location is determined by the equation: (N+1)/10, where N = the number of data pairs/DREs used. For the example data set, N=15, so the location for the first decile is (15+1)/10 = 1.6. The location for the second decile is 2 x 1.6 = 3.2, the location for the third decile is 3 x 1.6 = 4.8, and so on up to the ninth decile of 9 x 1.6 = 14.4. (Column 1 in Table 3)
C Step 3: For each decile, take the whole number part of the value in Column 1 and place it in Column 2 (e.g., the first decile is 1.6, so the whole number part is 1; the fourth decile is 6.4, so the whole number part is 6).
C Step 4: The entries in Column 3 of Table 3 are taken from the ordered list of DREs in Table 2. The whole number values in Column 2 correspond to the entry in the ordered list in Table 2 [e.g., the whole number part for the first decile is 1, so entry 1 (-20.25%) from Table 2 is the correct value and is placed in Column 3 of Table 3; similarly, the fourth decile whole number part is 6, so value 6 (52.59%) is placed in Column 3 of Table 3 for the fourth decile].
C Step 5: Following a similar procedure as in Step 4, values for Column 4 are taken from Table 2 and place in Table 3, except that this time the values taken from Table 2 are the ones that immediately follow the Column 3 entries [e.g., for the first decile, the value placed in Column 4 is -6.10, which is value 2 (the value immediately after value 1) from Table 2; for the fourth decile, the value placed in Column 4 is 56.73, which is value 7 from Table 2].
C Step 6: Fill in Column 5 by subtracting Column 3 from Column 4 and entering the result.
C Step 7: Similar to the process for filling Column 2 (explained in Step 3) of Table 3, place the decimal part of the Column 1 entries in Column 6 of Table 3 (e.g., for the first decile, use 0.6; for the fourth decile, use 0.4).
P-5

C Step 8: Fill in Column 7 by multiplying the values in Column 5 by the values in Column 6 and entering the result.
C Step 9: Add Column 3 and Column 7 and enter the result in Column 8 of Table 3. These values are the estimated deciles.
Table 2. Set of DREs Sorted in Ascending Order
1 3 10 11 12 13 14 15
-20.25 -6.1 11.36 38.04 38.32 52.59 56.73 60.17 67.95 71.96 72.73 78.50 81.46 91.10 95.75
2 9 8 7 6 5 4
Table 3. Decile Approach for Zinc Example Deciles Column 1 Column 2 Column 3 Column 4 Column 5 Column 6 Column 7 Column 8 1st 1.6 1 -20.25 -6.10 14.15 0.6 8.490 -11.76 2nd 3.2 3 11.36 38.04 26.68 0.2 5.336 16.70 3rd 4.8 4 38.04 38.32 0.28 0.8 0.224 38.26 4th 6.4 6 52.59 56.73 4.14 0.4 1.656 54.25 5th 8.0 8 60.17 67.95 7.78 0 0.000 60.17 6th 9.6 9 67.95 71.96 4.01 0.6 2.406 70.36 7th 11.2 11 72.73 78.50 5.77 0.2 1.154 73.88 8th 12.8 12 78.50 81.46 2.96 0.8 2.368 80.87 9th 14.4 14 91.10 95.75 4.65 0.4 1.860 92.96
The main value of the decile approach is that it provides an estimate of how often a POTW is expected to exceed certain removal values, such as the ADRE and MRE. For the example, the ADRE is 53% and the MRE is calculated as 74%. If the POTW uses either one of these values, what amount of the time will its removal efficiency exceed those values? This can be estimated using the decile approach. The ADRE of 53% falls between the third and fourth deciles (38.26% and 54.25%, respectively), meaning that the actual removal efficiency is estimated to exceed the ADRE 60% to 70% of the time [(e.g., the third decile means that 30% of the time values will fall below that value (38.26% in this case)]. The MRE of 74% lies between the seventh and eight deciles (73.88% and 80.87%, respectively), so the POTW is estimated to exceed the MRE 20% to 30% of the time.
In developing local limits, appropriate removal efficiencies must be selected for calculation of AHLs for each pollutant. POTWs have often selected a pollutant’s ADRE for local limits calculations. EPA recommends that POTWs consider using the decile approach or the MRE method because they better account for variabilities in removal efficiencies over time. For example, because a higher removal efficiency means more pollutant is removed to the sludge, if the POTW used the ADRE from the above example (which is likely exceeded 60% to 70% of the time) to calculate an AHL to protect sludge quality, the resulting AHL may not be adequately protective. More pollutant will likely be removed to the sludge 60% to 70% of the time, so loadings in the sludge will higher than was estimated in the AHL calculations and may lead to exceedances of sludge disposal standards.
A different approach that may address this concern is to use one decile for AHL calculations to protect sludge quality (for sludge disposal and for sludge digester inhibition for conservative pollutants) and a different decile for AHL calculations for protection against Pass Through concerns (e.g., NPDES permit limits). For example, a POTW can base its sludge quality-based AHLs on the seventh decile removal which means that greater removals to sludge and hence greater sludge loadings would be estimated to occur 30% of the time.
P-6

Similarly, the POTW can use the third decile for calculating its water quality-based AHLs because lower removals (and hence higher effluent loadings) would be estimated to occur about 30% of the time. use of these deciles estimates that AHLs would be exceeded 30% of the time, in reality this is not highly likely. If the entire AHL is allocated to IUs, all IUs would have to discharge at their maximum allowed level to reach the AHL. the removal achieved is greater than the seventh decile, more loading would go to the sludge than is provided for with the AHL. me IUs discharge at below their allocated loadings, which is very likely at any given time, the likelihood of exceeding the allowed loading to the sludge is much lower.
3. NON-CONSERVATIVE POLLUTANTS
The above discussion of removal efficiency calculations applies to conservative pollutants (e.g., metals). However removal efficiencies for non-conservative pollutants can be used to calculate AHLs based on Pass Through criteria (e.g., biological process inhibition data, NPDES permit limits) and the guidance above can be used for non-conservative pollutants only in these cases. Conservative pollutant removal efficiencies are determined by pollutant concentrations in the POTW influent and effluent streams. ption applied to conservative pollutants (that removed pollutants are exclusively transferred to the POTW’s sludge streams) cannot be extended to non-conservative pollutants because losses through degradation and volatilization do not contribute to pollutant loadings in sludge. efore, non-conservative pollutant removal efficiencies cannot be used in deriving AHLs from criteria/standards applicable to the POTW’s sludge streams (e.g., digester inhibition, sludge disposal).
Equation 5.13, -conservative pollutants, based on criteria for sludge digester inhibition, is:
Where: AHLdgstr = AHL based on sludge digestion inhibition, lb/day Linfl = POTW influent loading, lb/day Cdgstinhib = Sludge digester inhibition criterion, mg/L Cdgstr = Existing pollutant level in sludge, mg/L
The equation can be rewritten as:
Where the factor Cdgstr/Linfl is a partitioning factor that relates the pollutant level in the POTW sludge, Cdgstr, to the headworks loading of the pollutant, Linfl. ation of an allowable loading based upon sludge digestion inhibition, AHLdgstr, from a sludge digester inhibition criteria, Cdgstinhib, for a non-conservative pollutant. ine the partitioning factor for a particular pollutant, the POTW’s influent and sludge must be routinely sampled for that pollutant.
Although
Then if If so
The presum
Ther
for calculating AHLs for non
The partitioning factor enables calcul
To determ
P-7

The factor Cdgstr/Linfl expresses non-conservative pollutant removals to sludge. Non-conservative pollutant removals to sludge are highly variable, and are dependent on such factors as wastewater temperature, ambient air temperature, biodegradation rates (which are temperature dependent), aeration rates, and POTW influent flow. Because non-conservative pollutant removals to sludge are highly variable, the variability in non-conservative pollutant sludge partitioning factors should be addressed in the local limits development process. The procedures and recommendations presented in this manual for addressing removal efficiency variability for conservative pollutants (e.g., the calculation of mean removals and the decile approach) can be extended to addressing variability in non-conservative pollutant sludge partitioning factors. In calculating sludge AHLs, the sludge partitioning factor should be used in place of the removal efficiency for non-conservative pollutants.
P-8

APPENDIX Q -METHODS FOR HANDLING DATA BELOW DETECTION LEVEL
The occurrence of values below the detection limit (DL) in environmental data sets is a major statistical complication. Uncertainty about the actual wastewater treatment plant influent and effluent values below the DL can bias subsequent statistical analyses to determine the removal efficiencies.
The various approaches to handling below detection level (BDL) data can be broken into three main categories:
C Regression order statistic (ROS) and probability plotting (MR) methods C Maximum likelihood estimation (MLE) methods C Simple replacement of a single value (e.g., detection limit or one half detection limit).
Although this discussion focuses on handling data below the detection limit, the same techniques can be applied to those data below the minimum level of quantitation (ML) as well. These methods can be applied by those without a background in statistics. However, EPA strongly recommends a statistician perform these data manipulations.
REGRESSION ORDER STATISTIC (ROS) AND PROBABILITY PLOTTING (MR) METHODS
Both the original ROS and the MR methods are based on ordered statistics of observed data and the assumption that data come from a normal or log-normal distribution. If Y is from a normal distribution with mean : and standard deviation F (Y ~ N(:,F)) and Z is from a normal distribution with mean 0 and standard deviation 1 (Z ~ N(0, 1)), statistical theories show that Y = :+ F Z when Y and Z are at the same percentiles in their respective distributions. For a given observation (sampling result) Y that is above the detection limit, we can calculate the “order statistic”, i.e., the proportion of observations that are less than Y. This order statistic of Y is an estimate of the percentile. The corresponding Z value is available by either using existing computer program or checking the normal distribution table. In other words, we have a list of observations that are above the detection limit (Y1, Y2, ..., Ym) and a list of Z values (Z1, Z2, ..., Zm) that are of the same percentiles as the respective Y values. By performing a regression analysis of Y against Z, the resulting intercept and slope are estimates of the mean and standard deviation of the distribution of Y.
When the data are from a log-normal2 distribution, a log transformation is needed before the regression. The estimated mean and standard deviation is for the log-transformed variable. To convert the estimates to the original metric, the standard log-normal distribution results should be used. For example, if Y is from a log-normal distribution, and estimated mean and variance for log(Y) are : and F, the mean of Y is and the
+ variance of Y is e2µ σ 2
eσ 2
− 1 .
Alternatively, one may use the regression equation to “fill in” the missing (BDL) values. This is possible because we can calculate the order statistics for all BDL values. For example, suppose we have 20 out of 100 observations are BDL. The order statistics for the 20 BDL values are 0.01, 0.02, ..., 0.20. Using these order statistics, we can get the corresponding Z values Z1, Z2, ..., Z20. Substitute these Z values into the regression model, we have the 20 fill-in Y values.
2 Log-normal distributions are probability distributions which are closely related to normal distributions: if X is a normally distributed random variable, then exp(X) has a log-normal distribution. In other words: the natural logarithm of a log-normally distributed variable is normally distributed.
Q-1

To recap, we first define the variables used in this method:
n = Total number of observations k = Number of BDL observations Yi= Value of the ith ranked observation
To utilize the ROS method, data are first ranked from smallest to largest so that Yn is the largest data value and Y1 through Yk are the unknown BDL values. If an approximately normal distribution is expected, each Yi is plotted on the y-axis against the expected normal order statistic Zi for each rank i. The following linear regression is used to obtain : and F, using only the points above the DL (i.e., i = k+1,...,n).
Yi = :+ F Zi
One may use the estimated intercept and slope as the mean and standard deviation. Alternatively, one may use the above equation to obtain appropriate “fill-in” values for each of the k BDLs using the Z-statistic. The mean and standard deviation are then calculated using traditional formulas applied to both the observed and filled-in data. Thus, the estimated data are based on the assumption of normality, while the observed data are used directly with no assumption about their distribution. This method is relatively robust to departures from normality or lognormality (Gilliom and Helsel 1986).
If a distribution is expected to be skewed, then log(Yi) is plotted against Zi and the fitted data and the observed data are transformed back to original units from which the mean and standard deviation are calculated (Gilliom and Helsel 1986). Transformation of the data, rather than the summary statistics, avoids inherent transformation bias (Helsel 1990).
MR METHOD
The MR method, an extension of the ROS method, accounts for multiple detection limits. When there is only one detection limit, the k-BDL values are assigned order statistics of 1 through k. When there are multiple detection limits, it is not obvious how to assign the order statistic for some of the data, both below or above some detection limits. For example, suppose we have the following five observations: <100, 110, <200, 250, and 300. It is obvious that the two largest observations, 250 and 300 should receive order statistics of 4 and 5. But the rest is not clear, because the value labeled as <200 can be 199 or 9. Helsel and Cohn (1988) developed a plotting position method for assigning order statistics when there are multiple detection limits. The idea is that although we don’t know exactly where the value, say <200, should fall, we can lay out all possible positions for this particular value and take the average rank of all possible ranks. For example, the value labeled as <200 can be the smallest (rank 1), the second smallest (rank 2), or the third smallest (rank 3), the average rank is (1+2+3)/3 = 2. The value 110 can be the second smallest or the third smallest, therefore a rank of (2+3)/2 = 2.5. Finally, the observation <100 receives a rank of (1+2)/2=1.5. Once the order statistics are assigned, one may use the same regression analysis method in the ROS method. When there is only one detection limit, the MR method is the same as the ROS method.
Helsel and Cohn (1988) found that if a single estimating method for several descriptive statistics is desired and the sampling distribution of a data set is unknown, the MR method should be utilized. The actual plotting procedure for the MR method is detailed in Appendix B of Estimation of Descriptive Statistics for Multiple Censored Water Quality Data (Helsel and Cohn, 1988).
Q-2

MAXIMUM LIKELIHOOD ESTIMATION (MLE) METHOD
The MLE method is based on a specific probabilistic assumption about the observations. For example, suppose the data we observed (Y1, Y2, ..., Yn) are from a normal distribution with unknown mean and standard deviation. The likelihood of observing a specific value, say Yi, is calculated by the normal distribution density function:
(Yi −µ )2
( ) = 2π σ 1
e −
2σ 2L Yi
The likelihood for a BDL value is:
2
e − 1
22 2
π σ σ
X − µ
DL( ) = ∫ dXL Yk − ∞
The likelihood of observing all the data (Y1, Y2, ..., Yn), both below and above the detection limit is the product of all individual likelihoods. The likelihood of observing all data is a very complicated function of : and F. A different set of : and F values will lead to a different likelihood value. The maximum likelihood estimator is the pair of : and F values that maximize the likelihood function. Because the likelihood function is often very complicated, computation of the MLE method is difficult.
Gilliom and Helsel (1986) found that the ROS and the MR methods appear to be more robust to departures from distributional assumptions.
MLE methods have been shown to have the smallest mean-squared error (i.e., higher accuracy) of available techniques when the data distribution is exactly normal or lognormal (Harter and Moore 1966). However, simulation results indicate that ROS and MR methods are superior when distribution shape population is unknown (Gilliom and Helsel 1986).
In a simulation study by Newman et al. (1989) comparing mean and standard deviation estimates between MLE and ROS, the results were similar. However, the MLE method provided slightly more accurate results when BDL values comprised less than 30 percent of the data set, while ROS methods provided slightly more accurate results when BDL values represented 30 percent or more.
SIMPLE SUBSTITUTION METHODS
Simple substitution methods simply replace the below detection value with another value, such as zero, the detection limit, or one-half the detection limit. Both ROS and MLE methods offer substantial advantages over most simple replacement methods (Gilbert 1987, Gleit 1985, Helsel and Gilliom 1986, Newman et al.1989).
In general, replacement methods result in a greater bias when calculating the mean or standard deviation. Additionally, their relative performance worsens as the proportion of BDLs increases (Gilliom and Helsel 1986). Helsel (1989) reasons that because large differences may occur in the resulting estimates for any given population, and because the choice of the replacement value is essentially arbitrary without some knowledge of instrument readings below the reporting limit, estimates resulting from simple substitution are not defensible.
Q-3

CONCLUSION
The MR method is most applicable for use in local limits development because of the data set’s multiple detection limits and unknown parent distribution. Additionally, the MR method is recommended when the data set contains a relatively high percentage of BDL values.
Further information on statistical methods can be found in the literature listed below.
LITERATURE REVIEW LIST/REFERENCES
Gilliom and Helsel 1986. Estimation of distribution parameters for censored trace level water quality data: 1 Estimation techniques. Water Resources Research 22:135-146.
Gleit 1985. Estimation for small normal data sets with detection limits. Environmental Science Technology 19:1201-1206.
Harter and Moore 1966. Local-Maximum-Likelihood estimation of the parameters of three-parameter lognormal populations from complete and censored samples. Journal of American Statistical Association 61:842-851.
Helsel, D. R. 1990. Less Than Obvious: Statistical treatment of data below the detection limit. Environmental Science and Technology 24:1766-1774.
Helsel and Cohn 1988. Estimation of Descriptive Statistics for Multiple Censored Water Quality Data. Water Resources Research 24:1997-2004.
Newman, Dixon, Looney, and Pinder 1989. Estimating the mean and variance for environmental samples with below detection limit observations. Water Resources Bulletin 25:905-916.
Porter, Ward, and Bell 1988. The Detection Limit: Water quality monitoring data are plagued with levels of chemicals that are too low to be measured precisely. Environmental Science Technology Vol. 22, No. 8.
Travis and Land. 1990. Estimating the Mean of Data Sets with Nondetectable Values. Environmental Science Technology Vol. 24, No. 7.
Q-4

ATTACHMENT - DESCRIPTION OF THE MR METHOD
Method:
(1) If an analytical result is reported as ND (to be referred to as a nondetect), set the result ci = 1. Annotate the result with a “<” and consider this observation to be “< a detection limit.”
(2) Divide the observations into two groups: Nondetects, those observations annotated with a “<” sign, and detects.
(3) Let m = number of distinct detection limits.
(4) Let Aj = number of detected observations at or above the jth detection limit (j = 1,...,m) and below the next highest detection limit.
(5) Let Bj = number of detected and nondetected observations below the jth detection limit (j = 1,...,m).
(6) Let pe,j = pe,j+1 + (Aj/[Aj + Bj])(1 - pe,j+1), and solve iteratively for j = m,m-1,...,2,1. By convention, pe,m+1 = 0.
(7) Determine plotting positions, p(i), for detected observations as:
p(i) = (1 - pe,j) + (pe,j - pe,j+1)@r/(Aj + 1), where r is the rank of the ith observation above the jth detection limit. If detected observations are “tied,” arbitrarily order the “tied” observations before assigning ranks. Whether the “tied” observations are arbitrarily ordered or assigned the same mid-rank (average of the corresponding ranks) is expected to be of negligible importance. If detected observations are present below the lowest detection limit, assume the “0th detection limit” is 0, and consequently pe,0 = 1.
(8) Assign plotting positions, pc(i), for nondetected observations as:
pc(i) = (1- pe,j)@r/(Cj + 1), r = 1,...,Cj. Cj is the number of nondetected values known only to be less than the jth detection limit (j = 1,...m). The formula for Cj is: Cj = Bj - (Aj-1 + Bj-1), where A0 = B0 = 0. Plotting positions are therefore assigned separately within the j groups of nondetects (j=1,...,m).
(9) Perform a simple linear regression using only the detected observations. The natural logarithm of the detected observations (zi = ln(yi)) is the dependent variable, and the normal quantile associated with the corresponding plotting position (M-1(p(i))) is the independent variable, where M-1(@) is the normal quantile.
^ ^ ^(10) Use the estimated regression line (zi = b0 + b1@M-1(pc(i))) to “fill in” (using the terminology of Helsel
and Cohn) estimated natural logarithm values for nondetected observations, based on the normal quantile associated with the calculated plotting position (pc(i)).
(11) Calculate a natural log mean (:̂) and log standard deviation (F̂) of the detected and “filled in” observations using the formulas below. Assume zi = ln(yi), where zi represents the natural logarithm of detected observations where available, and "filled in" estimated natural logarithm values where nondetects were observed.
Q-5

(1)
(2)
(12) Use the values of : ^ and F^ to estimate a 90th percentile using a lognormal distribution: 90 = exp (: ^
+ 1.282@F^ ).
An example of the MR method is given below.
Comments:
Although the algorithm for determining plotting positions when multiple detection limits are present appears rather cumbersome, as described in the 12-step process above, the process of fitting a regression line to order statistics is well-established as a method for determining parameters of a distribution. method utilizes plotting positions to “spread” nondetected observations along a continuum, rather than simply substituting an arbitrary value for each nondetected measurement. values to be “spread out” rather than all fixed at a single point, as would be the case with simple substitution methods.
The MR method described above directly mimics the methods of Helsel and Cohn. article by Helsel and Cohn contains an inaccurate formula for Cj, which has been revised above. the article did not address ties in detected observations and detected observations below the lowest detection limit.
At least two detected observations are necessary to estimate a regression line. , this procedure is not useful when 0 or only 1 detected observation is present.
Software which utilizes the MR method to compute summary statistics is available. The feasibility of utilizing the software available at this site for implementation among numerous POTWs must be explored further. For example, the software is restrictive in some ways, such as the format of data which can be processed.
Reference:
Helsel, D.R., and T.A. Cohn. Estimation of Descriptive Statistics for Multiple Censored Water Quality Data. Water Resources Research 24:1997-2004.
P
The ROS
In practice, one would expect nondetected
However, the In addition,
These questions have been addressed in Steps 7 and 9 above.
Consequently
1988.
Q-6

EXAMPLE OF THE MR METHOD
Suppose we have a set of data from multiple sources with varying detection limits. When combined, the data set is ordered as follow:
Data Summary
<50 <200 <400 100 300 500 <50 <200 <400 100 300 500 <50 <200 <400 700
1000 1200
In order to provide estimates of the mean and standard deviation, it is necessary to fill-in the non-detected values. Once the non-detected values are filled-in, sample mean and standard deviation can be estimated. The following are the MR steps for filling in the nondetected values.
1. Summary statistics:
n = 18m = 3 (1st detection limit = 50, 2nd detection limit = 200, 3rd detection limit = 400)
A1 = 2 (2 detects $50 but <200)A2 = 2 (2 detects $200 but <400)A3 = 5 (5 detects $400)
B1 = 3 (3 nondetects <50)B2 = 8 (3 nondetects <50, 3 nondetects <200, and 2 detects <200)B3 = 13 (3 nondetects <50, 3 nondetects <200, 3 nondetects <400, 2 detects <200, and 2 detects <400)
C1 = 3 (3 nondetects <50)C2 = 3 (3 nondetects <200)C3 = 3 (3 nondetects <400)
pe,3 = pe,4 + (A3/[A3 + B3])(1 - pe,4) = 0 + (5/[5+13])@1 = 0.278pe,2 = pe,3 + (A2/[A2 + B2])(1 - pe,3) = 0.278 + (2/[2+8])@(1-0.278) = 0.422pe,1 = pe,2 + (A1/[A1 + B1])(1 - pe,2) = 0.422 + (2/[2+3])@(1 - 0.422) = 0.653
Q-7

-----------------------------------------------------------------------------------------------------------------
------------------------------------------------------------------------------------------------------------------
-----------------------------------------------------------------------------------
2. Determination of plotting positions:
Nondetected observations: Plotting Position
xi j r pe,j Cj pc(i) = (1- pe,j)@r/(Cj + 1)
<50 1 1 0.653 3 0.087 <50 1 2 0.653 3 0.173 <50 1 3 0.653 3 0.260
<200 2 1 0.422 3 0.144 <200 2 2 0.422 3 0.289 <200 2 3 0.422 3 0.433
<400 3 1 0.278 3 0.181 <400 3 2 0.278 3 0.361 <400 3 3 0.278 3 0.542
Detected observations: Plotting Position
xi j r pe,j pe,j+1 Aj p(i) = (1 - pe,j) + (pe,j - pe,j+1)@r/(Aj + 1)
100 1 1 0.653 0.422 2 0.424 100 1 2 0.653 0.422 2 0.500
300 2 1 0.422 0.278 2 0.626 300 2 2 0.422 0.278 2 0.674 500 3 1 0.278 0 5 0.769 500 3 2 0.278 0 5 0.815 700 3 3 0.278 0 5 0.861
1000 3 4 0.278 0 5 0.907 1200 3 5 0.278 0 5 0.954
3. Linear regression
A simple linear regression is then performed using the following detected observations and their associated plotting points. The regression is based on zi as the dependent variable and p(i) as the independent variable.
xi zi = ln(xi) p(i) M-1(p(i))
100 4.605 100 4.605 300 5.704 300 5.704 500 6.215 500 6.215 700 6.551
1000 6.908 1200 7.090
0.424 -0.192 0.500 0.000 0.626 0.321 0.674 0.451 0.769 0.736 0.815 0.896 0.861 1.085 0.907 1.323 0.954 1.685
Q-8

------------------------------------------------------------------------
The regression equation based on these nine detected observations is:
^ zi = 4.9614 + 1.4186@M-1(p(i))
4. Fill-in
This equation is used to “fill in” estimated nondetect values for the nine nondetects above. The results of the calculation are shown below:
^pc(i) M-1(pc(i)) zi
<50 0.087 <50 0.173 <50 0.260 <200 0.144 <200 0.289 <200 0.433 <400 0.181 <400 0.361 <400 0.542
-1.360 3.032 -0.942 3.625 -0.643 4.049 -1.063 3.453 -0.556 4.173 -0.169 4.722 -0.912 3.668 -0.356 4.456 0.106 5.112
^The z^ 2 are shown below:
4.605 5.704 6.551 3.032 3.453 3.668 4.605 6.215 6.908 3.625 4.173 4.456 5.704 6.215 7.090 4.049 4.722 5.112
i and the zi from the two tables above are then combined to estimate a natural log mean and a log^standard deviation. The data and calculated values for : and F
^ : = 4.9937 ^F^ 2 = 1.5632 (F = 1.2503)
^ ^The calculated values for : and F can then be used for estimating the arithmetic mean of the sample: m = exp( ^ + 0.5 F: ^ 2) = 322.241 and sample standard deviation s = m e $σ 2
1 − = 626.168. In some instances, one may ^be interested in the 90th percentile of the data, which can be estimated as P90 = exp (: + 1.282@F^ ) = 732.585.
It is worthwhile to note that these calculations are based on the assumption that the data follow a log-normal distribution. For most water quality related variables, such as BOD concentration, the log-normal distribution is appropriate. However, when percent removal is the variable of concern, log-normal is no longer an appropriate probability distribution. Instead, one may apply the MR method to the concentration variables first and calculate the percent removal after the non-detected concentration values have been filled-in.
Q-9
xi

This page intentionally left blank.
Q-10

APPENDIX R -PRIORITY POLLUTANT REMOVAL EFFICIENCIES
Priority Pollutant Removal Efficiencies (%) Through Primary Treatment*
Priority Pollutant Median Number of POTWs with Removal Data**
METAL/NONMETAL INORGANICS Cadmium 15 6 of 40 Chromium 27 12 of 40 Copper 22 12 of 40 Cyanide 27 12 of 40 Lead 57 1 of 40 Mercury 10 8 of 40 Nickel 14 9 of 40 Silver 20 4 of 40 Zinc 27 12 of 40
ORGANICS Benzene 25 8 of 40 Chloroform 14 11 of 40 1,2-trans-Dichloroethylene 36 9 of 40 Ethylbenzene 13 12 of 40 Naphthalene 44 4 of 40 Phenol 8 11 of 40 Butyl benzyl phthalate 62 4 of 40 Di-n-butyl phthalate 36 3 of 40 Diethyl phthalate 56 1 of 40 Tetrachloroethylene 4 12 of 40 1,1,1-Trichloroethane 40 10 of 40 Trichloroethylene 20 12 of 40
* Pollutant removals between POTW influent and primary effluent. From Fate of Priority Pollutants in Publicly Owned Treatment Works, Volume I (EPA 440/1-82/303), U.S. Environmental Protection Agency, Washington, D.C., September 1982, p. 61.
** Median removal efficiencies from a data base of removal efficiencies for 40 POTWs. Only POTWs with average influent concentrations exceeding three times each pollutant’s detection limit were considered.
Source: U.S. EPA’s Guidance Manual on the Development and Implementation of Local Discharger Limitations Under the Pretreatment Program, December 1987, p. 3-55.
R-1

Priority Pollutant Percent Removal Efficiencies (%) Through Activated Sludge Treatment*
Priority Pollutant Range
METALS/NONMETAL INORGANICS** Arsenic 11-78 Cadmium 25-99 Chromium 25-97 Copper 2-99 Cyanide 3-99 Lead 1-92 Mercury 1-95 Nickel 2-99 Selenium 25-89 Silver 17-95 Zinc 23-99
31 33 68 67 41 39 50 25 33 50 64
ORGANICS** 44 50 50 50 67 36 40 37 75 47 50 39 39 76 50 80 75 75
67 91 80 96 67 83 67 91 86 97 62 77 78 90 68 86 90 98 72 87 67 92 64 87 62 90 86 95 80 93 93 98 85 94 89 98
Anthracene 29-99 Benzene 25-99 Chloroform 17-99 1,2-trans-Dichloroethylene 17-99 Ethylbenzene 25-99 Methylene chloride 2-99 Naphthalene 25-98 Phenanthrene 29-99 Phenol 3-99 Bis (2-ethylhexyl) phthalate 17-99 Butyl benzyl phthalate 25-99 Di-n-butyl phthalate 11-97 Diethyl phthalate 17-98 Pyrene 73-95 Tetrachloroethylene 15-99 Toluene 25-99 1,1,1-Trichloroethane 18-99 Trichloroethylene 20-99
Second Decile Median Eight
Decile Number of POTWs with Removal Data
45 53 5 of 26 67 91 19 of 26 82 91 25 of 26 86 95 26 of 26 69 84 25 of 26 61 76 23 of 26 60 79 20 of 26 42 62 23 of 26 50 67 4 of 26 75 88 24 of 26 79 88 26 of 26
5 of 2618 of 2624 of 2617 of 2625 of 2626 of 2616 of 266 of 26
19 of 2625 of 2616 of 2619 of 2615 of 262 of 26
26 of 2626 of 2623 of 26 25 of 26
* Pollutant removals between POTW influent and secondary effluent (including secondary clarification).Based on a computer analysis of POTW removal efficiency data (derived from actual POTW influent and effluent sampling data) provided in U.S. EPA’s Fate of Priority Pollutants in Publicly Owned TreatmentWorks, Volume II (EPA 440/1-82/303), September 1982.
** For the purpose of deriving removal efficiencies, effluent levels reported as below detection were set equalto the reported detection limits. All secondary activated sludge treatment plants sampled as part of the study were considered.
Source: U.S. EPA’s Guidance Manual on the Development and Implementation of Local Discharger Limitations Under the Pretreatment Program, December 1987, p. 3-56.
R-2

Priority Pollutant Removal Efficiencies (%) Through Trickling Filter Treatment*
Priority Pollutant
CadmiumChromiumCopperCyanideLeadMercuryNickelSilverZinc
BenzeneChloroform1,2-trans-DichloroethyleneEthylbenzeneMethylene chlorideNaphthalenePhenolBis (2-ethylhexyl) phthalateButyl benzyl phthalateDi-n-butyl phthalateDiethyl phthalateTetrachloroethyleneToluene1,1,1-Trichloroethane Trichloroethylene
Range Second Decile Median Eighth
Decile Number of POTWs with Removal Data
METALS/NONMETAL INORGANICS** 93 6 of 11 71 9 of 11 89 9 of 11 79 8 of 11 70 6 of 11 62 9 of 11
7 9 of 11 86 8 of 11 81 9 of 11
5
33-96 5-92
12-97 7-88 4-84
14-80 7-72
11-93 14-90
33 68 34 55 32 61 33 59 25 55 33 50
1 9 38 66 34 67
1 2
ORGANICS** 5-98
21-94 14-99 45-97 5-98
33-93 50-99 4-98
25-90 29-97 17-75 26-99 17-99 23-99 50-99
50 75 50 73 50 50 50 80 28 70 40 71 75 84 21 58 37 60 41 60 40 57 53 80 80 93 75 89 67 94
93 7 of 11 84 9 of 11 96 7 of 11 91 10 of 11 85 10 of 11 87 6 of 11 96 8 of 11 81 10 of 11 77 9 of 11 82 10 of 11 67 8 of 11 93 10 of 11 97 10 of 11 97 10 of 11 98 10 of 11
* Pollutant removals between POTW influent and secondary effluent (including secondary clarification). Based on a computer analysis of POTW removal efficiency data (derived from actual POTW influent and effluent sampling data) provided in U.S EPA’s Fate of Priority Pollutants in Publicly Owned Treatment Works, Volume II, (EPA 440/182/303), September 1982.
** For the purpose of deriving removal efficiencies, effluent levels reported as below detection were set equal to the reported detection limits. All secondary trickling filter plants sampled as part of the study were considered.
Source: U.S. EPA’s Guidance Manual on the Development and Implementation of Local Discharger Limitations Under the Pretreatment Program, December 1987, p. 3-57.
R-3

Priority Pollutant Removal Efficiencies (%) Through Tertiary Treatment*
Priority Pollutant Range
METALS/NONMETAL INORGANICS** Cadmium 33-81 Chromium 22-93 Copper 8-99 Cyanide 20-93 Lead 4-86 Mercury 33-79 Nickel 4-78 Silver 27-87 Zinc 1-90
Second Decile Median Eighth
Decile
50 50 62 72 58 85 32 66
9 52 43 67
7 7 55 62 50 78
1 1
ORGANICS** 40 50 32 53 50 83 80 89 31 57 33 73 80 88 59 76 50 63 27 50 29 38 80 91 83 94 79 94 62 93
54 2 of 4 64 3 of 4 93 2 of 4 94 3 of 4 78 4 of 4 86 3 of 4 96 4 of 4 94 4 of 4 85 4 of 4 70 4 of 4 50 3 of 4 97 4 of 4 97 4 of 4 97 4 of 4 98 4 of 4
Benzene 5-67 Chloroform 16-75 1,2-trans-Dichloroethylene 50-96 Ethylbenzene 65-95 Methylene Chloride 11-96 Naphthalene 25-94 Phenol 33-98 Bis (2-ethylhexyl) phthalate 45-98 Butyl benzyl phthalate 25-94 Di-n-butyl phthalate 14-84 Diethyl phthalate 20-57 Tetrachloroethylene 67-98 Toluene 50-99 1,1,1-Trichloroethane 50-98 Trichloroethylene 50-99
Number of POTWs with Removal Data
73 3 of 4 89 4 of 4 98 4 of 4 83 4 of 4 77 3 of 4 75 4 of 4 7 3 of 4
82 3 of 4 88 4 of 4
5
* Pollutant removals between POTW influent and tertiary effluent (including final clarification). Based on a computer analysis of POTW removal efficiency data (derived from actual POTW influent and effluent sampling data) provided in U.S. EPA’s Fate of Priority Pollutants in Publicly Owned Treatment Works, Volume II (EPA 440/1-82/303), September 1982. Tertiary treatment was taken to include POTWs with effluent microscreening, mixed media filtration, post aeration, and/or nitrification/denitrification.
** For the purpose of deriving removal efficiencies, effluent levels reported as below detection were set equal to the reported detection limits. All tertiary treatment plants sampled as part of the study were considered.
Source: U.S. EPA’s Guidance Manual on the Development and Implementation of Local Discharger Limitations Under the Pretreatment Program, December 1987, p. 3-58.
R-4
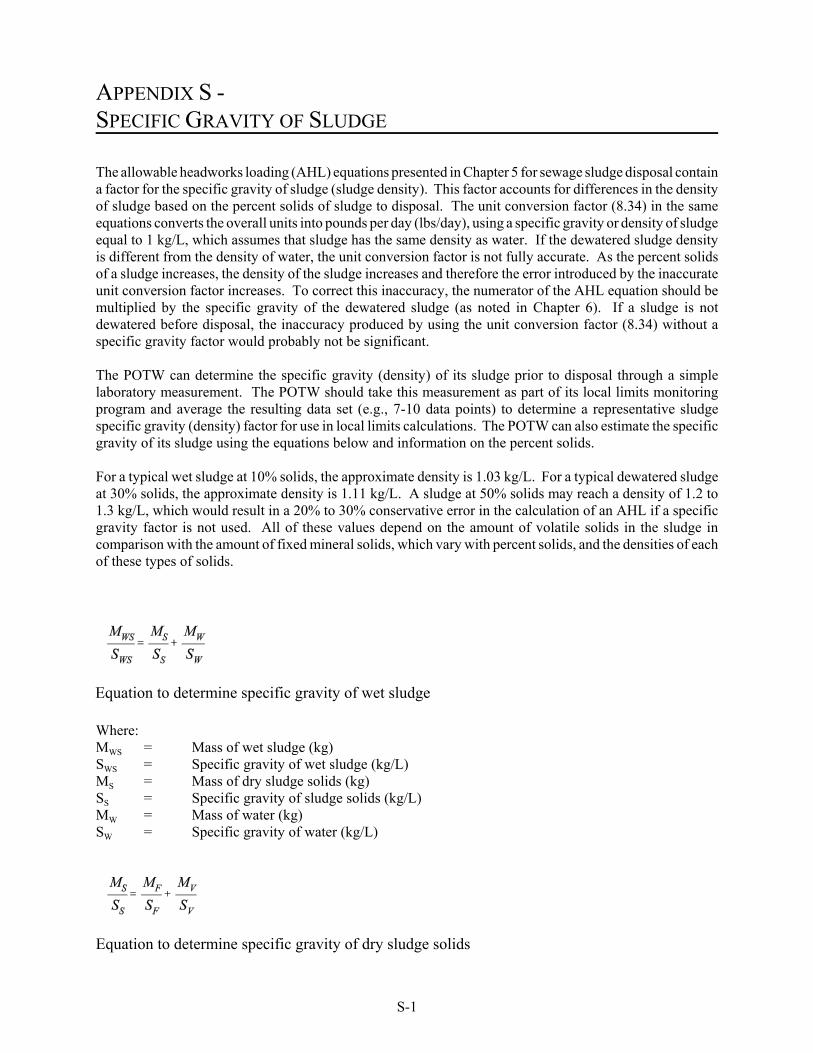
APPENDIX S -SPECIFIC GRAVITY OF SLUDGE
Equation to determine specific gravity of wet sludge
The allowable headworks loading (AHL) equations presented in Chapter 5 for sewage sludge disposal contain a factor for the specific gravity of sludge (sludge density). This factor accounts for differences in the density of sludge based on the percent solids of sludge to disposal. e unit conversion factor (8.34) in the same equations converts the overall units into pounds per day (lbs/day), using a specific gravity or density of sludge equal to 1 kg/L, which assumes that sludge has the same density as water. sludge density is different from the density of water, the unit conversion factor is not fully accurate. of a sludge increases, the density of the sludge increases and therefore the error introduced by the inaccurate unit conversion factor increases. inaccuracy, the numerator of the AHL equation should be multiplied by the specific gravity of the dewatered sludge (as noted in Chapter 6). dewatered before disposal, the inaccuracy produced by using the unit conversion factor (8.34) without a specific gravity factor would probably not be significant.
The POTW can determine the specific gravity (density) of its sludge prior to disposal through a simple laboratory measurement. The POTW should take this measurement as part of its local limits monitoring program and average the resulting data set (e.g., 7-10 data points) to determine a representative sludge specific gravity (density) factor for use in local limits calculations. ate the specific gravity of its sludge using the equations below and information on the percent solids.
For a typical wet sludge at 10% solids, the approximate density is 1.03 kg/L. For a typical dewatered sludge at 30% solids, the approximate density is 1.11 kg/L. ay reach a density of 1.2 to 1.3 kg/L, which would result in a 20% to 30% conservative error in the calculation of an AHL if a specific gravity factor is not used. ount of volatile solids in the sludge in comparison with the amount of fixed mineral solids, which vary with percent solids, and the densities of each of these types of solids.
Where: MWS = Mass of wet sludge (kg) SWS = Specific gravity of wet sludge (kg/L) MS = Mass of dry sludge solids (kg) SS = Specific gravity of sludge solids (kg/L) MW = Mass of water (kg) SW = Specific gravity of water (kg/L)
Th
If the dewatered As the percent solids
To correct this If a sludge is not
The POTW can also estim
A sludge at 50% solids m
All of these values depend on the am
Equation to determine specific gravity of dry sludge solids
S-1

Where: MF = Mass of fixed solids (kg) SF = Specific gravity of fixed solids (kg/L) MV = Mass of volatile solids (kg) SV = Specific gravity of volatile solids (kg/L)
The result from the second equation is used in the first equation.
Example
Sludge is 10% solids:
Assume solids consist of 33% fixed mineral solids with a specific gravity of 2.5 kg/L and 67% volatile solids with a specific gravity of 1.2 kg/L.
To determine the specific gravity of the dry sludge solids, use the second equation:
which results in Ss = 1.45 kg/L.
yields SWS = 1.03 kg/L.
Using this value in the first equation:
S-2

APPENDIX T -SLUDGE AHL EQUATIONS USING FLOW (IN METRIC UNITS)
Some POTWs may have sludge flow data available in dry metric tons per day, rather than MGD. The AHL equations for sludge disposal in Chapter 6 can be converted to use sludge flow data in these units. e of the equations in Chapter 6 are presented below using flows in dry metric tons per day. Use of these “dry flows” eliminates the need for the specific gravity factor in the equations.
GENERAL SLUDGE EQUATION FOR CONSERVATIVE POLLUTANTS
Where: LINFL = Allowable influent loading, lbs/day CCRIT = Sludge criteria, mg/kg dry sludge QSLDG = Total sludge flow to disposal, dry metric tons per day RPOTW = Removal efficiency across POTW (as decimal) 0.0022 = Unit conversion factor
LAND APPLICATION
As explained in Chapter 6, determining the land application sludge criteria for use in the general sludge equation requires that the POTW first convert 40 CFR §503 Table 2 and Table 4 sludge criteria into values in mg/kg of dry sludge units. Table 4 criteria are in metric units (kg/ha), they must be converted into English units (lbs/acre) so that they can be used with the equations in Chapter 6 which use other English units (e.g., flow in MGD, area in acres). provided in both metric and English units in Appendix E.
Another option is for POTWs to use the land application criteria equations in metric units (e.g., area in hectares, flow in dry metric tons per day), thus eliminating the need to convert Table 2 and Table 4 values to English units. These equations are provided below. These equations avoid the need for a specific gravity factor because they use also use a “dry flow” for sludge.
Where: CCRIT = Sludge criteria, mg/kg dry sludge CCUM = Federal (Table 2 of 40 CFR 503.13) or State land application cumulative pollutant loading
rate, kg/ha SA = Site area, hectares SL = Site life, years QLA = Sludge flow to bulk land application at an agricultural, forest, public contact, or reclamation
site, dry metric tons per day 0.365 = Unit conversion factor
Som
Because Table 2 and
Table 2 and Table 4 criteria are
T-1

Arsenic, Cadmium, Chromium, Nickel
Lead
Beryllium, Mercury, pollutants with State limits
Where: CCRIT = Sludge criteria, mg/kg dry sludge CANN = Federal (Table 4 of 40 CFR 503.13) or State land application annual pollutant loading rate,
kg/ha AWSAR = Annual whole sludge application rate, metric tons per hectare per year dry weight basis 0.001 = Unit conversion factor
INCINERATION
Sludge standards for maximum pollutant concentrations in sludge feed to the incinerator need to be in mg/kg dry sludge to be used in the equations at the beginning of Section 6.2.3 to calculate AHLs. disposing of sludge through incineration may already have sludge standards in mg/kg dry sludge, such as through a waste disposal agreement with the operator of a sludge incincerator. in Chapter 6, if no sludge standards have been calculated for the sludge feed to the incinerator, POTWs should use the Part 503 equations (provided below) to determine the maximum pollutant concentrations for the incinerator feed. These maximum concentrations are then used in the equations at the beginning of Section 6.2.3 to calculate AHLs.
Where: CCRIT = Sludge criteria, mg/kg dry sludge NESHAP = National emission standard for beryllium or mercury from 40 CFR Part 61, g/day NAAQS = National Ambient Air Quality Standard for lead, ug/m3
RSC = Federal risk specific concentration limit for arsenic, cadmium, chromium, or nickel from 40 CFR 503.43, ug/m3
CE = Control efficiency (removal efficiency) for sewage sludge incinerator for the given pollutant (as a decimal)
QINC = Sludge flow to incinerator (i.e., sewage sludge feed rate), dry metric tons per day DF = Dispersion factor, ug/m3/g/sec 0.1 and 86,400 = Unit conversion factors
For pollutants with State incinerator emissions standards, limits should be entered in g/day in place of the NESHAPs limits in the first equation above.
A POTW
As noted
T-2

APPENDIX U -POTW CONFIGURATIONS
The diagrams and discussions below demonstrate sampling locations to develop allowable headworks loadings (AHLs). For illustrative purposes, in this appendix all three plants must determine the AHLs based upon effluent limitations, secondary treatment inhibition, sludge digester inhibition, and sludge land application. Three different plants, with very different secondary treatment trains, are diagramed below along with sampling points for the AHL calculations.
Diagram A Raw Wastewater
Bar Screen and Grit Chamber
Effluent
Land Application
Primary Clarifier
Secondary Clarifier
High Rate Sludge
Digester
Gravity Thickener
Belt Filter Press
Secondary Clarifier
Trickling Filter
Sludge Degritter
Aeration Basin
Chlorine Contact
Chambers
X
X
X
X
A
B
C D
E
X
AHL FOR SECONDARY TREATMENT INHIBITION At this POTW a trickling filter and an activated sludge system (aeration basin) operated in parallel provide secondary treatment of the raw wastewater. The concentration of a pollutant that could cause inhibition at the trickling filter may be different than the pollutant concentration that causes inhibition (known as the inhibition threshold level) at the aeration basin. The plant must determine a headworks loading protective of these two secondary treatment units. Using Equation 5.10, an AHL based on secondary treatment inhibition can be calculated.
U-1

Trickling Filter
Aeration Basin
Where: AHLinhab = AHL based on aeration basin inhibition, lbs/day AHLinhtf = AHL based on trickling filter inhibition, lbs/day Cinhab = Inhibition criteria for aeration basin, mg/L Cinhtf = Inhibition criteria for trickling filter, mg/L Qpotw = Total POTW flow, MGD Rprim = Removal efficiency from headworks to primary treatment effluent as a decimal (See
Section 5.1.1 for calculating removal efficiencies) 8.34 = Unit conversion factor
The equations to calculate the AHL based on trickling filter and aeration basin inhibition includes an inhibition criteria for the trickling filter, Cinhtf, and aeration basin, Cinhab, respectively. Both equations use the same removal rate, Rprim, from the headworks to the primary treatment effluent. Rprim can be determined by sampling loading at point “A,” the headworks, and point “B,” primary clarifier effluent (See Section 5.1 for these calculations). Qpotw can be determined through flow sampling at point “A” as well. AHLab and the AHLtf would be calculated, pared and the more stringent selected.
AHL FOR SLUDGE DIGESTER INHIBITION This plant must determine a headworks loading protecting the high-rate sludge digester from inhibition. Using Equation 5.12, an AHL based on sludge digester inhibition can be calculated.
Where: AHLinhhrsd = AHL based on high-rate sludge digester inhibition, lbs/day Cinbhrsd = High-rate sludge digester inhibition criteria, mg/L Qhrsd = Sludge flow to high-rate sludge digester, MGD Rpotw = Plant removal efficiency from headworks to plant effluent (as decimal) 8.34 = Unit conversion factor
The equation to calculate the AHL based on high-rate sludge digester inhibition includes an inhibition criteria for the digester, Cinbhrsd, sludge flow to the digester, Qhrsd , and an overall plant removal rate from headworks to plant effluent, Rpotw. Qhrsd can be determined sampling flow at point “C,” the sludge wastestream from gravity thickener to digester. Rpotw can be determined by sampling at point “A,” headworks before the bar screen and grit chamber, and at point “E,” the effluent after the chlorine contact chambers.
com
bythe
U-2

AHL FOR EFFLUENT LIMITS The plant must determine headworks loading that would lead to effluent from its chlorine contact chambers (CCC) comply with NPDES Permit limits. Using Equation 5.5, the AHL based on NPDES Permit limit can be calculated.
Where:
AHLeffccc = AHL based on CCC effluent compliance with NPDES, lbs/day Cnpdes = NPDES permit limit, mg/L Qpotw = POTW Rpotw = Plant removal efficiency from headworks to plant effluent (as decimal) 8.34 = Conversion factor
The equation to calculate the AHL based on CCC effluent compliance with NPDES includes the NPDES permit limit, Cnpdes, total POTW flow, Qpotw, and an overall plant removal rate from headworks to plant effluent, Rpotw. Rpotw can be determined by sampling loading at point “A,” screen and grit chamber, and at point “E,” the effluent after the chlorine contact chambers. Qpotw can be determined through sampling flow at point “A” as well.
AHL FOR SLUDGE APPLICATION The plant must determine a headworks that would lead to sludge from the belt filter press suitable for land application. on sludge land application can be calculated.
Where: AHLsabfp = AHL based on compliance with sludge application standards, lbs/day Cslgstd = Sludge standard, mg/kg dry sludge PS = Percent solids of sludge leading to belt filter press Qbfp = Total sludge flow to belt filter press, MGD Rpotw = Plant removal efficiency from headworks to plant effluent (as decimal) Gsldg = Specific gravity of sludge leading to filter press, kg/L 8.34 = Unit conversion factor
The equation to calculate the AHL based on belt filter press sludge compliance with sludge standards includes the sludge limit, Cslgstd ; the flow, percent solids and specific gravity of sludge leading press, Qbfp, PS, and Gsldg, respectively; and the overall plant removal rate from headworks to plant effluent, Rpotw. Rpotw can be determined by sampling loading at point “A,” the headworks before the bar screen and grit chamber, and at point “E,” the effluent after the chlorine contact chambers. Qbfp, PS, and Gsldg, can be determined through sampling point “D” the sludge waste stream to the belt filter press.
flow, average, MGD
the headworks before the bar
Using equation 5.9 an AHL based
to the belt filter
U-3

AHL FOR SECONDARY TREATMENT INHIBITION At this POTW a standard rate trickling filter, a high rate trickling filter, and rotating biological contactors (RBCs) operated in parallel provide secondary treatment of the raw wastewater. Each of these biological units is preceded by a different primary clarifier. An AHL (to prevent inhibition) should be determined for each of these biological unit processes because:
Diagram B Raw Wastewater Effluent
A
Chlorine Contact
Chamber
Gravity Thickener
X
X
H
Land Application
RBCs
Bar Screen
Grit Chamber
Primary Clarifier #1
Std. Rate Trickling
Filter
Secondary Clarifier #1
High Rate Trickling
Filter
Primary Digester
Secondary Digester
Primary Clarifier #2
Primary Clarifier #3
Secondary Clarifier #2
Secondary Clarifier #3
Wet Well
Vacuum Filter
X
X
X
X
X
X
B
C
D
E
F
G
C The concentration of a pollutant that could cause inhibition at the standard rate trickling filter, high rate trickling filter, and RBCs are different.
C The design and operational loadings to each of the secondary treatment units are different and therefore loading is different.
C The primary clarifiers may have different removal efficiencies and therefore the pollutant concentrations to each of the secondary treatment unit may be different.
The three equations listed below can be used to calculate secondary treatment inhibition.
U-4

Standard Trickling Filter
High-Rate Trickling Filter
RBCs
Where: AHLinhstf = AHL based on standard trickling filter inhibition, lbs/day AHLinhhrtf = AHL based on high-rate trickling filter inhibition, lbs/day AHLinhrbc = AHL based on RBC inhibition, lbs/day Cinhstf = Inhibition criteria for standard trickling filter, mg/L Cinhhrtf = Inhibition criteria for high-rate trickling filter, mg/L Cinhrbc = Inhibition criteria for RBC, mg/L Qpotw = Total POTW flow, MGD Rprim1 = Removal efficiency from headworks to primary clarifier #1 effluent as a decimal (See
Section 5.1.1 for calculating removal efficiencies) Rprim2 = Removal efficiency from headworks to primary clarifier #2 effluent as a decimal Rprim3 = Removal efficiency from headworks to primary clarifier #3 effluent as a decimal 8.34 = Unit conversion factor
Each of the AHL equations has an inhibition criteria for each secondary treatment unit, Cinhstf , Cinhhrtf,, and Cinhrbc and removal rates from the headworks to corresponding primary clarifier unit effluent, Rprim1, Rprim2, and Rprim3. sampling locations “A” and “B” is used to calculate the removal efficiency from headworks to the primary clarifier #1 effluent, Rprim1. sampling locations “C” is used to calculate the removal efficiency from headworks to primary clarifier #2 effluent, Rprim2. sampling locations “A” and “D” is used to calculate the removal efficiency from headworks to primary clarifier #3 effluent, Rprim3. Qpotw can be determined at sampling point “A.” The AHLinhstf, AHLinhhrtf, and AHLinhrbc should be calculated, compared, and the most stringent (smallest) selected.
AHL FOR SLUDGE DIGESTER INHIBITION This plant must determine a headworks loading protecting both the primary and secondary sludge digesters from inhibition. on sludge digester inhibition can be calculated.
Primary Digester
Data fromData from “A”and
Data from
Using Equation 5.12, an AHL based
U-5

Secondary Digester
Where: AHLinbpd = AHL based on primary digester inhibition, lbs/day AHLinbsd = AHL based on secondary digester inhibition, lbs/day Cinbpd = Primary digester inhibition criteria, mg/L Cinbsd = Primary digester inhibition criteria, mg/L Qpd = Sludge flow to primary digester, MGD Qsd = Sludge flow to secondary digester, MGD Rpotw = Plant removal efficiency from headworks to plant effluent (as decimal) 8.34 = Unit conversion factor
The equations to calculate the AHL based on sludge digester inhibition include primary and secondary inhibition criteria, Cinbpd and Cinbsd, sludge flow to the primary and secondary digesters, Qpd and Qsd, and an overall plant removal rate from headworks to plant effluent, Rpotw. Qpd can be determined sampling flow at point “E,” the sludge wastestream to the primary digester. Qsd can be determined sampling flow at point “F,” the sludge wastestream from the primary digester to the secondary digester. Rpotw can be determined by sampling loading at point “A,” the headworks before the bar screen and grit chamber, and at point “H,” the effluent after the chlorine contact chambers. AHLinbpd and AHLinbsd should be calculated, compared and the more stringent selected.
AHL FOR EFFLUENT LIMITS The plant must determine headworks loading that would lead to effluent from its chlorine contact chambers (CCC) comply with NPDES Permit limits. it limit can be calculated.
Where: AHLeffccc = AHL based on CCC effluent compliance with NPDES, lbs/day Cnpdes = NPDES permit limit, mg/L Qpotw = POTW Rpotw = Plant removal efficiency from headworks to plant effluent (as decimal) 8.34 = Conversion factor
The equation to calculate the AHL based on CCC effluent compliance with NPDES includes the NPDES permit limit, Cnpdes, total POTW flow, Qpotw, and an overall plant removal rate from headworks to plant effluent, Rpotw. Rpotw can be determined by sampling at point “A,” the headworks before the bar screen and grit chamber, and at point “H,” the effluent after the chlorine contact chambers. Qpotw can be determined through sampling flow at point “A” as well.
byby
Using Equation 5.5, the AHL based on NPDES Perm
flow, average, MGD
U-6

AHL FOR SLUDGE APPLICATION The plant must determine a headworks that would lead to sludge from the vacuum filter suitable for land application. Using equation 5.9 an AHL based on sludge land application can be calculated.
Where:AHLsavf = AHL based on compliance with sludge application standards, lbs/dayCslgstd = Sludge standard, mg/kg dry sludgePS = Percent solids of sludge leading to vacuum filterQvf = Total sludge flow to vacuum filter, MGDRpotw = Plant removal efficiency from headworks to plant effluent (as decimal)Gsldg = Specific gravity of sludge leading to vacuum filter, kg/L8.34 = Unit conversion factor
The equation to calculate the AHL based on vacuum filter sludge compliance with sludge standards includesthe sludge limit, Cslgstd ; the flow, percent solids and specific gravity of sludge leading to the belt filter press,Qvf, PS, and Gsldg, respectively; and the overall plant removal rate from headworks to plant effluent, Rpotw.Rpotw can be determined by sampling at point “A,” the headworks before the bar screen and grit chamber, andat point “H,” the effluent after the chlorine contact chambers. Qvf, PS, and Gsldg, can be determined throughsampling at point “G” the sludge waste stream to the vacuum filter.
Diagram C Raw Wastewater Effluent
Landfill
X
A
F GE
2nd Stage Aeration
Basin
3rd Stage Aeration
Basin
1st Stage Clarifier
2nd Stage Clarifier
Final Clarifier
Ozone Treatment
Air Flotation Thickener
Primary Clarifier
1st Stage Aeration
Basin
Gravity Thickener
Plate and Frame Press
Sludge Digester
XX
X
XX
X
X
B DC H
U-7

1st Stage Aeration Basin
2nd Stage Aeration Basin
3rd Stage Aeration Basin
AHL FOR SECONDARY TREATMENT INHIBITION At this POTW three activated sludge units (aeration basins) operated in series provide secondary treatment of the raw wastewater. a pollutant entering the First Stage Aeration Basin would be different from the concentration of that pollutant entering the Second Stage Aeration Basin and the Third Stage Aeration Basin because of the removal occurring in each unit. be determined for each of these secondary treatment units.
Where: AHLinhab1 = AHL based on 1st Stage Aeration Basin inhibition, lbs/day AHLinhab2 = AHL based on 2nd Stage Aeration Basin inhibition, lbs/day AHLinhab3 = AHL based on 3rd Stage Aeration Basin inhibition, lbs/day Cinhab1 = Inhibition criteria for 1st Stage Aeration Basin, mg/L Cinhab2 = Inhibition criteria for 2nd Stage Aeration Basin, mg/L Cinhab3 = Inhibition criteria for 3rd Stage Aeration Basin, mg/L Qpotw = Total POTW flow, MGD Rprim = Removal efficiency from headworks to primary treatment effluent as a decimal (See Section
5.1.1 for calculating removal efficiencies) Rab1 = Removal efficiency from headworks to 1st Stage Aeration Basin effluent as a decimal Rab2 = Removal efficiency from headworks to 2nd Stage Aeration Basin effluent as a decimal 8.34 = Unit conversion factor
Each of the equations to calculate AHLs for secondary treatment has it own inhibition criteria for each basin, Cinhab1, Cinhab2, and Cinhab3 and corresponding removal rate, Rprim, Rab1, and Rab2, respectively, for the 1st, 2nd , and 3rd stage aeration basins. sampling locations “A” and “B” is used to determine the removal efficiency from headworks to primary clarifier effluent, Rprim. Data from sampling locations “A” and “C” is used to determine the removal efficiency from headworks to 1st stage clarifier effluent, Rab1. Data from sampling locations “A” and to determine the removal efficiency from headworks to 2nd stage clarifier effluent, Rab2. Qpotw can be determined by sampling at location “A.” The AHLinhab1, AHLinhab2 , and AHLinhab3 should be calculated, compared, and the most stringent (smallest) selected.
The concentration of
An AHL (to prevent inhibition) should
Data from
“D” is used
U-8

AHL FOR SLUDGE DIGESTER INHIBITION This plant must determine a headworks loading protecting the sludge digester from inhibition. Using Equation 5.12, an AHL based on sludge digester inhibition can be calculated.
Where: AHLinhsd = AHL based on sludge digester inhibition, lbs/day Cinhsd = Sludge digester inhibition criteria, mg/L Qsd = Sludge flow to sludge digester, MGD Rpotw = Plant removal efficiency from headworks to plant effluent (as decimal) 8.34 = Unit conversion factor
The equation to calculate the AHL based on high-rate sludge digester inhibition includes an inhibition criteria for the digester, Cinhsd, sludge flow to the digester, Qsd , and an overall plant removal rate from headworks to plant effluent, Rpotw. Qsd can be determined sampling flow at point “E,” the sludge wastestream from air flotation thickener to the digester. Rpotw can be determined by sampling loading at point “A,” the headworks before the bar screen and grit chamber, and at point “H,” the effluent after the ozone treatment unit.
AHL FOR EFFLUENT LIMITS The plant must determine headworks loading that would lead to effluent from its ozone treatment unit (OTU) comply with NPDES Permit limits. it limit can be calculated.
Where: AHLeffotu = AHL based on OTU effluent compliance with NPDES, lbs/day Cnpdes = NPDES permit limit, mg/L Qpotw = POTW Rpotw = Plant removal efficiency from headworks to plant effluent (as decimal) 8.34 = Conversion factor
The equation to calculate the AHL based on OTU effluent compliance with NPDES includes the NPDES permit limit, Cnpdes, total POTW flow, Qpotw, and an overall plant removal rate from headworks to plant effluent, Rpotw. Rpotw can be determined by sampling loading at point “A,” screen and grit chamber, and at point “H,” the effluent after the OTU. Qpotw can be determined through sampling flow at point “A” as well.
by
Using Equation 5.5, the AHL based on NPDES Perm
flow, average, MGD
the headworks before the bar
U-9

AHL FOR SLUDGE APPLICATION The plant must determine a headworks that would lead to sludge from the plate and frame press (PFP) suitable for land application. Using equation 5.9 an AHL based on sludge land application can be calculated.
Where:AHLsapfp = AHL based on compliance with sludge application standards, lbs/dayCslgstd = Sludge standard, mg/kg dry sludgePS = Percent solids of sludge leading to PFPQpfp = Total sludge flow to PFP, MGDRpotw = Plant removal efficiency from headworks to plant effluent (as decimal)Gsldg = Specific gravity of sludge leading to PFP, kg/L8.34 = Unit conversion factor
The equation to calculate the AHL based on PFP sludge compliance with sludge standards includes the sludgelimit, Cslgstd ; the flow, percent solids and specific gravity of sludge leading to the PFP, Qpfp, PS, and Gsldg,respectively; and the overall plant removal rate from headworks to plant effluent, Rpotw. Rpotw can bedetermined by sampling loading at point “A,” the headworks before the bar screen and grit chamber, and atpoint “H,” the effluent after the OTU. Qpfp, PS, and Gsldg, can be determined through sampling flow at point“E” the sludge waste stream to the PFP.
U-10

APPENDIX V -DOMESTIC POLLUTANT LOADINGS
Residential/Commercial Trunkline Monitoring Data
Pollutant Number of Detections
MinimumNumber of ConcentrationSamples Maximum
Concentration (mg/L)
Average Concentration
(mg/L)
0.088 0.007 0.216 0.42 0.11 0.008
0.007 0.006 1.2 0.034 0.74 0.14 0.37 0.082 0.27 3.4 2.04 0.058
0.031 0.031 0.161 0.087 0.054 0.002
1.6 0.047 30.2 0.7 0.7
1.052 0.019 1.28 0.231
0.115 0.3
0.255 0.989
28.8
Arsenic
Barium
Boron
Cadmium
Chromium (III)Chromium (T)CopperCyanide
Fluoride
Iron
Lead
Lithium
Manganese
Mercury
NickelPhosphate
Total Phosphorous
SilverZinc
Chloroform
1,1-Dichloroethene
1,1-Dichloroethane
Trans-1,2-Dichloroethene
Fluoranthene
Methylene Chloride
Phenols
Bis (2-ethylhexyl) Phthalate
Pyrene
Tetrachloroethene
1,2,4-Trichlorobenzene
Total BHC
4,4-DDD Total Endosulfan
(mg/L) INORGANICS
140 3 4
361 1
311 603 7 2
18 433 2 3
218 313 2 1
181 636
205 0.0004 3 0.04 4 0.1
538 0.00076 2 < 0.005
522 < 0.001 607 0.005 7 0.01 2 0.24
18 0.0002 540 0.001 2 0.03 3 0.04
235 < 0.0001 540 < 0.001 2 27.4 1 0.7
224 0.0007 638 0.01
ORGANICS 21 2 1 1 2 7 2 5 2 5 1
30 <0.002 29 0.005 28 0.026 28 0.013 5 0.00001
30 0.00008 2 0.00002 5 0.00002 3 0.00001
29 0.00001 3 <0.002
PESTICIDES 3 3 3
3 0.001 3 0.00026 3 0.002
0.069 0.008 0.026 0.013
<0.001 0.055
0.00003 0.022
<0.005 0.037 0.035
0.009 0.007 0.026 0.013 0.001 0.027
0.000025 0.006 0.0002 0.014 0.013
0.001 0.001 0.0004 0.0003 0.002 0.002
V-1

Source: U.S. EPA’s Supplemental Manual on the Development and Implementation of Local Discharge Limitations Under the Pretreatment Programs, May 1991. “Pollutant levels reported below specified detection limit were considered in the data analysis and, for the purpose of statistical analysis, were considered equal to the detection limit.”
V-2

APPENDIX W -BEST MANAGEMENT PRACTICES MINI-CASE STUDIES
POTWs can implement best management practice (BMP) programs to gain control over wastewater discharges from commercial sources. By developing a less formal source control program with emphasis on source control, education, BMPs, as-needed inspections, and individual or “general” permits, POTWs can gain additional control over uncontrolled wastewater discharges from commercial sources. Source control programs should place emphasis on certain specific pollutants of concern. For example, silver and mercury are often of great concern to POTWs because of NPDES permit requirements.
The commercial sources of wastewater that are addressed by BMP-based source control tend to have lower pollutant concentrations and loadings than other more traditional industrial facilities regulated by the traditional pretreatment program. Taken as a group, however, numerous uncontrolled commercial establishments may represent a significant source control opportunity that can lead to measurable improvement in environmental quality. Several pretreatment programs have documented pollutant reductions after the implementation of BMP and source reduction programs.
Several BMP/source control programs implemented at several POTWs are summarized in the following paragraphs to illustrate a variety of approaches that have been taken to utilize BMPs for the control of commercial sources of wastewater. Programs reviewed include: East Bay Municipal Utility District (EBMUD) in Oakland, California; Metropolitan Wastewater in San Diego, California; Seattle Metropolitan/King County in Washington State; Western Lake Superior Sanitary District, Duluth, Minnesota; and the Connecticut Department of Environmental Protection (CT DEP), Hartford, Connecticut.
EAST BAY MUNICIPAL DISTRICT (EBMUD), OAKLAND, CA
EBMUD has been issuing pollution prevention permits (PPPs) since 1988. EBMUD began their PPP program in response to tighter air emission standards and more stringent NPDES permit requirements. As a result, EBMUD had to augment headworks sampling and analysis programs for the development and local limits. Based on attentive tracking of regulatory requirements over the past 10 years, EBMUD has sequentially identified POCs, identified commercial users contributing those pollutants, and developed PPPs with best management practice requirements.
When EBMUD recognizes a pollutant of concern, they follow step-wise procedures. First, information on businesses and commercial activities that may be contributing the targeted POC is collected and refined. Next, EBMUD engages in an outreach program and works with the businesses to define BMPs. Finally, EBMUD issues the PPP and evaluates compliance. Generally, there is one sector of business activity that is responsible for the specific pollutant. For example, silver is linked to the photo finishers. EBMUD works with representatives of the commercial sector to research and develop BMPs that will effectively minimize the pollutant in effluent wastewater.
EBMUD believes that the most important aspect of a successful PPP program is education, outreach, and user awareness combined with an enforceable permit. When conducting outreach, EBMUD gets in touch with each user to confirm the nature of their business and the processes they use at the business that can contribute wastewater and pollutants of concern. The establishment is asked to participate in educational workshops to review EBMUD's concerns, review and refine preliminary methods to prevent pollutant releases and lay the groundwork for successful communications and understanding of the problem and the solution. Users are introduced to the permitting and enforcement process in a non-threatening forum. EBMUD’s inventory of users is based on water supply account information. Whenever a user opens a water account, it is
W-1

automatically characterized for wastewater and source control purposes. A revenue collection system ($3.25 per commercial account per month) assures adequate funding for the PPP program.
EBMUD staff researches ideas for generalized BMPs through discussions with the business sector and State trade group associations. Each of the EBMUD staff tracks one or more business sectors and are responsible for knowing current pollution control measures and trends. During the research phase of BMP development, each user that is a potential contributor of a POC is sent a letter to notify them that EBMUD is working on a PPP and reviewing the anticipated time frame for permit issuance.
The PPP includes similar BMPs for each permittee. Some examples include silver recovery canisters connected in series to optimize removal of silver with a required logging procedure that assures canisters are changed at the appropriate frequency to eliminate break through. EBMUD PPPs vary in length from two to 8 pages and are issued in industry group batches for a duration of 5 years. In the administration of their PPP program, EBMUD conducts visits/inspections of the permittees, provides follow up education, distributes fact sheets, procedures and posters illustrating acceptable waste and wastewater disposal procedures. During the life of a 5-year permit, EBMUD tries to inspect the permittee at least once or twice. Based on the findings of the initial visit, and the degree to which the permittee is implementing the prescribed BMPs, the follow up frequency is set. When EBMUD fails to get cooperation from businesses, they initiate enforcement actions. As an example, EBMUD sought and obtained a $27,000 penalty from a dry cleaner.
A partial list of the businesses for which EBMUD has developed BMPs and PPP permits includes:
• Photofinishers • Boat Yards • Dry Cleaners • Auto Repairs • Print Shop • Radiator Repair Shops • Furniture Stripping
METROPOLITAN WASTEWATER, SAN DIEGO, CA
Metropolitan Wastewater issues sector-specific BMP discharge authorizations to commercial customers. These authorizations require:
• Specific pollution prevention measures.
• An initial certification of compliance.
• On-going semi-annual “reminder” certifications for businesses to demonstrate familiarity with their pollution prevention measures.
Metropolitan Wastewater covers a variety of sectors with this program. General permits are issued to film processing and dry cleaners. The photo processing BMPs are based on the Code of Management Practice for Silver Dischargers (AMSA 1996) developed by the Silver Council in concert with the Association of Metropolitan Sewerage Agencies and EPA. Metropolitan Wastewater conducted workshops to review silver control BMPs with their users. Boat repair yards or dry docks are required to submit their own customized BMPs which are incorporated into a permit. Food establishment discharge permits are also issued and require grease removal equipment, operation and maintenance, and compliance with general and specific discharge prohibitions. Auto repair shops that have steam-cleaning operations are required to have a sump for all O&G
W-2

wastewater from steam cleaning operations. San Diego has initiated a more aggressive program to enforce grease trap cleaning particularly at food establishments. They have discovered that excessive amounts of grease buildup contribute to dry weather flows into San Diego and Mission Bay. Analytical/Research Labs are required to implement a solvent certification program that is very similar to the total toxic organic (TTO) certification program for metal finishers and electroplaters.
San Diego has a 301(h) waiver for their wastewater treatment facility, allowing conditional discharge of wastewater without full secondary treatment. One condition of the waiver requires the City to reexamine their local limits every year and reassess loadings from all sources (domestic, SIU, and non-SIU contributions). The IU is considered a "contributor" of a pollutant of concern (presently one of six heavy metals) if the user has one of the six metals in its effluent at a concentration that is two standard deviations above the average domestic concentration. Once the IU is deemed to be a “contributor” of a pollutant of concern, wastewater flow is evaluated to determine whether the load is significant enough to be assigned to the “allocated” versus “non-allocated” load for their local limits accounting procedures. When the load is significant, the user is included in the allocated portion of headworks load calculations and the user is required to comply with local limits. Users with minor concentrations or loadings of pollutants of concern are not required to comply with local limits. However, they may still be required to comply with BMPs and general permit requirements.
SEATTLE METROPOLITAN/KING COUNTY, WASHINGTON
Seattle Metropolitan /King County (Seattle Metro) has a very large and active pollution prevention program that has acquired a great deal of information on dental mercury source control. Dental facilities in the Seattle Metro collection system are subject to the mercury local limits. After strong lobbying by the Dental Association against mandatory BMPs, dental facilities currently have latitude in controlling mercury through BMPs. Seattle Metro has developed a variety of tools to control mercury, including:
• A certified list of the vendors and technologies that are able to achieve a 90% reduction in metals.
• Videotape on mercury and silver source control from dental offices entitled “Amalgam Waste Conference.”
• A dental facility waste management poster and a booklet entitled, “Waste Management Guidelines for Dental Facilities.”
• Records on the amount of amalgam that is being reclaimed by recyclers as a means of tracking the success of their education efforts.
• Voucher program that gives $500 to dental offices to obtain one of the approved metal removal units identified in the list above.
• Educational materials (posters, videos, booklets).
WESTERN LAKE SUPERIOR SANITARY DISTRICT (WLSSD), DULUTH, MINNESOTA
With support from the Great Lakes Protection Fund, the WLSSD conducted a two-year Mercury Zero Discharge Project to examine the sources of mercury to its wastewater treatment plant and to determine how to reduce or eliminate those sources. This project included cooperative initiatives with industries known to be discharging mercury, programs aimed at specific uses of mercury, a monitoring program to identify additional sources and a public awareness campaign. In addition to these external programs, WLSSD also examined its own facilities and practices.
W-3

WLSSD has authored the Blueprint for Mercury Elimination, Mercury Reduction Project Guidance for Wastewater Treatment Plants, March, 1997. Selected for an AMSA National Environmental Achievement Award for excellence in Public Information & Education, the document examines sources of mercury in the environment, reviews contributions to the wastewater collection system, and gives examples of success stories on mercury source reduction. Appendices to the document provide useful "how to" references for implementing a source reduction program, such as a sample news release for a mercury reduction project, sample letters to mercury contributors, telephone survey forms to interview possible contributors, survey forms for hospitals and dental offices.
CONNECTICUT DEPARTMENT OF ENVIRONMENTAL PROTECTION (CT DEP), HARTFORD, CONNECTICUT
In 1992, CT DEP began a Statewide general permit program. The program established requirements for industries that were not SIUs, regulated by CT DEP’s State-run pretreatment permitting program, but were a potential source of concern for POTWs. The general permitting program is “self implementing” and expects commercial establishments to be made aware of general permit program requirements by the local Town officials, the State, or through consultants. Thus, the general permitting program avoids the resource intensive individual permitting of traditional programs.
The program works in the following manner. An IU assesses their eligibility for a general permit (versus a traditional pretreatment permit). CT DEP encourages industries to determine eligibility for a general permit, as the permitting process is quicker and less costly for the IU and CT DEP. Each general permit identifies BMPs that must be followed by each permit holder. CT DEP conducts selective auditing and enforcement of general permit holders, and facilities that may have failed to register for a general permit. By publicizing the enforcement actions and penalties, industries are made aware of their duties to have a permit and comply with the BMPs, record keeping, monitoring, and where applicable, effluent limits. General permits developed by CT DEP include the following sectors:
1. Constructions and Operation of Certain Recycling Facilities 2. Car Wash Wastewater 3. Domestic Sewage of 50,000 gallons per day or 5% of the POTW Design Flow 4. Groundwater Contamination Recovery Systems 5. Hydrostatic Pressure Testing 6. Minor Boiler Blowdown 7. Minor Non-Contact Cooling Water 8. Minor Photographic Processing 9. Minor Tumbling and Cleaning of Parts Wastewater 10. Storm Water Associated with Industrial Activities 11. Storm Water and Dewatering Wastewaters - Construction Activities 12. Vehicle Service Floor Drain and Car Wash Wastewater 13. Storm Water Associated with Commercial Activities 14. Minor Printing and Publishing Wastewater 15. Water Treatment Wastewater - Commercial 16. Food Processing Wastewater 17. Public Swimming Pool Backwash 18. Water Softening/Treatment Unit Wastewater-Individual Homes (under development)
W-4

APPENDIX X -REGION 1, REASSESSMENT OF TECHNICALLY BASED INDUSTRIAL
DISCHARGE LIMITS CHECKLIST
Attachment A.
EPA - New England
Reassessment of Technically Based Industrial Discharge Limits
Under 40 CFR 122.21(j)(4), all Publicly Owned Treatment Works (POTWs) with approved Industrial Pretreatment Programs (IPPs) shall provide the following information to the Director: a written evaluation of the need to revise local industrial discharge limits under 40 CFR 403.5(c)(1).
Below is a form designed by the U.S. Environmental Protection Agency (EPA - New England) to assist POTWs with approved IPPs in evaluating whether their existing Technically Based Local Limits (TBLLs) need to be recalculated. The form allows the permittee and EPA to evaluate and compare pertinent information used in previous TBLLs calculations against present conditions at the POTW.
Please read direction below before filling out form.
ITEM I.
* In Column (1), list what your POTW’s influent flow rate was when your existing TBLLs were calculated. In Column (2), list your POTW’s present influent flow rate. Your current flow rate should be calculated using the POTW's average daily flow rate from the previous 12 months.
* In Column (1) list what your POTW’s SIU flow rate was when your existing TBLLs were calculated. In Column (2), list your POTW’s present SIU flow rate.
* In Column (1), list what dilution ratio and/or 7Q10 value was used in your old/expired NPDES permit. In Column (2), list what dilution ratio and/or 7Q10 value is presently being used in your new/reissued NPDES permit.
The 7Q10 value is the lowest seven day average flow rate, in the river, over a ten-year period. The 7Q10 value and/or dilution ratio used by EPA in your new NPDES permit can be found in your NPDES permit “Fact Sheet.”
* In Column (1), list the safety factor, if any, that was used when your existing TBLLs were calculated.
* In Column (1), note how your biosolids were managed when your existing TBLLs were calculated. In Column (2), note how your POTW is presently disposing of its biosolids and how your POTW will be disposing of its biosolids in the future.
ITEM II.
* List what your existing TBLLs are - as they appear in your current Sewer Use Ordinance (SUO).
X-1

ITEM III.
* Identify how your existing TBLLs are allocated out to your industrial community. Some pollutants may be allocated differently than others, if so please explain.
ITEM IV.
* Since your existing TBLLs were calculated, identify the following in detail:
(1) if your POTW has experienced any upsets, inhibition, interference or pass-through as a result of an industrial discharge.
(2) if your POTW is presently violating any of its current NPDES permit limitations -include toxicity.
ITEM V.
* Using current sampling data, list in Column (1) the average and maximum amount of pollutants (in pounds per day) received in the POTW's influent. Current sampling data is defined as data obtained over the last 24 month period.
All influent data collected and analyzed must be in accordance with 40 CFR 136. Sampling data collected should be analyzed using the lowest possible detection method(s), e.g., graphite furnace.
* Based on your existing TBLLs, as presented in Item II., list in Column (2), for each pollutant the Maximum Allowable Industrial Headwork Loading (MAIHL) values derived from an applicable environmental criteria or standard, e.g., water quality, sludge, NPDES, inhibition, etc. For each pollutant, the MAIHL equals the calculated Maximum Allowable Headwork Loading (MAHL) minus the POTW's domestic loading source(s). For more information, please see p. 3-28 in EPA’s Guidance Manual on the Development and Implementation of Local Limits Under the Pretreatment Program, 12/87.
ITEM VI.
* Using current sampling data, list in Column (1) the average and maximum amount of pollutants (in micrograms per liter) present in your POTW’s effluent. Current sampling data is defined as data obtained during the last 24-month period.
All effluent data collected and analyzed must be in accordance with 40 CFR 136. Sampling data collected should be analyzed using the lowest possible detection method(s), e.g., graphite furnace.
* List in Column (2A) what the Water Quality Standards (WQS) were (in micrograms per liter) when your TBLLs were calculated, please note what hardness value was used at that time. Hardness should be expressed in milligram per liter of calcium carbonate.
List in Column (2B) the current WQSs or “Chronic Gold Book” values for each pollutant multiplied by the dilution ratio used in your new/reissued NPDES permit. For example, with a dilution ratio of 25:1 at a hardness of 25 mg/L - calcium carbonate (copper’s chronic WQS equals 6.54 ug/L) the chronic NPDES permit limit for copper would equal 156.25 ug/L.
X-2

ITEM VII.
* In Column (1), list all pollutants (in micrograms per liter) limited in your new/reissued NPDES permit. In Column (2), list all pollutants limited in your old/expired NPDES permit.
ITEM VIII.
* Using current sampling data, list in Column (1) the average and maximum amount of pollutants in your POTW's biosolids. Current data is defined as data obtained during the last 24 month period. Results are to be expressed as total dry weight.
All biosolids data collected and analyzed must be in accordance with 40 CFR 136.
In Column (2A), list current State and/or Federal sludge standards that your facility’s biosolids must comply with. Also note how your POTW currently manages the disposal of its biosolids. If your POTW is planing on managing its biosolids differently, list in Column (2B) what your new biosolids criteria will be and method of disposal.
In general, please be sure the units reported are correct and all pertinent information is included in your evaluation. If you have any questions, please contact your pretreatment representative at EPA - New England.
X-3

--------- ----------- --------- -------------------- ----------- --------- -------------------- ----------- --------- -------------------- ----------- --------- -------------------- ----------- --------- -------------------- ----------- --------- -------------------- ----------- --------- -----------
REASSESSMENT OF TECHNICALLY BASED LOCAL LIMITS(TBLLs)
POTW Name & Address :_____________________________________________
NPDES PERMIT # :_________________________________________________
Date EPA approved current TBLLs :________________________________
Date EPA approved current Sewer Use Ordinance :__________________
ITEM I.In Column (1), list the conditions that existed when your currentTBLLs were calculated. In Column (2), list current conditions orexpected conditions at your POTW.
Column (1) Column (2)
EXISTING TBLLs
POTW Flow (MGD)
SIU Flow (MGD)
Dilution Ratio or7Q10 (from NPDES Permit)
Safety Factor
Biosolids DisposalMethod(s)
POLLUTANT
PRESENT CONDITIONS
N/A
NUMERICALLIMIT
(mg/L) or (lb/day)
ITEM II.EXISTING TBLLs
NUMERICAL LIMIT
(mg/L) or (lb/day)
POLLUTANT
X-4
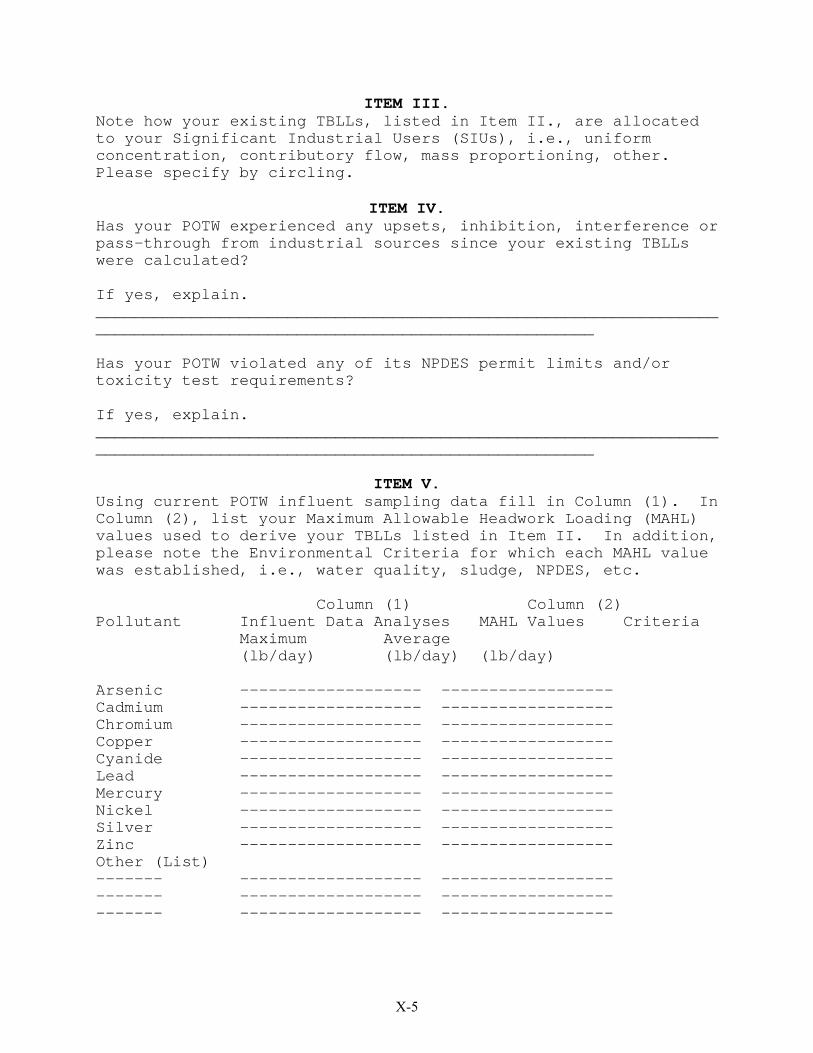
----------------------------------------------------------------------------------------------------------------------------------------------------------------------------------------------
------- -------------------------- -------------------------- -------------------
ITEM III.Note how your existing TBLLs, listed in Item II., are allocatedto your Significant Industrial Users (SIUs), i.e., uniformconcentration, contributory flow, mass proportioning, other. Please specify by circling.
ITEM IV.Has your POTW experienced any upsets, inhibition, interference orpass-through from industrial sources since your existing TBLLswere calculated?
If yes, explain._____________________________________________________________________________________________________________________
Has your POTW violated any of its NPDES permit limits and/ortoxicity test requirements?
If yes, explain._____________________________________________________________________________________________________________________
ITEM V.Using current POTW influent sampling data fill in Column (1). InColumn (2), list your Maximum Allowable Headwork Loading (MAHL)values used to derive your TBLLs listed in Item II. In addition,please note the Environmental Criteria for which each MAHL valuewas established, i.e., water quality, sludge, NPDES, etc.
Column (1) Column (2)Pollutant Influent Data Analyses MAHL Values Criteria
Maximum Average(lb/day) (lb/day) (lb/day)
Arsenic ------------------Cadmium ------------------Chromium ------------------Copper ------------------Cyanide ------------------Lead ------------------Mercury ------------------Nickel ------------------Silver ------------------Zinc ------------------Other (List)
------------------------------------------------------
X-5

------------------- --------- ---------------------------- ---------
---------------------------- ---------------------------- ---------------------------- ---------------------------- ---------------------------- ---------------------------- ---------------------------- ---------
------- ------------------- ---------------- ------------------- ---------------- ------------------- ---------
--------------------- ------------------------------------------ ------------------------------------------ ------------------------------------------ ------------------------------------------ ------------------------------------------ ------------------------------------------ ------------------------------------------ ---------------------
ITEM VI.Using current POTW effluent sampling data, fill in Column (1). In Column (2A) list what the Water Quality Standards (Gold BookCriteria) were at the time your existing TBLLs were developed. List in Column (2B) current Gold Book values multiplied by thedilution ratio used in your new/reissued NPDES permit.
ColumnsColumn (1) (2A) (2B)
Pollutant Effluent Data Analyses Water Quality CriteriaMaximum Average (Gold Book)
From TBLLsToday(ug/L) (ug/L) (ug/L) (ug/L)
Arsenic*Cadmium*Chromium -------------------*CopperCyanide*LeadMercury*NickelSilver*ZincOther (List)
---------------------------------------------------------------------------------
---------------------------
*Hardness Dependent (mg/L - CaCO3)
ITEM VII.In Column (1), identify all pollutants limited in yournew/reissued NPDES permit. In Column (2), identify allpollutants that were limited in your old/expired NPDES permit.
Column (1)NEW PERMIT
PollutantsLimitations(ug/L)
Column (2)OLD PERMIT
PollutantsLimitations(ug/L)
X-6

--------- --------- ------------------ --------- ------------------ ------------------ ------------------ ------------------ ------------------ --------- ------------------ --------- ------------------ ------------------ ------------------ ------------------ --------- ------------------ --------- ------------------ --------- ---------
ITEM VIII.Using current POTW biosolids data, fill in Column (1). In Column(2A), list the biosolids criteria that was used at the time yourexisting TBLLs were calculated. If your POTW is planing onmanaging its biosolids differently, list in Column (2B) what yournew biosolids criteria would be and method of disposal.
ColumnsColumn (1) (2A) (2B)
Pollutant Biosolids Data Analyses Biosolids Criteria
ArsenicCadmiumChromiumCopperCyanideLeadMercuryNickelSilverZincMolybdenumSeleniumOther (List)
Average(mg/kg)
From TBLLs New(mg/kg)
------------------------------------
--------------------------
(mg/kg)
X-7


