Local governance, finances and service delivery in Tanzania
61
Einar Braathen, Amon Chaligha and Odd-Helge Fjeldstad JOINT REPORT 2005 Local governance, finances and service delivery in Tanzania A summary of findings from six councils
Transcript of Local governance, finances and service delivery in Tanzania

Einar Braathen, Amon Chaligha and Odd-Helge Fjeldstad
JOINT REPORT
2005
Local governance, finances and service delivery in Tanzania
A summary of findings from six councils

Einar Braathen, Amon Chaligha and Odd-Helge Fjeldstad
Local governance, finances and service delivery in Tanzania
A summary of findings from six councils
Joint Report 2005 NIBR/CMI/REPOA

Title: Local governance, finances and service delivery in Tanzania A summary of findings from six councils Authors: Einar Braathen, Amon Chaligha and Odd-Helge Fjeldstad Joint Working Paper: 2005 NIBR/CMI/REPOA ISBN: 82-7071-536-0 Project number: O-1846 Project name: Formative Process Research on the Local Government Reform in Tanzania Financial supporter The Norwegian Agency for Development Cooperation (Norad) Head of project (NIBR): Terje Kleven) Abstract: This report provides a summary of three more extensive reports:
“Local Governance in Tanzania: Observations from Six Councils, 2000 – 2003” by Amon Chaligha et al; “Local Government Finances and Financial Management in Tanzania: Observations from Six Councils, 2000 – 2003” by Odd-Helge Fjeldstad et al, and “Local Service Delivery in Tanzania: Observations from Six Councils, 2000 – 2003” by Einar Braathen et al. They are supposed to contribute to a baseline for the local government reform programme in Tanzania. The reports are part of a formative process research project, carried out since 2002 by the following partners: the Research on Poverty Alleviation (REPOA), Dar es Salaam, Chr. Michelsen Institute (CMI), Bergen, and the Norwegian Institute for Urban and Regional Research (NIBR), Oslo. For more project information and reports, see ‘Local Government Research Project’ under www.repoa.or.tz .
Date: March 2005 Pages: 39 Publisher: Norwegian Institute for Urban and Regional Research Gaustadalléen 21, Box 44, Blindern N-0313 OSLO Telephone (+47) 22 95 88 00 Telefax (+47) 22 22 37 02 E-mail: [email protected] http://www.nibr.no Printed: Nordberg A.S. Org. nr. NO 970205284 MVA © NIBR 2005

1
Joint Report 2005
Preface
As a part of its support to the Local Government Reform Programme (LGRP), the Norwegian Agency for Development Cooperation (Norad) is financing a Formative Process Research Project to closely follow the development of the LGRP. In consultation with the President’s Office Regional Administration and Local Government (PO-RALG), the project has been organised on the basis of institutional collaboration between the Research on Poverty Alleviation (REPOA), Dar es Salaam, Chr. Michelsen Institute (CMI), Bergen, and the Norwegian Institute for Urban and Regional Research (NIBR), Oslo. The project has run over the four-year period 2002-2005.
The project has made efforts to produce a baseline for the research linked to indicators on the following three broad dimensions of the local government reform:
1. Governance: local autonomy and citizen participation. 2. Finances and financial management: accountability, efficiency and local resource
mobilisation. 3. Service delivery and poverty alleviation: criteria of success and operational
constraints. This report provides a summary of three more extensive baseline reports:
• Local Governance in Tanzania: Observations from Six Councils by Amon Chaligha, with Florida Henjewele, Ambrose Kessy and Geoffrey Mwambe (forthcoming);
• Local Government Finances and Financial Management in Tanzania: Observations from Six Councils, 2000 - 2003 by Odd-Helge Fjeldstad, with Florida Henjewele, Geoffrey Mwambe, Erasto Ngalewa and Knut Nygaard (Special Paper No.16, REPOA, 2004);
• Local Service Delivery in Tanzania: Observations from Six Councils, 2000 - 2003 by Einar Braathen, with Geoffrey Mwambe (forthcoming).
Reports, papers and project briefs from the project can be downloaded from: http://www.repoa.or.tz
An earlier version of this report was presented at REPOA’s 9th Annual Research Workshop, which took place in Dar es Salaam in March 25-26, 2004. We thank Dr Brian Cooksey and other workshop participants for useful comments..
Einar Braathen, NIBR, has edited the report.
The report is published by NIBR on behalf of the project.
Oslo, May 2005
Arne Tesli Research Director

2
Joint Report 2005
Table of Contents
Preface .................................................................................................................................1 Table of Contents.................................................................................................................2 Tables...................................................................................................................................3 1 Introduction..................................................................................................................4
1.1 The Local Government Reform Programme...................................................4 1.2 The Formative Process Research Project ........................................................5 1.3 The case councils ............................................................................................6 1.4 Methodologies.................................................................................................7
2 Summary of the main findings.....................................................................................9 2.1 Governance .....................................................................................................9 2.1.1 Key aspects......................................................................................................9 2.1.2 Main differences and other comments ..........................................................14 2.2 Finances and financial management..............................................................15 2.2.1 Key aspects....................................................................................................15 2.2.2 Main differences and other comments ..........................................................18 2.3 Service delivery.............................................................................................19 2.3.1 Key aspects....................................................................................................20 2.3.2 Main differences and other comments ..........................................................25
3 Emerging research questions......................................................................................28 3.1 Governance ...................................................................................................28 3.2 Finances and financial management..............................................................29 3.3 Service delivery.............................................................................................30
Appendix 1 Indicators of change ......................................................................................33 Table A1: Indicators of change in governance...........................................................34 Table A2: Indicators of change in the financial situation and financial management36 Table A3: Indicators of change in service delivery....................................................38
Appendix 2 : Survey Questionnaire ..................................................................................41

3
Joint Report 2005
Tables
Table 2.1 Participatory approaches applied in the six case councils ...........................11 Table 2.2 Perceptions of corruption (in % of all respondents by councils) ..................13 Table 2.3 Own revenues in % of total revenues ............................................................19 Table 2.4 Staffing of treasury departments ...................................................................19 Table 2.5 Citizens’ satisfaction rating of key services ..................................................20 Table 2.6 LG service delivery over the last 2 years (% of all respondents). .................21 Table 2.7 Primary education.........................................................................................21 Table 2.8 Perceptions of availability of drugs and medicines in three sub-sectors ......23 Table 2.9 Health services (official data) .......................................................................23 Table 2.10 Water supply (official data)...........................................................................24 Table 2.11 Citizens’ perceptions of which public service that must be improved...........27

4
Joint Report 2005
1 Introduction
1.1 The Local Government Reform Programme The Civil Service Reform Programme (CSRP) was an element in the wider process of structural adjustment in Tanzania, which started with the Economic Recovery Programmes in the second half of the 1980s. Initially, local government was not part of the CSRP. In the Government's Policy Framework Papers local government was hardly mentioned at all. In the Policy Framework paper of October 1994 (for 1994 - 97) local government was mentioned only in connection with the plan for retrenchment, where it is made clear that the exercise will cover local government employees, including education and health workers (reference).. It was still by far the smallest component of the programme. In a three year budget for the whole programme, totalling roughly 26 million US$, the local government component accounted for only 0.2 million, budgeted mainly for technical assistance to undertake studies of the linkages between local government and the wider government system.
However, local government reform (LGR) became a more empasised issue as a result of the dialogue between the URT government and the donors. The LGR component had been substantially increased and upgraded, and in 1997 had a total budget of US$ 64 million.
In 1997, the Local Government Reform Programme (LGRP) was launched when the government presented its Local Government Reform Agenda to a round table meeting of interested donors. The same year the Regional Administration underwent substantial restructuring whereby the regional level was abolished and most of the regional staff was transferred to the districts. In 1998 the Government published its Policy Paper on Local Government Reform. However, the implementation set-up was not in place before 2000.
The government responsibility for local government lies under President’s Office – Regional Administration and Local Government (PO-RALG) in Dodoma. However, the operational responsibility for the reforms is delegated to a new secretariat, the Local Government Reform Team based in Dar-es-Salaam.
The reform programme includes six main components:
4. Governance: To establish broad-based community awareness and participation, aimed at promoting principles of democracy, transparent and accountable government.
5. Restructuring: To enhance the effectiveness of local government authorities (LGAs) in delivering quality services in a sustainable manner.
6. Finance: To increase the resources available to LGAs and improve the efficiency in their use.

5
Joint Report 2005
7. Human resource development: To improve accountability and efficiency of human resource use at LG level.
8. Legal component: To establish an enabling legislation to support the effective implementation of local government reforms.
9. Programme management: To support the effective and efficient management of the overall reform programme.
The essence of LGRP is to transfer duties and financial resources from the central to the local government levels. The extent to which this will result in improved services, such as in health, education, water supply, transport infrastructure etc., depends on the quality of local governance as well as financial management
An analysis of the reform experiences concluded that decentralisation in Tanzania, although “on track”, was lagging behind a country like Uganda along the following dimensions:
• The legal and policy dimension: constitution not conducive to decentralisation; no clear legal framework for assignment of expenditures; harmonisation with sector legislation not fully carried out;
• Administrative and political structures: overall structure does not ensure optimal size - the lower-levels of local government (village councils) were rather small for efficient service provision; to much interference from MPs (members of parliament) in local matters.
• Finance: no clear fiscal decentralisation strategy, although first steps taken on the systems of recurrent and development grants;
• Human resources: no local autonomy to hire and fire. Although new staff regulations issued in 2000 provided some legal basis, this has been constantly undermined by various central government initiatives.
However, the institutional arrangement for decentralisation was found to be as strong as in the mentioned neighbour country:
• Tanzania has a committed and strongly facilitated champion for decenralisation – the LRGP technical team and PO-RALG, although not particularly well integrated in the ministry or in the wider policy process
• Tanzania’s government has a reasonably strong coordination with the donor agencies.1
1.2 The Formative Process Research Project The overall objective of the Formative process research project on the local government reform in Tanzania is to document the processes of change and impacts of the LGRP in Tanzania at the local government levels, and to provide managers and key stakeholders with operationally relevant data and analyses of lessons learned during implementation. Moreover, the project shall contribute to building institutional capacity for local government related research in Tanzania and Norway.
The formative process research project concentrates on the following three broad dimensions of the local government reform: 1 NCG: ‘A comparative analysis of experiences from decentralisation in Kenya, Tanzania and Uganda’. Nordic Consulting Group (authors: Jesper Steffensen, Per Tidemand et al.). Draft synthesis report, June 2004.
6
Joint Report 2005
1. Governance: local autonomy and citizen participation. 2. Finances and financial management: accountability, efficiency and local resource
mobilisation. 3. Service delivery and poverty alleviation: criteria of success and operational
constraints.
The aim of the Formative process research project is to observe changes in local authorities in the provision of basic services to the public, and analyse changes in local authorities’ capacity for financial management and revenue enhancement, changes relating to governance, including accountability and responsiveness of the local government. An important element of the study is therefore associated with trust relations between the local government and society, and changes in the ability of the civil society to act as development agents.
The research focuses on the reform process as a whole at the local level. In the local authorities, the reform process represents a series of interventions from outside that:
i) establishes new social roles and relationships between “reformers” and “reformed” – itself a social change process; and
ii) brings about changes into existing relationships of power, responsibilities and division of labour, for instance:
• between central and local government, • between district council and other government authorities locally, • between council staff and councillors, • between various departments of the council, • between the council and the ward and village-based authorities, and • between the local authorities and the communities/citizens within the
territorial boundaries of the council.
This implies that the researchers are connected by a common focus on the reform process as a whole, and on the overarching cross-sector rather than compartmentalised effects of the reform.
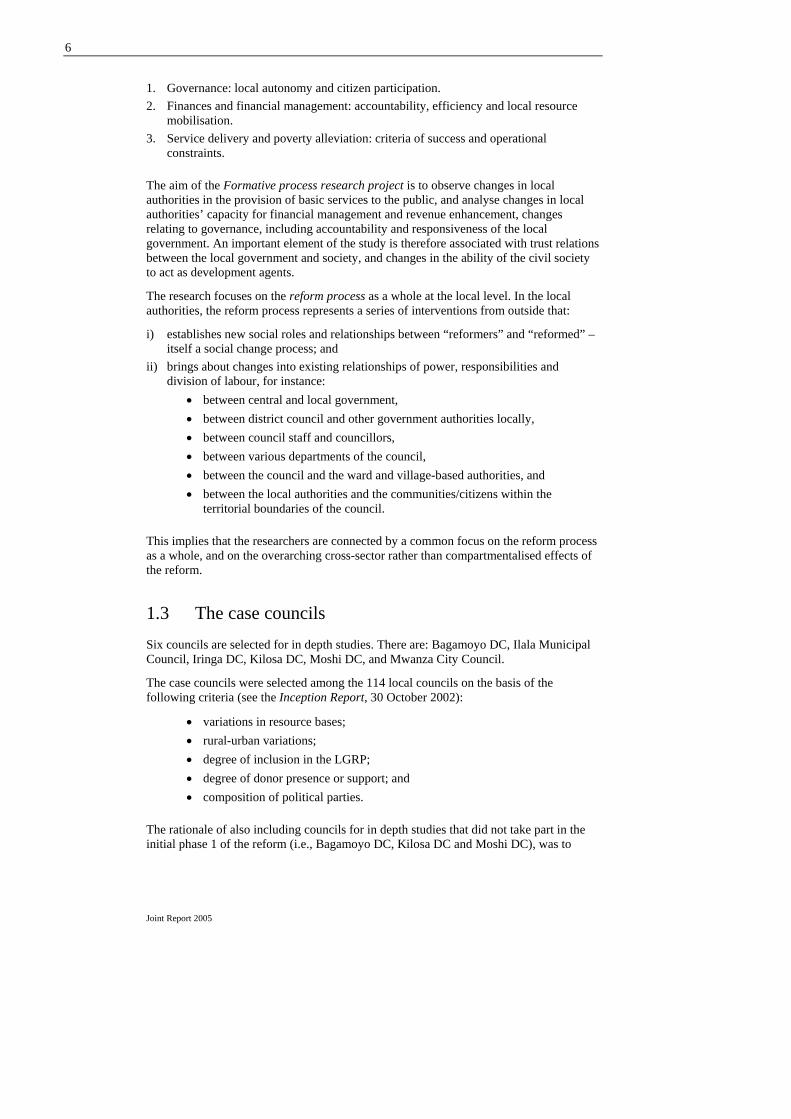
1.3 The case councils Six councils are selected for in depth studies. There are: Bagamoyo DC, Ilala Municipal Council, Iringa DC, Kilosa DC, Moshi DC, and Mwanza City Council.
The case councils were selected among the 114 local councils on the basis of the following criteria (see the Inception Report, 30 October 2002):
• variations in resource bases; • rural-urban variations; • degree of inclusion in the LGRP; • degree of donor presence or support; and • composition of political parties.
The rationale of also including councils for in depth studies that did not take part in the initial phase 1 of the reform (i.e., Bagamoyo DC, Kilosa DC and Moshi DC), was to

7
Joint Report 2005
establish to what extent changes occur even without the incentives of the Local Government Reform – in other words, to identify – through the method of individualising or contrasting comparison - reform or change agents that are located at the local level or in other sectors than those driving the LGR.
Ilala Municipal Council. Ilala is one of the three municipal councils within Dar es Salaam City Council. The main economic activities include manufacturing industries, services, trade and agriculture. The total area of the municipality is 210 km2, of which 20% is rural with agriculture. Its population in 2002, according to the census, was 638000.
Mwanza City Council. Mwanza is Tanzanias’ second largest city, located 1100 m above the sea level, at Lake Victoria. It has fishing and other industries, but agriculture remains the most important economic activity. The total area of the city council is 1342 km2, of which 900 km2 is water. Its population in 2002 was 266000
Bagamoyo District Council. The council includes Bagamoyo town, which is one of the oldest towns in the country, located by the Zanzibar Channel 80 km North of Dar es Salaam. The total area of the district is 9842 km2. Its population in 2002 was 230 000, predominantly Muslim agriculturalists.
Iringa District Council. Iringa lies 1600 m above sea level in the Southern Highlands, along the main highway between Morogoro and Mbeya (Malawi/Zambia). It has experienced a substantial growth in recent years in agricultural production. The majority (95%) of the population base their livelihood on agriculture. Iringa Town is a separate municipal council, while the surrounding area is organised in Iringa District Council. The total area of the district (before it was split into two districts in 2004) was 28 457 km2.
The population size in 2002 was 246 000 people. The population is predominantly Christian (various churches).
Kilosa District Council. Kilosa lies in the Morogoro region, 220 km west of Dar es Salaam. It was a centre for Tanzania’s sisal industry until this industry collapsed in the 1970s. Central parts of Kilosa DC are economically depressed due the collapse in the sisal industry and more recently of the sugar industry. However, areas located near the main roads to Dodoma and Iringa experience increasing economic activity. In 2002, the population was estimated to 490 000 people.
Moshi District Council. Moshi is located at about 800 m above sea level and lies at the foot of Mount Kilimanjaro in the Northern part of the country. The area is the centre of one of Tanzania’s major coffee-growing areas. However, there has been a sharp decline in the revenues from coffee exports in recent years due to falling international coffee prices. Historically, Moshi is the home of the first Christian mission stations of the country. Moshi Town has its separate municipal council, while the surrounding area is organised in Moshi District Council. The area of the district council is 1 713 km2, and its population in 2002 was 402 000.
1.4 Methodologies To establish the baseline for the research, data collection is linked closely to indicators of change induced by the LGR (see appendix 1). Such indicators are based on a set of common data (at council, ward and village levels) that is easily accessible, easily compiled and easily maintained for all case districts over time. Priority is given to data needed for comparison of impacts and effects across local government authorities (LGAs) and over time. In essence, a small, common database is developed for all case councils.

8
Joint Report 2005
These data provide a reference point for the situation in the case councils with respect to the three main themes by mid-2003. A new comparative study of changes is planned to take place in 2006. This will facilitate the studies of processes of change in the case councils due to the impacts of reforms.
The data on key indicators of change related to the main topics of research, i.e. (i) Governance; (ii) Finances and financial management; and (iii) Service delivery (see appendix 1). This report builds on the background reports prepared on each of these topics. Section 2 in this paper provides a summary of the key findings in these reports. However, the report does not aim to explore causalities (e.g., what specific reform measures lead to the specific changes observed), but focuses instead on what changes are/can be observed in each of the case councils with respect to the focused topics. Furthermore, one aim is generate ideas for further analysis of processes of change to be studied (section 3).
The data are derived on the basis of a combination of quantitative and qualitative methodologies:
• A citizens survey comprising 1260 respondents in total; 210 from each of the six sample councils; 30 from each of the surveyed 42 wards. In each ward was there was a systematic random sampling. The survey was carried out in October 2003 (see survey questionnaire in Appendix 2). 2
• Quantitative official data collected in the case councils and from PO-RALG. • Quantitative official data submitted by contact persons in the case councils. • Qualitative research in each case council, ward and village designed especially
to examine events of change (see the Fieldwork Manual 2003 for details on key informers interviewed).
• Qualitative research at the central level, including ministries, ALAT and other national interest organisations, national NGOs, and major donors in order to explore major changes in the relations between local and central government responsibilities due to the LGR, and variations between central level stakeholders.
Although the purpose is to build a baseline, and although baseline data are quantitative more often than not, qualitative research has contributed to the formulation of indicators and the validation of data.
2 Formative Process Research on the Local Government Reform in Tanzania (2003): 'Citizens survey report.' CMI/NIBR/REPOA.

9
Joint Report 2005
2 Summary of the main findings
2.1 Governance Governance is in this report perceived as the exercise of economic, political and administrative authority to manage a country’s affairs at all levels. It should entail participation, transparency, efficiency and equity in the application of laws in any given country. In this perspective, governance comprises the mechanisms, processes and institutions through which citizens and groups articulate their interests, exercise their legal rights, meet their obligations and mediate their differences. Local governance refers to the way a local authority fulfils its responsibilities towards the citizens in their areas of jurisdiction. It covers relationships between local authority leaders and the citizens, as well as political parties and non-governmental organizations, and the central government in all phases of formulating and implementing policies that affect people in their localities.
The following are the key observable indicators of the governance dimension considered in this paper:
(i) Local government autonomy. (ii) Cross-sector integration. (iii) Bottom up planning. (iv) Trust relations between the council staff and councillors, and between citizens and
the council. (v) Citizens’ rights. (vi) Corruption. (vii) Gender mainstreaming. (viii) Participation in local elections.
2.1.1 Key aspects
(i) Local government autonomy: There are a number of policy and legal requirements that hamper autonomy, e.g. prevent local authorities from becoming fully fledged local governments accountable to local people. For example, most councillors and council staff interviewed said that there is a considerable control over local government decision making through such mechanisms as the grant system. This system sets minimum national standards requiring local authorities to frame their budgets according to guidelines and procedures as spelt out by the central government. Hence, there is always only a relative degree of local government autonomy.
The power of the local councils to hire and fire staff is limited. The Local Government Reform Agenda mentions that local autonomy will require the presence of strong and

10
Joint Report 2005
effective institutions through sufficient numbers of qualified and motivated staff recruited and promoted on the basis of merit. However, it does not stipulate clearly those powers to the local authorities. The councils for example, can do nothing to discipline heads of departments as they are not recruited by them. The only thing they can do is to air their voices against non-performing or corrupt officials. But the final decision is made by the central government which may decide to transfer them to other councils rather than firing them.
Nevertheless, if councillors do not want a head of department they can ask the central government to remove or transfer such an officer. Councillors interviewed in Bagamoyo DC said that they had requested the central government to remove the District Executive Director, and the ministry accepted their request. Similarly, councillors in Bagamoyo DC successfully lobbied the government to remove the District Education Officer. In Mwanza, councillors successfully prevented the government from recruiting a City Economist they did not want.
However, local authorities still feel denied power and authority to determine not only their own priorities in areas of human resources, but also on revenue generation, as reflected by the recent abolition of the so called “nuisance taxes” by the central government. Local authorities are in many cases not consulted before policy measures that will affect have substantial impacts on them are made by the central government.
The Local Government Reform Programme in the case councils has to some extent brought changes with respect to local autonomy. This is reflected in some new forms of relationship between the central government and the local authorities in terms of revenue collection, human resources development and service delivery. In most of the case councils, a number of seminars on good governance have been conducted organised by the Ministry responsible for local government But again, this has not enabled the local authorities to discharge their functions more efficiently.
(ii) Cross-sector integration: The decentralisation process that is geared through the local government reform programme has not managed to have fully integration of all other sector ministries at the local levels. Basically, one of the major objectives of the decentralisation efforts is to have all departments integrated under the coordination of the directors of the council and the full councils. This form of integration will allow each head of the department in the respective councils to be technical head of his or her department. For the case of the six councils surveyed, the only sector which has acquired full integration to the council management is the health sector in contrast to the education sector, which is under heavy central control..
(iii) Bottom up planning: Despite the limitations of local autonomy, there has been a substantial development in the process of decision making especially through attempts to including citizens in the planning process. Generally, decentralised or a bottom-up planning approach is expected to:
• Increase popular participation in planning and development activities. • Make plans more relevant to local needs. • Facilitate coordinated or "integrated" (multi-sector) planning. • Increase the speed and flexibility of decision-making and implementation. • Generate additional resources and encourage more efficient use of existing
resources. Participatory planning is “attempted” in the case councils (see table 2.1). The depth of the popular participation has varied from one council to another depending on factors such as endowment of economic resources and employment of techniques such as the

11
Joint Report 2005
Participatory Rural Appraisal (PRA). Several councils, including Ilala MC, Kilosa DC, Mwanza CC and Moshi DC, report positive experiences with the PRA.
Table 2.1 Participatory approaches applied in the six case councils
Council Opportunities & Obstacles to Development [O&OD]
Participatory Rural Appraisal [PRA]
Community Initiative Support [CIS]
Bagamoyo DC 1 1 0 Ilala MC 1 0 0 Iringa DC 1 1 0 Kilosa DC 1 1 1 Moshi DC 0 0 0 Mwanza CC 1 1 0 1 = applies; 0 = Does not apply. Source: Council contact persons.
Bottom-up planning means planning from hamlet to council level. Villagers in their hamlets meet and make suggestions of what programmes they want to implement. The programmes are discussed in the Ward Development Committees (WDC) before being forwarded to the council. However, the Council makes the final decision on what projects and programmes that are to be implement. Some council officials perceive village plans as mere shopping lists, which cannot be implemented due to financial and other constraints. Furthermore, according to some respondents, the bottom-up planning is in practice an ad hoc exercise which is carried out by a few experts and does not involve ordinary citizens. Consequently, the bottom-up approach has turned into a top-down exercise.
A number of problems facing the bottom up approach in some of the case councils surveyed can be observed. First, there is lack of real commitment on the part of the local implementers, including such as the Village Chairpersons, Village Executive Officers (VEO’s), Ward Executive Officers (WEO’s) and the councillors. The local level planning has not been a broad-based participation as it involves mainly the technocrats from the regional level and the local councils to supervise and co-ordinate the planning process.
Second, according to Ward and Village Officials interviewed in all the case councils no guidelines were issued by their councils on how to prepare village plans. They also complained that villagers are discouraged when plans submitted to the councils are not implemented.
Third, there is a lack of financial resources to cover the cost of organizing and implementing participation (workshops, meetings, travel, etc.) often compounded by poor access to and between communities in sparsely populated rural areas.
The local government reform programme, however, has brought a number of changes in the planning system. A system of participatory planning and budgeting has been designed and the PO-RALG has tried to implement them to all local authorities (the Opportunities & Obstacles to Development, i.e. the O & OD planning model). For example, about 40,000 elected grassroots leaders in 13 regions have been given this important training on good governance.3 Seminars have been held mainly for the District Officials with few councillors trained on the participatory techniques.
3 President’s Office-Regional Administration and Local Government Progress Report on the Implementation of the Local Government Reform Programme, November, 2002.

12
Joint Report 2005
(iv) Trust relations: There is a strong sense of distrust between the citizens and their local leaders, and between the councillors and the council officers. Many people interviewed say they do not have mechanisms in place to hold their representatives accountable for their actions, just like councillors have limited powers to remove non-performing or corrupt council officers. However, it is not clear whether this is due to lack of downward accountability or to the hangover of the single party centralism in the minds of the local council and central government officers. Still, many people interviewed indicated that they have confidence in their council officials. Hence, 55% of the respondents in the citizens survey said that the council staff “do as best as they can”, and 62% placed the councillors in that category, as well.
In the case councils most councillors held the view that council staff undermine them and use council resources for private gain. On the other hand, the council staff often perceived that councillors in general were less educated and had a tendency of meddling in administrative matters which should be the domain of technical experts and not politicians. Such different perspectives have led to distrust. In some council, e.g. Kilosa, Moshi DC and Bagamoyo, this relationship was tense before the introduction of the LGR and the governance workshops. In areas where training seminars on good governance had been provided and the duties and responsibilities of politicians and council staff clearly defined, the distrust seems to have been reduced. Hence, more information and clear demarcations of duties and responsibilities for each category of council staff and councillors are required.
(v) Citizens’ rights: It appears that many citizens know their rights. However, a minority of the respondents in the citizens survey (23-24%) still complain that both council staff and councillors “harass people” and “are corrupt”. When almost a quarter of the respondents hold such negative views of their leaders, it can be interpreted as an indicator of ‘bad governance’. But it can also be interpreted as an indicator of increased awareness among the citizens about their right to speak up, and about the rights and obligations in their relationship with local government officials. However, it does not seem that information or campaigns from the local authorities have contributed to the citizens awareness in this regard. When asked where they have received information on various government policies, such as tax policy, HIV/AIDS control policy, health policy, education policy, the local government reform etc., radio is by far the media the majority of the respondents refer to. Newspapers and other forms of information dissemination used by the local authorities seem to play a minor role.
Although many people say that they have good faith in their councillors and council officers, they were not able to mention the means by which they could hold their leaders accountable. For example, there are no clear procedures on how people can participate in the council affairs apart from using their elected councillors who attend the council meetings. Instruments and procedures that ordinary people are supposed to use in case they want to hold council officials accountable for their actions are not clearly put in place. Consequently, vital democratic principles are not yet in place. In Iringa DC, for instance, we came across cases where people had forced some leaders to resign due to misconduct, but through a very cumbersome process which included many compromises with the district leadership,
(vi) Corruption: Corruption is perceived to be a problem in all six case councils. However, there are large differences between the councils with respect to the extent of corruption. In Kilosa DC, 40% of the respondents view corruption as a serious problem, compared to 72% in Moshi DC. Moreover, while 40% of the respondents in Kilosa DC have seen a decline in the level of corruption, 53% in Moshi DC have observed an

13
Joint Report 2005
increase. There is however agreement across councils that corruption must be combated at every opportunity (see table 2.2 below).
Which actions against corruption have been observed locally? There are complaints from various people, especially from local politicians, that the council employees are not fired because of corruption, but will simply be transferred without making it public. The government has tried to institute opinion polls at the grassroots aiming at identifying corrupt local leaders. In some areas, this exercise has had some impact. The Local Government Reform Programme (LGRP) provides a potentially good avenue for combating corruption, for instance by improving the working conditions for the staff in local authorities, including better salary and pension schemes, training and other incentives. By establishing more transparent procedures in some departments, the reform process has contributed to reduce some of the corrupt practices in local authorities.
Table 2.2 Perceptions of corruption (in % of all respondents by councils)
Council name
Description Ilala MC
Bagamoyo DC
Kilosa DC
Iringa DC
Moshi DC
Mwanza CC Total
Yes 64,3 61,4 40,0 48,6 71,9 69,5 59,3 Average 12,9 10,0 22,9 16,7 8,1 7,1 12,9 No 14,8 16,7 18,6 21,0 8,1 10,5 14,9
Is corruption a serious problem in this council? Don't know 8,1 11,9 18,6 13,8 11,9 12,9 12,9
Worse 44,8 39,0 28,6 29,5 52,9 40,0 39,1 No change 23,8 17,6 7,6 4,8 19,0 19,5 15,4 Less 21,4 28,1 39,5 38,6 12,4 23,8 27,3
Level of corruption in the council compared to 2 years a go Don’t know 10,0 15,2 24,3 27,1 15,7 16,7 18,2
Agree 7,6 8,1 5,7 5,7 3,3 1,0 5,2 To some degree 8,6 5,7 6,2 3,8 3,3 2,9 5,1 Disagree 81,9 80,0 82,4 85,2 90,0 93,8 85,6
Is corruption a natural occurrence; no need to denounce it? Don’t know 1,9 6,2 5,7 5,2 3,3 2,4 4,1
Agree 94,3 94,3 94,3 93,8 92,4 95,2 94,0 To some degree 4,3 - 1,9 3,8 1,0 0,5 1,9 Disagree 0,5 1,9 2,4 1,4 3,8 1,9 2,0
Corruption is a disease; should be denounced in every case?
Don’t know 1,0 3,8 1,4 1,0 2,9 2,4 2,1 Source: Citizens survey (2003)
When prodded to name those “most responsible for corruption” Ilala was special: as many as 35% of the respondents said the police are corrupt. The corresponding figure for Kilosa DC is 19%. In Ilala 13% of the respondents blamed ‘ordinary citizens’ for being responsible for corruption. The corresponding figure for Moshi DC is 23%. In Kilosa 19% said that health workers were the worst perpetuators of corruption, against 5% in Moshi DC
(vii) Gender Mainstreaming in Local Government Reform: Gender mainstreaming is seen as a strategy for mobilising administrators, politicians, elected leader etc. and to enhance equality in their everyday practises. The representation of women in many aspects of formally organised life in Tanzania is at present very low. The issue of gender mainstreaming has, until recently, not been an important aspect in the council plans. Although some of the local government planning officers claimed that gender

14
Joint Report 2005
mainstreaming has been introduced in every sector, concrete measures have not been implemented. Hence, the District Chairman for CCM in one of the case councils said
“women are not elected in regular elections because they do not have funds, are shy, afraid of witchcraft, lack of self-confidence and rather decide to stay with their children.”
However, to ensure women participation in local government affairs, the law gives women an equalisation opportunity of which women must constitute 30% of the elected councillors (i.e. special women seats).In general the process of gender mainstreaming, including appropriate training and the development of gender sensitive monitoring and evaluation systems are poorly implemented in the case councils.
(viii) Participation in Local Elections: In the last eight years of competitive politics (i.e. multipartyism) some encouraging signs of effective popular participation have been recorded as well as disappointments. Citizen’s participation in the local government elections is reported to be high. For example, in the 2000 local government elections 9,642,372 citizens registered for voting. The number of citizens who actually turned out on the polling day were 6,877,152 equivalent to about 71% of the registered voters. This is a very high turnout compared to polls in many other countries. In the six case councils, about 81% of the respondents on average said they participated in the last village and ward elections. Voter apathy is relatively low ranging from almost 4% in Ilala MC to 0.5% of all respondents in Iringa DC. and Moshi DC respectively, who said they did not vote because they considered that vote did not matter.
However, several factors hinder full turnout of the citizens in the elections. Some of these are associated with the law which requires candidates to be a member of a political party and therefore discourage those without political party affiliation to participate. Others are associated with the lack of civic education and voter’s education programmes. However, voting is a voluntary process, and when seven in ten people turn out to vote, it shows a relatively high interest and support for democratic processes.
2.1.2 Main differences and other comments
There are some substantial differences between the case councils along most of the eight dimensions of governance presented. These differences seem to correspond to some extent with two factors: the urban/rural divide and the political party hegemony.
The urban/rural divide may explain differences such as the capacity to carry out bottom-up planning – the urban councils (Ilala and Mwanza) are better resourced and seem to be able to implement more plans from below (village, mtaa and ward levels) than their rural counterparts. It can also be observed from the field interviews that in urban councils , women are more represented in the council administration and among ward councillors as compared to the rural councils.
Political party hegemony varies, with the opposition parties in majority in Moshi DC and with some presence in Mwanza CC and Ilala MC. However, CCM is totally dominant in the other case councils. These differences may explain the variations in trust relations, perception of citizens’ influence, and perception of corruption. Less than half the respondents in the first group (Moshi 40 %, Mwanza 42 % and Ilala 50 %) think that council staff “do as best as they can” – people may not trust public officials whom they accuse to be the ruling party (CCM) sympathisers. In the other group of councils, dominated by CCM, a solid majority of respondents (Bagamoyo 58 %, Kilosa 64 % and Iringa 74 %) think councils staff “do the best as they can”, and conflicts between council bureaucrats and the councillors are minimal. As to influence, a simple majority of

15
Joint Report 2005
respondents in the first group of councils perceive that they have “no influence” in bottom-up planning systems. In the other group (Bagamoyo, Kilosa and Iringa) a big majority perceive that they do have influence. Coming to perception of corruption, as many as 72% of the respondents in Moshi DC viewed corruption as a problem in the council, compared to only 40% in Kilosa DC. Of course, it is difficult to claim that these perceptions reflect political hegemonies rather than realities on the ground when it comes to corruption etc. For instance, opposition parties may get stronger in response to ‘objective’ increase in corruption. More research is needed to explore these complex causal relations.
2.2 Finances and financial management Of the systemic reforms, fiscal decentralisation is seen as one of the highest priorities, affecting as it does, the LGs autonomy and many other areas (see the LGRT Medium term plan and budget July 2002 – June 2005, p. 15). Thus, key elements in the local government reform process are to transfer duties and financial resources to the local level. As to the baseline for ‘finances and financial management’ in the six case councils by mid-2003, the following key indicators of change are used as reference points:
(i) Degree of fiscal autonomy. (ii) Financial management, including budgeting, accounting and auditing. (iii) Methods of revenue collection. (iv) Transparency in fiscal and financial affairs. (v) Tax compliance and fiscal corruption in the case councils.
2.2.1 Key aspects
(i) Fiscal autonomy: Fiscal autonomy of rural district councils is limited both with respect to revenues and expenditures. The four rural councils in our sample generated less than 17% of their total revenues from own sources in 2002. For Moshi DC, the percentage was less than 10%. The rationalisation of many local revenue sources in June 2003 and 2004 has reduced the already limited fiscal autonomy of district councils even further. In contrast, the two urban councils, Ilala MC and Mwanza CC, are less dependent on central government grants than the rural councils. In 2002, Ilala MC generated about 64% of its revenue through own sources and Mwanza CC almost 48%. However, none of the six case councils have experienced an increase in own revenues’ share of total revenues during the three year period 1999-2002. In Bagamoyo DC, Iringa DC, and Mwanza CC, there is a clear downward trend in own revenues as a percentage of total revenues.
A similar picture applies with respect to expenditures since the grants from the central government are conditional and in general earmarked for specific sectors.4 We observe a considerable annual increase in total expenditures in the case councils during the period 2000-2002, although the annual fluctuations are substantial in some councils. However, in 2000-2001, Moshi DC experienced a significant decline in its expenditure level (-
4 There are currently six main types of grants and transfers to local governments: (1) recurrent grants; (2) sector-specific funds and programmes (e.g. health basket funds and PEDP); (3) sector-specific development grants; (4) programme specific transfers (e.g. TASAF); (5) area-based donor-supported programmes (ABP); and (6) non-sectoral development grants. A grant earmarked for development/capital funding to local governments, the Local Government Capital and Development Grants (LGCDG), is scheduled for introduction the fiscal year 2005/06 (FY05/06).
Formatert: Blokkjustert
16
Joint Report 2005
18.2%), and Bagamoyo saw a decline of 22.8% in total expenditures from 2001 to 2002. But from 2001 to 2002, Moshi DC saw an increase of more than 95% in its level of expenditures. For Iringa DC and Kilosa DC, expenditure levels increased by 78% and 59%, respectively, from 2001 to 2002.
The allocation of expenditures between priority sectors shows substantial differences between the case councils. In particular, this is the case for allocations to the education sector, while we observe less difference between the allocations to the health sector. For instance, while Kilosa DC allocated about 22% of total expenditures to education in 2002, the corresponding figure for Moshi DC was 66%. On average, the allocation to the health sector in the case councils was around 10% of total expenditures in 2002.
(ii) Financial management: With respect to the quality of financial management, our research cannot, at this stage, identify any differences between the case councils that were part of the initial LGRP phase 1 and those which were not. Gaps between budgets and accounts provide an indication of the quality and realism of budgeting in the case councils. In Ilala MC and Bagamoyo DC, the annual revenue estimates in the period 2000-2002 are within a 10% range of the actuals reported. For the four other councils, the gaps between accounts and budgets in 2002 were between 13% (Kilosa) and 35% (Iringa). No trend can be derived from the data, as the gaps between actuals and estimates vary from year to year in all councils. For some councils, and in particular Moshi DC, the annual fluctuations are substantial and reflect weak budgeting.
Budgeting and accounting are still carried out manually in all the six case councils. Only Kilosa DC applies in practice PLATINUM in combination with a manual system. Ilala MC has started to implement PLATINUM and Epicor is in place in Mwanza CC. In contrast, Bagamoyo DC, Iringa DC and Moshi DC have not yet started to computerise financial management and planning.
The staffing situation in the case councils’ treasury departments differs both with respect to the number of staff members and their qualifications. This partly reflects the size of the councils. For instance, Mwanza CC has 42 staff members in the Treasury Department compared to 17 in the Treasury in Bagamoyo (see table 2.3 below). To some extent it also reflects that some councils are more attractive to work in compared to others, for instance llala versus Iringa. However, a general picture from the Treasury Departments is that about one third or less of the staff are trained accountants. The remaining majority of staff have either no formal training in accounting or only certificates.
The Internal Auditor’s Office in the case councils are either weakly staffed or not staffed at all. Bagamoyo has no internal auditor in place, and in Iringa DC the vacant position was not filled until mid-2003. Hence, until recently the internal auditing in Iringa DC was carried out by the Treasury staff themselves. This has undermined the credibility of the auditing process.
The most recent report from the Controller and Auditor General (CAG) shows that more councils than before have got a ‘clean’ statement on their accounts. This applies to Ilala MC, Kilosa DC, Moshi DC and Mwanza CC, which all received clean reports in 2001. But it is too early to state whether this is a trend or only accidental. To our knowledge no research has been carried out on the quality of the CAG’s reports on local authorities. Hence, one should be cautious to draw conclusions on this background. Preliminary observations from the case councils indicate, however, that no significant improvements have taken place in recent years to curb corruption, with a possible exception for Kilosa DC, which seems to have experienced positive managerial changes since mid-2002.

17
Joint Report 2005
(iii) Methods of revenue collection: Local government tax collection is the responsibility of the council staff and is completely separated from the central government. In district councils it is organised around three levels, namely the council headquarters, the wards and the villages. At the council headquarters the responsibility for tax collection rests with the council treasury, headed by the Treasurer. At the ward levels, the responsibility rests with the office of the Ward Executive Officer (WEO). The WEO also handles developmental issues and law-and-order functions at that level. For this purpose the local militia is at their disposal. In wards with greater revenue potential there will also be a ward revenue collector (WRC) to support the WEO. At the village level, the responsibility rests with the office of the village executive officer (VEO). The VEO is also responsible for supervising village developmental activities and for maintaining law and order. In addition, the VEOs often function as Village Council secretaries.
In practice, the organisation of tax collection varies between councils. For instance, in some councils the village level has been excluded from collection, and the task is taken over by the ward level. This is due to incentive problems connected with tax collection at the village level. Most case councils have introduced new methods to increase revenues from existing sources by outsourcing some of the revenue collection to private collectors to increase revenues from existing sources. Only in Iringa DC all own revenues are collected by the council staff.
(iv) Transparency in financial and fiscal affairs: All the case councils report that they disseminate information on financial and fiscal affairs to the public through meetings organised by the councils, including full council meetings, ward and village meetings. Ilala MC, Kilosa DC and Mwanza CC also report that they use newspapers to disseminate this information. Moreover, notice boards at ward and council headquarters are used in Ilala MC, Moshi DC and Mwanza CC. However, there are reasons to question the effectiveness of these mechanisms used by the councils to disseminate information, and whether such information actually reaches the public. Very few of the respondents (almost 6%) in the citizens’ survey, which covered 1260 respondents in the case councils, say they have seen any information about local government finances. More than 85% of all respondents say they have never received information on the amount of tax revenue and user charges that have been collected in area. There are, however, large variations across councils. The respondents in Kilosa DC appear to be relatively best informed, whereas Ilala MC and Mwanza CC are the councils with the highest level of ignorance among citizens with regard to tax collection. Among those who have received this kind information, the VEOs are in general the most likely institution to have issued it.
(v) Tax compliance and fiscal corruption: In all the case councils, taxpayers’ unwillingness to pay taxes and fees are reported as a major obstacle to enhancing local government revenues. The citizens’ survey provides some indications on factors that impact on taxpayers’ compliance behaviour.
The most serious problem perceived by a majority of the respondents (58%) is that the money collected is not spent on public services. Only 29% of the respondents see taxpayers’ unwillingness to pay to be a problem. With respect to the urban-rural divide which are observed on other issues, the respondents in Ilala MC and Mwanza CC perceive that too many taxes/fees and harassment by tax collectors are larger problems compared to what is the case for the respondents in the rural councils.
Dissatisfaction with poor linkages between taxes paid and service delivery show no rural-urban divide. In general, taxes are widely perceived to be unfair. Only 9% of the respondents agree with the statement that ‘most of the tax revenues collected in the area is used for reciprocal services’. Second, the majority of all respondents (51%) hold the view that people should deny paying taxes until services improve. Thirdly, 73% of the

18
Joint Report 2005
respondents say they would be willing to pay more taxes in exchange for improved services. The respondents in Iringa DC are, however, least inclined to willingly increase tax payments in exchange for service improvements.
Approximately 50% of all respondents think that people would evade taxes if they could get away with it. However, we observe some differences between the case councils. While 59% of the respondents in Moshi DC answer that they believe most taxpayers would evade if they thought they could get away with it, the corresponding figure for Kilosa DC is 39%. The most cited reason for tax compliance (46%), on the other side, is that people pay because they ‘will avoid disturbances’. Only 23% of the respondents say that they believe people pay because they anticipate public services.
Almost one third (27%) of the respondents think that misuse of tax revenues is unavoidable, though there are large variations across councils. Only 11% of respondents in Iringa DC see misuse as unavoidable, compared to as many as 41% in Moshi DC. In general, respondents favour village authorities over ward, council and parliamentarians to truthfully allocate tax revenues.
As many as 64% of all respondents think that reporting misuse of tax revenue to a journalist would help reduce this form of corruption. Some respondents do not think any measures will impact on the extent of tax revenue misuse. The most frequent reason given for this attitude is the view that ‘all civil servants are corrupt and they protect each other’. This attitude reflects that much is left to be done to build trust-relations between the local authorities and citizens.
The most favoured measures to improve the use of tax revenues, as expressed by the respondents, are stronger punishment of government employees and politicians. These measures apply across all the case councils. More information to the public on the allocation of tax revenues is also perceived to be a potentially important measure to improve the use of revenues.
2.2.2 Main differences and other comments
Fiscal autonomy in district councils is limited both with respect to revenues and expenditures. This was the case even before the rationalisation of many local revenue bases that took place in 2003. As much as 80-90% of total revenues in rural councils were conditional grants in 2002 (see table 2.2). Moshi DC generated only 9% of its total revenues from own sources in 2002. The corresponding figure for Kilosa was 10% of which development levy was the most important source. However, the rationalisation of many local revenue sources in June 2003 and 2004 has reduced the already limited fiscal autonomy even further. The picture is different in the two urban councils, which generates a substantial of their revenues from own sources, i.e. 64% in Ilala MC and about 48% in Mwanza. The urban-rural divide with respect to own revenue generation reflects the much wider revenue bases available in densely populated urban settings (such as business licences, city service levy and property taxes). It also reflects that poverty in Tanzania is most widespread in rural areas. Hence, the revenue potential is much more limited in rural settings.

19
Joint Report 2005
Table 2.3 Own revenues in % of total revenues
Council 2000 2001 2002 Bagamoyo DC 21,3 17,2 15,4 Ilala MC 58,2 62,2 63,8 Iringa DC 22,9 17,7 16,9 Kilosa DC 18,8 10,8 13,1 Moshi DC 9,1 11,0 9,8 Mwanza CC 56,7 48,8 47,9
Source: Fjeldstad et al. (2004) REPOA Special Paper No.16.
The staffing situation in the treasury departments in the case councils per September 2003 differs substantially both with respect to numbers and qualifications between the councils (Table 2.3). This partly reflects the size of the councils. For instance, Ilala MC has 95 and Mwanza CC has 42 staff members in the Treasury Department, compared to 17 in the Treasury Departments in Bagamoyo and Moshi DC. To some extent it also reflects that some councils are more attractive to work in compared to others, for instance Ilala MC versus Iringa DC. However, a general picture from the Treasury Departments, except for Ilala MC and Mwanza CC, is that less than one third of the staff members are trained accountants.
Table 2.4 Staffing of treasury departments
Council Treasury Department Total Staff No. of trained
accountants Training/ Workshops/ Courses
Bagamoyo DC 17 5 - Ilala MC 95 35 Iringa DC 15 3 Kilosa DC 23 7 6 Moshi DC 17 2 - Mwanza CC 42 14 -
Source: Fjeldstad et al. (2004) REPOA Special Paper No.16.
2.3 Service delivery An overarching objective of the Local Government Reform Programme is to restructure Local Government Authorities so that they can “respond more effectively and efficiently to identified local priorities of service delivery in a sustainable manner”5 . This includes more specific objectives, like to “increase civil society participation in service provision” and “improve quality, access and equitable delivery of public services, particularly to the poor”.
However, we should not view the LGRP at this stage as the main determinant for eventual improvements in service delivery performance. The sector programmes based on donor-funded basket programmes in combination with central government resources released through the HIPC scheme, are equally important. We see this particularly in the health services and in education (PEDP; see below).
5 Mid-Term Development Plan, The Local Government Reform Programme (2002)

20
Joint Report 2005
2.3.1 Key aspects
In this section we present data on the following key aspects related to service delivery:
(i) An overview of citizen’s satisfaction with services based on the citizens survey (2003).
(ii) Primary education. (iii) Health services. (iv) Water supply. (v) Anti-poverty and anti-HIV/AIDS work.
(i) An overview based on the citizens survey: The citizens interviewed in the case councils are in general dissatisfied with the public services. Table 2.4 presents the share of all respondents in the citizens survey, by council and for the whole sample, who are satisfied with the twelve services given. Primary education stands out as the only service rated as satisfactory by a majority of the respondents (70%). This should be interpreted as a result of the Primary Education Development Plan (PEDP; see below). Primary health (dispensaries) gets the second highest rating (33%). The respondents are least satisfied with agricultural extension services (applies to rural areas) and garbage collection (applies to urban areas). This pattern – with highest rates attributed to primary education and health, lowest rates to garbage collection and/or agriculture extension – applies to all the individual case councils, with some smaller exceptions. This pattern is also confirmed when the citizens are asked whether they have seen improvements in any of the listed services. As many as 85% of all the respondents think that primary school services have improved over the last two years, followed of primary health (dispensaries) with 37% seeing improvements. In contrast, agriculture extension services are ranked on the bottom among the rural councils – only between 6% (Iringa DC) and 12% (Kilosa DC) were satisfied, and between 2% (Bagamoyo DC) and 7% (Kilosa DC) have seen improvements. This should raise some concern. Garbage collection is perceived to be in an equally bad condition in the urban areas, particularly in Mwanza CC where only 10% are satisfied and only 1% have seen improvements. The corresponding figures for Ilala MC are 19% and 19%, respectively
Table 2.5 Citizens’ satisfaction rating of key services
Council name
Description Ilala MC
Bagamoyo DC
Kilosa DC
Iringa DC
Moshi DC
Mwanza CC Total
primary school 68,6 61,4 83,3 73,3 66,7 67,1 70,1 Dispensary 45,7 36,7 34,8 36,7 35,2 38,1 37,9 Secondary school 19,0 21,0 29,0 34,3 16,2 21,4 23,5 water supply 18,1 10,0 21,0 35,2 18,6 30,0 22,1 road maintenance 25,7 27,1 13,3 27,6 13,8 24,8 22,1 Sanitation 23,8 16,7 20,5 26,2 21,0 18,6 21,1 Electricity 23,8 10,0 20,0 15,2 27,6 19,0 19,3 law and order 21,9 12,4 24,8 27,6 9,5 15,2 18,6 health clinic 25,2 23,8 5,2 15,7 9,5 13,3 15,5 market place 19,0 11,9 3,8 4,8 24,8 14,8 13,2 agricultural ext. 1,9 8,1 12,4 5,7 10,0 9,0 7,9 garbage collection 19,0 5,7 1,0 - 7,1 10,0 7,1 Source: Citizens survey (2003). % of respondents by councils and in total.

21
Joint Report 2005
However, Table 2.5 shows that 54% of the respondents have, in general, seen an improvement in LG service delivery over the last two years, although there are differences between the case councils. While as many as 66% of the respondents in Mwanza have seen improvements, the corresponding figure for Ilala is 44%.
Table 2.6 LG service delivery over the last 2 years (% of all respondents).
LG service delivery Council name
Ilala MC
Bagamoyo DC
Kilosa DC
Iringa DC
Moshi DC
Mwanza CC
Total
Better than before 44,3 48,1 48,6 61,4 55,2 65,7 53,9 About the same 18,6 24,8 24,3 23,8 29,0 19,5 23,3 Worse than before 25,7 24,8 11,0 4,8 14,3 9,5 15,0 Don’t know 11,4 2,4 16,2 10,0 1,4 5,2 7,8
Source: Citizens survey (2003).
(ii) Primary education: There has been an immense growth in the school enrolment from year 2000 to 2003. Enrolment was close to 100 % in all the six case councils. This success can be attributed to the abolition of school fees in 2001 and the launch of the Primary Education Development Plan (PEDP) in 2002. PEDP, by channelling resources from the donor community, financed a ‘basket fund’ to nearly every village. It has also been capable of mobilising communities to contribute with money and labour in the construction of new class rooms. In addition to improving affordability and accessibility, PEDP may also have improved the quality of primary education. The pass-rate has increased in all the case councils, although a majority of the grade 7 pupils still failed to pass in 2003. Some of the case councils report progress in the quality of education – measured by indicators such as pupils per class room, pupils per desk, and pupils per text book.
Table 2.7 Primary education
Urban Councils Rural councils Ilala
MC Mwanza CC
Kilosa DC
Iringa DC
Moshi DC
Bagamoyo DC
Gross enrolment Rate
- 2000 94% N/A N/A 75% 99% 87% - 2003 137% N/A N/A 99% 116% 99% Net enrolment rate -2000 57% 69% 64% N/A N/A N/A -2003 N/A 90% 95% N/A N/A N/A Pupils per classroom -2000 104 45 73 66 57 69 -2003 70 60 74 54 49 69 Average distance to nearby school -2000 8 km 5 km <5 km 6 km 5 km 3 km -2003 2 km 3 km <5 km 5 km 4 km 2 km Portion of population living more than 5 km away from nearby school -2000 N/A 20% 0% N/A 11% 25% -2003 N/A 15% 0% N/A 8% 20% Pupils per desk -2000 7 3 3 4 4 4 -2003 5 4 4 4 2 6 Pupils per textbook

22
Joint Report 2005
-2000 9 12 3 5 6 8 -2003 5 7 4 4 3 5 Pupils per teacher -2000 43 48 39 63 50 40 -2003 51 60 54 56 43 53 Qualified teachers (‘IIIA) per less qualified teachers (IIIB+C) -2000 2:1 2:1 1:1.5 1:1 N/A 1:4 -2003 3:1 3:1 1:1 2.6:1 N/A 1:5 Completion Rate -2000 85% 94% 64% 85% 98% 75% -2003 85% 97% 64% 96% 96% 85% Pass rate -2000 N/A 48% 11% 11% 23% 36% -2003 N/A 54% 15% 22% 42% 32% Transition rate -2000 10% 23% 12% 4% N/A 30% -2003 8% 14% 30% 11% N/A 50%
Sources: Council profiles and data delivered by the council management teams
However, the main quality indicators, like pupils per teacher and share of qualified teachers, show a rather mixed development. Four of the six case councils report a worsened pupil/teacher ratio, although this is to some extent compensated by a higher share of qualified (“IIIA”) teachers. The lack of teachers threaten the sustainability of the education reform and tends to widen the gap between ‘advanced’ and ‘backlogging’ councils. In spite of these flaws in quality, there is a relatively big satisfaction with primary education in all the councils. Probably it is because people have confidence that improvements in primary education will continue.
(iii) Health services: According to the citizens survey, a majority of the citizens are, in general, not satisfied with health services. As compared to the education sector, the satisfaction rating on health services (dispensaries and health clinics) is low. Only 38% of all the respondents were satisfied with the dispensary in their area, while 26% were neither satisfied nor dissatisfied, and 21% were dissatisfied. The satisfaction with the clinics is even lower, with only 16% of the respondents satisfied. However, there are significant differences between the case councils in this respect. Hence, only 5% of the respondents in Kilosa say there are satisfied with health clinics, compared to 25% in Ilala. This probably reflects that there are few clinics in rural Kilosa DC, while these are more abundant in urban Ilala municipality.
Official health statistics from the councils should in general be treated with caution. Moreover, the quality of the reports developed by the individual health facilities (dispensaries and clinics) and submitted to the council’s health administration varies a lot. Keeping this in mind, a significant progress in health services is reported from all the six councils (see Table 2.8). According to the councils’ own data, the infant mortality rate has been reduced, and the immunisation rate has risen to well above 80 percent in all the councils. Waterborne diseases were on decrease or under control in most of the case councils. Arguably, the main problems are linked to the health facilities (dispensaries and clinics). Although there has been a progress in accessibility since year 2000, around 1/3 of the population in Iringa, Kilosa and Bagamoyo district councils did not have access to health centres in 2003. Although there was an improvement in the number of health workers (nurses) and average waiting time for patients at the dispensaries, the problem of affordability made the majority of population dissatisfied (more so with the clinics than with the dispensaries). Most health facilities require a user fee for every consultation and

23
Joint Report 2005
treatment, or fees on an annual basis for membership in a Community Health Fund. On top of this, the patients usually have to pay for the drugs and medicines.
Moreover, people saw that drugs and medicines were more available in the private and non-government facilities (as indicated in table 2.7), but only if one could afford them. – The the quality of the services was perceived to be lower in government health facilities. In particular, people were much less satisfied with the health centre than with the dispensary, particularly in Kilosa DC and Moshi DC.
Table 2.8 Perceptions of availability of drugs and medicines in three sub-sectors
Ownership of health facilities Bagamoyo DC
Ilala MC
Kilosa DC
Iringa DC
Moshi DC
Mwanza CC
Average
Public/Government 22,2 37,4 42,0 48,3 48,6 29,8 38,1
Mission/BAKWATA/NGO 60,6 85,0 52,3 81,4 76,7 84,8 73,5
Private (Profit-making) 75,0 65,8 53,5 54,5 75,5 79,6 67,3
Source: Citizens survey, 2003. % responding that availability of drugs and medicines have improved the last two years.
Table 2.9 Health services (official data)
Urban Councils Rural councils Ilala
MC Mwanza CC
Iringa DC
Moshi DC
Kilosa DC
Bagamoyo DC
Population (2002) 638 000 266 000 246 000 402 000 490 000 230 000 Infant mortality rate -2000 12.0% 3.2% 15.7% 2.5% 11.2% 12.0% -2003 9.9% 2.0% 15.7% 2.1% 9.4% 10.5% Cases of waterborne diseases (mainly diarrhea) -2000 67 162 825 26 211 145 206 19 444 N/A -2003 2 558 100 003 16 299 23 600 20 200 N/A Immunisation rate -2000 86% 84% 71% 85% 81% 77% -2003 88% 94% 96% 89% 82% 82% Percentage of households with access(within 5 km) to health services -2000 72% 98% 50% 85% 68% 50% -2003 72% 99% 68% 87% 64% 60% People per dispensary -2000 7 589 6 357 6 664 5 040 7 462 6 800 -2003 7 589 5 980 6 147 5 094 8 060 6 800 Number of dispensaries (2003)
99 75 44 88 62 32
Number of health centres/clinics -2000 N/A 8 5 4 7 5 -2003 14 10 8 6 7 5 People per doctor -2000 N/A 23 000 150 243 201 000 228 000 N/A -2003 22 000 43 000 150 205 201 000 167 000 118 000 Number of doctors (2003) 29 6 2 2 3 2 Number of hospitals (2003) 1 4 1 4 2 1 Number of health workers -2000 562 315 135 338 261 268

24
Joint Report 2005
-2003 700 334 186 340 290 301 People per health worker (2003)
900 800 1 300 1 200 1 700 760
Time spent in queuing at dispensaries -2000 60 min 90 min 60 min 30 min 60 min 180 min -2003 60 min 35 min 45 min 30 min 40 min 180 min Source: Council profiles and data delivered by the council management teams or by the district medical officers.
(iv) Water supply: Only 22% of the respondents in the case councils were satisfied with the quality of water supply. Moreover, only 20% of the respondents perceived that there had been some improvements. Satisfaction with water supply is relatively high in Iringa DC (35%) and Ilala MC (30%), compared to Bagamoyo DC where only 10% percent of the respondents said they were satisfied.
The official data provide good reasons why many citizens are dissatisfied with water supply (Table 2.9). With the exception of Mwanza CC, which had benefited from a huge donor-supported water and sanitation programme, no significant progress was reported from the councils on improved accessibility. In three of the councils (i.e. Ilala MC, Kilosa DC and Moshi DC), about half of the population was not covered by adequate water supply services. It is, however, likely that the official data overestimate and/or use different definitions of ‘coverage’/’adequate’ etc. Some councils include installed, but non-functioning water schemes or water sources that can/should not be used during rain and/or dry seasons. Data on the quality of services are also scant. One indicator used to measure the quality of water is the number of cases of waterborne diseases. Data from the case councils on waterborne diseases are not fulfilling national standards, and underreporting is often the case, according to medical officers interviewed. Still, the number of waterborne diseases reported show alarmingly high levels in a majority of the case councils (particularly Mwanza CC, but also in Moshi DC, Iringa DC and Kiloa DC; no figures from Bagamoyo DC).
Table 2.10 Water supply (official data)
City District councils Mwanza Ilala Iringa Kilosa Moshi Bagamoyo
Population covered by adequate water supply service -2000 12% N/A N/A 52% 50% 64% -2003 69% 52% N/A 49% 52% 64% Portion of population living more than 5km away from nearby drinking water collection point -2000 28% 8% 28% 43% 10% 23% -2003 20% 0% 19% 49% 9% 23% Number of wells/bore holes -2000 195 N/A 103 554 33 119 -2003 198 N/A 170 554 36 122 Average distance to water (meter) -2000 200m N/A 1800m 2230m 2000m 1500m -2003 70m N/A 1340m 1800m 1500m 1500m Quality of water supply: no. of waterborne diseases -2000 162 825 67 26 211 19 444 145 206 N/A -2003 100 003 2 558 16 299 20 200 23 600 N/A Source: Perceptions and statistical data from the Local Government Authorities (planning officer and water engineer).

25
Joint Report 2005
(v) Anti-poverty and anti-HIV/AIDS work: Anti-poverty work as well as anti-HIV/AIDS work can be interpreted as extraordinary types of ‘service delivery’ in their demands for urgent, cross-sector and public-civic co-operation. They demand a close cooperation between technical and political, and professional and popular forces. They provide indicators on the councils’ capacity for innovative and socially inclusive action, as well as capacity to implement key national policies for social development.
As to anti-poverty work, the planning documents and interviews with planning officers and executive directors in the case councils did not reflect any consistent or clear definitions of poverty. There were only vague definitions of ‘the poorest-of-the-poor’, and there were no coherent anti-poverty strategies. Moreover, the emphasis was on “equitable delivery of public services” rather than “services particularly provided for the poor”. If vulnerable groups, or ‘the poorest of the poor’, were identified, the emphasis was on reactive alleviation of a unspecified number of ‘lucky few’ rather than pro-active safety nets for everybody within the category. There was an emphasis on social-reproductive services rather than on economic-productive services (like support to the reorganisation and revitalisation of the agricultural sector, which the surveyed citizens found in a dismal state). Another contribution to anti-poverty work in councils where the majority of the citizens are very poor is to make the whole planning system participatory-democratic one. Three challenges in the set-up of this planning system could be mentioned: (i) to make it really participatory, (ii) to make it bottom-up and relevant, and (iii) to make the reformed service delivery system truly pro-poor. There was a tendency to take for granted that NGOs and CBOs, as well as the role of Self-Help Activities in poverty reduction, met these challenges. However, the government and the local council staff are required to regulate and oversee NGOs and CBOs involved in service delivery, and to enforce the law and contracts. The central and local government need also to support and oversee the active empowerment of the poor and disadvantaged groups. These functions are not yet carried out convincingly.
As to anti-HIV/AIDS work, the surveyed citizens reported that they were well informed by multiple national and local sources. “Guidelines for forming AIDS Committees at local government level” were circulated to all the local government authorities from the President’s Office (PO-RALG) on January 8, 2003. Within a few months such committees had been established at the council level, and in Moshi DC and Mwanza CC even at the ward level. Thus, these two council were identified as ‘the high prioiritisers’ of anti-HIV/AIDS work, while Ilala MC and Bagamoyo DC were ‘medium prioritisers’, and Iringa DC and Kilosa DC ‘low prioritisers’. The latter two district councils were also singled out as ‘low performers’ when it came to the researchers’ judgment of technical, or operational, characteristics of anti-HIV/AIDS intervention. The other four councils were classified as ‘medium performers’. Much remains to be done even in the local councils with proven dedication to the struggle against HIV/AIDS.
2.3.2 Main differences and other comments
Local service delivery in Tanzania has improved, but the citizens are still dissatisfied with the accessibility, quality and affordability of almost all the public services. Primary education stands out as the only service rated as satisfactory and improving by a majority of the citizens interviewed in all the six councils, This is supported by official statistics from the councils
With respect to service delivery in general, the variations between the six councils are quite large: In Mwanza CC and Iringa DC 60% of the respondents say they have seen improvements, while less than 10% perceive service delivery is ‘worse than before’. In

26
Joint Report 2005
contrast, 44% in Ilala MC and 48% in Bagamoyo DCsay they have seen improvements, while about 25% think service delivery has deteriorated.
Citizens’ perceptions coincide to a large extent with our assessment of the official data provided by the council management teams. We used two criteria in our assessment: First, the (self-)reported improvements from 2000 to 2003; second, the prior level of accessibility or quality of the service. There were quite big differences between the case councils. As to the urban councils, Mwanza CC seemed to perform quite well.However, since comparable data from Ilala MC were missing, it was difficult to rank the two city councils. Among the rural council, Iringa DC was ranked no.1, followed by Moshi DC. Kilosa DC and Bagamoyo DC were the low performers in our sample.
However, the citizens in the different councils may operate with different normative expectations or ‘standards’ in their judgments. For instance, the more well-educated and well-informed citizens, the higher expectations, and the bigger gap between perceived situation and expectations. We may find more well-educated and well-informed citizens in the urban areas than in the rural areas, more in Ilala MC than in Mwanza CC, and more in Moshi DC than in the other three district councils. Hence, in our case councils there are systematic differences as to the extent of ‘negative-critical’ bias among the citizens in their perceptions of service delivery. Moreover, the quality of the official data may vary between the case councils, reflecting the quality of the human resources in those councils rather than the reality of service delivery. Hence, Ilala MC and Moshi DC might have come better out in a truly ‘objective’ comparison of the service delivery performance in the six case councils.
Nonetheless, when it comes to water supply, we find a disturbing coherence between the soft data (citizen perceptions) and hard data (official statistics). A big portion of the citizens are excluded from adequate water services. Thus, the widespread perception of the citizens that it is most urgent to improve water supply (see Table 2.10), seems to be based on evidence.
When we group dispensary and clinics together, health is the other sector that the citizens perceive is urgent to improve. The third sector is education, where the on-going improvements through PEDP are very much supported and appreciated

27
Joint Report 2005
Table 2.11 Citizens’ perceptions of which public service that must be improved
Council name Total Service that must be improved Ilala MC Bagamoy
o DC Kilosa DC Iringa DC Moshi DC Mwanza CC
Water supply 32,4 38,6 51,9 22,4 29,5 33,3 34,7 Dispensary 11,0 21,9 17,1 21,4 8,6 13,3 15,6 Health clinic 18,1 9,0 5,2 6,2 16,7 17,6 12,1 Second school 9,0 6,7 2,9 6,7 13,8 5,7 7,5 Primary school 5,2 7,6 4,8 7,1 9,0 8,1 7,0 Road maintenance 9,0 2,9 5,2 5,7 10,0 7,6 6,7 Agriculture ext. 1,0 6,2 5,2 15,7 3,3 1,0 5,4 Electricity supply 5,7 5,2 2,4 6,2 7,1 2,9 4,9 Market place 0,5 1,0 3,3 6,2 0,5 1,9 2,2 Law and order 4,3 1,0 1,9 2,4 0,5 1,0 1,8 Garbage collection 1,4 - - - 6,7 1,3 Sanitation 2,4 - - - 1,0 1,0 0,7 100 100 100 100 100 100 100 Source: Citizens survey (2003). % of respondents by council and in total. Only one choice possible.
These perceptions by ordinary citizens should be notified by politicians and public servants responsible for the Local Government Reform Programme and public service delivery sectors at national and local levels. On the one hand, the citizens survey suggests that a few service sectors need an uplift across all the councils: water supply, health and education. Thus, the funding and management of these services should be primarily a national government responsibility. Moreover, the universal access to these services have been, moreover, recognised by the government as basic social-economic rights that it is committed to guarantee. Some districts need extraordinary additional support, for example Kilosa DC in the case of water supply. The role of LGAs should be to assist in detailed planning and implementation of national programmes with earmarked grants.
On the other hand, for a majority of the services we see that citizens’ preferences (consumer demands) vary across councils. For example, in Ilala MC and Moshi DC a big portion of the respondents think that road maintenance is urgent, unlike in Bagamoyo DC. In Iringa DC a significant part of the respondents want to improve agriculture extension, in contrast to Moshi DC and Mwanza CC. This supports a policy of enhanced local autonomy, fiscal decentralisation and block grants to the LGAs.

28
Joint Report 2005
3 Emerging research questions
By way of conclusions, we here present some research questions which the authors think emerge from the research carried out in the project so far. Some of the questions are addressed in special studies and other on-going work of the project. Other questions need to be dealt with in the next phase of the formative process research project.
3.1 Governance Good governance puts emphasis on local government authorities that prepare and implement policies and programmes in close consultation with local actors and communities. Hence citizen participation, accountability, transparency, legitimacy and trust between the local government authorities and citizens are crucial for achieving good governance at the local level. One of the central objectives of the local government reform is to transfer power to the lower level of government by transferring power, functions and decision making to the local communities. This envisages enhanced citizen participation.
Citizen participation in the making of local government plans has been limited. Council bureaucrats regard citizen inputs on council plans as an unrealistic ‘shopping list’ of demands that can not be fulfilled due to financial constraints and citizens incapability of developing proper plans. On the other side, many citizens feel that the council staff does not listen to them. The problem is probably exacerbated by the citizens’ lack of knowledge on the reforms.
The reforms also aim to improve the trust relations between citizens and the local leadership. Without improved relations the co-operation between leaders and citizens will not be possible. Citizens have trust in their elected leaders (councillors, village chairperson). However there is less trust between councillors and council bureaucrats. There is a widespread perception among councillors that council bureaucrats undermine the authority of the elected officials. Council bureaucrats on their part perceive that councillors do not know their duties and intervene in activities that are supposed to be the domain of the bureaucrats. Because of this limited trust councillors complain that the bureaucrats are using the reforms to undermine the political authority of the elected officials. Moreover, financial constraints have led to fewer council meetings, and councillors are often not given adequate time to analyse issues before decisions are made in council plenary meetings.
Corruption is a major problem in in the six case councils. According to the citizens survey, almost 60% of the respondents consider corruption to be a serious problem. Although many people believe that corruption is an evil that should be eradicated, most of them do not report corrupt practices by council officials. Thus, there is therefore need to follow up such issues.

29
Joint Report 2005
Local government autonomy (both fiscal and administrative) is crucial for the success of the local government reforms. Both councillors and council staff complain that the reforms have not given them the autonomy they have been promised by the reforms. In particular they complain about the way the government abolished taxes (so called nuisance taxes) without consulting them. They expect government to cover the deficit. They also expect more central government control to oversee how government subsidies are spent by councils. Councillors still feel unable to control senior council staff because they do not hire them. Even when they have vacancies they still have to use central government created agencies like the Local Government Service Commission which advertises and recruits on behalf of the councils. Councils feel that it is time for councillors to have the power to hire and fire all council staff including council chief executives. This is an area that needs to be followed up especially because council staff differs with councillors fearing that they will be victimized by politicians when they do not support their demand for financial allocations to their respective wards.
Research questions
• Can training provided by the central government help to reduce the tension between councillors and council staff?
• Where, how, and under which conditions, is citizen participation improved? • Where, why, and under which conditions do people report corrupt practices in their
council? • Will the councils see steps to strengthen the local tax basis and financial autonomy? • Will council staff block the desire of the councillors to increase local administrative
autonomy (power to fire and hire)?
3.2 Finances and financial management It is important to analyse changes in local government own revenue generation over time, with the overall objective to identifying key factors that may explain these changes. Lessons from the case councils of the use of incentive schemes for tax collection, private revenue collection (outsourcing) and village involvement are relevant in this context.
Research questions
• What are the council’s major own revenue sources, and can any changes in revenues from own sources be observed during the reform process? Why?
• What mechanisms are established for collection, reporting, accounting and auditing of own revenues, and what changes in these devices can be observed during the reform process? Why?
• What are the councils’ experiences with private revenue collection? What revenue bases are outsourced and why these?
• What incentive schemes exist for tax collection, including retaining revenues collected at sub-council levels (i.e., kitongoji/hamlet, village and ward)? What is the share of revenues retained at the sub-council levels? What are the experiences from the case councils?
• What mechanisms are established to improve harmonisation and rationalisation of local and central government taxes, licenses and fees? What changes can be observed during the reform process?
30
Joint Report 2005
Indicators of change
• The share of own revenue sources as a percentage of total LG revenues. • Own revenues per capita in the councils. • Share of revenues collected which is retained in the villages. • Extent of double taxation between the local and central governments. • The number (complexity) of local government own revenue sources.
Data requirement
• Detailed overview of local government own revenue bases and changes in these during the two recent years (types of revenues and revenues in TSh, aggregated on council level and disaggregated on ward and village level).
• Financial statements for each case council. • Details on who are collecting taxes, fees and charges at various the levels of the local
government and what taxes they are eligible to collect. Any forms of outsourcing revenue collection?
• Detailed overview of revenues retained at village levels during the last two years (in TSh and in % of total revenues collected at village levels).
• Details on the work of the Task force on the harmonisation of local and central government taxes.
Methodology
Key informer interviews, survey data, secondary data (statistics and financial statements) on own revenues disaggregated on individual revenue bases; written material on reporting procedures etc.
3.3 Service delivery Future research needs to examine more closely the relationships between public reform policies, the financial situation and management, and performance in service delivery. Sector-specific development programmes and their governance design in terms of decentralisation should be scrutinised. The following questions are suggested to explore the relationships between governance and service delivery:
a) To what extent does the council respond adequately to priorities made by its citizens? b) Does increased community involvement lead to better service performance? c) To what extent do the differences between the case councils in the citizens’
perceptions of service delivery reflect different (inter-) subjective factors (expectations, trust), rather than more ‘objective’ factors (‘real’ performance, resources)?
a) To what extent do the councils respond adequately to priorities made by its citizens?
An overarching objective of the Local Government Reform Programme is to restructure Local Government Authorities so that they can “respond more effectively and efficiently to identified local priorities of service delivery in a sustainable manner”. The citizens survey (2003) showed that water supply is the service that most citizens want to see improved in all the six councils. However, we found that the councils did not respond
31
Joint Report 2005
positively to this demand. Of their total expenditures, no council spent more than 2 % on water supply. After comparing stated plans and priorities for service delivery of the councils with the preferences of their citizens, we found that there was a deep incongruence between council plans and citizens’ preferences in three of the six case councils. This indicates that a real participatory, bottom-up and cross-sector planning system for service delivery has yet to be implemented.
Methods and data required: First, information on the priorities of the councillors and the council staff are collected through structured interviews (self-filled-in questionnaire). These are to be compared with (i) the official council priorities specified in the council’s development plan and annual budgets etc); (ii) the suggestions to the district plan and/or to the council budget from the villages/mtaas and the wards; and (iii) the priorities of a sample of citizens (e.g. in the next citizens survey). Second, the sector-specific planning and resource allocation systems need to be focused, as to the extent of deconcentration/devolution and power of local councils. Third,,a special focus/case is to be made on water supply: the responses by the council to the priority of water development set by villages/mtaas and wards.
b) Does increased community involvement lead to better service performance?
Our research so far shows that, the Primary Education Development Plan (PEDP), where increased government support is combined with well-organised community involvement (‘self-help’), produces a relatively good service delivery system and more satisfied citizens. Can increased level of self-help alone lead to sustainable improvement of access to and quality of services?
Methods and data required: Primary education should be compared with sectors (almost) equally prioritised by the government and with emphasis on community involvement: water supply, health services and anti-HIV/AIDS work. The focus should be on government resources made available to the communities, on the one hand, and the degree and mode of community involvement, on the other.
c) To what extent do the differences between the case councils in the citizens’ perceptions of service delivery reflect different (inter-) subjective factors (expectations, trust), rather than more ‘objective’ factors (‘real’ performance, resources)?
In social research generally and in the LGRP formative process research particularly, citizens’ perceptions ought to be taken seriously. The data from the citizens survey cited in the previous sections raise many interesting research questions.
Rural-rural differences: Why do people seem to be significantly more satisfied in Iringa District Council than in Moshi DC? Is it because Iringa DC has been a ‘reform council’ (formal part of the Local Government Reform Programme) and Moshi DC not – in other words, because of differences in governance? Or is it because the citizens of Moshi DC are, for historical reasons, better educated and thus better informed and more critical in their judgments of service delivery? Urban-urban differences: Why are people in Ilala MC in general less satisfied with service delivery compared to Mwanza CC, except from in health services? Is the health sector in Ilala MC organised in a way that produces higher satisfaction than in Mwanza, or can the difference be reduced to access to resources – in particular human resources? For instance, is it more attractive for doctors and nurses to work in Ilala/DSM than in Mwanza?
Methods and data required: As point of departures, we will choose one council with exceptionally good citizens’ satisfaction rating of one particular service, and compare this it with one of the ‘average’ councils. Since there are many reason for the mentioned differences, triangulation of data for case analysis is required. It is deemed to be more

32
Joint Report 2005
productive to make separate rural-rural and urban-urban comparisons. Data sources: Analysis of survey data, key informant interviews, interviews with members of school, health and water committees, and reports from council management teams on service delivery.
New indicators of change
Below, we have added indicators that are not included or which are underspecified in the attached Table A3 ‘Indicators of change in service delivery’:
• Share of council expenditures spent on services with specific reference to conclusions from participatory bottom-up planning
• Access to ‘adequate water supply service’ defined as supply of satisfactory amounts of water the whole year (e.g. without seasonal interruptions due to dry seasons, or contamination of wells in the rainy season)
• Diseases as result of inferior drinking water (water borne diseases); cases of cholera specified
• Diseases due to extreme lack of water; cases of skin infection • Use of health facilities: Number of patient consultations monthly/annually in the three
sub-sectors (NGO, private, government sectors). • Nurse/population ratio (not only ‘health worker’), in addition to doctor/population
ratio. • HIV/AIDS: Number of people and categories of people (e.g. by age, gender, marital
status, education etc.) tested for HIV/AIDS in the council. Estimated prevalence of the pandemic.
The revised set of indicators needs to be formulated in close consultation with the of Local Government Reform Team and the mentioned sectors (water and health).

33
Joint Report 2005
Appendix 1 Indicators of change
The process of developing indicators of change has been closely linked to consultations with stakeholders at the local and central government levels, including ordinary citizens, civil servants, elected councillors, and representatives of various interest groups, as described in the Inception Report (2002) and the Fieldwork Manual (2003) (see http://www.repoa.or.tz) For the process of harmonising the suggested indicators – i.e. measures of change – a common basic framework is developed, which links closely the formulation of objectives and implementation strategies of the Local Government Reform.
Linking implementation strategies and indicators implies that measures of change must be able to reflect future development within the three main policy areas addressed by the formative process research, i.e. governance, finances and service delivery. Indicative frameworks for indicators of change for each of the main themes are presented in this appendix (see Tables A1, A2 and A3).

4
Joint Report 2005
Table A1: Indicators of change in governance Inputs Changes in governance
Objectives Indicators of change Methodology/data sources LGRP - focus on training and capacity building - new administrative procedures
1. Participatory planning - Citizens’ perceptions on their involvement in the planning process
- NGOs/CSOs perceptions on their involvement in the planning process
- Council staff perceptions staff on citizens’ involvement in planning
- Elected leaders/councillors perceptions on citizens’ involvement
- Implementation of village plans (if village plans exist) - Available guidelines on bottom-up planning at all levels of
government
- Citizens’ survey/Focus group discussions - Interviews with representatives from the NGOs/CSOs
(the largest, most important, small NGOs, longest present, etc.)
- Interviews with staff at all levels of the LA (DED/MD/CD; DPLO)
- Interviews with councillors and elected political leaders at hamlet and village levels
- Interviews with stakeholders at the central level (ALAT, LGRT)
- Data from the LAs on the how many villages/wards have been covered by ‘bottom-up’ planning seminars & workshops
- Share of LA budget allocated according to village/ward plans
- Review the village, ward and council plans - Council documents commenting/discussing village/ward plans and priorities
2. Gender mainstreaming - Gender balance in council staffing/heads of departments - Gender balance in the council - Gender balance in the village government
- Share of women in the councils staff (heads of department, WEOs, VEOs)
- Share of women councillors - Share of women in the village government (such data can be collected by the internal contact
persons in the case councils) Other reforms/programmes
3. Improved trust relations between citizens’ and the council staff
- Perceptions on the relations between citizens and council - Perceptions on private-public relationship - Tax compliance rate
- Citizens’ survey - Interviews with council MT - Interviews with councillors - Data from the LA Treasury
Other factors 4. Improved trust relations between council staff and councillors
- Perceptions on the relations between council staff and councillors
- Staff survey - Councillor survey - Interviews with council MT - Interviews with staff and councillors

35
Joint Report 2005
Inputs Changes in governance Objectives Indicators of change Methodology/data sources
5. Improved citizens’ rights - Perceptions on accountability & transparency in council affairs vis-à-vis citizens
- Citizens’ understanding of their rights - Less coercion and harassment in tax collection etc.
- Citizens’ survey - Interviews of council staff, councillors and elected
leaders at village/hamlet levels
6. Reduced corruption - Perceptions on the corruption level in the LA - Reported cases of corruption in the LA - Implementation of anti-corruption action plans
- Citizens’ survey - Interviews with council MT, councillors and elected
leaders at village/hamlet level - IA’s reports - CAG’s reports - Councils’ responses to CAG-reports. - Councils’ responses to the Local Authority Accounting
Committee (LAAC) on the CAG-reports. LAAC is a standing committee in the Parliament
7. Increased participation in local elections
- The share of voters using their votes in elections - Voters perceptions on the transparency of elections
- Statistics from DED’s/MD’s/CD’s office - Citizens’ survey
8. Devolved human resource management
- New staff regulations and their implementation - Data on hiring-firing of staff - Perceptions on nepotism
- Documentation from the LGRT and the councils - Interviews with council staff at all levels - Interviews with councillors - Surveys of council staff and councillors
9. Increased HIV/AIDS awareness
- The number of people tested for HIV/AIDS in the LA - Number of HIV-infected staff
- Data from the LA - Data from the Ministry of Health
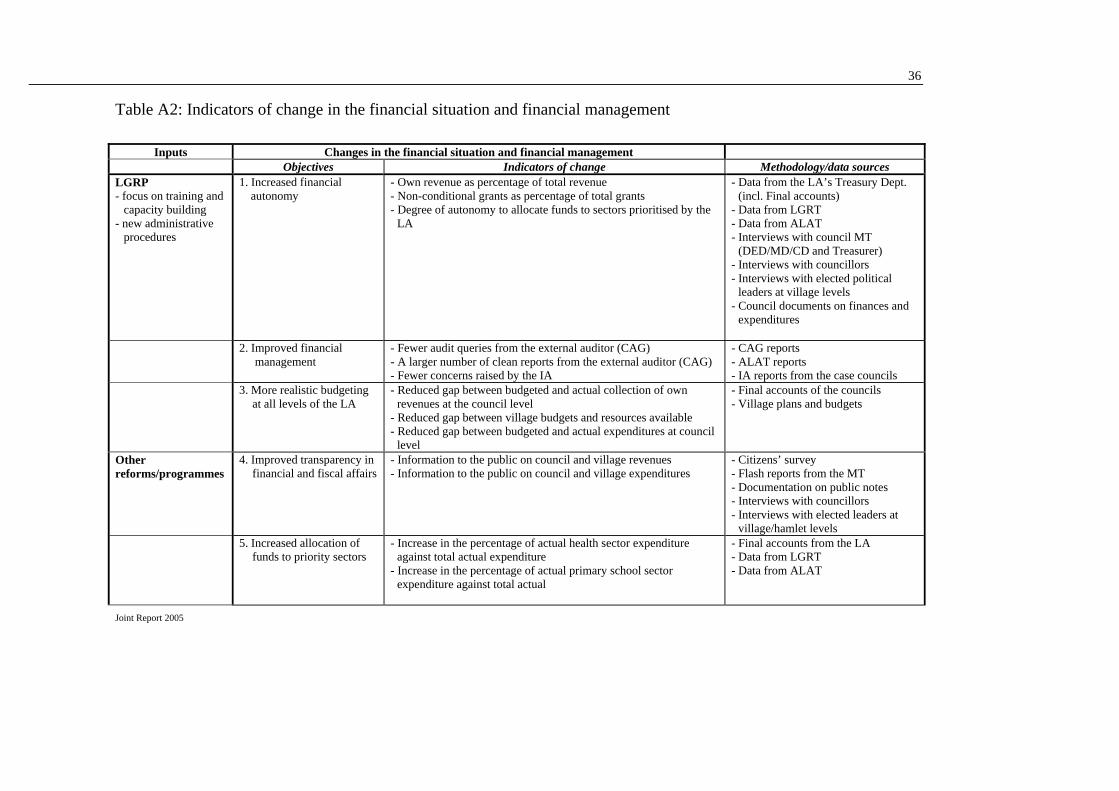
36
Joint Report 2005
Table A2: Indicators of change in the financial situation and financial management
Inputs Changes in the financial situation and financial management Objectives Indicators of change Methodology/data sources
LGRP - focus on training and
capacity building - new administrative
procedures
1. Increased financial autonomy
- Own revenue as percentage of total revenue - Non-conditional grants as percentage of total grants - Degree of autonomy to allocate funds to sectors prioritised by the
LA
- Data from the LA’s Treasury Dept. (incl. Final accounts)
- Data from LGRT - Data from ALAT - Interviews with council MT
(DED/MD/CD and Treasurer) - Interviews with councillors - Interviews with elected political
leaders at village levels - Council documents on finances and
expenditures
2. Improved financial management
- Fewer audit queries from the external auditor (CAG) - A larger number of clean reports from the external auditor (CAG) - Fewer concerns raised by the IA
- CAG reports - ALAT reports - IA reports from the case councils
3. More realistic budgeting at all levels of the LA
- Reduced gap between budgeted and actual collection of own revenues at the council level
- Reduced gap between village budgets and resources available - Reduced gap between budgeted and actual expenditures at council
level
- Final accounts of the councils - Village plans and budgets
Other reforms/programmes
4. Improved transparency in financial and fiscal affairs
- Information to the public on council and village revenues - Information to the public on council and village expenditures
- Citizens’ survey - Flash reports from the MT - Documentation on public notes - Interviews with councillors - Interviews with elected leaders at
village/hamlet levels 5. Increased allocation of
funds to priority sectors - Increase in the percentage of actual health sector expenditure
against total actual expenditure - Increase in the percentage of actual primary school sector
expenditure against total actual
- Final accounts from the LA - Data from LGRT - Data from ALAT

37
Joint Report 2005
Inputs Changes in the financial situation and financial management Objectives Indicators of change Methodology/data sources
Other factors 6. Gender budgeting - Introduction of gender budgeting in the case councils - Data from the councils - Interviews with the MT - Interviews with councillors - Interviews with elected leaders at
village level 7. Computerisation of the
LAs’ Treasury departments
- Number of councils which have implemented the Epicor (Platinum) based IFMS
- Data from the LGRT - Data from the MT of the councils - Data from ALAT
8. Recruitment and capacity building of qualified accountants to the Treasury departments
- Number of trained accountants/total staff in Treasury Depts. - Training courses/workshops for Treasury dept. staff in accounting
- Detailed data on staff education/qualifications from the LGRT
- Detailed data on staff education/qualifications from the MT of the councils
9. Recruitment and capacity building of qualified internal auditors
- Number of trained auditors/total staff in the IA office - Training courses/workshops for IA-staff in auditing
- Detailed data on staff education/qualifications from the LGRT
- Detailed data on staff education/qualifications from the MT of the councils

38
Joint Report 2005
Table A3: Indicators of change in service delivery
Inputs Changes in service delivery (the main objective of the LGRP)
Objectives Indicators of change Methodology/data sources LGRP - focus on training and capacity building - new administrative procedures
1. Improved service delivery (quality)
- Citizens’ perceptions on improved quality of the key services
- Council staff perceptions staff on citizens’ involvement in planning
- Elected leaders/councillors perceptions on citizens’ involvement
- Citizens’ survey/Focus group discussions - Interviews with staff at service points - Interviews with council HQ staff - Interviews with councillors - Interviews with elected political leaders at hamlet and village levels
- Interviews with stakeholders at the central level (ALAT, LGRT)
1.1 Improved quality of primary schools
- Increased average satisfaction rating with primary schools (responsiveness indicator)
- Improved teachers’ grade - Increased average primary school pass rate (data from the LAs)
- Teacher-pupil ratio - Pupil-desk ratio - Pupil-textbook ratio - The national ranking of primary schools in the LA
- Citizens’ survey - Interviews with School committee members - Interviews with council staff (Education officer) - Interviews with head teachers - Interviews with councillors and elected leaders from village and
hamlet levels - Data from the LAs - Data from the LGRT - Data from ALAT - Data from the Ministry of Education
Other reforms/programmes
1.2 Improved quality of health services
- Increased average satisfaction rating with health care (responsiveness indicator)
- Perceptions on the availability of drugs - Infant mortality rate - Immunisation rate - Morbidity rate - Prevalence of stunting
- Citizens’ survey - Interviews with Dispensary committee members - Interviews with council staff (Health officer) - Interviews with health staff/nurses/dispensary staff - Interviews with councillors and elected leaders at village and
hamlet levels - Data from the LAs - Data from the LGRT - Data from ALAT

39
Joint Report 2005
Inputs Changes in service delivery (the main objective of the LGRP)
Objectives Indicators of change Methodology/data sources - Data from the Ministry of Health
Other factors 1.3 Improved quality of water supply
- Number of cases of water born diseases reported
- Perceptions of changes
- Interviews with council staff (Health officer) - Interviews with health staff/nurses/dispensary staff - Interviews with councillors/elected leaders - Data from the LAs - Data from the LGRT - Data from ALAT
2. Improved accessibility to key services for poor people (quantity)
- A larger share of council total expenditures goes to key social services
- Perceptions on access to services
- Data from the LAs (Financial statements) - Data from the LGRT - Citizens’ survey
2.1 Improved access to primary schools
- Perceptions on accessibility - Number of classrooms (schools) per
village/ward - Pupil-classroom ratio - Number of teachers per pupil - Enrolment rate - Average distance to nearby school - Secondary school enrolment rate (share of pupils who completes primary school and proceeds to secondary school)
- Citizens’ survey - Interviews with School committee members - Interviews with council staff (Education officer) - Interviews with head teachers - Interviews with councillors and elected leaders from village and
hamlet levels - Data from the LAs - Data from the LGRT - Data from ALAT - Data from the Ministry of Education
2.2 Improved accessibility of health services
- Perceptions on accessibility - Percentage of households/people with
access to health services (effectiveness indicator)
- Number of health centres in the LA (changes over time)
- Number of health personnel (changes over time)
- Doctor-population ratio - Patient-hospital bed ratio - People-dispensary ratio - People-per doctor ratio
- Citizens’ survey - Interviews with Dispensary committee members - Interviews with council staff (Health officer) - Interviews with health staff/nurses/dispensary staff - Interviews with councillors and elected leaders at village and
hamlet levels - Data from the LAs - Data from the LGRT - Data from ALAT - Data from the Ministry of Health

40
Joint Report 2005
Inputs Changes in service delivery (the main objective of the LGRP)
Objectives Indicators of change Methodology/data sources - Time spent at the dispensary - Average distance to dispensary/health
facility - Availability of drugs
2.3 Improved access to clean water
- Number of people with access to clean water
- Average distance to drinking/clean water source
- Number of wells/bore holes
- Interviews with council staff (Health officer) - Interviews with health staff/nurses/dispensary staff - Interviews with councillors/elected leaders - Data from the LAs - Data from the LGRT - Data from ALAT
3. Increased non-public/private service providers
- Number/share of non-public service providers (PPP)/non-government service outlets (e.g., share of pupils in private school; and number of patients in private health facilities compared to number of patients in public health facilities)
- Public control/regulations of non-public service providers
- Data from the Education & Health departments - Data
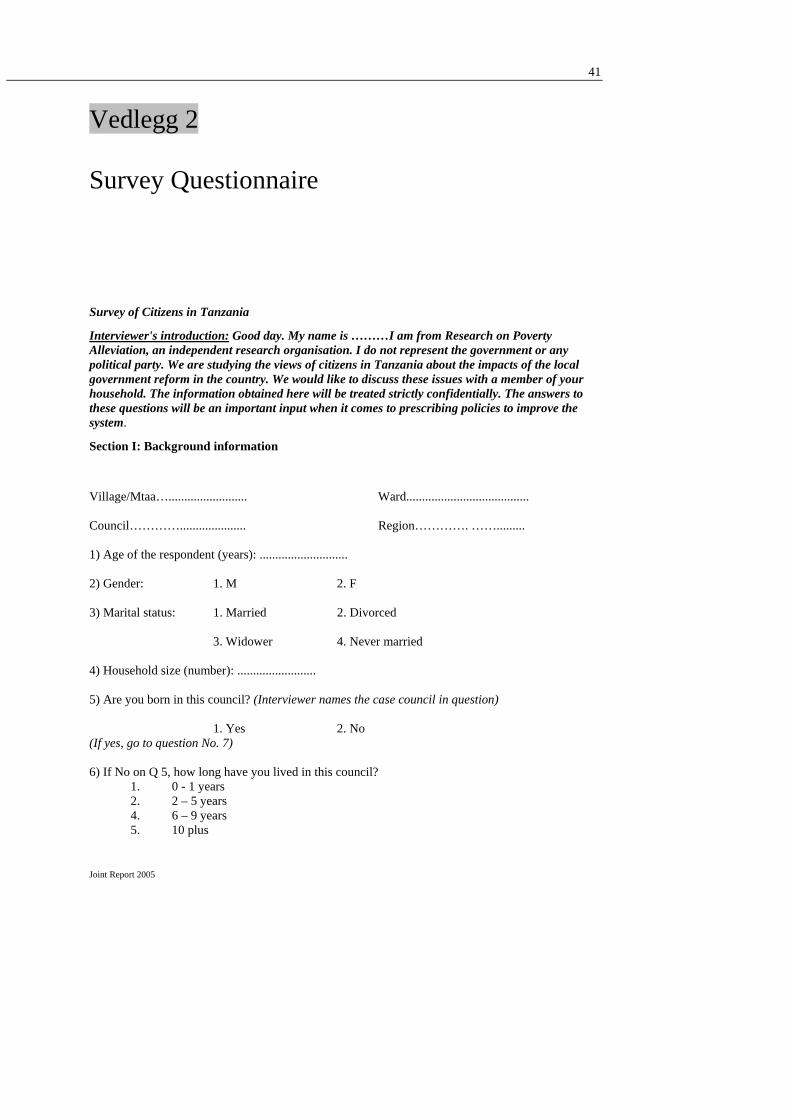
41
Joint Report 2005
Vedlegg 2 Survey Questionnaire
Survey of Citizens in Tanzania
Interviewer's introduction: Good day. My name is ………I am from Research on Poverty Alleviation, an independent research organisation. I do not represent the government or any political party. We are studying the views of citizens in Tanzania about the impacts of the local government reform in the country. We would like to discuss these issues with a member of your household. The information obtained here will be treated strictly confidentially. The answers to these questions will be an important input when it comes to prescribing policies to improve the system.
Section I: Background information
Village/Mtaa…......................... Ward....................................... Council…………..................... Region…………. ……......... 1) Age of the respondent (years): ............................ 2) Gender: 1. M 2. F 3) Marital status: 1. Married 2. Divorced 3. Widower 4. Never married 4) Household size (number): ......................... 5) Are you born in this council? (Interviewer names the case council in question) 1. Yes 2. No (If yes, go to question No. 7) 6) If No on Q 5, how long have you lived in this council? 1. 0 - 1 years 2. 2 – 5 years 4. 6 – 9 years 5. 10 plus

42
Joint Report 2005
7) Religion: 1. Christian 2. Muslim 3. Traditional 4. Other Specify……... 8) Can you read and write? 1. Yes 2. No 9) What is the highest level of formal education you have attained? (circle where appropriate) 1. No formal school 2. Primary 3. Secondary (Form 1-4) 4. Secondary (Form 5-6) 5. College (after Form 4) 6. College (after Form 6) 7. University 8. Vocational/Adult education classes 10) What is your main occupation? 1. Self-employed, agriculture 2. Self-employed, trade and commerce (shops) 3. Self-employed, other (specify)................................... 4. Wage-employee, private sector 5. Wage employee, Government and parastatal 6. Wage employee, others (NGO, etc., specify)……………………. 7. Unemployed 11) What is the principal source of income in your household? (circle only one) 1. Self-employed, agriculture 2. Self-employed, trade and commerce (shops) 3. Self-employed, other (specify)................................... 4. Wage-employee, private sector 5. Wage employee, Government and parastatal 6. Wage employee, other (NGO, etc., specify)………………… 7. Transfers from relatives

43
Joint Report 2005
Section II: Governance and participation Interviewer's introduction: We will now ask you some questions about good governance and how the local government functions in your view. 12) Have you or another person in your household been involved in any of the following?
Yes No a. Village leadership/ward councillor 1 2 b. Participated in full council meetings 1 2 c. School committee member 1 2 d. Water management committee 1 2 e. Public works project committee 1 2 f. Preparation of the village/ward plan 1 2 g. TASAF-project committee 1 2 h. Member of primary co-operative society/farmers association 1 2 i. Member of agricultural/livestock extension contact group 1 2 j. Civic education programme 1 2 k. Local government reform training workshop 1 2
13) You may have heard about different government policies. Which of the following policies have you heard about? And where do you generally hear about these policies? (First ask whether respondent has heard of the policy. If not, circle 2. If yes, circle 1 and read out the options, including ‘other’. Don’t prompt.)
Yes No Radio News- papers
TV Word of
mouth
Service delivery
point
NGO/CBO
Other: which?
1.Local government reform 1 2 3 4 5 6 7 8 9 2. Poverty reduction strategy 1 2 3 4 5 6 7 8 9 3. HIV/AIDS control 1 2 3 4 5 6 7 8 9 4. Anti-corruption 1 2 3 4 5 6 7 8 9 5. Privatisation 1 2 3 4 5 6 7 8 9 6. Education 1 2 3 4 5 6 7 8 9 7. Health 1 2 3 4 5 6 7 8 9 8. Water 1 2 3 4 5 6 7 8 9 9. Rural roads 1 2 3 4 5 6 7 8 9 10. Law and order 1 2 3 4 5 6 7 8 9 11. Taxation 1 2 3 4 5 6 7 8 9 If ‘other’, specify………………………………………..

44
Joint Report 2005
14) Which statement in each pair corresponds more closely to your own views? (Circle code 1 or 2 for each pair of statements)
1. The government is really doing its best to improve public service delivery in the country
1 I have not seen much proof that the government is serious about
improving services
2
2. The government is really doing its best to fight poverty in the country
1 I have not seen much proof that the government is serious about
fighting poverty
2
3. The government is really doing its best to fight corruption in the country
1 I have not seen much proof that the government is serious about
fighting corruption
2
4. The local government reform are helping to improve service delivery
1 I have not seen evidence that LGR are helping to improve service delivery
2
5. The government cares its people in provision of services.
1 The government does not care much about people like us
2
15) The ongoing local government reform emphasises bottom-up planning and citizens’ participation as key elements for good governance. Do you think the local government reform will lead to more popular participation in planning processes? 1. Yes 2. No 3. Don't know (Specify if No)..................................................... 16) Opinions differ on who benefits from the local government reforms. Which statement corresponds closest to your own view? (Read out the three options, don’t prompt).
Overall, the local government reforms: a. Have benefited all Tanzanians more or less equally 1 b. Have benefited a minority of Tanzanians; for most people life is more or less the same as before
2
c. Have benefited a minority of Tanzanians; while for most people life is harder than before
3
17) Have you in the last two years participated in a meeting with the Government or the Local Authority in order to discuss, or take action regarding any local public issue? 1. Yes 2. No 3. Don't know 18) Do you think that the new local government planning system will pay more attention than the previous system to people like yourself and your family? 1. Yes 2. No 3. No changes 4. Don’t know

45
Joint Report 2005
19) Do you feel that you have influence, and that your views get through in the new planning system? 1. Yes 2. No 3. 50-50 (Average) 4. Don’t know 20) In your view, are people’s concerns taken seriously by the council administration? 1. Yes 2. No 3. 50-50 (Average) 4. Don’t know 21) Have you in the last two years seen any of the following information posted in a public place, for example, district council offices, ward office, village office, primary school, government health facility, or newspapers?
Yes No 1.Local government budgets 1 2 2. Taxes and fees collected in this area 1 2 3.Audited statement of council expenditure 1 2 4. Financial allocations to key sectors (e.g., to health, education, water , roads, etc.)
1 2
5. Posters on HIV/AIDS prevention 1 2 6. Guidance on how to report corruption/make an official complaint
1 2
22) If you have any difficulty with the local government or a local government official, with whom do you first seek assistance? (circle only one option) 1. The village chairperson 2. The mtaa/kitongoji leader 3. The ward councillor 4. The DED/MD/CD 5. Religious leaders 6. Representatives for NGOs/CBOs in this area 7. Other citizens here in this area/neighbourhood 8. Family 9. Other (specify)……………………………………………………………. 10. Don’t know 23) What is your view on the village executive officer (VEO)? (Circle only one option) 1. They do as best they can 2. They harass people 3. They are corrupt 4. They are lazy 5. Don’t know (specify)………………. 6. Other (specify)…………………….

46
Joint Report 2005
24) Was this also your view two years ago? 1. Yes 2. No 3. Don't know (Specify if No)..................................................... 25) What is your view on the ward executive officer (WEO)? (Circle only one option) 1. They do as best they can 2. They harass people 3. They are corrupt 4. They are lazy 5. Don’t know (specify)………………. 6. Other (specify)……………………. 26) Was this also your view two years ago? 1. Yes 2. No 3. Don't know (Specify if No)..................................................... 27) What is your view of the council staff? (Circle only one option) 1. They do as best they can 2. They harass people 3. They are corrupt 4. They are lazy 5. Don’t know (specify)………………. 6. Other (specify)……………………. 28) Was this also your view two years ago? 1. Yes 2. No 3. Don't know (Specify if No)..................................................... 29) What is your view on the ward councillors? (Circle only one option) 1. They do as best they can 2. They harass people 3. They are corrupt 4. They are lazy 5. Don’t know (specify)………………. 6. Other (specify)……………………. 30) Was this also your view two years ago? 1. Yes 2. No 3. Don't know (Specify if No).....................................................

47
Joint Report 2005
31) What is your view on the village chair person/mtaa leader? (Circle only one option) 1. They do as best they can 2. They harass people 3. They are corrupt 4. They are lazy 5. Don’t know (specify)………………. 6. Other (specify)……………………. 32) Was this also your view two years ago? 1. Yes 2. No 3. Don't know (Specify if No)..................................................... 33) What is your view on members of Parliament? (Circle only one option) 1. They do as best they can 2. They harass people 3. They are corrupt 4. They are lazy 5. Don’t know (specify)………………. 6. Other (specify)……………………. 34) Was this also your view two years ago? 1. Yes 2. No 3. Don't know (Specify if No)..................................................... 35) During the past two years, have you ever observed/informed an act of corruption by a public official? 1. Yes 2. No 36) During the past two years, have you or anyone in your household reported a corrupt act by a public official? 1. Yes 2. No 37) Do you know what process to follow in reporting an act of corruption by a public official? 1. Yes 2. No 38) In your view, do you think that corruption in this council is a serious problem? 1. Yes 2. 50-50 (average) 3. No 4. Don't know

48
Joint Report 2005
39) Compared to two years ago, the corruption problem in this council today is: 1. Worse than before 2. No changes 3. Less than before 4. Don’t know 40) Whom do you think corruption is mostly perpetuated by? (Circle only one option) 1. Ordinary citizens 2. Businesspeople 3. Local government officials 4. The police 5. Teachers 6. Health workers 7. Councillors 8. Village leaders 9. Others (specify) ………………………….. 41) Do you agree with the following statement? Corruption is natural occurrence and part of our daily life, so denouncing it is unnecessary: 1. Agree 2. Neither agree nor disagree (50-50) 3. Disagree 4. Don't know 42) Do you agree with the following statement? Corruption is a disease which we should all combat, denouncing every case that we know about: 1. Agree 2. Neither agree nor disagree (50-50) 3. Disagree 4. Don't know 43) Did you vote in the last village/kitongoji/mtaa elections? 1. Yes 2. No (If Yes go to question 45) 44) If you did not vote in those elections, why? (circle only one option) 1. I wasn’t interested 2. I was not informed about the election 3. I was impeded from voting 4. I had a political justification for not voting 5. My vote does not matter anyway 6. I was not old enough (below 18) 7. Other reason (specify)…………………………………………..

49
Joint Report 2005
45) Did you vote in the last ward elections? 1. Yes 2. No (If Yes go to question 47) 46) If you did not vote in those elections, why? (Enter only one option) 1. I wasn’t interested 2. I was not informed about the election 3. I was impeded from voting 4. I had a political justification for not voting 5. My vote does not matter anyway 6. I was not old enough (below 18) 7. Other reason (specify)………………………………………….. III: Service delivery and compliance Interviewer's introduction: Now we would like to ask you some questions on local government services in this area. 47) Some people are satisfied with the quality and capacity of public services in this district/town.
Others are dissatisfied with the public services. What is your opinion about the following services in
this area?
Satisfied 50/50 Dissatisfied Don’t know
None
Primary school 1 2 3 4 5 Secondary school 1 2 3 4 5 Dispensary 1 2 3 4 5 Health clinic 1 2 3 4 5 Water supply 1 2 3 4 5 Garbage collection 1 2 3 4 5 Sanitation 1 2 3 4 5 Market place 1 2 3 4 5 Road maintenance 1 2 3 4 5 Agricultural extension services 1 2 3 4 5 Electricity supply 1 2 3 4 5 Law and order 1 2 3 4 5

50
Joint Report 2005
48) In your opinion, which of the following services have improved the most, the last two years? (Circle services given priority by respondent)
Improved Not improved Primary school 1 2 Secondary school 1 2 Dispensary 1 2 Health clinic 1 2 Water supply 1 2 Garbage collection 1 2 Sanitation 1 2 Market place 1 2 Road maintenance 1 2 Agricultural extension services 1 2 Electricity supply 1 2 Law and order 1 2
49) In your opinion, which of the below public services is most important to improve? (Circle only one based on respondent priority)
Priority Primary school 1 Secondary school 2 Dispensary 3 Health clinic 4 Water supply 5 Garbage collection 6 Sanitation 7 Market place 8 Road maintenance 9 Agricultural extension services 10 Electricity supply 11 Law and order 12
50) What do you in general think of the quality of local government services today compared to two years ago? 1. Worse than before 2. About the same as before 3. Better than before 4. Don't know

51
Joint Report 2005
51) In the last two years, have you noticed any significant changes in the quality of primary education?
Improvement No change Deterioration Don’t know
a. Quality of school buildings 1 2 3 4 b. Number of classrooms 1 2 3 4 c. Performance of teachers 1 2 3 4 d. Number of teachers 1 2 3 4 d. Availability of textbooks 1 2 3 4 e. Availability of desks 1 2 3 4 f. Costs of schooling 1 2 3 4
52) More people send their children to primary school than before. Why do you think this is the case?
Important reason
Not an important reason
Don’t know
The quality of primary education has improved 1 2 3 People were mobilised by the government 1 2 3 School fees were abolished 1 2 3 People have more money than before 1 2 3 People recognise the importance of schooling 1 2 3
53) Do you have access to a health facility in this area?
Yes No Government health care facility 1 2 Mission/BAKWATA/NGO health facility 1 2 Private health care facility 1 2

52
Joint Report 2005
54) If Yes, on question 53): In the last two years, have you noticed any significant changes in the quality of health care? Improvement No change Deterioration Don’t
know Government health care fascilities Cleanliness of health facility premises 1 2 3 4 Health staff politeness 1 2 3 4 Availability of drugs 1 2 3 4 Speed of treatment 1 2 3 4 Cost of treatment 1 2 3 4 Mission/BAKWATA/NGO health care fascilities Cleanliness of health facility premises 1 2 3 4 Health staff politeness 1 2 3 4 Availability of drugs 1 2 3 4 Speed of treatment 1 2 3 4 Cost of treatment 1 2 3 4 Private health care fascilities Cleanliness of health facility premises 1 2 3 4 Health staff politeness 1 2 3 4 Availability of drugs 1 2 3 4 Speed of treatment 1 2 3 4 Cost of treatment 1 2 3 4 55) In the last twelve months, have you received information about HIV/AIDS?
Yes No On the radio? 1 2 On television? 1 2 In a newspaper or magazine? 1 2 From a wall poster? 1 2 From a government official 1 2 From a politician 1 2 From the village council/mtaa leader? 1 2 In a health centre/dispensary? 1 2 From an advertising board? 1 2 In a church or mosque? 1 2 From a dance/theatre troupe? 1 2 From an NGO/CBO? 1 2 From another source? (Specify) …………………………
1 2

53
Joint Report 2005
56) If there has been any improvement in the service delivery in this area in recent years, to which factors can it be attributed to? Yes No Don’t know The Local Government Reform 1 2 3 Central government grants/support 1 2 3 Donors (specify) 1 2 3 TASAF 1 2 3 No Improvement 3 Other (specify)……………………………. 57) Do you consider that tax revenues collected in this area are used to provide public services? (Circle only one) 1. Yes, most of it 2. Only partly 3. Not at all 4. Don't know 58) Do you agree with people who say they will not pay taxes until they get better services from the Council in return? (Circle only one) 1. Agree 2. Neither agree nor disagree (50-50) 3. Disagree 4. Don't know 59) Would you be willing to pay more taxes if the public services were improved? 1. Yes 2. No 3. Don't know 60) Do you think people should contribute to better social services through more self-help activities? 1. Agree 2. Neither agree nor disagree (50-50) 3. Disagree 4. Don't know Section IV: Finances and financial management Interviewer's introduction: We will now ask you a few questions about taxes and user fees. We are particularly interested in hearing your views about how the local government tax system works and the problems facing taxpayers in this area. 61) Are you aware of any recent changes in the local government tax system? 1. Yes 2. No If Yes, please specify:………………………………………………………………………..

54
Joint Report 2005
62) Have you been informed that the Government has abolished Development levy? 1. Yes 2. No 63) Do you agree with the Government’s decisions to abolish Development levy as a local government tax?
1. Yes 2. No 3. No view If Yes, specify how you think the revenue gap could be filled: ……………………… ………………. 64) Do you pay any taxes, fees or charges?
1. Yes 2. No If Yes, specify what types: 1. ……………………………………………………. 2. ……………………………………………………. 3.…………………………………………………….
65) What is your personal view on the level of taxes and user charges in this area? 1. Too high 2. Reasonable 3. Too low 4. Don’t know 66) Do you get any information on how much tax revenues and user charges are collected in the area where you live? 1. Yes 2. No 3. Don’t know (If No go to question 68) 67) If Yes on 66), from whom? 1. Village chairperson/mtaa leader 2. Village executive officer (VEO) 3. Ward executive officer (WEO) 4. Council staff 5. The ward councillor 6. Public notes 7. Newspapers 8. Other (specify)……………………………………………………………….. Procedures of collecting taxes and user charges Interviewer's introduction: We will now ask you a few questions on the way tax collection is carried out.

55
Joint Report 2005
68) Do you receive a receipt from the office or collector when you pay taxes and user charges? 1. Never 2. Sometimes 3. Always 4. Don’t pay taxes 69) If (and when) you receive a receipt, is the receipt you receive on the same amount that you paid? 1. Higher 2. The same 3. Lower 4. Not applicable 70) Do you know someone in the neighbourhood who doesn’t pay taxes and user charges? 1. Many persons 2. Only some persons 3. No one at all 4. Don’t know 71) Are you asked or need to pay public officials some money unofficially? Never Occasionally Often a. To get access to public schools? 1 2 3 b. To get access to public health services? 1 2 3 c. get connected to public services (e.g., electricity, telephone, etc.)?
1 2 3
d. To get licences and permits? 1 2 3 e. When dealing with taxes and tax collection? 1 2 3 f. Other (specify)? …………………… 1 2 3 72) This district faces problems of collecting taxes and user charges. Whom do you consider is most to blame for the poor collection of taxes and charges in this area? Agree 50-50 Disagree Don’t
know No
views a. Taxpayers/fee payers 1 2 3 4 5 b. Tax collectors/fee collectors 1 2 3 4 5 c. Local government elected leaders 1 2 3 4 5 d. Licences and permits officers 1 2 3 4 5 e. Council employees 1 2 3 4 5 f. Central government authorities/TRA 1 2 3 4 5 g. Parliamentarians 1 2 3 4 5 h. Other (specify)……………………….. 1 2 3 4 5

56
Joint Report 2005
73) What do you consider is the major problem in collection of taxes and user charges? (Circle each factor only once on a scale from 1 to 4, with 1=agree; 2=50-50; 3=disagree; 4=don’t know).
Agree 50-50 Disagr
ee Don’t know
No view
a. Too many taxes/fees 1 2 3 4 5 b. Too high rates 1 2 3 4 5 c. Taxpayers are unwilling to pay 1 2 3 4 5 d. Taxes are not spent on public services 1 2 3 4 5 e. Collectors are dishonest 1 2 3 4 5 f. Collectors harass people 1 2 3 4 5 g. Local government elected leaders are dishonest 1 2 3 4 5 h Parliamentarians are dishonest 1 2 3 4 5 74) Do you agree with people who say that almost every taxpayer would cheat to some extent if he thought he could get away with it? Circle only one) 1. Agree 2. 50 - 50 3. Disagree 4. Don’t know 75) What do you think is the major reason why some people pay taxes? (Circle only one option) 1. They have no opportunity to evade 2. They anticipate public services 3. They feel obligations towards the Government 4. They will avoid disturbances 5. Other (specify).................................. 6. Don’t know 76) What is your general view of tax collectors? (Circle only one option) 1. They do as best they can 2. They harass people 3. They are corrupt 4. They are lazy 5. No views 6. Other (specify)……………………. 77) Was this also your view two years ago? 1. Yes 2. No 3. Don't know (Specify if No).....................................................

57
Joint Report 2005
78) Where do you think the money you pay in taxes or user charges is least likely to be misused? (Circle only one option) 1. If paid to village authorities 2. If paid to ward office 3. If paid to council authorities 4. If paid directly to service facility (primary school, health unit, etc.) 5. If paid to central government through Tanzania Revenue Authority (TRA) 6. Does not matter, tax money will be misused in any case 7. Don’t know 79) Whom do you think is least likely to misuse the money you pay in taxes or user charges? (Circle only one option) 1. The village authorities 2. The ward office 3. The council authorities 4. The Parliamentarians (central government politicians) 5. The people receiving the money in the service facility (teachers, doctors etc) 6. The Tanzania Revenue Authority (TRA) collectors 7. Don’t know 8. Other (specify)………………… 80) In your opinion, would it help to reduce the misuse of the money you pay in taxes or user charges if you took the following action?
Yes No Don’t know
a. Report the case to village authorities 1 2 3 b. Report the case to ward office 1 2 3 c. Report the case to council authorities 1 2 3 d. Report the case to the police 1 2 3 e. Report the case to (inform) the Member of Parliament 1 2 3 f. Inform the political party leaders 1 2 3 g. Inform a journalist about misuse 1 2 3 h. Other measures (specify)……………………………… 1 2 3
If No to (a-h); specify reasons ………………………………………………………………………… 81) Have you yourself taken any of the actions we have just talked about within the last two years? 1. Yes 2. No (Specify)…….………………………. 82) Do you know someone who has taken any of the actions mentioned above within the last two years? 1. Yes, many persons 2. Yes, only some persons 3. No one at all 4. Don’t know (Specify) ………………………..

58
Joint Report 2005
83) If No one on Question 82), why do people not take action? (Circle only one option) 1. People do not know what to do 2. People are scared of repercussions 3. People think it will not work anyway 4. Don’t know 84) Which of the following measures do you think would help to improve the use of the money you pay in taxes or user charges?
Agree 50-50 Disagree Don’t know More information to the public about how much money is collected
1 2 3 4
More information to the public on how revenues are used
1 2 3 4
Stronger punishment of government employees that misuse funds
1 2 3 4
Stronger punishment of politicians that are responsible for misuse of funds
1 2 3 4
More involvement of the police in tax collection 1 2 3 4 More involvement of the military in tax collection
1 2 3 4
More fundamental changes than those we have talked about above (specify)……..
1 2 3 4
Interviewer's final comments: This was the last question. Thank you very much for your kind assistance in answering our questions.