LO N 0) - ojp.gov
58
U.S. Department of Justice National Institute of Justice 149255 This document has been reproduced exactly as received from the person or organization originating it. Points of view or opinions stated in this document are those of the authors and do not necessarily represent the officiai position or policies of the Nationai Institute of Justice. Permission to reproduce this copyrighted material has been granted by New Jersey Department of corrections to the Nationai Criminal Justice Reference Service (NCJRS). Further reproduction outside of the NCJRS system requires permission of the copyright owner. LO LO N 0) If you have issues viewing or accessing this file contact us at NCJRS.gov.
Transcript of LO N 0) - ojp.gov
U.S. Department of Justice National Institute of Justice
149255
This document has been reproduced exactly as received from the person or organization originating it. Points of view or opinions stated in this document are those of the authors and do not necessarily represent the officiai position or policies of the Nationai Institute of Justice.
Permission to reproduce this copyrighted material has been granted by New Jersey Department of
corrections to the Nationai Criminal Justice Reference Service (NCJRS).
Further reproduction outside of the NCJRS system requires permission of the copyright owner.
LO LO N 0)
~
If you have issues viewing or accessing this file contact us at NCJRS.gov.

INTRO DUCTION
This report has been developed to provide information regarding selected offender characteristics in each correctional complex, major institution and satellite housing unit under the jurisdiction of the New Jersey Department of Corrections on December 31,1992. The selected characteristics compiled in this report are Base Offense at Admission, Total Term at Admission, Ethnicity, Age, County of Commitment, and Mandatory Minimum Terms.
The Prison Complex includes the New Jersey State Prison, East Jersey State Prison, Bayside State Prison, Riverfront State Prison, Mid-State, Southern State, Northern State Prison, Edna Mahan Correctional Facility for Women and the Adult Diagnostic and Treatment Center (ADTC is a facility for adult male sex offenders).
The Youth Correctional Complex consists of the Garden State Reception and Youth Correctional Facility, the Albert C. Wagner Youth Correctional FaCility, and the Mountainview Youth Correctional FaCility. The Juvenile Facilities include the New Jersey Training School for Boys, the Lloyd McCorkle Training School for Girls and the Juvenile Medium Security Facility.
"Adult Offenders in Other Faciilties" include state-sentenced inmates housed in county jails, Halfway Houses and at the Central Medical Unit (St. Francis Hospital).
"Not Coded" are records for offenders in the correctional system for whom admission characteristics data have not been entered into the computerized information system as of December 31, 1992.
Major Institutions having Satellites include the following:
M/:"JOR INSllTUllONS
New Jersey State Prison
East Jersey State Prison
Bayside State Prison
Garden State Reception and Youth Correctional Facility
Albert C. Wagner Youth Correctional Facility
Mountainview Youth Correctional Facility
i
SATELUTES
Vroom Readjustment Unit Jones Farm
East Jersey Camp, Marlboro Camp and Secaucus
Bayside Farm and Ancora Unit
Wharton Tract and Keamey
New Lisbon Unit, and North Princeton Developmental Center Unit (NPDC)
Stokes Unit and High Point Unit
j) 0! cJl
l ~
HIGHLIGHTS
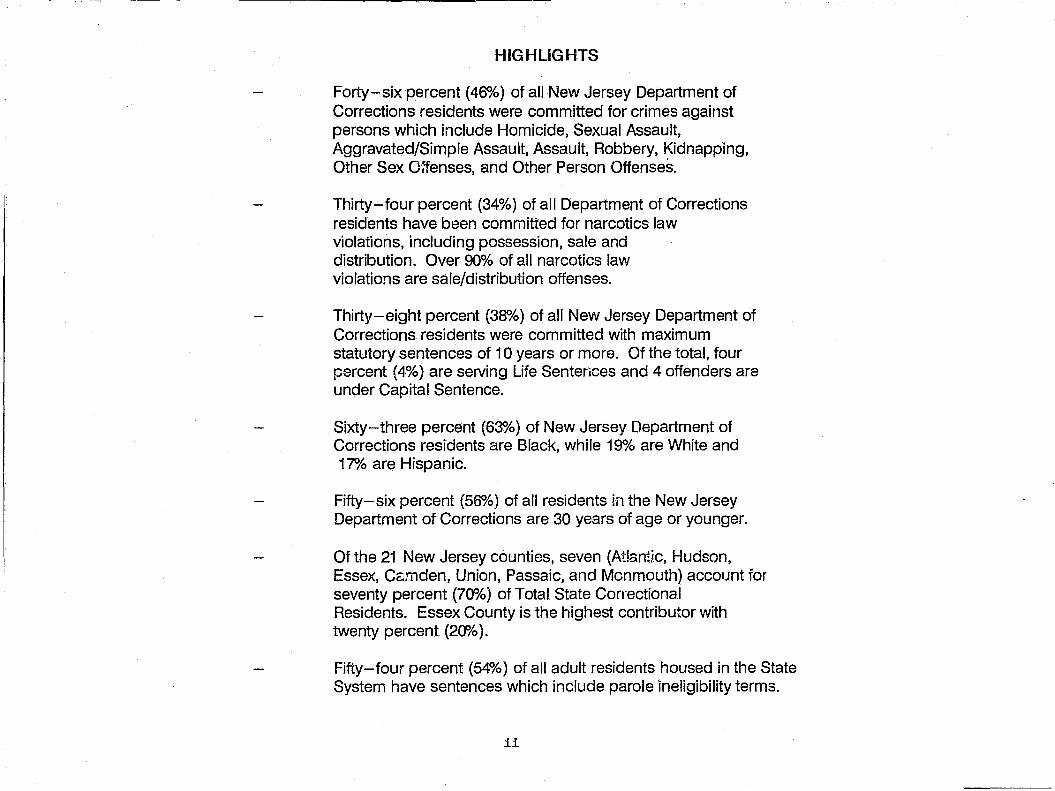
Forty-six percent (4EY>1o) of all New Jersey Department of Corrections residents were committed for crimes against persons which include Homicide, Sexual Assault, Aggravated/Simple Assault. Assault. Robbery. Kidnapping. Other Sex O:=tenses. and Other Person Offenses.
Thirty-four percent (34%) of all Department of Corrections residents have been committed for narcotics law violations. including possession. sale and distribution. Over 00010 of all narcotics law violations are sale/distribution offenses.
Thirty-eight percent (38%) of all New Jersey Department of Corrections residents were committed with maximum statutory sentences of 10 years or more. Of the total. four pBrcent (4%) are serving Life Sentences and 4 offenders are under Capital Sentence.
Sixty-three percent (63%) of New Jersey Department of Corrections residents are Black. while 19% are White and 17% are Hispanic.
Fifty-six percent (5EY>1o) of all residents in the New Jersey Department of Corrections are 30 years of age or younger.
Of the 21 New Jersey counties, seven (Atlantic. Hudson, Essex. Cc;mden. Union, Passaic. and Monmouth) account for seventy percent (70%) of Total State Correctional Residents. Essex County is the highest contributor with twenty percent (20'10).
Fifty-four percent (54%) of all adult residents housed in the State System have sentences which include parole ineligibility terms.
ii

TABLE OF CONTENTS
REPORT NAME
TOTAl RESIDENTS IN NEW JERSEY STATE CORRECTIONAl INSTITUTIONS AND SATELLITES ON DECEMBER 31,1992
OFFENDERS IN NEW JERSEY CORRECTIONAl INSTITUTIONS BY AGE Prison Complex Offenders Youth Complex Offenders Jwenile Complex Offenders
OFFENDERS IN NEW JERSEY CORRECTIONAl INSTITUTIONS BV ETHNIC IDENTIFICATION Prison Complex Offenders Youth Complex Offenders Jwenile Complex Offenders
OFFENDERS IN NEW JERSEY CORRECTIONAl INSTITUTIONS BY COUNlY OF COMMITMENT Prison Complex Offenders Youth Complex Offenders Jwenile Complex Offenders
OFFENDERS IN NEW JERSEY CORRECITONAlINSTITUTIONS BY BASE OFFENSE Prison Complex Offenders Youth Complex Offenders Jwenile Complex Offenders
OFFENDERS IN NEW JERSEY CORRECTIONAL INSTITUTIONS BY TOTAl TERM AT ADMISSION Prison Complex Offenders Youth Complex Offenders Jwenile Complex Offenders
OFFENDERS IN NEW JERSEY CORRECTIONAL INSTITUTIONS BY MANDATORY MINIMUM TERM Prison Complex Offenders Youth Complex Offenders
iii
PAGE
2 3-6 7,8 9
10 11-14 15,16 17
18 19-22 23,24 25
26 27-30 31,32 33
34 35-38 39,40 41
42 43-46 47,48
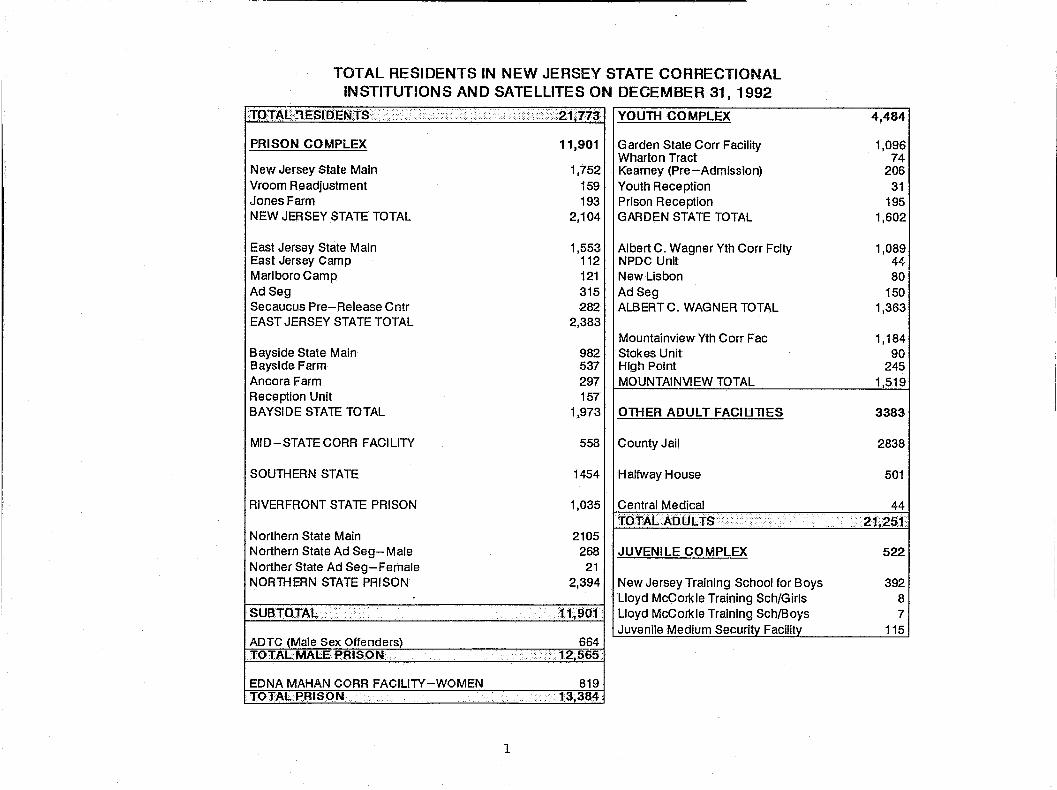
TOTAL RESIDENTS IN NEW JERSEY STATE CORRECTIONAL INSTITUTIONS AND SATELLITES ON DECEMBER 31.1992
TO,-Ac·~EsmEN.TS>.······· .... • .... ·.>21113 YOUTH COMPLEX
PRISON COMPLEX 11,901 Garden State Corr Facility Wharton Tract
New Jersey State Main 1,752 Kearney (Pre-Admission) Vroom Readjustment 159 Youth Reception Jones Farm 193 Prison Reception NEW JERSEY STATE TOTAL 2,104 GARDEN STATE TOTAL
East Jersey State Main 1,553 Albert C. Wagner Yth Corr Fclty East Jersey Camp 112 NPDC Unit Marlboro Camp 121 New Lisbon AdSeg 315 AdSeg Secaucus Pre-Release Cntr 282 ALBERT C. WAGNER TOTAL EAST JERSEY STATE TOTAL 2,383
Mountainview Yth Corr Fac Bayside State Main 982 Stokes Unit Bayside Farm 537 High Point Ancora Farm 297 MOUNTAINVIEW TOTAL Reception Unit 157 BAYSIDE STATE TOTAL 1,973 OTHER ADULT FACIUllES
MID-STATE CORR FACILITY 558 County Jail
SOUTHERN STATE 1454 Halfway House
RIVERFRONT STATE PRISON 1,035 Central Medical td'rALA(j(jLts·· ... · ... •••..•. .....>
Northern State Main 2105 Northern State Ad Seg- Male 268 JUVENILE COMPLEX Norther State Ad Seg-Female 21 NORTHERN STATE PRISON 2,394 New Jersey Training School for Boys
Lloyd McCorkle Training Sch/Girls SUBTOTAl .. ·.• 11i901 Lloyd McCorkle Training Sch/Boys
Juvenile Medium Security Facility ADTC (Male Sex Offenders) 664 TOTALMALE·PRISON. 12565
EDNA MAHAN CORR FACILITY-WOMEN 819 TOTAL·PJUSON ·13384
1
4,484
1,096 74
206 31
195 1,602
1,089 44 80
150 1,363
1,184 90
245 1,519
3383
2838
501
44 21;251
522
392 8 7
115

1992 OFFENDER CHARACTERISTICS REPORT
AGE GROUPS
FORTY-ONE PERCENT (41%) OF ALL RESIDENTS IN THE NEW JERSEY DEPARTMENT OF CORRECTIONS ARE UNDER 30 YEARS OF AGE.

OFFENDERS IN NEW JERSEY CORRECTIONAL INSITUllONS ON DECEMBER 31,1992 BY AGE GROUPS
The age of the offender is the offender's chronological age as of December 31, 1992.
OFFENDERS IN CORRECTIONAL INSTITUTIONS ON DECEMBER 30,1992 BY AGE GROUPS
,:;. < .•.•...•...• ' ...•....•• , ••••. ,.'... ..... ,Other Adulf p.·~r;(i{()ijp$ . .. ,.
TOTAL OFFENDERS 121,25'1 1 100%111,9011100%14,4841100%. 6641100%
Under 17 years 17 years 18-20 years 21-22 years 23-24 years 25-27 years 28-30 years 31-33 years 34-36 years 37-39 years 40-44 years 45-49 years 50-54 years 55-59 years 60-64 years 65 vears or older
6 0% o 0% 4 0% 27 0% 3 0% 22 0%
1,078 0% 106 1% 794 18% 2,101 10% 529 4% 1,186 26% 2,289 11% 823 7% 1,013 23% 3,093 15% 1,587 13% 825 18% 2,948 14% 1,859 16% 400 9% 2,474 12% 1,721 14% 117 3% 2,056 10% 1,490 13% 48 1% 1,608 8% 1,185 10% 23 1% 1,787 8% 1,299 11% 28 1%
890 4% 666 6% 13 0% 441 2% 329 3% 6 0% 227 1% 161 1% 2 0% 126 1% 88 1% 1 0% 100 0% 55 0% 2 0%
- The median age for adult residents is 29 years.
1 0% o 0% 4 1%
16 2% 26 4% 40 6% 61 9% 57 9% 79 12% 64 10%
114 17% 84 13% 36 5% 35 5% 17 3% 30 5%
- Three percent (3%) of all adult offender~ in the Department of Corrections are 20 years or age or younger.
- Of all adult offenders, 50% are between the ages of 21 and 30; 30% are 31 to 39 years old; and 17% are 40 years or older.
2
8191 100%. 3,3831 100%
o 0% 1 0% 1 0% 1 0%
18 2% 156 5% 50 6% 320 9% 72 9% 355 10%
129 16% 512 15% 124 15% 504 15% 118 14% 461 14% 87 11% 352 10% 79 10% 257 8% 85 10% 261 8% 30 4% 97 3% 17 2% 53 2% 4 0% 25 1% 2 0% 18 1% 3 0% 10 0%
TOTAL OFFENDERS 522
12 years 1 13 years 5 14 years 22 15 years 57 16 years 105 17 years 152 18 years 129 19 years 23 20 years 6 21 years 2 22 years 2 23 vears or older 18
- The median age for juveniles is 17 years.
100%
0% 1% 4%
11% 20% 29% 25% 4% 1% 0% 0% 3%
- Seventy-four percent (74%) of all juvenile residents are 16 to 18 years of age.
- Vi-tually all juvenile facility residents older than age 21 are adult inmate para-professionals housed at th& New Jersey Training School for Boys.

PRISON COMPLEX OFFENDERS ON DECEMBER 31, 1992 BY AGE GROll'S
i~·strrhrl(jN.·.·.· •• ·ltoTA~I~~f7~~I';i!I~6L2oI21.;.22b~lk~k~--~;1~~--;6·.btL3~6]£3~~4.~~li6l~~~~?~'.bo~5~155--59 ••• ·~·~·~I~~;f New Jersey State Prison - Main
Vroom Readjust
Jones Farm
New Jersey State Total East Jersey Prison - Main
East Jersey Camp
Marlboro Camp
EJSP - AdSeg
Seacucus Pre-Release Cntr East Jersey Total Bayside State Prison - Main
Bayside Farm
Ancora Unit
Reception Unit
Bayside Total
1,752 100.0%
159 100.0%
193 100.0%
2,104 100.0%
1,553 100.0%
112 100.0%
121 100.0%
315 100.0%
282 100.0%
2,383 100.0%
982 100.0%
537 100.0%
297 100.0%
157 100.0%
1,973 100.0%
o 0.0%
o 0.0%
o 0.0%
o 0.0%
o 0.0%
o 0.0%
o 0.0%
o 0.0%
o 0.0%
o 0.0%
o 0.0%
o 0.0%
o 0.0%
o 0.0%
o 0.0%
0.1%
o 0.0%
o 0.0%
0.0% o
0.0%
o 0.0%
o 0.0%
o 0.0%
o 0.0%
o 0.0%
o 0.0%
o 0.0%
o 0.0%
o 0.0%
o 0.0%
21 1.2%
3 1.9%
2 0.1%
26 1.2%
10 0.6%
o 0.0%
o 0.0%
6 1.9%
9 3.2%
25 1.0%
10 1.0%
2 0.4%
o 0.0%
2 1.3%
14 0.7%
741 136
1 196
1 238
1 225
1 192
1 197
1 208
1 130 I 67
1 36
1 21 I 10
4.2% 7.8% 11.2% 13.6% 12.8% 11.0% 11.2% 11.9% 7.4% 3.8% 2.1% 1.2% 0.6%
51 61 21 I 23 1 221 24 3.1% 3.8% 13.2% 14.5% 13.8% 15.1%
7 0.4%
86 4.1%
44 2.8%
11 I 14 0.6% 0.8%
1531 231 7.3% 11.0%
€lei 162 4.4% 110.4%
21 51 7 1.8% 4.5% 6.3%
21 41 11 1.7% 3.3%. 9.1%
33 10.5%
251 51 7.9% 16.2%
281 33 9.9% 11.7%
54 19.1%
1091 135 4.6% 5.7%
285 12.0%
431 69 4.4% 7.0%
149 15.2%
11 I 19 2.0% 3.5%
49 9.1%
18 6.1%
19 12.1%
91 4.6%
191 37 6.4% 12.5%
10 I 25 6.4% 15.9%
1171 260 5.9% 13.2%
3
31 I 36 1.8% 2.1%
2921 283 13.9% 13.5%
2211 225 14.2% 14.5%
27 1.5%
243 11.5%
235 15.1%
251 21 I 19 22.3% 18.8% 17.0%
20 27 19 16.5% I 22.3% I 15.7%
541 431 37 17.1% 13.7% 11.7%
50 29 18 17.7% I 10.3% I 6.4%
370 I 345 1 328 15.5% 14.5% 13.8%
1621 1551 119 16.5% 15.8% 12.1%
871 721 80 16.2% 13.4% 14.9%
461 541 42 15.5% 18.2% 14.1%
241 19 1 21 15.3% 12.1% 13.4%
3191 300 I 262 16.2% 15.2% 13.3%
11 6.9%
23 1.3%
231 11.0%
191 12.3%
13 11.6%
10 8.3%
27 8.6%
14 5.0%
255 10.7%
88 9.0%
67 12.5%
31 10.4%
13 8.3%
199 10.1%
271 141 2 17.0% 8.8% 1.3%
18 1.0% 253
12.0% 191
12.3%
12 0.7%
156 7.4%
100 6.4%
9 0.5%
78 3.7%
71 4.6%
101 51 0 8.9% 4.5% 0.0%
131 91 4 10.7% 7.4% 3.3%
21 6.7%
26 9.2%
261 11.0%
108 11.0%
88 16.4%
28 9.4%
13 8.3%
237 12.0%
15 4.8%
13 4.6%
142 6.0%
40 4.1%
39 7.3%
2 0.6%
4 1.4%
81 3.4%
19 1.9%
17 3.2%
131 7 4.4% 2.4%
6 3.8%
98 5.0%
5 3.2%
48 2.4%
1 0.6%
0.1% 38
1.8% 25
1.6%
5 4.5%
0.8%
0.3%
1 0.4%
33 1.4%
13 1.3%
4 0.7%
2 0.7%
o 0.0%
19 1.0%
01 0 0.0% O.O",.{,
01 2 0.0% 0.1%
21 I 12 1.0% 0.6%
81 2 0.5% 0.1%
01 0 0.0% 0.0%
01 1 0.0% 0.8%
01 0 0.0% O.O""{'
31 0 1.1% 0.0%
11 I 3 0.5% 0.1%
51 2 0.5% 0.2%
21 0 0.4% 0.0%
01 0 0.0% 0.0%
01 0 0.0% 0.0%
71 2 0.4% 0.1%
.... ---------------------------------------------------------------------------------------------------------
INS1"rt&rlb~ ..IToTAL UNDER ·17
Mid-State
Southern State
Riverfront
Ncrthern State Prison
Ncrthern State Ad Seg-Male
Ncrthern State Ad Seg-Female Northern State Total SUBTOTAL·
ADTC
Total Male Prison
Edna Mahan Corr Fac- Women Total Prison
558 100.0%
1,454 100.0%
1,035 100.0%
2,105 100.0%
268 100.0%
21 100.0%
2,394 100.0% 11,901 100~O%
664 100.0%
.12,565 100;0%
819
o O.oak
o 0.0%
o 0.0%
o 0.0%
o 0.0%
o 0.0%
o 0.0%
° 0;0%· o
0.0% o
0.0% o
100.0% • 0.0% .13~3841·· ° 100.0% . 0,0%
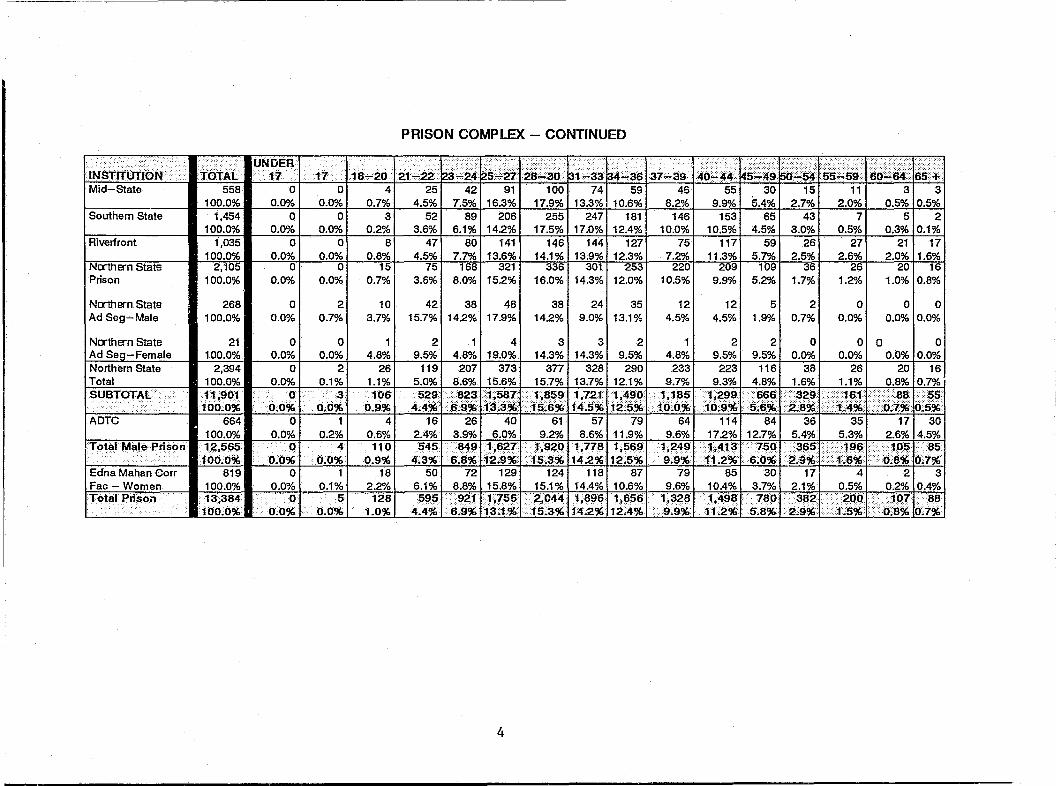
PRISON COMPLEX - CONTINUED
·17. ··118~20121,,"22~~l~4~~4kj12ij.J~6btia3b4g~~.137"'3~~og~.p~~;.~~~~w~··I:g~4g41~:d$tt:l~~~.D: 01 41
251 421
911
1001 741
591
461 551·
301
151 111 31 3 0.0% 0.7% 4.5% 7.5% 16.3% 17.9% 13.3%; 10.6% 8.2% 9.9% 5.4% 2.7% 2.0% 0.5% 0.5%
01 31 52
1 89
1 206
1 255
1 2471 181
1 146
1 153
1 65
1 43
1 71 51 2 0.0% 0.2% 3.6% 6.1% 14.2% 17.5% 17.0% 12.4% 10.0% 10.5% 4.5% 3.0% 0.5% 0.3% 0.1%
01 81 471 80 1 1411 146 1 1441 1271 75 1 1171 59 1 26 1 271 211 17 0.0% 0.8% 4.5% 7.7% 13.6% 14.1% 13.9% 12.3% 7.2% 11.3% 5.7% 2.5% 2.6% 2.0% 1.6%
01 - 15r 75 1 -'mar 3211---3361 301 1 253 1 2201~91 1091-361 -26~2°1-16 0.0% 0.7% 3.6% 8.0% 115.2% 16.0% 14.3% 12.0% 10.5% 9.9% 5.2% 1.7% 1.2"k 1 1.0% 0.8%
2 0.7%
o 0.0%
2 0.1% . .;3. O~O%.
1 0.2%
4 0.0%
0.1% 5
0.0%
10 3.7%
1 4.8%
26 1.1% 106
0.9')(; 4
0.6% 110
0.9%·· 18
2.2% 128
1.0%
42 38 48 15.7% 1 142% 1 17.9%
38 14.2%
241 35 9.0% 13.1%
12 4.5%
21 11 41 31 31 2 9.5% 4.8% 19.0% 14.3% 14.3% 9.5% 1 4.8%
1191 2071 3731 3771 328 I 290 I 233 5.0% 8.6% 15.6% 15.7% 13.7% 12.1% 9.7%
lf~r~lli2~1~1~~8~\; ~f5fi~}J~:~ 2.4%
161 261 40 I 61 I 57 1 79 1 64 3.9% 6.0% 9.2% 8.6% 11.9% 9.6%
545 4.3%
50 6.1% 595
4:4%·
84!Jt 1,6~71 1,9201· 1,778 1. 1j5691 1,249 6':8% 12i9%15;3%14;2%12.5% .. 9.9%
721 129 1 1241 118 1 87 1 79 8.8% 15.8% 15.1% 14.4% 10.6% 9.6%
.. 9~111 ;:r56 I <Z.044 I 1 j896 I· 1,6561 1 ~328 6.9% ia:t%.:ts23% 14,2%12:4%9.9%
4
12 4.5%
51 2 1.9% 0.7%
o 0.0%
01 0 0.0% 0.0%
21 21 01 01 0 I 0 9.5% 9.5% 0.0% 0.0% 0.0% 0.0%
2231 1161 38 I 26 1 20 I 16 9.3% 4.8% 1.6% 1.1% 0.8% 0.7%
l116f:ll-~?I:-~?i~I}!~;:f~I:~.f~16.J~ 1141 84 1 36 1 35 1 17 1 30
17.2% 12.7% 5.4% 5.3% 1 2.6% 14.5% 14131 .• :.7501 ...... 365 .... j;.2~ .s;Oi'. .2.9% (i.11~1 •••• i.ri~t~l().:~
4 21 3 851 301 17 10.4% 3.7% 2.1%1 0.5%1 o.2"kIO.4% .. ;4981 .... 7801. ...:3821 •. ··....20QI :;':-1 OTfcc88
11;2:% "5.8%>~t9% •. i1~5Cj(;.O;8ij,r(ti%
~ __________________________________________ a. ____________________________________________ ----____ --__ --------------------------------------------------------------------------------

~~- --------~---------------------------------------------------------------------------------------------------------------------------------------------------------------------------------
PRISON COMPLEX MALES BY AGE GROUPS ON DECEMBER 31, 1992
(EXCLUDES ADTC)
37-49 26%
60 +
1%
50-59 4%
- The median age for prison males, exclusive of ADTC, is 32 years.
- Fifty-six percent (56%) of male Prison Complex offenders are aged 25 to 36. This group is consistently the largest age group from facility to facility throughout the entire prison complex - including males and females. The only exception is ADTC, where only 36% fall into this group.
BY AGE GROUPS ON DECEMBER 31, 1992
ADTC
18-24 7%
60 + 7%
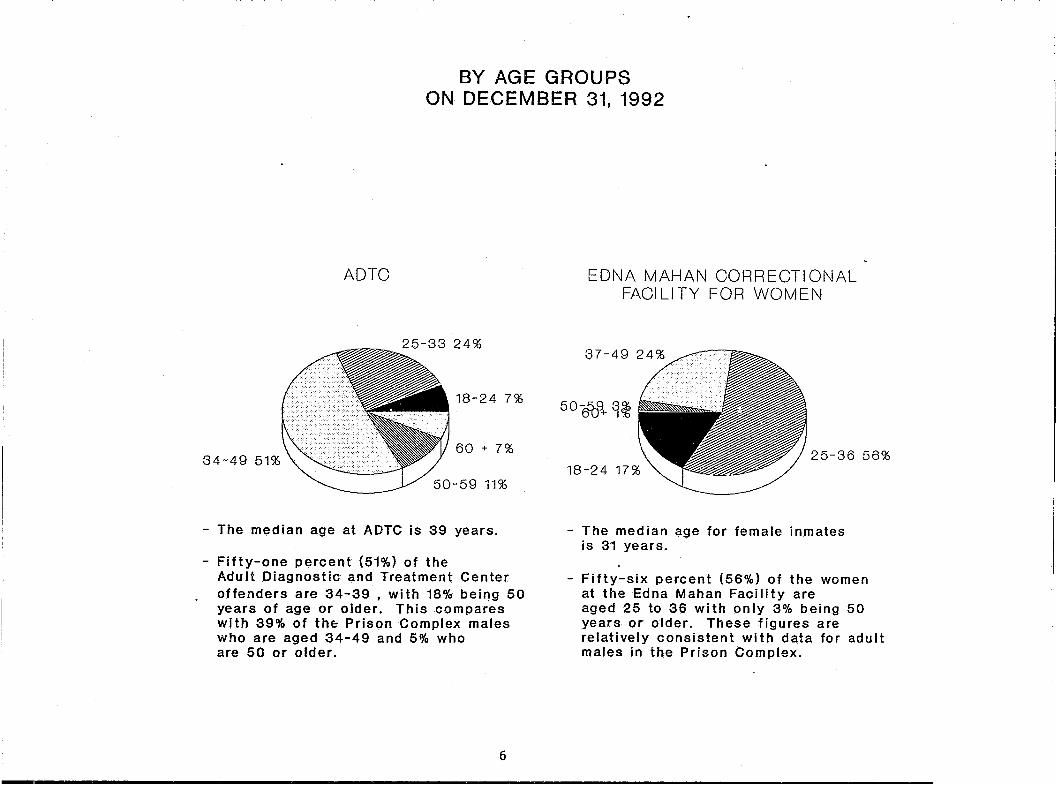
- The median age at ADTC is 39 years.
- Fifty-one percent (51%) of the Adult Diagnostic and Treatment Center offenders are 34-39 , with 18% bei'1g 50 years of age or older. This compares with 39% of the: Prison Complex males who are aged 34-49 and 5% who are 50 or older.
6
EDNA MAHAN CORRECTIONAL FACILITY FOR WOMEN
50~+1~
25-36 56%
- The median age for female inmates is 31 years.
- Fifty-six percent (56%) of the women at the Edna Mahan Facility are aged 25 to 36 with only 3% being 50 years or older. These figures are relatively consistent with data for adult males in the Prison Complex.
------.................................................. ------------------------------------------------------------------------------------------------------------------------------
.iNsnhn-ldtil ..
Garden State Recep & Youth
Wharton Tract
Kearney
Youth Reception
Prison Reception
Garden State Total
Albert C. Wagner Yth Crcntnl Fac
New Usbon
NPDC Unit
Wagner Ad Seg
Albert C. Wagner Total
Mountainview Yth Crcntnl Fac
High Point
Stokes Unit
Mountainview Total
Total Yooth
1,096 100.0%
74 100.0%
206 100.0%
31 100.0%
195 100.0%
1,602 100.0%
1,089 100.0%
80 100.0%
44 100.0%
150 100.0%
1,363 100.0%
1,184 100.0%
245 100.0%
90 100.0%
1,519 100.0%
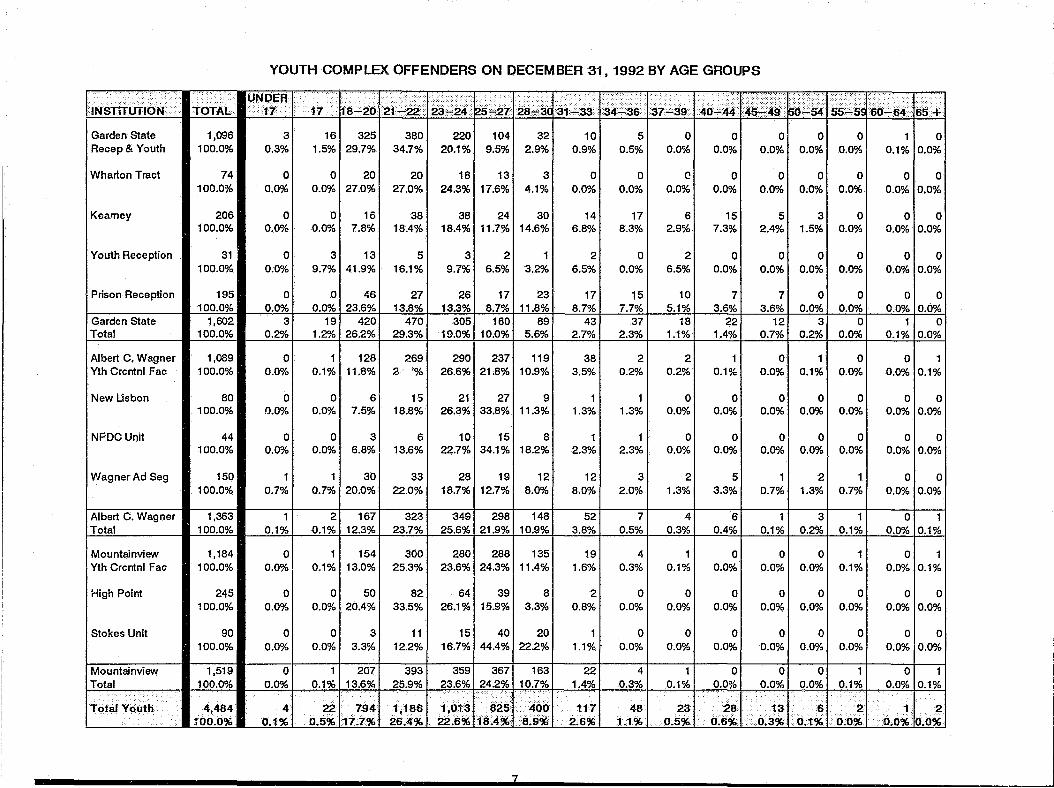
YOUTH COMPLEX OFFENDERS ON DECEMBER 31, 1992 BY AGE GROUPS
3 0.3%
o 0.0%
o 0.0%
o 0.0%
o 0.0%
3 0.2%
o 0.0%
o 0.0%
o 0.0%
0.7%
1 0.1%
o 0.0%
o 0.0%
o 0.0%
o 0.0%
161 3251 380 I 220 1 104 1 32 1.5% 29.7% 34.7% 20.1% 9.5% 2.9%
01 20 0.0% 27.0%
20 27.0%
181 13 24.3% 17.6%
3 4.1%
o I 161
381
381 241 30
0.0% 7.8% 18.4% 18.4% 11.7% 14.6%
31 13 9.7% 41.9%
01 46 0.0% 23.6%
191 420 1.2% 26.2%
5 16.1%
27 13.8%
470 29.3%
9.7!1 6.5~1 3.2%
26 13.3%
305 19.0%
17 8.7%
160 10.0%
23 11.8%
89 5.6%
1 I 128 1 269 1 290 I 237 1 119 0.1% 11.8% 2 '% 26.6% 21.8% 10.9%
o I· 61 1 51 21 1 271 9 0.0% 7.5% 18.8% 26.3% 33.8% 11.3%
01 31 61 10
1 15
1 8 0.0% 6.8%. 13.6% 22.7% 34.1% 18.2%
11 30 0.7% 20.0%
33 22.0%
281 191 12 18.7% 12.7% 8.0%
21 167
1 323
1 349
1 298
1 148 0.1% 12.3% 23.7% 25.6% 21.9% 10.9%
1 1 154 1 300 1 280 I 288 1 135 0.1% 13.0% 25.3% 23.6% 24.3% 11.4%
01 50
1 82
1 64
1 39
1 8 0.0% 20.4% 33.5% 26.1% 15.9% 3.3%
01 31 11 0.0% 3.3% 12.2%
15 16.7% I 44.4% I 22.2%
40 20
10 0.9%
o 0.0%
14 6.8%
2 6.5%
17 8.7%
43 2.7%
38 3.5%
1.3%
2.3%
12 8.0%
52 3.8%
19 1.6%
2 0.8%
1.1%
5 0.5%
o 0.0%
17 8.3%
o 0.0%
15 7.7%
37 2.3%
2 0.2%
1 1.3%
2.3%
3 2.0%
7 0.5%
4 0.3%
o 0.0%
o 0.0%
o 0.0%
o 0.0%
6 2.9%
2 6.5%
10 5.1%
18 1.1%
2 0.2%
o 0.0%
o 0.0%
2 1.3%
4 0.3%
0.1%
o 0.0%
o 0.0%
o 0.0%
o 0.0%
15 7.3%
o 0.0%
7 3.6%
22 1.4%
1 0.1%
o 0.0%
o 0.0%
5 3.3%
6 0.4%
o 0.0%
o 0.0%
o 0.0%
01 01 0 0.0% 0.0% 0.0%
01 01 0 0.0% 0.0% 0.0%
51 31 0 2.4% 1.5% 0.0%
01 01 0 0.0% 0.0% 0.0%
7 3.6%
12 0.7%
o 0.0%
3 0.2%
o 0.0%
o O.OO,{,
01 11 0 0.0% 0.1% 0.0%
01 01 0 0.0% 0.0% O.OO'{'
0' 01 0 0.0% I 0.0% 0.0%
11 21 1 0.7% 1.3% 0.7%
O.1~ I 0.~1 0.1%
0.0~1 0.0~1 0.1%
01 01 0 0.0% 0.0% 0.0%
01 01 0 0.0% 0.0% 0.0%
11 0 0.1% 0.0%
01 0 0.0% 0.0%
01 0 0.0% 0.0%
01 0 0.0% 0.0%
01 0 0.0% 0.0%
11 0 0.1% 0.0%
01 1 0.0% 0.1%
01 0 0.0% 0.0%
01 0 0.0% 0.0%
01 0 0.0% 0.0%
01 1 0.0% 0.1%
01 1 0.0% 0.1%
01 0 0.0% 0.0%
01 0 0.0% 0.0%
207 3591 3671 1631 221 41 1 I 0 I 0 I 0 I 1 I 0 I 1 0.1 % I 13.6% I 25.9% I 23.6% 24.2% 10.7% 1.4% 0.3% 0.1 % 0.0% 0.0% 0.0% 0.1 % 0.0% 0.1 %
393
4,484. 41 221. 7941 1,1861 1,013'· ~25146hl H71 481 231~81 131 61 ·21 112 100.0%. 0.1% 1 0.5% 117.7% 1 26.4% I 22.6%1:18,4%18.9%1 2.6%1 1.1% IJ),S% 1 0.6%1·0.3%10;1% 10J)% 1 o~o%I();o% 1 J.
7
INSTITUTION
County Jail
Halfway House
Central Medical
Total Other Facilities
Totsl Adults
,~--~------~~
ADULT OFFENDERS IN OTHER FACILITIES
TOTAL
2,838 100.0%
501 100.0%
44 100.0%
3,383 100.0%
21,251 1()g-"~
UNDER 17 17-18 19-20 21-22 23-24 25-27
1 1 146 279 304 437 0.0% 0.0% 5.1% 9.8% 10.7% 15.4%
0 0 9 40 49 72 0.0% O.OO'{' 1.8% 8.0% 9.8% 14.4%
0 0 1 1 2 3 0.0% 0.0% 2.3% 2.3% 4.5% 6.8%
1 1 156 320 355 512 0.0% 0.0% 4.6% 9.5% 10.5% 15.1%
6 31 1,074 2,101 2,289 3,093
-().~'" L 0.1'J{, ~.1% ~9% _10.8% ~~
YOUTH COMPLEX
21-24 49%
25-30 27%
30 +
5%
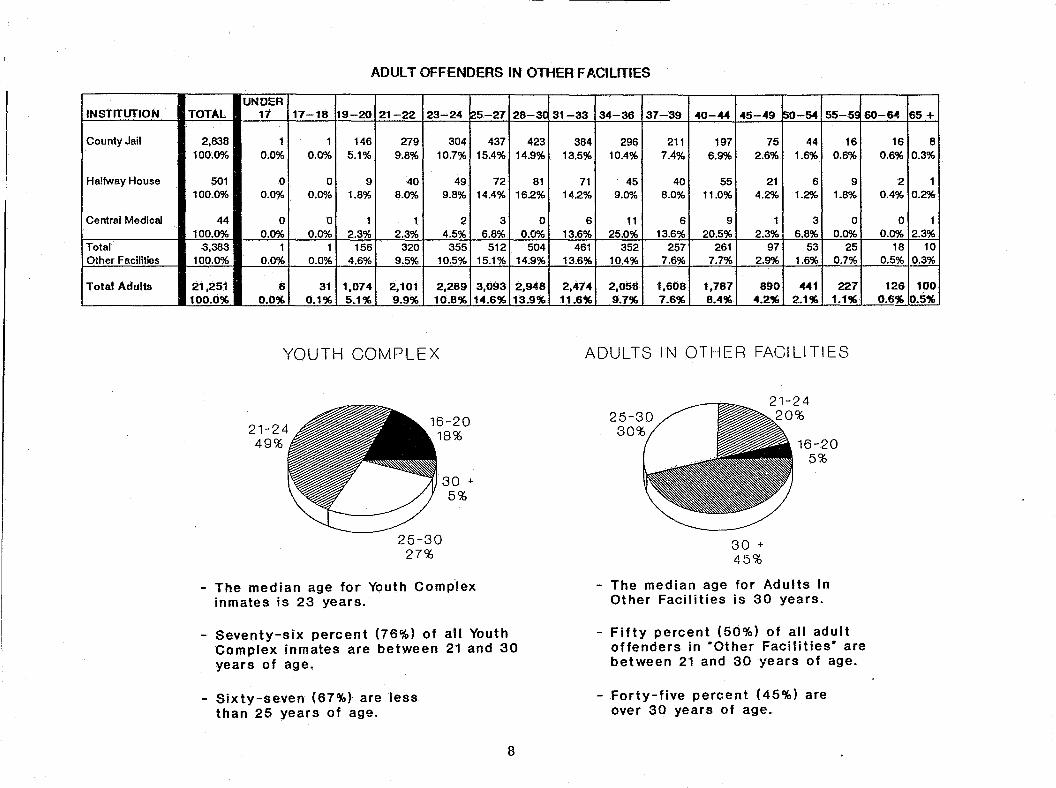
The median age for Youth Complex inmates is 23 years.
28-3(J
423 14.9%
81 16.2%
0 0.0%
504 14.9%
2,948 13.9%
Seventy-six percent (76%) of all Youth Complex inmates are between 21 and 30 years of age.
Sixty-seven (67%) are less than 25 years of age.
8
31-33 34-36 37-39 40-44 45-49 SO-54 55-5!l 60-64
384 296 211 197 75 44 16 13.5% 10.4% 7.4% 6.9% 2.6% 1.6% 0.6%
71 45 40 55 21 6 9 14.2% 9.0% 8.0% 11.0% 4.2% 1.2% 1.8%
6 11 6 9 1 3 0 13.6% 25.0% 13.6% 20.5% 2.3% 6.8% 0.0%
461 352 257 261 97 53 25 13.6% 10.4% 7.6% 7.7% 2.9% 1.6% 0.7%
2,474 2,056 1,608 1,787 890 441 227 11.6% 9.7% 7.6% 8.4% 4.2" 2.1% 1.1%
ADULTS IN OTHER FACILITIES
30 +
45%
16-20 5%
- The median age for Adults In Other Facilities is 30 years.
- Fifty percent (50%) of all adult offenders in ·Other Facilities· are between 21 and 30 years of age.
- Forty-five percent (45%) are over 30 years of age.
16 0.6%
2 0.4%
0 0.0%
18 0.5%
126 0.6%
65 +
8 0.3%1
1 0.2%
1 2.3%
10 0.3%
100 10.5"
INSTITUTION
New Jersey Training School
Lloyd McCorkle Tmg School/Boys
Lloyd McCorkle Trng School/Girls
Juvenile Medium Security Facility
Total Juvenile
JUVENILE COMPLEX ON DECEMBER 31, 1992 BY AGE GROUPS
TOTAL
392 100.0%
7 100.0%
8 100.0%
115 100.0%
522 100.0%
12 13 14 15 16
0 4 18 50 70 0.0% 1.0% 4.6% 12.8% 17.9%
0 0 0 0 0 0.0% 0.0% 0.0% 0.0% 0.0%
1 0 2 1 0 12.5% 0.0% 25.0% 12.5% 0.0%
0 1 2 6 35 0.0% 0.9% 1.7% 5.2% 30.4%
1 5 22 57 105 0.2% 1.0% 4.2% 10.9% 20.1%
17
118 30.1%
1 14.3%
2 25.0%
31 27.0%
152 29.1%
18 19
93 18 23.7% 4.6%
1 1 14.3% 14.3%
1 12.5%
34 29.6%
129 24.7%
22 • 4%
19 21 6%
0 0.0%
4 3.5%
23 4.4%
20 21
3 1 0.8% 0.3%
1 0 14.3% 0.0%
1 0 12.5% ·0.0%
1 1 0.9% 0.9%
6 2 1.1% 0.4%
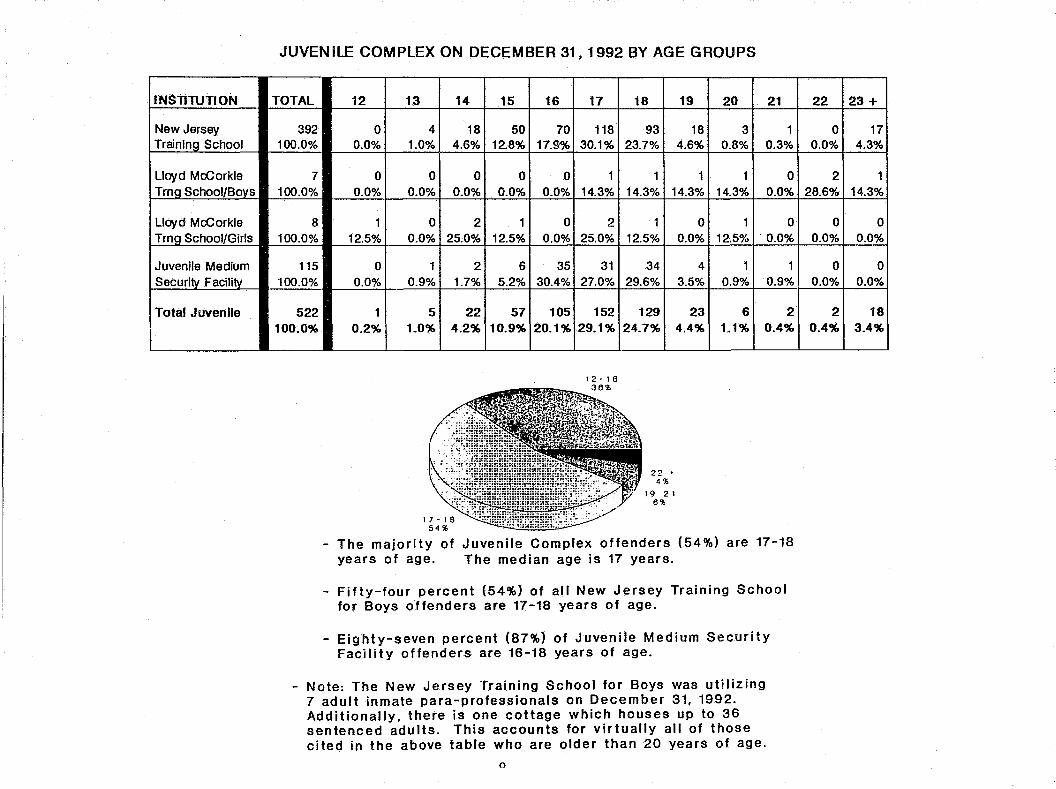
- The majority of Juvenile Complex offenders (54%) are 17-18 years of age. The median age is 17 years.
- Fifty-four percent (54%) of all New Jersey Training School for Boys offenders are 17-18 years of age.
- Eighty-seven percent (87%) of Juvenile Medium Security Facility offenders are 16-18 years of age.
- Note: The New Jersey Training School for Boys was utilizing 7 adult inmate para-professionals on December 31, 1992. Additionally, there is one cottage which houses up to 36 sentenced adults. This accounts for virtually all of those cited in the above table who are older than 20 years of age.
o
22 23 + • 0 17
0.0% 4.3%
2 1 28.6% 14.3%
0 0 0.0% 0.0%
0 0 0.0% 0.0%
2 18 0.4% 3.4%
OFFENDER CHARACTERISTICS REPORT -- 1992
RACE/ETHNIC IDENTIFICATION
SIXTY --THREE PERCENT (63%) OF NEW JERSEY DEPARTMENT OF CORRECTIONS RESIDENTS ARE BLACK, WHILE 19% ARE WHITE AND 17% ARE HISPANIC .
.......................................................... ~ ............ --.... ---------------------------------------------------------------------------------------
OFFENDERS IN NEW JERSEY CORRECTIONAL INSTITUTIONS ON DECEMBER 31, 1992 BY RACE/ETHNiC IDENTIFICAITON
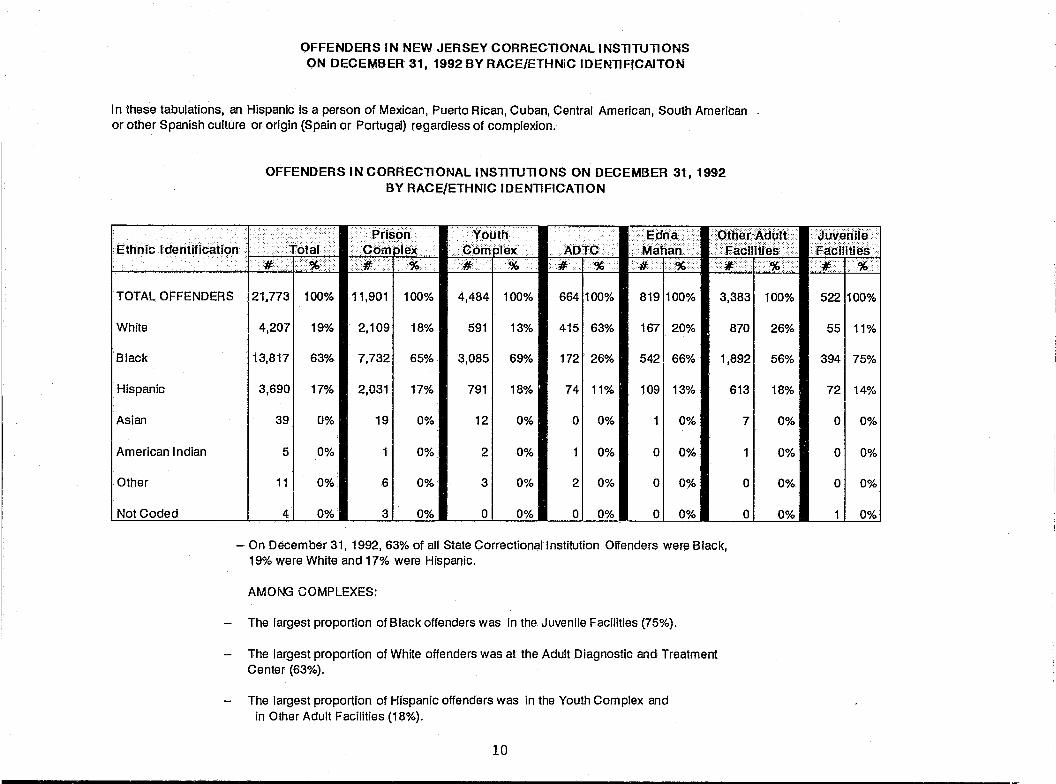
In these tabulations, an Hispanic is a person of Mexican, Puerto Rican, Cuban, Central American, South American or other Spanish culture or origin (Spain or Portugal) regardless of complexion.
OFFENDERS IN CORRECTIONAL INSTITUTIONS ON DECEMBER 31, 1992 BY RACE/ETHNIC IDENTIFICATION
.piison·· ... YbOthEdija> ·oifi&f·Adi:iltJovenmr·· Ethnic Identificaticm.Cdnfiex· . ":E~6ilitiij~/(F~dmWes ..
. <#% .)#< ::'Xii{%
TOTAL OFFENDERS 121,7731 100% 111,9011 100% 4,4841 100% 6641100% 8191100% 3,3831 100%
White I 4,2071 19% 1 2,1091 18% 591 I 13% 4151 63% 1671 20% 8701 26%
Black 113,8171 63% 1 7,7321 65% 3,0851 69% 1721 26% 5421 66% 1,8921 56%
Hispanic I 3,6901 17% 1 2,0311 17% 791 I 18% 741 11% 1091 13% 6131 18%
Asian 39 0% 19 0% 12 0% 01 0% 0% 7 0%
American Indian 5 0% 0% 2 0% 0% 01 0% 0%
Other 11 0% 6 0% 3 0% 21 0% 01 0% o 0%
Not Coded 4 0% 3 0% o 0% 01 0% 01 0% o 0%
- On December 31,1992,63% of all State Correctional Institution Offenders were Black, 19% were White and 17% were Hispanic.
AMONG COMPLEXES:
The largest proportion of Black offenders was in the Juvenile Facilities (75%).
The largest proportion of White offenders was at the Adult Diagnostic and Treatment Center (63%).
The largest proportion of Hispanic offenders was in the Youth Complex and in Other Adult Facilities (18%).
10
5221100%
551 11%
394175%
721 14%
01 0%
01 0%
01 0%
0%

PRISON COMPLEX OFFENDERS ON DECEMBER 31,1992 BY RACE/EfHNIC IDENTIFICATION
............... ~~dk W~it~/
...... : ... :;:.; ...... .... ......... ; .. -... AI···· .... btHE~ -faiAt ~I;R!GAN
INSTrrt.tfloN.·.· •••..• ···. HispANIc As rAN < INDIAN.· .. New Jersey State 1,752 1,167 355 227 2 1 0 Prison - Main 100.0% 66.6% 20.3% 13.0% 0.1% 0.1% 0.0%
Vroom Readjust 159 76 64 19 0 0 0 100.0% 47.8% 40.3% 11.9% 0.0% 0.0% 0.0%
Jones Farm 193 117 39 37 0 0 0 100.0% 6.7% 2.2% 2.1% 0.0% 0.0% 0.0%
New Jersey 2,104 1,360 458 283 2 1 0 State Total 100.0% 64.6% 21.8% 13.5% 0.1% 0.0% 0.0% East Jersey 1,553 1,101 203 245 2 0 1 Prison - Main 100.0% 70.9% 13.1% 15.8% 0.1% 0.0% 0.1%
East Jersey 112 84 14 14 0 0 0 Camp 100.0% 75.0%' 12.5% 12.5% 0.0% 0.0% 0.0%
Marlboro Camp 121 84 18 19 0 0 0 100.0% 69.4% 14.9% 15.7% 0.0% 0.0% 0.0%
EJSP - Ad Seg 315 223 40 50 1 0 1 100.0% 70.8% 12.7% 15.9% 0.3% 0.0% 0.3%
Secaucus 282 216 31 35 0 0 0 Pre- Release Cntr 100.0% 76.6% 11.0% 12.4% 0.0% 0.0% 0.0% East Jersey 2,383 1,708 306 363 3 0 2 Total 100.0% 71.7% 12.8% 15.2% 0.1% 0.0% 0.1% Bayside State 982 649 179 153 1 0 0 Prison - Main 100.0% 66.1% 18.2% 15.6% 0.1% 0.0% 0.0%
Bayside Farm 537 389 91 57 0 0 0 100.0% 72.4% 16.9% 10.6% 0.0% 0.0% 0.0%
Ancora Unit 297 189 48 60 0 0 0 100.0% 63.6% 16.2% 20.2% 0.0% 0.0% 0.0%
Reception 157 109 20 28 0 0 0 100.0% 69.4% 12.7% 17.8% 0.0% 0.0% 0.0%
Bayside Total 1,973 1,336 338 298 1 0 0
--_100.0% 67.7"&... '--~ 15.1% 0.1% _ . .0.0% 0.0%
~~%~~;:; 0
0.0%
0 0.0%
0 0.0%
0 0.0%
1 0.1%
0 0.0%
0 0.0%
0 0.0%
0 0.0%
1 0.0%
0 0.0%
0 0.0%
0 0.0%
0 0.0%
0 .. J).Q%

PRISON COMPLEX - CONTINUED
1~~~O+I(jij .. .-:./.:<. ........... ,",
~rs~A~lb *~IA~: t\MERiCAN bf:~~~ A~2T6f f6tAt·.·.· aLAck WHitE .IN6IAN:··: ",ODED Mid-State 558 235 148 168 4 0 3 0
100.0% 42.1% 26.5% 30.1% 0.7% 0.0% 0.5% 0.0% Southern State I 1,454 917 286 249 2 0 0 0
100.0% 63.1% 19.7% 17.1% 0.1% 0.0% 0.0% 0.0% Riverfront Prison I 1,035 577 269 186 1 0 1 1
100.0% 55.7% 26.0% 18.0% 0.1% 0.0% 0.1% 0.1% Northern State I 2,105 1,391 267 441 5 0 0 1 Prison 100.0% 66.1% 12.7% 21.0% 0.2% 0.0% 0.0% 0.0%
Northern State 268 193 33 41 0.4~1 0.0~1 0.0~1 0 Ad Seg-Male 100.0% 72.0% 12.3% 15.3% 0.0%
Northern State 21 15 4 2 0 0 0 0 Ad Seg- Female 100.0% 71.4% 19.0% 9.5% 0.0% 0.0% 0.0% 0.0% Northern State 2,394 1,599 304 484 6 0 0 1 Total 100.0% 66.8% 12.7% 20.2% 0.3% 0.0% 0.0% 0.0% SUBTOTAL,·:······ ·1t,901
: 7,732 .. ··2,109 ·2;031 .. '. 19 1· ." .. ····.······3
100.0% 65~0% 17.7% 17.1% O~2%, 0;0% .. 0.1% ··o~o% ADTC 664 172 415 74 0 1 2 0
100.0% 25.9% 62.5% 11.1% 0.0% 0.2% 0.3% 0.0% TotalM~le PrisOn 12.565 7,904 2,524 2,105
..
19 2 ,8,1·' •• o.
3
•••••• 100.0% 62.9%· .20.1% 16~8% ·0.2% 0.0% 0,1%, 03)%
Edna Mahan Corr 819 542 167 109 1 0 0 0 Fac- Women 100.0% 66.2% 20.4% 13.3% 0.1% 0.0% 0.0% 0.0% TotalPtison···· 13,384 8.446 2,691 2,214. • 2(): ,:, , 2 8 .a
'.,. 100.0% 63.1%. 20;1% 16.5% 0.1% . ·.··".0,0% ..• 0,1% oJ)%
12
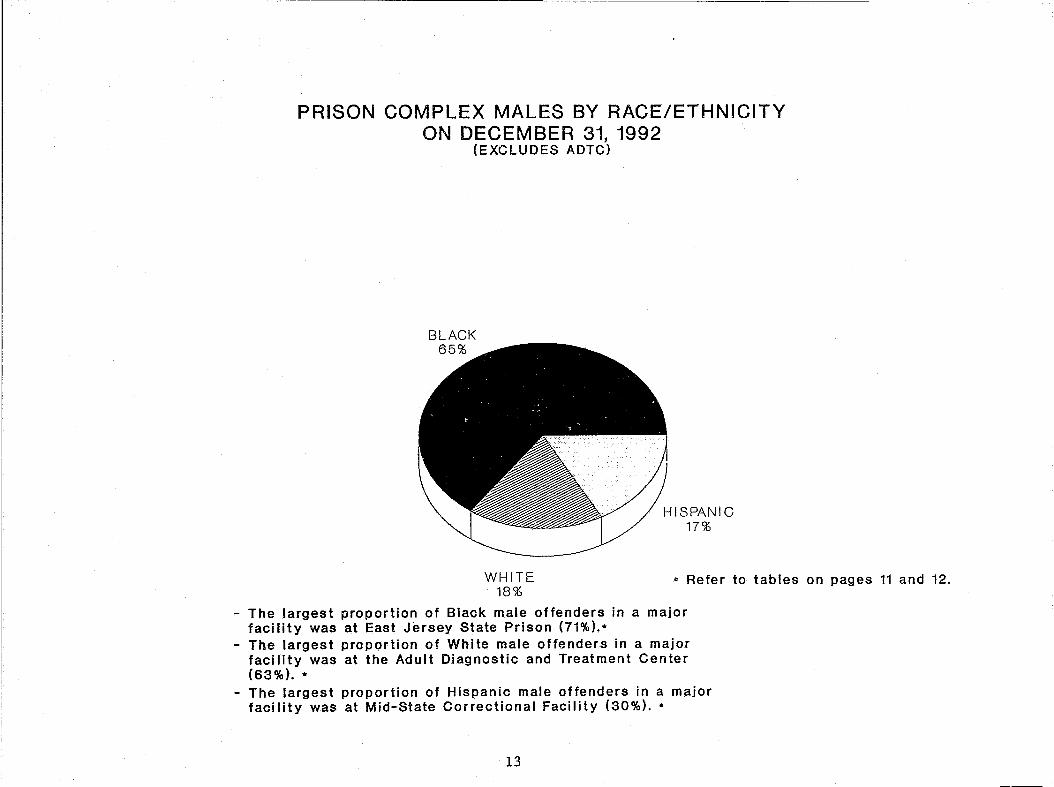
PRISON COMPLEX MALES BY RACE/ETHNICITY ON DECEMBER 31, 1992
(EXCLUDES ADTC)
WHITE 18%
HISPANIC 17%
.. Refer to tables on pages 11 and 12.
The largest proportion of Black male offenders in a major facility was at East Jersey State Prison (71%).*
- The largest proportion of White male offenders in a major facility was at the Adult Diagnostic and Treatment Center (63%). * The largest proportion of Hispanic male offenders in a major facility was at Mid-State Correctional Facility (30%). *
13
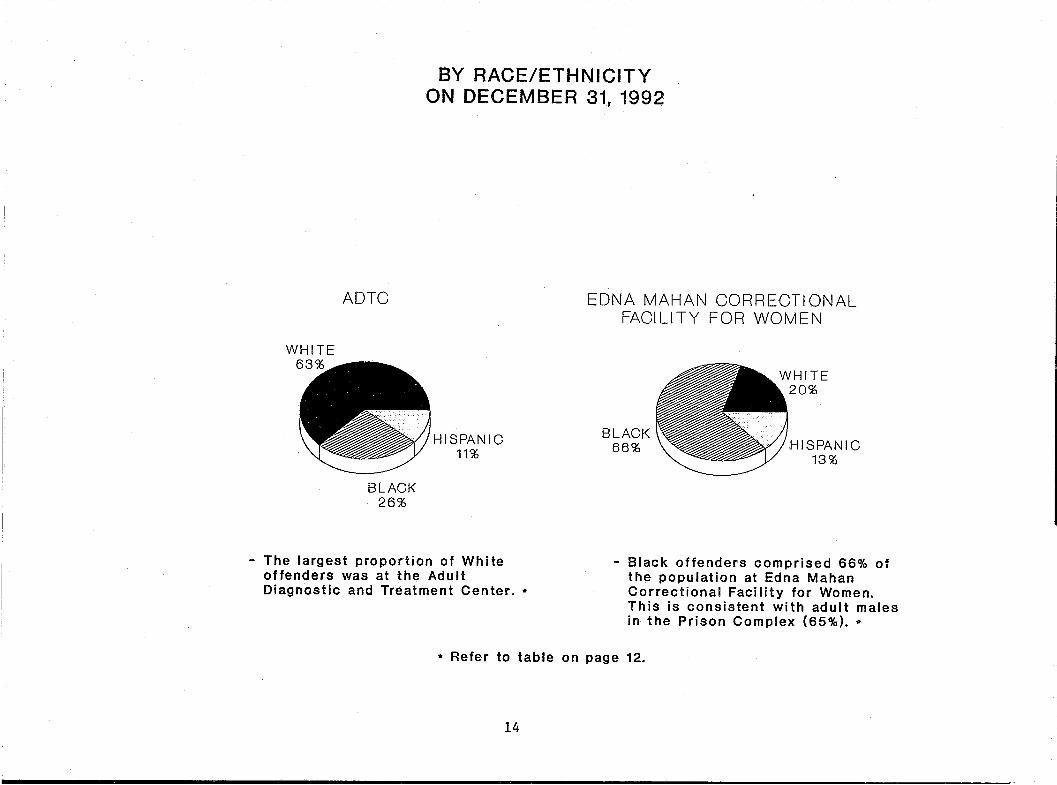
BY RACE/ETHNICITY ON DECEMBER 31, 1992
ADTC
BLACK 26%
HISPANIC 11%
- The largest proportion of White offenders was at the Adult Diagnostic and Treatment Center. *
EDNA MAHAN CORRECTIONAL FACILITY FOR WOMEN
BLACK 66% HISPANIC
13%
- Black offenders comprised 66% of the population at Edna Mahan Correctional Facility for Women. This is consistent with adult males in the Prison Complex (65%) ...
.. Refer to table on page 12.
14
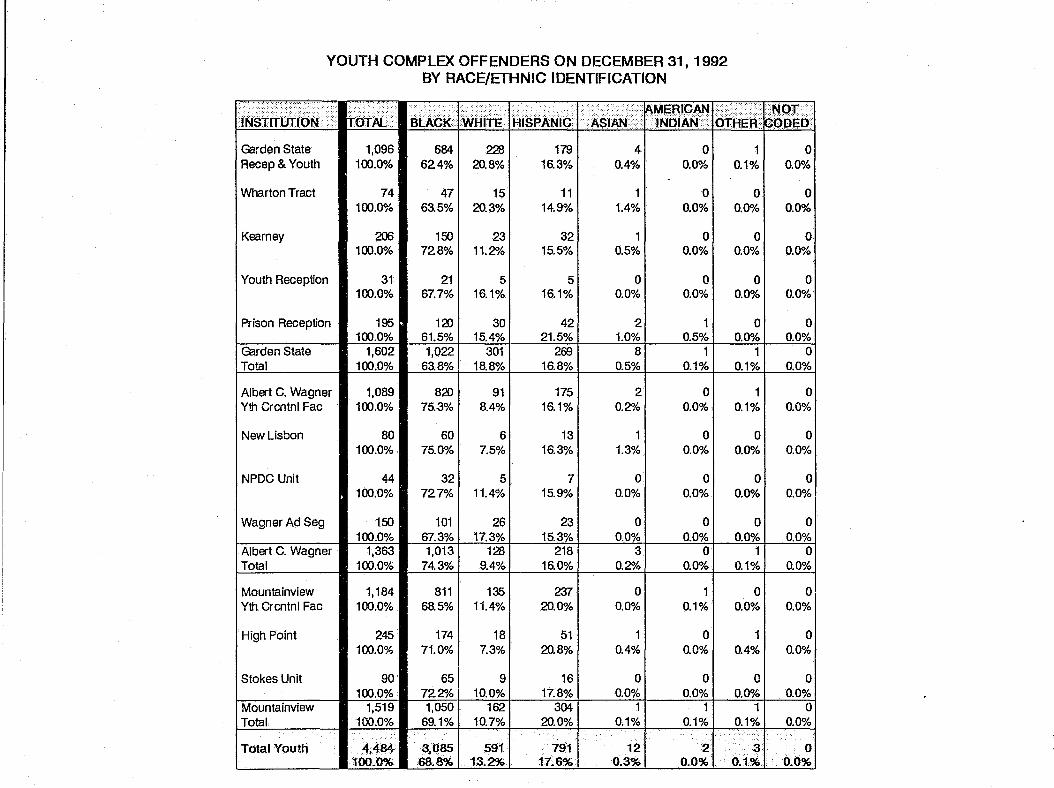
YOUTH COMPLEX OFFENDERS ON DECEMBER 31, 1992 BY RACE/ETHNIC IDENTIFICATION
·•·.·.• •.• ·ii .•• • .••. ........... ....... lA~IJW •• •••
~ME.flIC,6.N 8"fJk~ INSTLTUTlON· ~OTAL BLAcK ;WBitt.· HiSpANIC ·.·.JNDiAtiI:
Garden State 1,096 684 22B 179 4 0 1 Recep & Youth 100.0% 62.4% 20.8% 16.3% 0.4% 0.0% 0.1%
Wharton Tract 74 47 15 11 1 0 0 100.0% 63.5% 20.3% 14.9% 1.4% 0.0% OJ)o;"
Kearney 206 150 23 32 1 0 0 100.0% 72.8% 11.2% 15.5% 0.5% 0.0% 0.0%
Youth Reception 31 21 5 5 0 0 0 100.0% 67.7% 16.1% 16.1% 0.0% 0.0% 0.0%
Prison Reception 195 12) 30 42 2 1 0 100.0% 61.5% 15.4% 21.5% 1.0% 0.5% 0.0%
Garden State 1,602 1,022 301 269 8 1 1 Total 100.0% 63.8% 18.8% 16.8% 0.5% 0.1% 0.1%
Albert C. Wagner 1,089 820 91 175 2 0 1 Yth Crcntnl Fac 100.0% 75.3% 8.4% 16.1% 0.2% 0.0% 0.1%
New Lisbon 80 60 6 13 1 0 0 100.0% 75.0% 7.5% 16.3% 1.3% 0.0% 0.0%
NPDC Unit 44 32 5 7 0 0 0 100.0% 72.7% 11.4% 15.9% 0.0% 0.0% 0.0%
Wagner Ad Seg 150 101 26 23 0 0 0 100.0% 67.3% 17.3% 15.3% 0.0% 0.0% 0.0%
Albert C. Wagner 1,363 1,013 128 218 3 0 1 Total 100.0% 74.3% 9.4% 16.0% 0.2";" 0.0% 0.1%
Mountainview 1,184 811 135 237 0 1 0 Yth Crcntnl Fac 100.0% 68.5% 11.4% 20.0% 0.0% 0.1% 0.0%
High Point 245 174 18 51 1 0 1 100.0% 71.0% 7.3% 20.8% 0.4% 0.0% 0.4%
Stokes Unit 90 65 9 16 0 0 0 100.0% 72.2";" 10.0% 17.8% 0.0% 0.0% 0.0%
Mountainview 1,519 1,050 162 304 1 1 1 Total 100.0% 69.1% 10.7% 20.0% 0.1% 0.1% 0.1%
..
Tolal Youth 4,484- 3,085 591 791 12 2. 3 100,,0% 68.8% 13.2% 17.6% 0.3% 0.0% 0.1%
~~I6 01
0.0%
0 0.0%,
0 0.0%1
0 0.0%
0 0.0%
0 0.0%
0 0.0%
0 0.0%
0 0.0%
0 0.0%
0 0.0%
0 0.0%
0 0.0%
0 0.0%
0 0.0%
0 0;0%

ADULT OFFENDERS IN OTHER FACILITIES
INSTITUTION TOTAL BLACK WHITE HISPANIC
County Jail 2,838 1,539 770 100.0% 54.2% 27.1%
Halfway House 501 327 92 100.0% 65.3% 18.4%
Central Medical 44 26 8 100.0% 59.1% 18.2"/0
Total 3,383 1892 870 Other Facilities 100.0% 55.9% 25.7%
TQJaJ A(flJ~ 21,251 1:J,423 4,152 100.0% 63.2% 19.5%
YOUTH COMPLEX
BLACK 69%
HISPANIC 18%
- Seventy-four percent (74%) of the
521 18.4%
82 16.4%
10 227%
613 18.1%
3,618 17.0%
offenders housed at the .Albert C. Wagner Correctional Facility and 69% housed at Mountainview Correctional Facility were Black. *
- The largest proportion of White offenders in a youth complex facility was at Garden State Reception and Correctional Facility (19%). *
- The largest proportion of Hispanic offenders in a youth complex facility was at Mountainview Correctional Facility (20%). *
lh
~MERICAN NOT ASIAN INDIAN OTHER CODED
7 1 0 0 O.2"k 0.0% 0.0% 0.0%
0 0 0 0 0.0% 0.0% 0.0% 0.0%
0 0 0 0 0.0% 0.0% 0.0% 0.0%
7 1 0 0 1
O.2"k 0.0% 0.0% 0.~1 39 5 11 I
o.o~1 0.2% 0.0% 0.1%
ADLJLTS IN OTHER FACILITIES
BLACK 56%
HISPANIC 18%
- Twenty-six percent (26%) of all adult offenders in ·Other Facilities· were White. This exceeds the proportion of White offenders in the Prison Complex (18%) and the Youth Complex (13%). **
* Refer to table on page 15.
** Refer to table above.
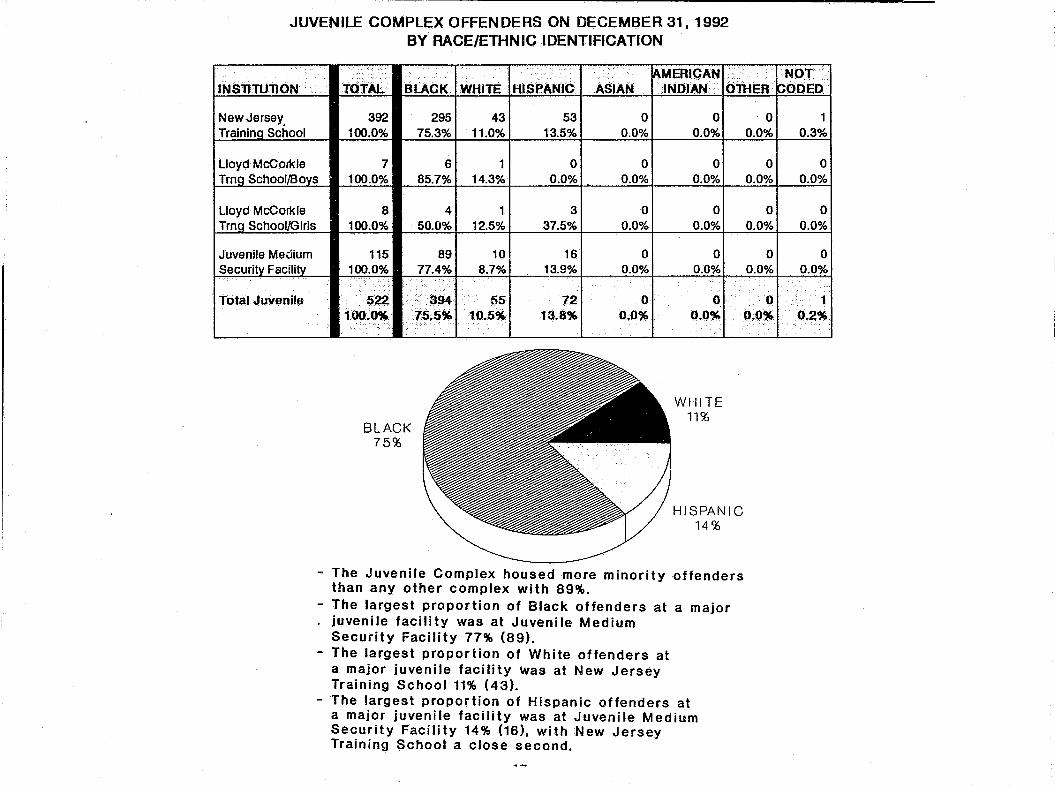
JUVENILE COMPLEX OFFENDERS ON DECEMBER 31,1992 BY RACE/ETHNIC IDENTIFICATION
.. , ,.',: AMERICAN ..
INSlJTU1l0N TOTAL BLACK WHITE HISPANIC .ASIAN INDIAN· OTHER
New Jersey. 392 295 43 53 0 0 Training School 100.0% 75.3% 11.0% 13.5% 0.0% 0.0%
Lloyd McCorkle 7 6 1 0 0 0 Trng School}Boys 100.0% 85.7% 14.3% 0.0% 0.0% 0.0%
Lloyd McCorkle Trng School/Glrls
Juvenile Medium Security Facility
- .....
Total Juvenile
8 4 100.0% 50.0%
115 89 100.0% 77.4%
'>: .
522 1QQ.,~
BLACK 75%
.394 7&,S~
1 12.5%
10 8.7%
55 10.S,*,
3 0 37.5% 0.0%
16 0 13.9% 0.0%
..-.
72 ° 1:,i.8% 0,0',1(.
0 0.0%
0 0.0%
0 0.0%
.
WHITE 11%
HISPANIC 14%
- The Juvenile Complex housed more minority offenders than any other complex with 89%.
- The largest proportion of Black offenders at a major juvenile facility was at Juvenile Medium Security Facility 77% (89).
- The largest proportion of White offenders at a major juvenile facility was at New Jersey Training School 11% (43).
- The largest proportion of Hispanic offenders at a major juvenile facility was at Juvenile Medium Security Facility 14% (16). with New Jersey Training School a close second.
·0 0.0%
0 0.0%
0 0.0%
0 0.0%
° ().O',l(.
NOT bOOED
1 0.3%
0 0.0%
0 0.0%
0 0.0%
1. .. ().?%!
OFFENDER CHARACTERISTICS REPORT - 1992
COUNTY OF COMMITMENT
OF THE 21 NEW JERSEY COUNTIES, SEVEN (ATLANTIC, CAMDEN, ESSEX, HUDSON, MONMOUTH, PASSAIC AND UNION) ACCOUNT FOR SEVENTY PERCENT (70%) OF TOTAL STATE CORRECTIONAL RESIDENTS. ESSEX COUNTY IS THE HIGHEST CONTRIBUTOR WITH TWENTY PERCENT (20%).
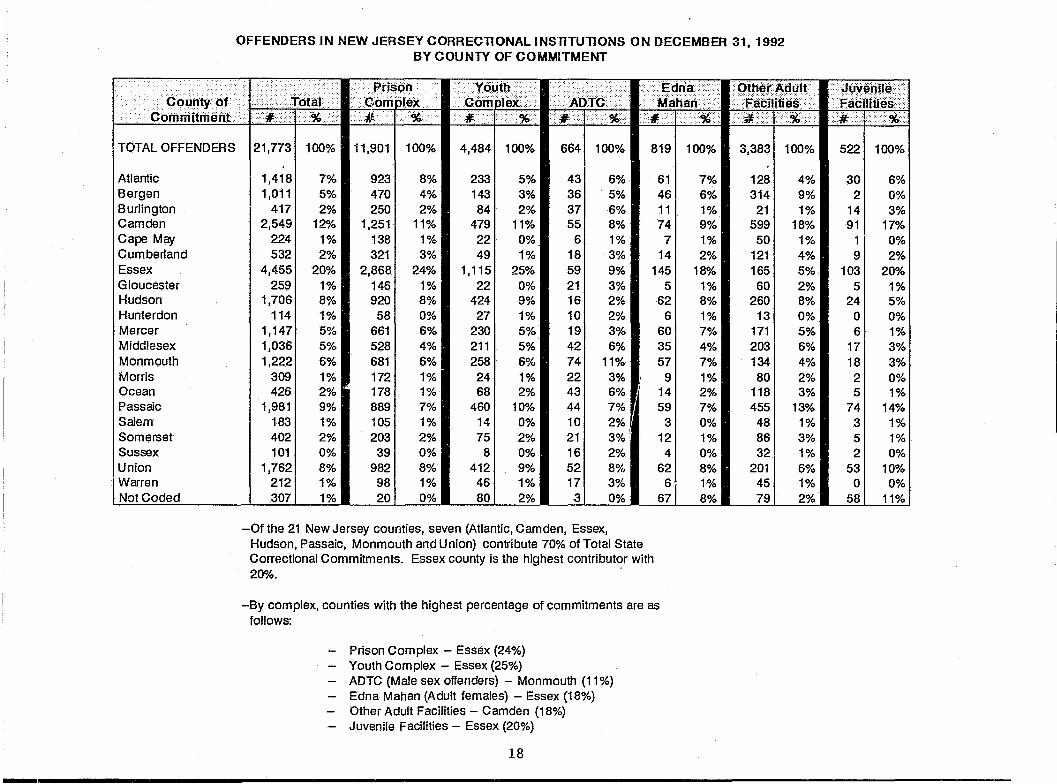
OFFENDERS IN NEW JERSEY CORRECllONAL I NSllTUllONS ON DECEMBER 31. 1992 BY COUNTY OF COMMITMENT
-~I --~ Prison . ¢i>tinty of. Total Ico";~I.l<
Y6uih·········· .•••....•..•••.• »........ ···/Edi'iif}····ofhefAdliif ·.Juvehile· C6ful~j:>Aotb ······.Fadiiiues> if:>' ....%>\#) .%>#.I\:'3{;\ Commitment # I %' ·n. t •. % ..
TOTALOFFENDERS 121.7731100%111,9011100% 4,4841 100% 6641 100% 8191 100%
Atlantic Bergen Burlington Camden Cape May Cumberland Essex Gloucester Hudson Hunterdon Mercer Middlesex Monmouth Morris Ocean Passaic Salem Somerset Sussex Union Warren Not Coded
1,418 1,011
417 2,549
224 532
4,455 259
1,706 114
1,147 1,036 1,222
309 426
1,981 183 402 101
1,762 212 307
7% 5% 2%
12% 1% 2%
20% 1% 8% 1% 5% 5% 6% 1% 2% 9% 1% 2% 0% 8% 1% 1%
923 470 250
1,251 138 321
2,868 146 920 58
661 528 681 172 178 889 105 203 39
982 98 20
8% 4% 2%
11% 1% 3%
24% 1% 8% 0% 6% 4% 6% 1% 1% 7% 1% 2% 0% 8% 1% 0%
233 143 84
479 22 49
1,115 22
424 27
230 211 258 24 68
460 14 75
8 412 46 80
5% 3% 2%
11% 0% 1%
25% 0% 9% 1% 5% 5% 6% 1% 2%
10% 0% 2% 0% 9% 1% 2%
43 36 37 55
6 18 59 21 16 10 19 42 74 22 43 44 10 21 16 52 17
3
6% 61 5% 46 6% 11 8% 74 1% 7 3% 14 9% 145 3% 5 2% 62 2% 6 3% 60 6% 35
11% 57 3% 9 6% 14 7% 59 2% 3 3% 12 2% 4 8% 62 3% 6 0% 67
-Of the 21 New Jersey counties, seven (Atlantic, Camden, Essex, Hudson, Passaic, Monmouth and Union) contribute 70% of Total State Correctional Commitments. Essex county is the highest contributor with 20%.
-By complex, counties with the highest percentage of commitments are as follows:
Prison Complex - Essex (24%) Youth Complex - Essex (25%) ADTC (Male sex offenders) - Monmouth (11%) Edna Mahan (Adult females) - Essex (18%) Other Adult Facifities - Camden (18%) JuvenHe Facilities - Essex (20%)
18
7% 6% 1% 9% 1% 2%
18% 1% 8% 1% 7% 4% 7% 1% 2% 7% 0% 1% 0% 8% 1% 8%
3,3831 100%
128 314
21 599 50
121 165 60
260 13
171 203 134 80
118 455 48 86 32
201 45 79
4% 9% 1%
18% 1% 4% 5% 2% 8% 0% 5% 6% 4% 2% 3%
13% 1% 3% 1% 6% 1% 2%
5221 100%
30 2
14 91
1 9
103 5
24 o 6
17 18
2 5
74 3 5 2
53 o
58
6% 0% 3%
17% 0% 2%
20"A. 1% 5% 0% 1% 3% 3% 0% 1%
14% 1% 1% 0%
10% 0%
11%
................................................................................ ------------------------------------------------------------------------------------------------

PRISON COMPLEX ON DECEMBER 31,1992 BY COUNTY OF COMMITMENT ,',:-.:'- .............. ,···.'.00
Afl.· ...... -. -,
GA~I? " :;";.;:.: ..,.: .... ',. ...... :.:-:.> .. ",
~!6·· .• ~8~: ~6~ /6& ••• i~i~ J~c s&~: ib~. WA~ ,NOT ..
hOb .... ;..: ......... .:
INSTitUTJON ' . rr6fAL ~~R& ~ti~l. ¢AMY MAY CUMB ESS.· ~Lba HUNT. MER· ~dM ebbED'j
New Jersey State 1,752 116 72 45 208 22 49 468 17 110 5 118 79 93 24 28 110 15 34 12 113 11 31 Prison - Main 100.0% 6.6% 4.1% 2.6% 11.9% 1.3% 2.8% 26.7% 1D% 6.3% 0.3% 6.7% 4.5% 5.3% 1.4% 1.6% 6.3% 0.9% 1.9% 0.7% 6.4% 0.6% 02%:
Vroom Readjust 159 14 8 6 20 3 8 31 2 11 1 6 4 10 3 5 5 0 3 1 15 1 2 100.0"10 8.8% 5.0% 3.8% 12.6% 1.9% 5.0% 19.5% 1.3% 6.9% 0.6% 3.8% 2.5% 6.3% 1.9% 3.1% 3.1% OD% 1.9% 0.6% 9.4% 0.6% 1.3%
Jones Farm 193 8 5 7 38 0 1 17 0 35 1 10 10 4 0 8 33 1 2 0 8 4 1 100.0% 0.5% 0.3% 0.4% 22% 0.0% 0.1% 1.0% 0.0% 2D% 0.1% 0.6% 0.6% 02% 0.0% 0.5% 1.9% 0.1% 0.1% 0.0% 0.5% 02% 0.1%
New Jersey 2,104 138 85 58 266 25 58 516 19 156 7 134 93 107 27 41 148 16 39 13 136 16 6 State Total 100.0% 6.6% 4.0% 2.8% 12.6% 12% 2.8% 24.5% 0.9% 7.4% 0.3% 6.4% 4.4% 5.1% 1.3% 1.9% 7.0% 0.8% 1.9% 0.6% 6.5% 0.8% 0.3%
East Jersey 1,553 52 70 18 99 9 33 487 11 123 8 96 81 94 21 13 140 7 29 4 148 7 3 Prison - Main 100.0% 3.3% 4.5% 12% 6.4% 0.6% 2.1% 31.4% 0.7% 7.9% 0.5% 62% 52% 6.1% 1.4% 0.8% 9.0% 0.5% 1.9% 0.3% 9.5% 0.5% 02%
East Jersey 112 5 4 2 1 0 2 33 0 9 2 4 5 12 1 0 12 1 2 0 17 0 0 Camp 100.0% 4.5% 3.6% 1.8% 0.9% 0.0% 1.8% 29.5% 0.0% 8.0% 1.8% 3.6% 4.5% 10.7% 0.9% OD% 10.7% 0.9% 1.8% 0.0% 152% 0.0% 0.0%
Marlboro Camp 121 2 1 2 2 0 0 26 0 14 1 7 14 14 3 1 10 0 0 1 21 2 0 100.0% 1.7% 0.8% 1.7% 1.7% 0.0% 0.0% 21.5% 0.0% 11.6% 0.8% 5.8% 11.6% 11.6% 2.5% 0.8% 8.3% OD% OD% 0.8% 17.4% 1.7% 0.0%
EJSP-AdSeg 315 19 12 5 37 1 9 104 1 15 2 18 10 16 3 3 23 1 5 1 28 2 0 100.0% 6.0% 3.8% 1.6% 11.7% 0.3% 2.9% 33.0% 0.3% 4.8% 0.6% 5.7% 32% 5.1% 1.0% 1.0% 7.3% 0.3% 1.6% 0.3% 8.9% 0.6% 0.0%
Secaucus 282 1 4 4 6 0 0 93 1 34 1 16 16 18 1 3 43 1 4 0 34 1 1 Pre-Release Cntr 100.0% 0.4% 1.4% 1.4% 2.1% 0.0% 0.0% 33.0% 0.4% 12.1% 0.4% 5.7% 5.7% 6.4% 0.4% 1.1% 152% 0.4% 1.4% 0.0% 12.1% 0.4% 0.4% East Jersey 2,383 79 91 31 145 10 44 743 13 195 14 141 126 154 29 20 228 10 40 6 248 12 4 Total 100.0% 3.3% 3.8% 1.3% 6.1% 0.4% 1.8% 312% 0.5% 82% 0.6% 5.9% 5.3% 6.5% 12% 0.8% 9.6% 0.4% 1.7% 0.3% 10.4% 0.5% 02"10
Bayside State 982 130 26 20 84 17 27 219 20 83 5 50 43 74 10 10 50 12 12 4 80 6 0 Prison - Main lOOD% 132% 2.6% 2.0% 8.6% 1.7% 2.7% 22.3% 2.0% 8.5% 0.5% 5.1% 4.4% 7.5% 1.0% 1.0% 5.1% 12"10 12% 0.4% 8.1% 0.6% 0.0%
Bayside Farm 537 83 10 14 80 14 25 76 11 20 3 26 19 33 3 7 46 15 7 0 39 5 1 100.0"10 15.5% 1.9% 2.6% 14.9% 2.6% 4.7% 142% 2D% 3.7% 0.6% 4.8% 3.5% 6.1% 0.6% 1.3% 8.6% 2.8% 1.3% 0.0% 7.3% 0.9% 02"10
Ancora Unit 297 55 9 5 42 12 10 47 6 19 1 16 8 20 1 1 14 6 5 1 17 2 0 1OOD% 18.5% 3.0% 1.7% 14.1% 4.0% 3.4% 15.8% 2.0% 6.4% 0.3% 5.4% 2.7% 6.7% 0.3% 0.3% 4.7% 2D% 1.7% 0.3% 5.7% 0.7% 0.0%
Reception 157 17 4 5 20 5 12 34 3 4 1 13. 6 7 1 6 1 0 3 0 9 0 6 100.0% 10.8% 2.5% 32% 12.7% 32% 7.6% 21.7% 1.9% 2.5% 0.6% 8.3% 3.8% 4.5% 0.6% 3.8% 0.6% 0.0% 1.9% 0.0% 5.7% OD% 3.8%
Bayside Total 1,973 285 49 44 226 48 74 376 40 126 10 105 76 134 15 24 111 33 27 5 145 13 7 1ooD% 14.4% 2.5% 22% 11.5% 2.4% 3.8% 19.1% 2.0% 6.4% 0.5% 5.3% 3.9% 6.8% 0.8% 12% 5.6% 1.7% 1.4% 0.3% 7.3% 0.7% 0.4%
c

INSirroribN
Mid-State
Southern State
Riverfront Prison
Northern State Prison
Northern State Ad Seg-Males
Northern State Ad Seg-Females Northern State Total
SUBTOTAL
ADTC
Total Male Prison
Edna Mahan Corr Fac -Women
Total Prison
I
.-------------------------------------------------------------------------------------------~--
PRISON COMPLEX - CONTINUED
tbtAL.I .• AttIB~~dl~u~rl'bAM,I1:["ElcciMBI.Ess·I(3toLJIHub .. IHnN"TI.·MEAI .•• ~·I.;,IM~IM6RJ,()b .. ·I:~*~,,·1~p.Lnls6M(rsusltJN'"lwp.~I£%~b· 558
100.0% 34
6.1% 261 22
4.7% 3.9% 39
7.0% 3
0.5% 181 113
32% 20.3% 91 58
1.6% 10.4% 3
0.5% 36
6.5% 29
52% 281 10
5.0% 1.8% 9
1.6% 42' 3
7.5% 10.5% 11
2.0% 4
0.7% 511 10
9.1% 1.8%
1,4541 2281 611 361 1821 371 781 2011 211 751 91 93 1 52 1 83 1 241 36 1 78 1 271 211 11 991 10 100.0% 15.7% 42% 2.5% 12.5% 2.5% 5.4% 13.8% 1.4% 52% 0.6% 6.4% 3.6% 5.7% 1.7% 2.5% 5.4% 1.9% 1.4% 0.1% 6.8% 0.7%
1,035 100.0%
2,105 100.0%
84 8.1%
281 40 I 301 2.7% 3.9% 29.1%
9 0.9%
261 1091 38 2.5% 10.5% 3.7%
571 61 741 38 5.5% 0.6% 7.1% 3.7%
521 171 27 5.0% 1.6% 2.6%
501 8 4.8% 10.8%
11 1.1%
2 02%
431 15 42% 1.4%
461 ~171 121 641 51 18 1 7271 41 225 1 91 57 1 102 1 1121 471 171 215 1 51 48 1 71 245 1 22 22% 5.6% 0.6% 3.0% 02% 0.9% 34.5% 02% 10.7% 0.4% 2.7% 4.8% 5.3% 22% 0.8% 102% 02"10 2.3% 0.3% 11.6% 1.0%
268129111171271 11 5178
1 2128
1 0118
111
1 713
1 3115
13
1 51 1114
10
100.0% 10.8% 4.1% 2.6% 10.1% 0.4% 1.9% 29.1% 0.7% 10.4% 0.0% 6.7% 4.1% 2.6% 1.1% 1.1% 5.6% 1.1% 1.9% 0.4% 52% 0.0%
21 100.0%
2,394 100.0%
11,901 100.0%
664 100.0%
12,565 too~O%
819 100.0%
13,384 100:0%
o 0.0%
75 3.1%
21 0 9.5% 0.0%
130 I 19 5.4% 0.8%
4.8% 92
3.8%
o 0.0%
6 0.3%
01 5 0.0% 23.8%
231 810 1.0% 33.8%
o 0.0%
6 0.3%
923 470..251:)1,2$'1. .. 138321 2,868 146 , k· .. ,/, .. "'" 7.8% I a:9% .. ;1%10~%11.2%12.7% 124.1% 112%
o 0.0%
253 10.6%
920 i~7%
431 361 371 551 61 18 1 59 1 21 I 16 6.5% 5A% 5.6% 8.3% 0.9% 27% 8.9% 32% 2A%
9661 50S 1 2811.1.;3061' 1441.33912,9271 167 1. 936 7,7%,4:0%!2.3%1CL4%L1%2.7% 23.3% 1.:3% 7.4%
01 3 0.0% 14.3%
91 78 0.4% 3.3%
.5,81 .... 661 0..5%·.5.6%
41 0 4.8% 119.0% 0.0%
1141 123 1 50 4.8% 5.1% 2.1%
4~~15j~ll!I~
21 0 4.8% 1 9.5% 0.0%
211 232 1? 8 0.9% 9.7% 0.3%
1x~11~~b~~
o 4.8%1 0.0%
541 8 2.3% 0.3%
1;~.1 o~a:·.· 10
1.5% 19[ 42[ 741 22[ 43
2.9% 6.3% 11.1% 3.3% 6.5% 441 10 [ 21[ 16
6.6% 1.5% 32% 2.4%
68 0..5%
6801 ,570 I 1'~~r~941 ,??1 .5.4% 4;5%, 6:0% 11.5%.1.8% 7~~b~1ZJ 1~410AS:
61/ 461 11/ 741 71 14/ 145
1 51 62
1 61 60
1 35
1 57
1 91 141 59
1 31 121 4 7.4% 5.6% 1.3% 9.0% 0.9% 1.7% 17.7% 0.6% 7.6% 0.7% 7.3% 4.3% 7.0% 1.1% 1.7% 72% 0.4% 1.5% 0.5%
1,0271 5521 298It~01 .. 151.' 3$313,0721 1721. 9961 . 141 7401 6051. 8121.2031.2351 .. 99211181 2361 59 7]%· 4.1%122% 1o:.s%11.'i% 2.6% 23.0% 1.3% 7..5%I0.6%5.5%4.5%S.1%L5%1.8%7A%lolJ% 1.8%0.4%
20
o 4.8% 10.0%
2601 22 10.9% 0.9%
.!J~2J,.98 8.3%10.8%
521 17 7.8% 2.6%
1;0~41115 8.2% 10;9%
621 6 7.6% 0.7%
~~b~~
o 0.0%
2 0.1%
o 0.0%
1 0.0%
o 0.0%
o 0.0%
1 0.0%
20 02%
3 0.5%
23 02%
67 82%
90 0.7%
PRISON COMPLEX MALES BY COUNTY OF COMMITMENT ON DECEMBER 31, 1992
?
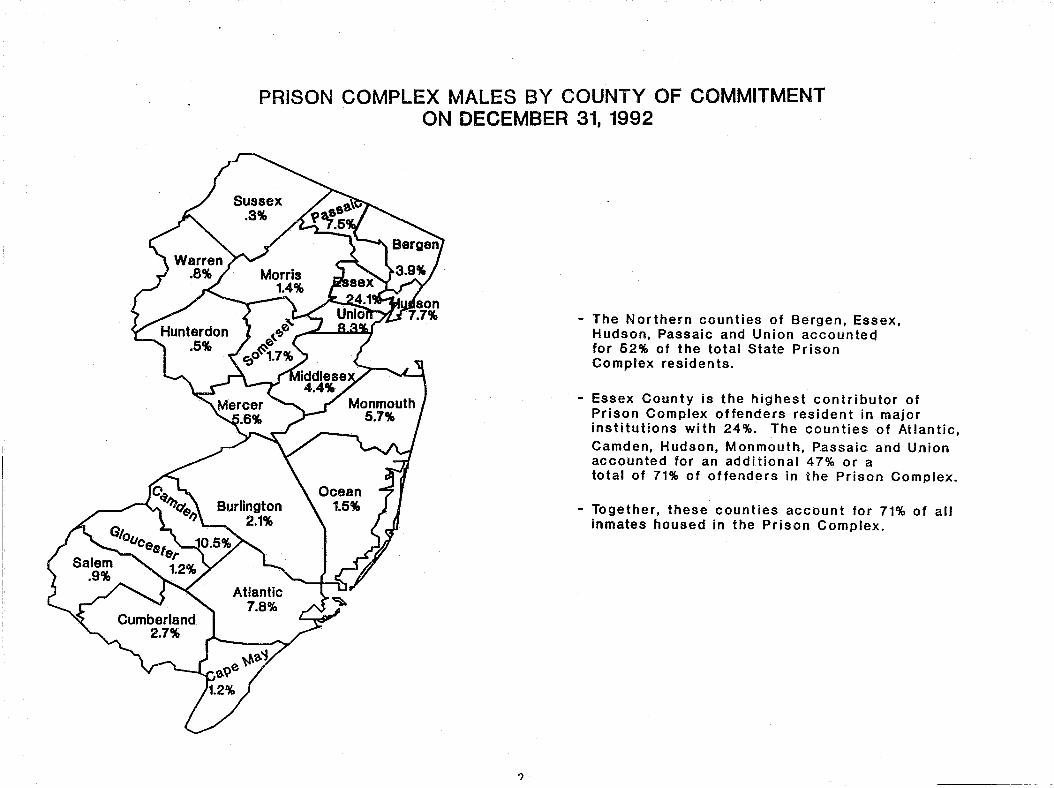
- The Northern counties of Bergen, Essex, Hudson, Passaic and Union accounted for 52% of the total State Prison Complex residents.
- Essex County is the highest contributor of Prison Complex offenders resident in major institutions with 24%. The counties of Atlantic, Camden, Hudson, Monmouth, Passaic and Union accounted for an additional 47% or a total of 71% of offenders in the Prison Complex.
- Together, these counties account for 71% of all inmates housed in the Prison Complex.
BY COUNTY OF COMMITMENT ON DECEMBER 31, 1992
ADULT DIAGNOSTIC AND TREATMENT CENTER
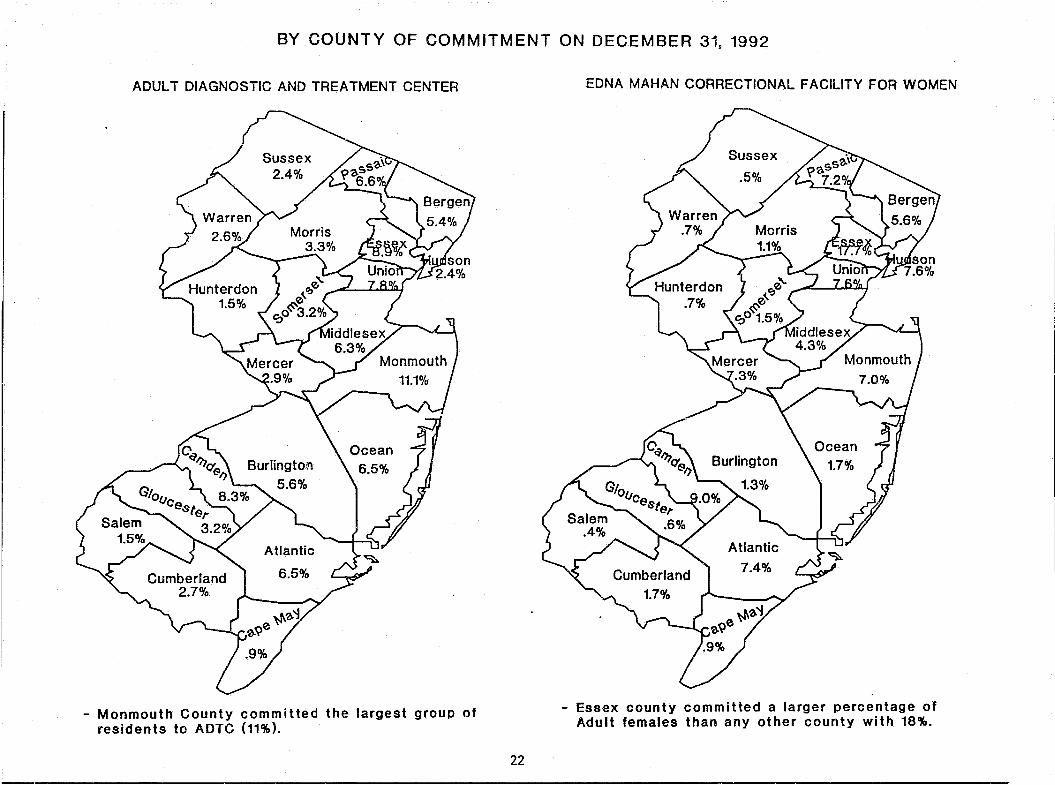
Monmouth County committed the largest group of residents to ADTC (11%).
22
EDNA MAHAN CORRECTIONAL FACILITY FOR WOMEN
- Essex county committed a larger percentage of Adult females than any other county with 18%.
YOUTH COMPLEX OFFENDERS ON DECEMBER 31, 1992 BY COUNTY OF COMMITMENT
IN~~OTI()N ..•. Garden State Recep & Youth
Wharton Tr;~jct
Kearney
Youth Reception
Prison Reception
Garden State Total
Albert C. Wagner Yth Crcntnl Fac
New Lisbon
NPDCUnit
Wagner Ad Seg
Albert C. Wagner Total
Mountainview Yth Crcntnl Fac
High Point
Stokes Unit
Mountainview Total
Total Youth
1,096 100.0%
74 100.0%
206 100.0%
31 100.0%
195 100.0%
1,602 100.0%
1,089 100.0%
80 100.0%
44 100.0%
150 100.0%
1,363 100.0%
1,184 100.0%
245 100.0%
90 100.0%
1,519 100.0%
70 6.4%
11 14.9%
o
24 2.2%
1.4%
17
28 133 2.6% 12.1%
6 5 8.1% 6.8%
o o
9 0.8%
5 6.8%
o
22 319 2.0% 29.1%
1 19 1.4% 25.7%
o 56
10 0.9%
1.4%
o
741 18 6.8% 1.6%
31 0 4.1% 0.0%
25 o
52 4.7%
7 9.5%
o
60 5.5%
5 6.8%
o
68 5 19 6.2% 0.5% 1.7%
501 6.8% 0.0% 1.4%
17 o 8
52 7 18 4 4.7% 0.6% 1.6% 0.4%
o 0 0 0 0.0% 0.0% 0.0% 0.0%
11 o o
91 8.3%
4 5.4%
27
13 1.2%
o 0.0%
o
o 0.0%
o 0.0%
44 0.0%1 8.3%1 0.0%1 0.0%1 0.0%1 0.0%127.2%1 0.0%112.1%10.0%1 0.0%1 0.0%1 8.3%10.0%13.9%1 5.3%10.0%10.5%10.0%113.1%1 0.0%1 21.4%
2 6.5%
9 4.6%
92 5.7%
69 6.3%
2 6.5%
13 6.7%
57 3.6%
29 2.7%
3 9.7%
2 6.5%
11 22 0.5% 11.3%
381 162 2.4% 10.1%
261 81 2.4% 7.4%
o 0.0%
o 0.0%
14 0.9%
5 0.5%
01 7 0.0% 22.6%
11 31 0.5% 15.9%
241 432 1.5% 27.0%
6/ 315 0.6% 28.9%
o 0.0%
o 0.0%
11 0.7%
3 0.3%
21 0 6.5% 0.0%
41 0 2.1% 0.0%
1081 18 6.7% 1.1%
951 6 8.7% 0.6%
3 9.7%
4 2.1%
66
4.1%
94 8.6%
2 6.5%
7
01 01 21 31 01 11 0 0.0% 0.0% 6.5% 9.7% 0.0% 3.2% 0.0%
21 o 20 o 4
2 6.5%
18 3.6% 1 10.8% 1 0.0% 1 0.5% 1 10.3% 1 0.0% 1 2.1 % 1 0.5% 1 9.2%
741 1111 51 31 1 86 1 71 241 51 142 4.6% 6.9% 0.3% 1.9% 5.4% 0.4% 1.5% 0.3% 8.9%
591 621 81 171 81
1 41 15 1 01 110 5.4% 5.7% 0.7% 1.6% 7.4% 0.4% 1.4% 0.0% 10.1%
o 0.0%
9 4.6%
22 1.4%
3 0.3%
41 11 31 121 01 21 141 21 121 01 81 41 71 01 01 41 01 11 01 51 5.0% 1.3% 3.8% 15.0% 0.0% 0.2% 17.5% 2.5% 15.0% 0.0% 10.0% 5.0% 8.8% 0.0% 0.0% 5.0% 0.0% 1.3% 0.0% 6.3% 1.3%
2.3%
12 8.0%
86 6.3%
45 3.8%
9 3.7%
1.1%
55 3.6%
2.3%
4 2.7%
35 2.6%
37 3.1%
10 4.1%
4 4.4%
51 3.4%
2.3% 3
6.8%
11 16 0.7% 10.7%
31 2.3%
112 8.2%
14 141 1.2% 11.9%
49 0.4% 20.0%
o 15 0.0% 16.7%
151 205 1.0% 13.5%
2.3%
o 0.0%
6 0.4%
2 0.2%
o 0.0%
o 0.0%
2 0.1%
o 11 0.0% 25.0%
6 46 4.0%130.7%
141 386 1.0% 28.3%
8 235 0.7% 19.8%
3 47 1.2% 19.2%
'0 15 0.0% 16.7%
111 297 0.7% 19.6%
o 0.0%
2 1.3%
7 0.5%
3 0 6.8% 0.0%
10 6.7% 0.7%
120 I 7 8.8% 0.5%
21 168
1 2 0.2% 14.2% 0.2%
2 21 o 0.8% 8.6% 0.0%
o 7 0 0.0% 7.8% 0.0%
4 196 2 0.3%112.9% I 0.1%
31 5 6.8% 11.4%
7 4.7%
112 8.2%
41 3.5%
9 3.7%
2 2.2%
52 3.4%
61 4.0%
74 5.4%
53 4.5%
8 3.3%
2 2.2%
63 4.1%
o 5 o o 7 2.3%12.3%10.0%111.4% 1 0.0%1 0.0%12.3%115.9%
10 3 3 6.7% 12.0% 12.0%
80 I 121 20 5.9% 0.9% 1.5%
11 1 1 I 01 0 7.3% 0.7% 0.0% 0.0%
101 51 16 1 7.4%10.4%11.2%10.1%
11 7.3%
133 9.8%
551 71 141 189 1 1 1 32 ( 1 i 120 4.6% 0.6% 1.2% 16.0% 0.1% 2.7%)0.1%110.1%
9 o 3 52 o 3.7%10.0%11.2%121.2% 1 0.4%1 0.4%1 0.0%
2 31 01 0 3.3% 0.0% 0.0%
32 o 35.6% I 0.0%12.2%11.1%
671 71 17 4.4% 0.5% 1.1%
2 273 21 35 18.0% I 0.1%12.3%1 0.1%
15 6.1%
2 2.2%
137 9.0%
o 0.0%
o 0.0%
4 0.3%
12 1.0%
5 2.0%
3 3.3%
20 1.3%
o 0.0%
29 14.9%
73 4.6%
0.1%
o 0.0%
o 0.0%
o 0.0%
0.1%
5 0.4%
o 0.0%
1.1%
6 0.4%
4.4841 2331 1431 841 479. I 221 4911,1151. 221 424·1 271 2301 2111 .258 1 241 681 .. 4601. 141 75 1 .. 81 4121 46 1 80 100~0% 5.2% 3.2% 1.9% 10,7%t 0,5%1 1.1% 24.9%.0.5% 9.5% 0.6% 5.1% 4.7% 5.8%0.5%1.5%10,3% 0.3%1.7% 0.2%·9.2% 1.0% 1.8%
~':<
------------------------------------------------------------------------------
INSTIrti:rlbN CountyJall
Halfway House
Centml Medical
Tptal Other Faci5ties t~JA<f.~'i·:: .
"ToTAl. 2,838
100.0%
501 100.0%
44 100.0%
3,383 100.0% 2.1.25t 100.0%
AlL. BERG IBUR. I CAM 101
3.6% 291 I 11 I 516
10.3% 0.4% 18.2%
26 5.2%
20 4.0%
11 3 2.3% 6.8%
1281 314 3.8% 9.3%
j6::1~~
101 79 2.0% 15.8%
01 4 0.0% 9.1%
211 599 0.6% 17.7%
·1:~·1··.·~_}j$i 1 ~9"11~6'"
YOUTH COMPLEX OFFENDERS
ADULT OFFENDERS IN OTHER FACIUTIES
CAPEl :1--:--:::-::· MA~IQUMB :. E~JGlOO J ijOQHUN
411 109
1 53
1 58
1 213
1 13 1.4% 3.8% 1.9% 2.0% 7.5% 0.5%
9 1.8%
o 0.0%
50 1.5% -:2i3 1.0%
11 I 105 2.2% 21.0%
2 0.4%
421 0 8.4% 0.0%
11 71 01 5/ 0 2.3% 15.9% 0.0% 11.4% 0.0%
12111651 601260113 3.6% 4.9% 1.8% 7.7% 0.4%
-.~~liJ~ •• I •. :.;~·I:~7~:I~:J~
MER.IMID 1541 180
5.4% 6.3%
16 3.2%
1 2.3%
171 5.1%
f.1~' fbi'"
20 4.0%
3 6.8%
203 6.0%
1,919 <4.8%
MONiMeRloc 1111 74/110
3.9% 2.6% 3.9%
.PAs ISAt ISOM ISUS IUN.
390 I 46 1 771 31 I 139 13.7% 1.6% 2.7% 1.1% 4.9%
191516160121911155 3.8% 1.0% 1.2% 12.0% 0.4% 1.8% 0.2% 11.0%
41 11 2 9.1 % 2.3% 4.5%
1341 801118 4.0% 2.4% 3.5%
15~11~f~12~i
51 01 01 01 7 11.4% 0.0% 0.0% 0.0% 15.9%
4551 48 1 86
1 32 1 201
13.4% 1.4% 2.5% 0.9% 5.9%
19~10~:1~~'m.~r~r:
NOT WAR \Q.ODED
421 78 1.5% 2.7%
3 0.6%
o 0.0%
45 1.3% 212
j.O%
0.2%
o 0.0%
79 2.3% 249
1.2%
ADULT OFFENDER~ IN OTHER FACILITIES
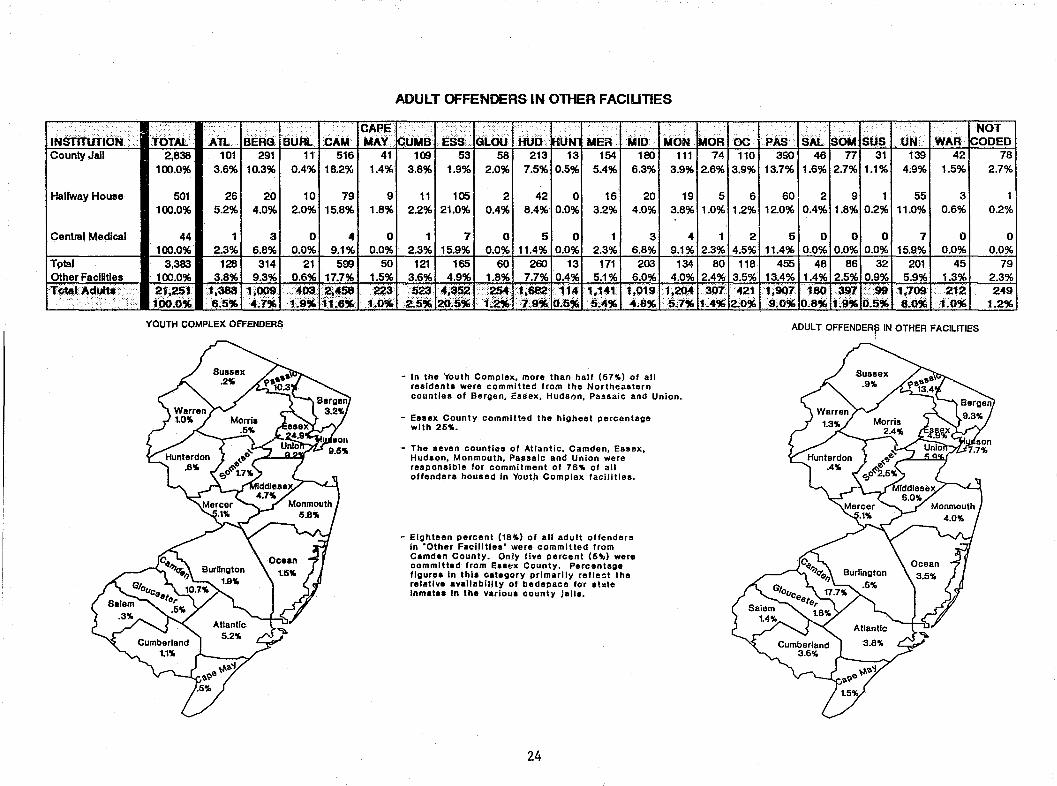
- In the Youth Complex, more than hall (67") of all realdents were committed from the Northeastern countiea of Bergen, Easex, Hudson, Pasaaic and Union.
- Essex County committed the higheat percentage with 25 ...
- The seven counties of Atlantic, Camden, Essex, Hudson, Monmouth, Passaic and Union were responsible for commitment of 76 .. of all offenders housed In Youth Complex facilities.
- Eighteen percent (18") 01 all adult offenders in ·Other Facilities· were committed from Csmden County. Only five percent (5%) were committed from E •• llx County. Percentage figure. In thla c.tagory primarily reflect the relative availability of bedapace for alllte Inmat.a In the various county Jail ••
24
INSTITUTioN . TOTAL
New Jersey 392 Trainina School 100.0%
Lloyd McCorkle 7 Trrlg School/Bovs 100.0%
Lloyd McCorkle 8 T mJ:L School/Girls 100.0%
JINenile Medium 115 Security Faciity 100.0%
Total JuvenU. ..... 52:? 1PO,i)~
JUVENILE COMPLEX OFFENDERS ON DECEMBER 31, 1992 BY COUNTY OF COMMITMENT
CAPE ' . .'
AlL BERG. BURl.. CAM MAY CUMB ESS GLOO· HUi)
27 1 10 66 1 6 73 3 18 6.9% 0.3% 2.6% 16.8% 0.3% 1.5% 18.6% 0.8% 4.6%
1 O. 1 2 0 0 0 0 1 14.3% 0.0% 14.3% 28.6% 0.0% 0.0% 0.0% 0.0% 14.3%
0 0 2 0 0 0 1 a 2 0.0% 0.0% 0.5% 0.0% 0.0% 0.0% 0.3% 0.0% 0.5%
2 1 1 23 0 3 29 2 3 1.7% 0.9% 0.9% 20.0% 0.0% 2.6% 25.2% 1.7% 2.6% , .. ,
... , .. ~~ 30 2 14 ·91 1 9 1<P $
;p~ Q.4?f> ?,7'-' 1h." Q.2% 1.7'" 1!P% 1,P'% ~.~~ ..
25
JilJN, NOT
MER MiD MON MaR oc pAs SAL SOM sus ON WAR ~OOED
0 2 15 13 2 5 56 3 3 1 34 0 53 0.0% 0.5% 3.8% 3.3% 0.5% 1.3% 14.3% 0.8% 0.8% 0.3% 8.7% 0.0% 13.5%
0 0 0 0 0 0 9 0 2 0 0 a a 0.0% 0.0% 0.0% 0.0% 0.0% 0:0% 0.0% 0.0% 28.6% 0.0% 0.0% 0.0% 0.0%
a 0 0 0 a a 2 a 0 a 1 0 a 0.0% 0.0% 0.0% 0.0%· 0.0% 0.0% 0.5% 0.0% 0.0% 0.0% 0.3% 0.0% 0.0%
0 4 2 5 a 0 16 a 0 1 18 0 5 0.0% 3.5% 1.7% 4.3% 0.0% 0.0% 13.9% 0.0% 0.0% 0.9% 15.7% 0.0% 4.3% ...... I'··.,···
0 6 11 18 2 5 74 3 ~ 2 .. 53 0 58
~,Q'" q~ 3.3'}1'. 3.4% 0.4,}(; 1.0% 14.2% 9.6% 1,0% OA4% 10;~'}(; Q.O% 11.1% .., ... : .. L ... : : ... : ....
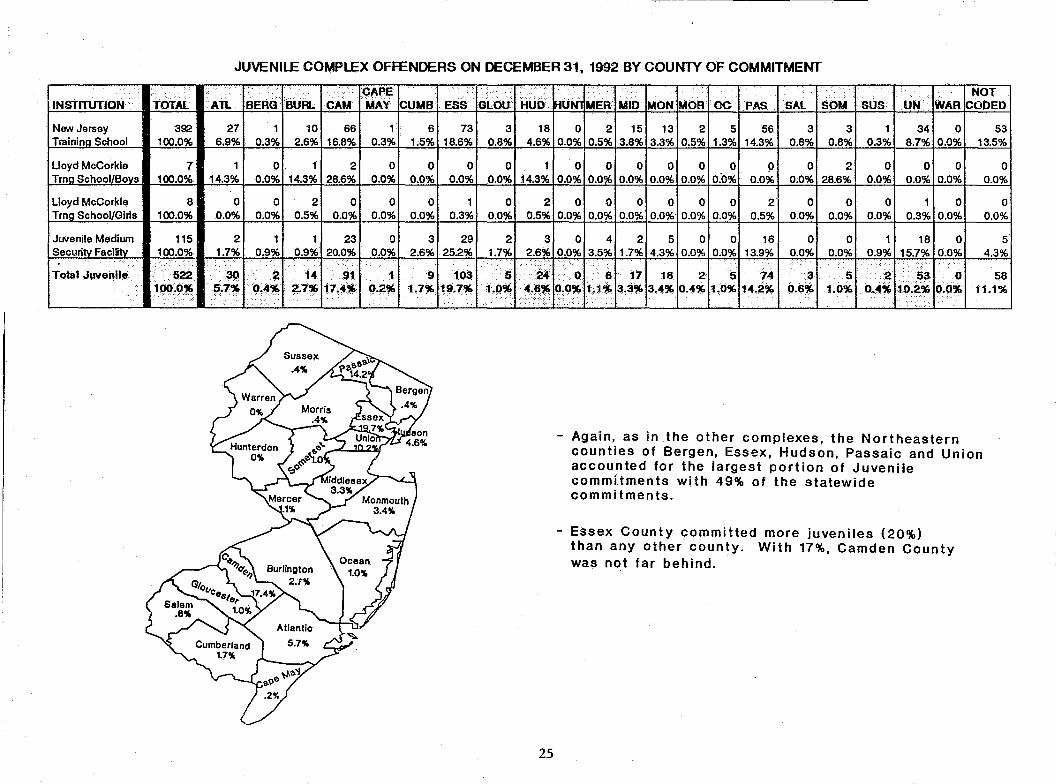
- Again, as in the other complexes, the Northeastern counties of Bergen, Essex, Hudson, Passaic and Union accounted for the largest portion of Juvenile commitments with 49% of the statewide commi tments.
- Essex County committed more juveniles (20%) than any other county. With 17%, Camden County was not far behind.
!
OFFENDER CHARACTERISTICS REPORT - 1992
BASE OFFENSE
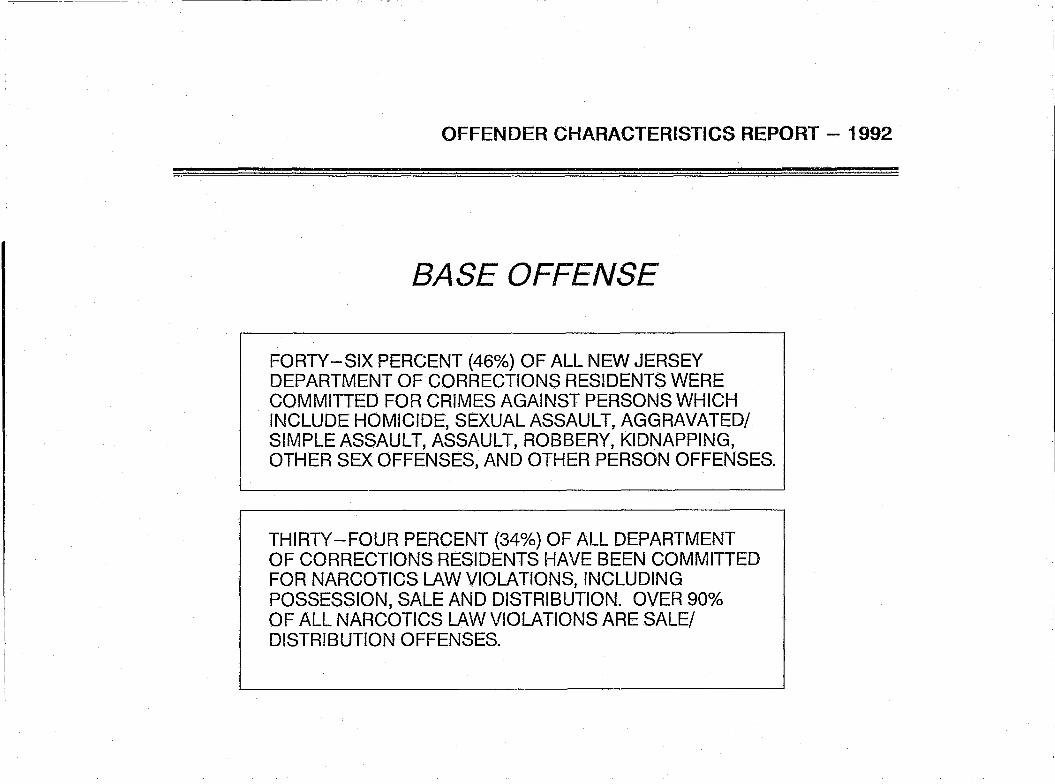
FORTY-SIX PERCENT (46%) OF ALL NEW JERSEY DEPARTMENT OF CORRECTIONS RESIDENTS WERE COMMITIED FOR CRIMES AGAINST PERSONS WHICH INCLUDE HOMICIDE, SEXUAL ASSAULT, AGGRAVATED/ SIMPLE ASSAULT, ASSAULT, ROBBERY, KIDNAPPING, OTHER SEX OFFENSES, AND OTHER PERSON OFFENSES.
THIRTY-FOUR PERCENT (34%) OF ALL DEPARTMENT OF CORRECTIONS RESIDENTS HAVE BEEN COMMITIED FOR NARCOTICS LAW VIOLATIONS, INCLUDING POSSESSION, SALE AND DISTRIBUTION. OVER 90% OF ALL NARCOTICS LAW VIOLATIONS ARE SALE/ DISTRIBUTION OFFENSES.
OFFENDERS IN NEW JERSEY CORRECTIONAL INSTITUTIONS ON DECEMBER 31, 1992 BY BASE OFFENSE
In these tabulations, the Base Offense is that which is the most serious offense at the time of admission. These figures reflect base or controlling offense at admission only, and do not include offenses in addition to the base offense in the case of multiple sentences at admission, nor are additional sentences imposed following initial admission to the State Correctional System included in the data.
- Violent Crimes incude homicide, sexual assaul~ aggravated/simple assaul~ robbery, kidnapping, other sex offenses and other persons offenses (i.e. terroristic threats, coercion, larceny from a person, death by auto and negligent manslaughter).
- Property Offenses include burglary, arson, the~ forgery, embezzlement, and receiving/possessing stolen property.
- Public Policy Offenses include racketeering, gambling, violation of probation, corruption, perjury, escape, bail jumping, juvenile or family related offenses and conspiracy. Violation of probation Is the commitment offense for the vast majority of those in the Public Policy category.
- Weapons offenses include weapons posseSSion/operation.
- Narcotics Violations include distribution, manufacture and posseSSion/use of drugs. OIer 900A. of these are for distribution, manufacture and sale.
OFFENDERS IN CORRECTIONAL INSTITUTIONS ON DECEMBER 31, 1992 BY BASE OFFENSE
.. PtiSbn· Youth ····Eoria.· . :other' Adult Base bffense Total Corrii lex COrriolex Aote Mcthari··
~
... :# % /I crt)- #: % iF % #; .• ; .:; .. %;.' ••.
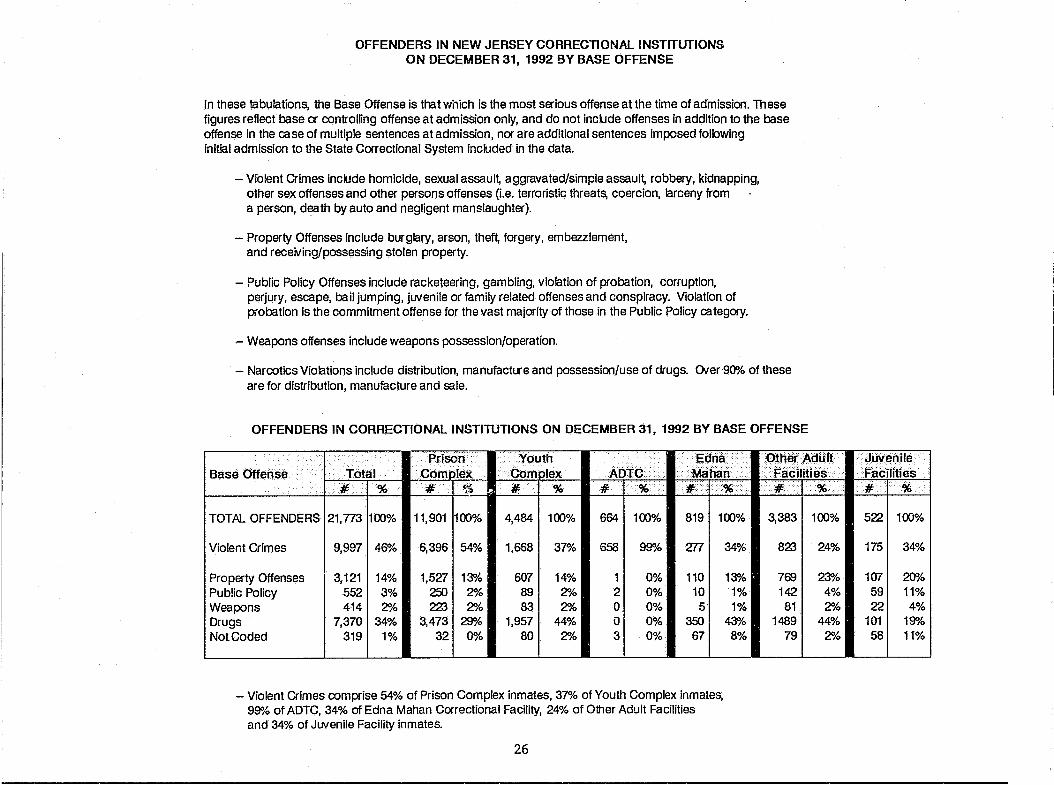
TOTAL OFFENDERS 21,773 100% 11,901 100% 4,484 100% 664 100% 819 100%
Violent Crimes 9,997 46% 6,396 54% 1,668 37% 658 99% 277 34%
Property Offenses 3,121 14% 1,527 13% 607 14% 1 0% 110 13% Public Policy 552 3% 250 2% 89 2% 2 0% 10 1% Weapons 414 2% 223 2% 83 2% 0 0% 5 1% Drugs 7,370 34% 3,473 29% 1,957 44% 0 0% 350 43% Not Coded 319 1% 32 0% 80 2% 3 0% 67 8%
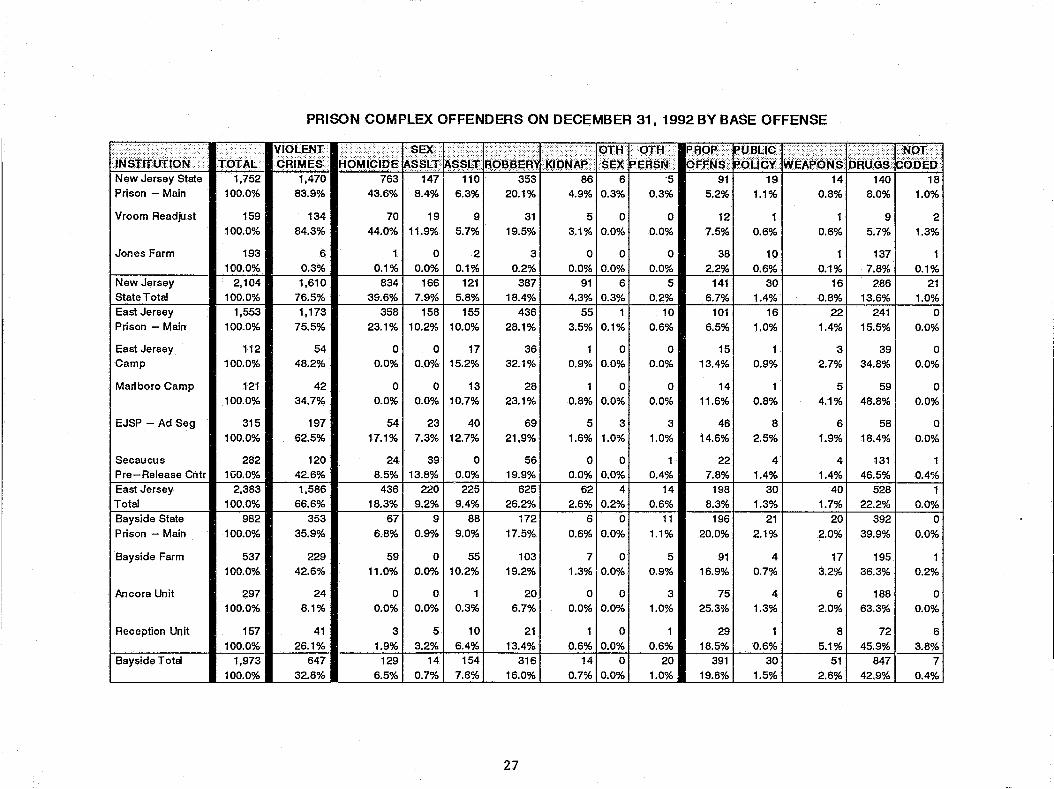
- Violent Crimes comprise 54% of Prison Complex inmates, 37% of Youth Complex inmates, 99% of ADTC, 34% of Edna Mahan Correctional Facility, 24% of Other Adult Facilities and 34% of Juvenile Facility inmates.
26
Fadilities •••..... ;./# %
3,383 100%
823 24%
769 23% 142 4% 81 2%
1489 44% 79 2%
IJUveriile FaCilities # %
522 100%
175 34%
107 2OOA. 59 11% 22 4%
101 19% 58 11%
PRISON COMPLEX OFFENDERS ON DECEMBER 31, 1992 BY BASE OFFENSE
la;~itrfDt,dN ·t()f~L 'b~ILJ~ H¢k119Ih~~~~&~S$tif ~6Brig~)klbNJ\~~~~p~l:N ~¥~m~ .;~d·tj~~ Yi~~~~~s ijt3U~'~~6~1~" New Jersey State 1,752 1,470 763 147 110 353 86 6 '5 91 19 14 140 18 Prison - Main 100.0% 83.9% 43.6% 8.4% 6.3% 20.1% 4.9% 0.3% 0.3% 5.2% 1.1% 0.8% 8.0% 1.0%
Vroom ReadiJst
Jones Farm
New Jersey State Total East Jersey Prison - Main
East Jersey Camp
Marlboro Camp
EJSP - Ad Seg
Secaucus Pre-Release Cntr
East Jersey Total Bayside State
Prison - Main
Bayside Farm
Ancora Unit
Reception Unit
Bayside T ota
159
100.0%
193 100.0%
2,104 100.0%
1,553
100.0%
112 100.0%
121 100.0%
315 100.0%
282 100.0%
2,383 100.0%
982
100.0%
537 100.0%
297 100.0%
157 100.0%
1,973 100.0%
134 84.3%
6
0.3% 1,610
76.5% 1,173
75.5%
54 48.2%
42 34.7%
197
62.5%
120 42.6% 1,586
66.6%
353
35.9%
229 42.6%
24 8.1%
41
26.1% 647
32.8%
70 I 19 44.0% 11.9%
0.1% 834
39.6% 358
o 0.0%
166 7.9%
158
9 5.7%
2 0.1%
121 5.8%
155 23.1% 1 10.2% 110.0%
o 0.0%
01 17 0.0% 15.2%
o 0.0%
o 13 0.0% 10.7%
54 17.1%
23 40 7.3% 12.7%
241 39 8.5% 13.8%
4361 220 18.3% 9.2%
671 9 6.8% 0.9%
o 0.0%
225
9.4% 88
9.0%
591 01 55 11.0% 0.0% 10.2%
01 0 0.0% 0.0% 1 0.3%
31 51 10 1.9% 3.2% 6.4%
1291 141 154 6.5% 0.7% 7.8%
31 19.5%
3
0.2% 387
18.4% 436
28.1%
36 32.1%
28 23.1%
69 21.9%
56 19.9%
625 26.2%
172
17.5%
103 19.2%
20 6.7%
21 13.4%
316 16.0%
27
51 0 3.1% 0.0%
01 0 0.0% 0.0%
911 6 4.3% 0.3%
551 1 3.5% 0.1%
o 0.9%10.0%
o 0.8%10.0%
5 3
1.6% 1.0%
o 0 0.0% 0.0%
621 4 2.6% 0.2%
61 0 0.6% 0.0%
71 0 1.3% 0.0%
01 0 0.0% 0.0%
o 0.6%10.0%
141 0 0.7% 0.0%
o 0.0%
o 0.0%
5 0.2%
10 0.6%
o 0.0%
o 0.0%
3
1.0%
0.4% 14
0.6% 11
1.1%
5
0.9%
3 1.0%
0.6% 20
1.0%
12 7.5%
38
2.2% 141
6.7% 101
6.5%
15 13.4%
14 11.6%
46 14.6%
22 7.8%
198 8.3%
196 20.0%
91 16.9%
75 25.3%
29 18.5%
391 19.8%
0.6%
10 0.6%
30 1.4%
16 1.0%
0.9%
0.8%
8 2.5%
4 1.4%
30 1.3%
21
2.1%
4 0.7%
4 1.3%
0.6% 30
1.5%
0.6%
1 0.1%
16 0.8%
22 1.4%
3 2.7%
5 4.1%
6 1.9%
4
1.4% 40
1.7% 20
2.0%
9 5.7%
137
7.8% 286
13.6% 241
15.5%
39 34.8%
59 48.8%
58 18.4%
131 46.5%
528 22.2%
392
39.9%
171 195 3.2% 36.3%
6 2.0%
8 5.1%
51 2.6%
188 63.3%
72
45.9% 847
42.9%
2 1.3%
0.1% 21
1.0% o
0.0%
o 0.0%
o 0.0%
o 0.0%
1 0.4%
0.0% o
0.0%
0.2%
o 0.0%
6
3.8% 7
0.4%
PRISON COMPLEX - CONTINUED
IN~Th-&r{6N I"~Tl\~ '6~fJ~ :SEX
~~~Lt ~~~~~~, :J(U1NAP OTH :oTB::: p~9fr--: pUBi:Jc
W~~@~~ ":':/ .:> -.:,-,:<:::.;-.' Nor:
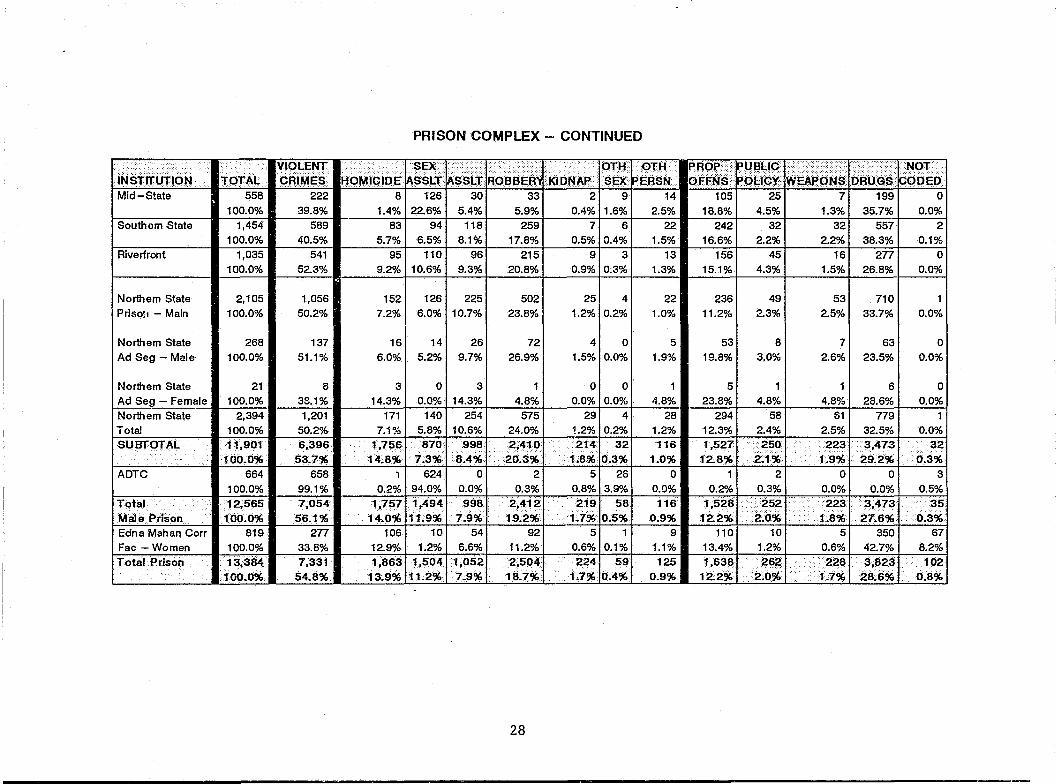
8oMk:;loe ~SSlT --sex PEBSN OffN_$ p(jllbx DRUGi§' pQPEfi Mid-State I 558 222 8 126 30 33 2 9 14 105 25 7 199 0
100.0% 39.8% 1.4% 22.6% 5.4% 5.9% 0.4% 1.6% 2.5% 18.8% 4.5% 1.3% 35.7% 0.0% South em State I 1,454 589 83 94 118 259 7 6 22 242 32 32 557 2
100.0% 40.5% 5.7% 6.5% 8.1% 17.8% 0.5% 0.4% 1.5% 16.6% 2.2% 2.2% 38.3% 0.1% Riverfront I 1,035 541 95 110 96 215 9 3 13 156 45 16 277 0
100.0% 52.3% 9.2% 10.6% 9.3% 20.8% 0.9% 0.3% 1.3% 15.1% 4.3% 1.5% 26.8% 0.0%
Northem State 2,105 1,056 152 126 225 502 25 4 22 236 49 53 710 PrisCY,j - Main 100.0% 50.2% 7.2% 6.0% 10.7% 23.8% 1.2% 0.2% 1.0% 11.2% 2.3% 2.5% 33.7% I 0.0%
Northem State 268 137 16 14 26 72 4 0 5 53 8 7 631
0 Ad Seg - Male 100.0% 51.1% 6.0% 5.2% 9.7% 26.9% 1.5% 0.0% 1.9% 19.8% 3.0% 2.6% 23.5% 0.0%
Northem State 21 8 3 0 3 1 0 0 5 28.6~1
0 Ad Seg - Female 100.0% 38.1% 14.3% 0.0% 14.3% 4.8% 0.0% 0.0% 4.8% 23.8% 4.8% 4.8% 0.0% Northem State 2,394 1,201 171 140 254 575 29 4 28 294 58 51 779 Total 100.0% 50.2% 7.1'}; 5.8% 10.6% 24.0% ~.2% 0.2% 1.2% 12.3% 2.4% 2.5% 32.5% 0.0% SUBTOTAL 11,901 6;396 1,756 870 _998_ 2;410 __ 214 32 116 1,527 ----_-:-250: 223 3,473 -32
100.0% 53~7% 14~8% 7~3% 8A% 20,3% L8%: 0.3% 12.8% : 2~1% --
1.9% - 29.2%_ 0.3% __ ---- 1.0% ADTC 664 658 1 624 0 2 5 26 0 2 0 0 3
100.0% 99.1% 0.2% 94.0% 0.0% 0.3% 0.8% 3.9% 0.0% 0.2% 0.3% 0.0% 0.0% 0.5% Total 12,565 7,054 1;751 1.494 _998 2,4t2 219 58 116 .,-,528 252 223 ~,473 35 Mate Prison 100.0% 56~ 1% 14.0% 11;9$ 7.9_% 19.2% 1:.:7% 0.5% 0.9% 12..2% __ ~E6% L8% 1 27•6%: 0.3% Edna Mahan Corr 819 277 106 10 54 92 5 9 110 10 5 350 67 Fac -Women 100.0% 33.8% 12.9% 1.2% 6.6% 11.2% 0.6% 0.1% 1.1% 13.4% 1.2% 0.6% 42.7% 8.2% Total Prison 13,384 7,331 1,863 1,504- -1,052 2,504 224 59 125 1.,638 - 2~2_ --228 3,823 102
_100.0% 54.8% 13~9% 11,2$ 7;9% 18.7% 1.1% 0.4%- 0.9% 12,2%_ -2;0% 1.7% 28.6% 0.8%
28

PRISON COMPLEX MALES BY BASE OFFENSE ON DECEMBER 31, 1992
PROPERTY 13%
(EXCLUDES ADTC)
PUBLIC POLICY WEAPONS 2% 2%
DRUGS 29%
- Fifty-four percent (54%) of the male offenders in the Prison Complex have been convicted of a crime of a violent nature.
- Twenty-nine percent (29%) of all offenders in the Prison Complex have been convicted of narcotics violations.
29

BY BASE OFFENSE ON DECEMBER 31, 1992
VIOLENT 100%
ADTC
- Virtually all offenders at the Adult Diagnostic and Treatment Center were committed for violent crimes.
30
EDNA MAHAN CORRECTIONAL FACILITY FOR WOMEN
PROPERTY 13%
PUB LI CPO L I CY 1%
DRUGS 43%
NOT CODED 8%
WEAPONS 1%
- Violation of narcotics statutes is now the most frequent commitment offense at Edna Mahan (43%).
- Only 34% of the female residents have been committed for violent offenses.
YOUTH COMPLEX OFFENDERS ON DECEMBER 31,1992 BY BASE OFFENSE
.... VIOLENT
i.dMICllJE sar .. .. .' ... : .....• ::, OTH: >OTH:··:.::· .. fo'fl9P: i?UBUG: .. ;..:-.-.... :
[jRU~~ :.NOT . INSTITUTION tOTAL CRiMES: ASSLT AsSLt ROBBERY' KlriNAP~ SEX' PEASN poUCV: ~PONS Ir'.j .....•. : .... : .... :
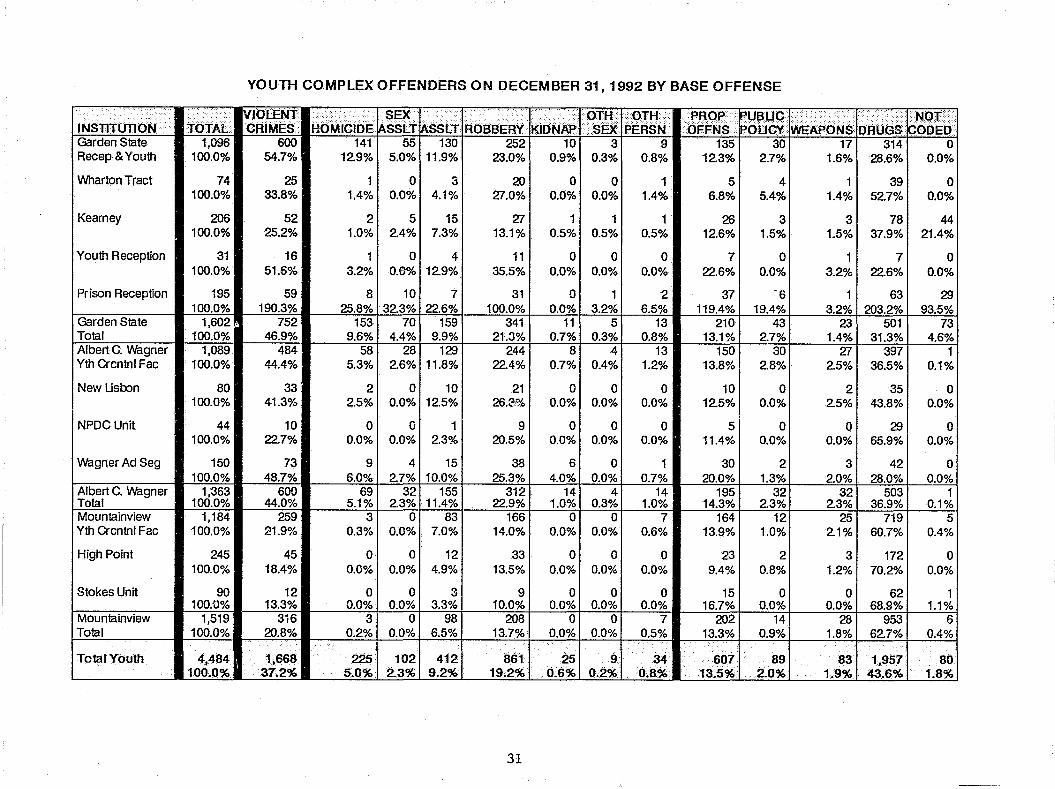
:.DFFNS IliODED Garden State 1,096 600 141 55 130 252 10 3 9 135 30 17 314 0 Recep & Youth 100.0% 54.7% 12.9% 5.0% 11.9% 23.0% 0.9% 0.3% 0.8% 12.3% 2.7% 1.6% 28.6% 0.0%
Wharton Tract 74 25 1 0 3 20 0 0 1 5 4 1 39 0 100.0% 33.8% 1.4% 0.0% 4.1% 27.0% 0.0% 0.0% 1.4% 6.8% 5.4% 1.4% 52.7% 0.0%
Keamey 206 52 2 5 15 27 1 1 1 26 3 3 78 44 100.0% 25.2% 1.0% 2.4% 7.3% 13.1% 0.5% 0.5% 0.5% 12.6% 1.5% 1.5% 37.9% 21.4%
Youth Reception 31 16 1 0 4 11 0 0 0 7 0 1 7 0 100.0% 51.6% 3.2% 0.0% 12.9% 35.5% 0.0% 0.0% 0.0% 22.6% 0.0% 3.2% 22.6% 0.0%
Prison Reception 195 59 8 10 7 31 0 1 2 37 '6 1 63 29 100.0% 190.3% 25.8% 32.3% 22.6% 100.0% 0.0% 3.2% 6.5% 119.4% 19.4% 3.2% 203.2% 93.5%
Garden State 1,602. 752 153 70 159 341 11 5 13 210 43 23 501 73 Total 100.0% 46.9% 9.6% 4.4% 9.9% 21.3% 0.7% 0.3% 0.8% 13.1% 2.7% 1.4% 31.3% 4.6% Albert C. wagner 1,089 484 58 28 129 244 8 4 13 150 30 27 397 1 Yth Crcntnl Fac 100.0% 44.4% 5.3% 2.6% 11.8% 22.4% 0.7% 0.4% 1.2% 13.8% 2.8% 2.5% 36.5% 0.1%
NewUsbon 80 33 2 0 10 21 0 0 0 10 0 2 35 0 100.0% 41.3% 2.5% 0.0% 12.5% 26.3% 0.0% 0.0% 0.0% 12.5% 0.0% 2.5% 43.8% 0.0%
NPDCUnit 44 10 0 0 1 9 0 0 0 5 0 0 29 0 100.0% 22.7% 0.0% 0.0% 2.3% 20.5% 0.0% 0.0% 0.0% 11.4% 0.0% 0.0% 65.9% 0.0%
wagner Ad Seg 150 73 9 4 15 38 6 0 1 30 2 3 42 0 100.0% 48.7% 6.0% 2.7% 10.0% 25.3% 4.0% 0.0% 0.7% 20.0% 1.3% 2.0% 28.0% 0.0%
Albert C. wagner 1,363 600 69 32 155 312 14 4 14 195 32 32 503 1 Total 100.0% 44.0% 5.1% 2.3% 11.4% 22.9% 1.0% 0.3% 1.0% 14.3% 2.3% 2.3% 36.9% 0.1% Mountainview 1,184 259 3 0 83 166 0 0 7 164 12 25 719 5 Yth Crcntnl Fac 100.0% 21.9% 0.3% 0.0% 7.0% 14.0% 0.0% 0.0% 0.6% 13.9% 1.0% 2.1% 60.7% 0.4%
High Point 245 45 0 0 12 33 0 0 0 23 2 3 172 0 100.0% 18.4% 0.0% 0.0% 4.9% 13.5% 0.0% 0.0% 0.0% 9.4% 0.8% 1.2% 70.2% 0.0%
Stokes Unit 90 12 0 0 3 9 0 0 0 15 0 0 62 1 100.U% 13.3% 0.0% 0.0% 3.3% 10.0% 0.0% 0.0% 0.0% 16.7% 0.0% 0.0% 68.9% 1.1%
Mountainview 1,519 316 3 0 98 208 0 0 7 202 14 28 953 6 Total 100.0% 20.8% 0.2% 0.0% 6.5% 13.7% 0.0% 0.0% 0.5% 13.3% 0.9% 1.8% 62.7% 0.4%
Total Youth 4.484 1,668 225 102 412 861 25 .9 34 607 89 83 1,957 80 100,0% 37~2.% 5.0% 2.3% 9.2%
... 'j 0.6% 0.2% 0.8% 13.5% 2.0% t.9% 43 .. 6% 1.8% 19.2%.
31
I NSllTUTlON
County Jail
Halfway House
Cental Medical
Toal Other Facilities
TQ~IAdult$
ADULT OFFENDERS IN OTHER FACILITIES
SEX VIOLENT ~SSLT. TOTAL CRIMES HOMICIDE ~$SLT ROBBERY
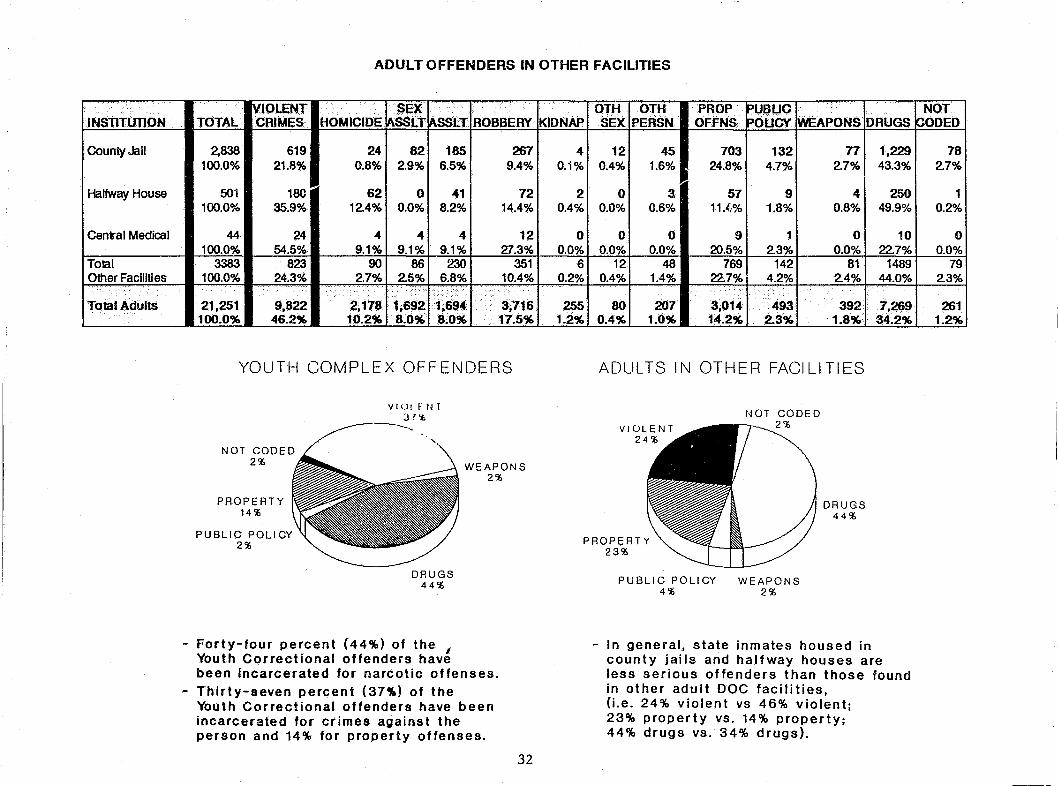
2,838 619 24 82 185 267 100.0% 21.8% 0.8% 2.9% 6.5% 9.4%
501 180 62 0 41 72 100.0% 35.9% 12.4% 0.0% 8.2% 14.4%
44 24 4 4 4 12 100.0% 54.5% 9.1% 9.1% 9.1% 27.3%
3383 823 90 86 230 351 100.0% 24.3% 2.7% 2.5% 6.8% 10.4%
..
21,251 9.622 2;17a 1,6$Z 1,694. ' 3;716, 100.0% 46.2% 10.2% 8.0"- 8.0% 17.5%
YOUTH COMPLEX OFFEf'-lDERS
VI(Jtf.NT 37'i. ------
NOT CODED 2% WEAPONS
2%
PROPERTY 14%
PUBLIC POLICY 2%
DRUGS 44%
- Forty-four percent (44%) of the I
Youth Correctional offenders have been incarcerated for narcotic offenses.
- Thirty-seven percent (37 .. ) of the Youth Correctional offenders have been incarcerated for crimes against the person and 14% for property offenses.
32
KIDNAP
4 0.1%
2 0.4%
0 0.0%
6 0.2%
~5 1.2%
OUi °TH· PROP PUa.UC SEX PERSN OFFNS PQUCY \NEAPONS
12 45 703 132 77 0.4% 1.6% 24.8% 4.7% 2.7%
0 3, 57 9 4 0.0% 0.6% 11A;% 1.8% 0.8%
0 0 9 1 0 0.0% 0.0% 20.5% 2.3% 0.0%
12 48 769 142 81 0.4% 1.4% 22.7% 4.2% 2.4%
.. '
80 207 3.Cl14 493 392 0.4% 1.0% 14.2% 2.3% 1.8%
ADULTS IN OTHER FACILITIES
DRUGS 44%
DRUGS
1,229 43.3%
250 49.9%
10 22.7%
1489 44.0%
7,269 34.2"-
PROPERTY 23%
PUBLIC POLICY WEAPONS 4% 2%
- In general, state inmates housed in county jai Is and halfway houses are less serious offenders than those found in other adult DOC facilities. (Le. 24% violent vs 46% violent; 23% property VS. 14% property; 44% drugs vs. 34% drugs).
NOT CODED
78
2.7%1
1 0.2%
0 0.0%
79 2.3%
261 1.2%

. '" ."
INSTITUTION. . .. TOTAL
New Jersey 392 Training School 100.0%
Lloyd McCorkle 7 Trng School/Boys 100.0%
Lloyd McCorkle 8 Trng School/Girls 100.0%
JUlfenile Medium 115 Security Facility 100.0%
...
Total JUVenile 522 1 ()().O%
- ------~
JUVENILE COMPLEX OFFENDERS ON DECEMBER 31, 1992 BY BASE OFFENSE
MOLE NT ..... ; ...... -..... : CRIMES
126 32.1%
2 28.6%
4 50.0%
43 37.4%
175 3.3.5,*,
-- ---~
SEX .. " ", .-' ... :<", ..... "
HOMICIDE ASSt.T ASSlT ROBBER't T<U1NAP 16 8 51 43 0
4.1% 2.0% 13.0% 11.0% 0.0%
0 0 2 0 0 0.0% 0.0% 28.6% 0.0% 0.0%
0 0 2 2 0 0.0% 0.0% 25.0% 25.0% 0.0%
8 5 12 17 1 7.0% 4.3% 10.4% 14.8% 0.9%
24 13 67 62 1 4.6"'- 2.5"'- 12.6"'- 11.9')(. . ·0,2'"
----- ----~
PROPERTY 20%
... ~
WEAPONS 4%
-.---".~--
QTJ1ER SEX
2 0.5%
0 0.0%
0 0.0%
0 0.0%
2 0.4"-
. . - .--~
DRUGS 19%
·OTH PROP PERSN OFfNS·
6 76 1.5% 19.4%
0 1 0.0% 14.3%
0 0 0.0% 0.0%
0 30 0.0% 26.1%
6 107 1.1% 2O.5'Xo
NOT CODED 11%
PUBLIC POLICY rNEAPONS
42 13 10.7% 3.3%
1 0 14.3% 0.0%
3 0 37.5% 0.0%
13 9 11.3% 7.8%
59 22 11.3"" 4.~~
- Thirty-four percent (34%) of Juvenile complex offenders were committed for violent crimes, 38% of which were assaults.
- Nineteen percent (19%) of the Juvenile offenders were committed for narcotics violations and 20% for property offenses.
33
·.NOT DRlJGS CODED
82 53 20.9% 13.5%
3 0 42.9% 0.0%
1 0 12.5% 0.0%
!
15 5 13.0% 4.3%
11.1s:
1
101 19.3%
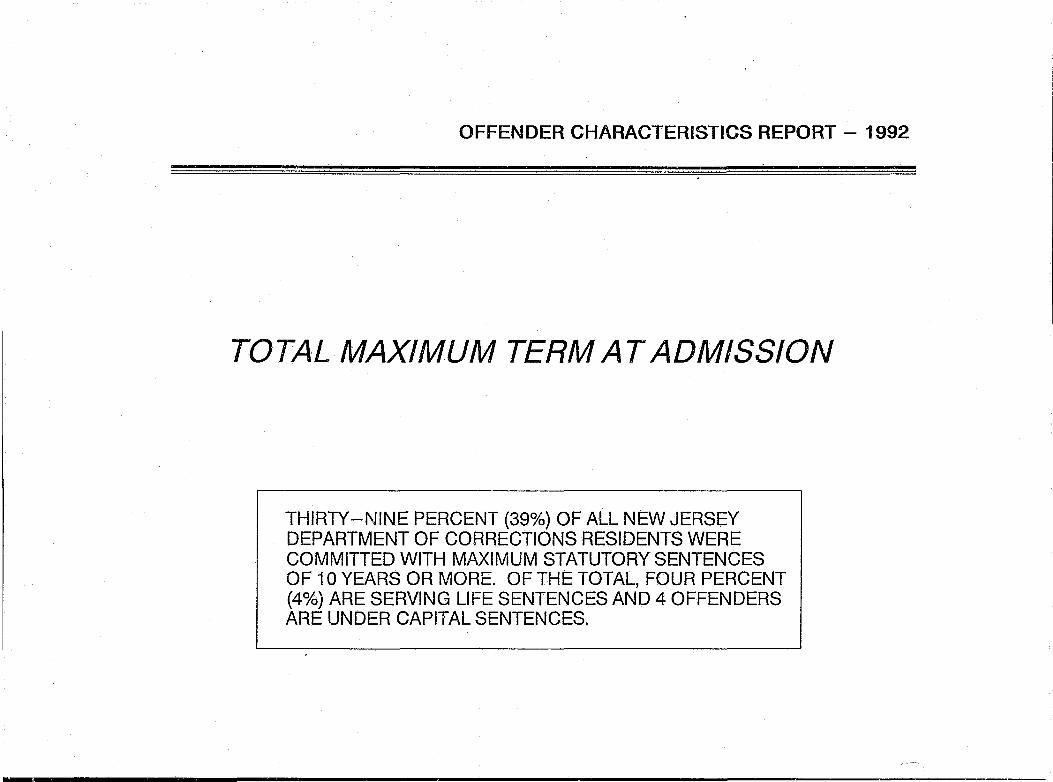
OFFENDER CHARACTERISTICS REPORT - 1992
TOTAL MAXIMUM TERM AT ADMISSION
THIRTY-NINE PERCENT (39%) OF ALL NEW JERSEY DEPARTMENT OF CORRECTIONS RESIDENTS WERE COMMITIED WITH MAXIMUM STATUTORY SENTENCES OF 10 YEARS OR MORE. OF THE TOTAL, FOUR PERCENT (4%) ARE SERVING LIFE SENTENCES AND 4 OFFENDERS ARE UNDER CAPITAL SENTENCES .
.................................................... .m .............................. ~ .......................... ____ .. __ .. ________________________________________________________________________ ___
T 01111 r ~rni ' ... ".
TOTAL OFFENDERS
1-2 years 3 years 4 years 5 years 6 years 7 years 8 - 9 years 10 years 11-14 years 15 years 16-20 years 20+ years LIFE CAPiTAL NOT CODED
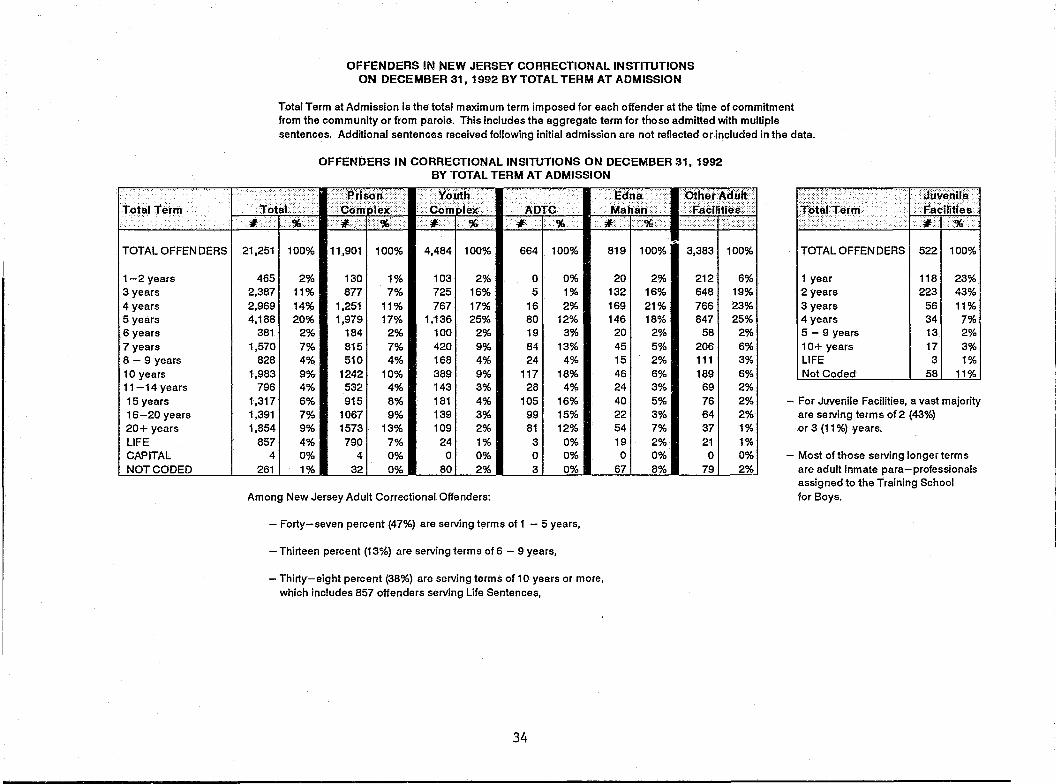
OFFENDERS IN NEW JERSEY CORRECTIONAL INSTITUTIONS ON DECEMBER 31,19B2 BY TOTAL TERM AT ADMISSION
Total Term at Admission is the total maximum term imposed for each offender at the time of commitment from the community or from parole. This includes the aggregate term for those admitted with multiple sentences. Additional sentences received following initial admission are not reflected 0 r included in the data.
OFFENDERS IN CORRECTIONAL INSITUTIONS ON DECEMBER 31,1992 BY TOTAL TERM AT ADMISSION
··.·Tdtat··· ··.·gj~~£i~~2 ••• · >Yoirth . i.Corrtblex< '. ADTe
#. .: .•. $: •. ":'. .:':''#:.('. :::9(,:i . .... # ...... : :,%" #' %
21,251 100% 11,901 100% 4,484 100% 664 100%
465 2% 130 1% 103 2% 0 0% 2,387 11% 877 7% 725 16% 5 1% 2,969 14% 1,251 11% 767 17% 16 2% 4,188 20% 1,979 17% 1,136 25% 80 12%
381 2% 184 2% 100 2% 19 3% 1,570 7% 815 7% 420 9% 84 13%
828 4% 510 4% 168 4% 24 4% 1,983 9% 1242 10% 389 9% 117 18%
796 4% 532 4% 143 3% 28 4% 1,317 6% 915 8% 181 4% 105 16% 1,391 7% 1067 9% 139 3% 99 15% 1,854 9% 1573 13% 109 2% 81 12%
857 4% 790 7% 24 1% 3 0% 4 0% 4 0% 0 0% 0 0%
261 1% 32 0% 80 2% 3 0%
Among New Jersey Adult Correctional Offenders:
- Forty-seven percent (47%) are serving terms of 1 - 5 years,
- Thirteen percent (13%) are serving terms of 6 - 9 years,
- Thirty-eight percent (38%) are serving terms of 10 years or more, which includes 857 offenders serving Life Sentences,
34
I;dtl~ ...... Other-Adult. Mahan.:' .·.·}F.~~tilft~~))
if'. .,:.%: ..•.. ':>.:'.:" 1'>:\
819 100% 3,383 100%
20 2% 212 6% 132 16% 648 19% 169 21% 766 23% 146 18% 847 25%
20 2% 58 2% 45 5% 206 6% 15 2% 111 3% 46 6% 189 6% 24 3% 69 2% 40 5% 76 2% 22 3% 64 2% 54 7% 37 1% 19 2% 21 1% 0 0% 0 0%
67 8% 79 2%
..-:.";.<.;::
~~~rj -terrf12
TOTAL OFFENDERS I 5221 100%
1 year 118 23% 2 years 223 43% 3 years 56 11% 4 years 34 7% 5 - 9 years 13 2% 10+ years 17 3% LIFE 3 1% Not Coded 58 11%
- For Juvenile Facilities, a vast majority are serving terms of2 (43%) or 3 (11 %) years.
- Most of those serving longer terms are adult inmate para-professionals assigned to the Training School for Boys.
;JNSTd"o"t.lON: •.••.••• .. totiL ~A~ New Jersey State 1,752 4 Prison - Main 100.0% O.20k
Vroom Readjust 159 1 100.0% 0.6%
Jones Farm 193 4 100.0% O.20k
New Jersey 2, 104 9 State Total 100.0% 0.4%
East Jersey 1,553 5 Prison - Main 100.0% 0.3%
East Jersey 112 2 Camp 100.0% 1.8%
Marlboro Camp 121 2 100.0% 1.7%
EJSP -Ad Seg 315 7 100.0% 2.20k
Secaucus 282 4 Pre-Release Cntr 100.0% 1.4%
East Jersey 2,383 20 Total 100.0% 0.8%
Bayside State 982 19 Prison - Main 100.0% 1.9%
Bayside Farm 537 6 100.0% 1.1%
Ancora Unit 297 4 100.0% 1.3%
Reception 157 5 100.0% 3.2%
Bayside Total 1,973 34 100.0% 1.7%
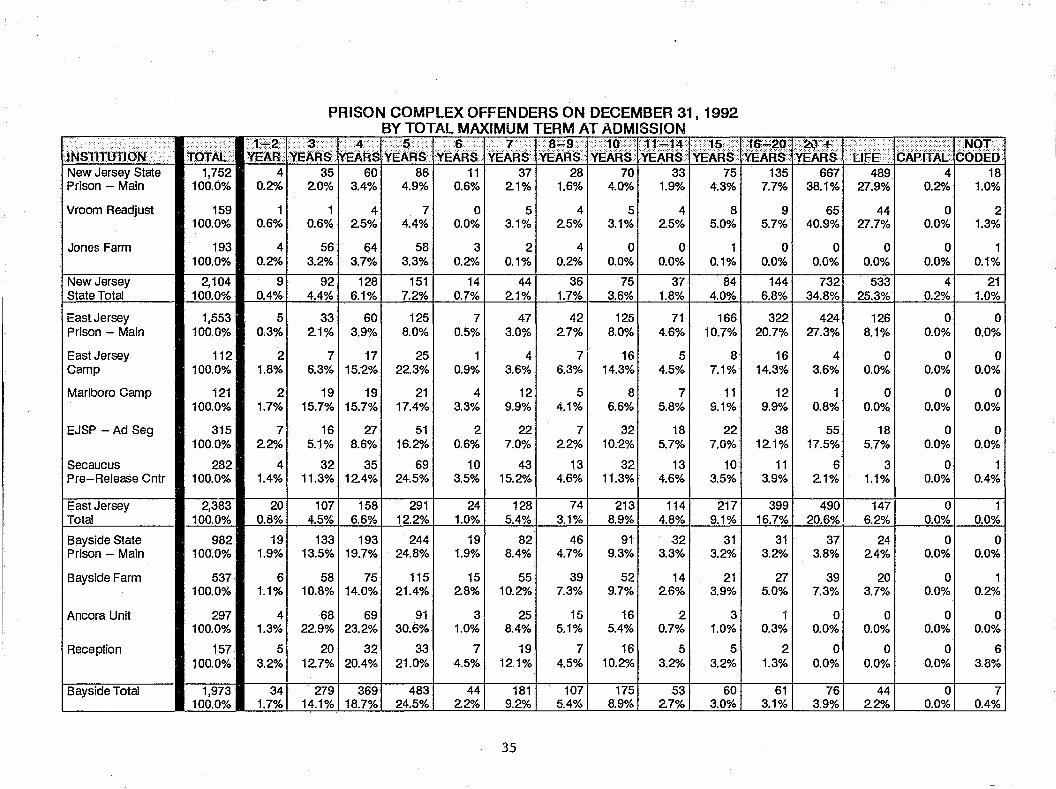
PRISON COMPLEX OFFENDERS ON DECEMBER 31,1992 BY TOTAL MAXIMUM TERM AT ADMISSION
&elij~ YE,4 X :Y~i~~. .. 6 .. · ·7 .
~t~~: fE*W~i ~Ari§ <;<15);
)'EAR§ ARS YEARS YEARS 35 60 86 11 37 28 70 33 75
2.0% 3.4% 4.9% 0.6% 2.1% 1.6% 4.0% 1.9% 4.3%
1 4 7 0 5 4 5 4 8 0.6% 2.5% 4.4% 0.0% 3.1% 2.5% 3.1% 2.5% 5.0%
56 64 58 3 2 4 0 0 1 3.2% 3.7% 3.3% 0.2010 0.1% 0.2% 0.0% 0.0% 0.1%
92 128 151 14 44 36 75 37 84 4.4% 6.1% 7.2% 0.7% 2.1% 1.7% 3.6% 1.8% 4.0%
33 60 125 7 47 42 125 71 166 2.1% 3.9% 8.0% 0.5% 3.0% 2.7% 8.0% 4.6% 10.7%
7 17 25 1 4 7 16 5 8 6.3% 15.2% 22.3% 0.9% 3.6% 6.3% 14.3% 4.5% 7.1%
19 19 21 4 12 5 8 7 11 15.7% 15.7% 17.4% 3.3% 9.9% 4.1% 6.6% 5.8% 9.1%
16 27 51 2 22 7 32 18 22 5.1% 8.6% 16.2% 0.6% 7.0% 2.2% 10.2% 5.7% 7.0%
32 35 69 10 43 13 32 13 10 11.3% 12.4% 24.5% 3.5% 15.2% 4.6% 11.3% 4.6% 3.5%
107 158 291 24 128 74 213 114 217 4.5% 6.6% 12.2% 1.0% 5.4% 3.1% 8.9% 4.8% 9.1%
133 193 244 19 82 46 91 32 31 13.5% 19.7% 24.8% 1.9% 8.4% 4.7% 9.3% 3.3% 3.2%
58 75 115 15 55 39 52 14 21 10.8% 14.0% 21.4% 2.8% 10.20k 7.3% 9.7% 2.6% 3.9%
68 69 91 3 25 15 16 2 3 22.9% 23.2% 30.6% 1.0% 8.4% 5.1% 5.4% 0.7% 1.0%
20 32 33 7 19 7 16 5 5 12.7% 20.4% 21.0% 4.5% 12.1% 4.5% 10.2% 3.2% 3.2%
279 369 483 44 181 107 175 53 60 14.1% 18.7% 24.5% 2.2% 9.2% 5.4% 8.9% 2.7% 3.0%
35
1§2~q YEARS
::.~# •.•. YEARS :t,F~;/ 8A~jfAiJ· b~ggDI
135 667 489 4 18 7.7% 38.1% 27.9% 0.2% 1.0%
9 65 44 0 2 5.7% 40.9% 27.7% 0.0% 1.3%
0 0 0 0 1 0.0% 0.0% 0.0% 0.0% 0.1%
144 732 533 4 21 6.8% 34.8% 25.3% 0.2% 1.0%
322 424 126 0 0 20.7% 27.3% 8.1% 0.0% 0.0%
16 4 0 0 0 14.3% 3.6% 0.0% 0.0% 0.0%
12 1 0 0 0 9.9% 0.8% 0.0% 0.0% 0.0%
38 55 18 0 0 12.1% 17.5% 5.7% 0.0% 0.0%
11 6 3 0 1 3.9% 2.1% 1.1% 0.0% 0.4%
399 490 147 0 1 I 16.7% 20.6% 6.2% 0.0% 0.0%
31 37 24 0 0 3.2% 3.8% 2.4% 0.0% 0.0%
27 39 20 0 1 5.0% 7.3% 3.7% 0.0% 0.2%
1 0 0 0 0 0.3% 0.0% 0.0% 0.0% 0.0%
2 0 0 0 6 1.3% 0.0% 0.0% 0.0% 3.8%
61 76 44 0 7 3.1% 3.9% 2.2% -Q.Q% 0.4%
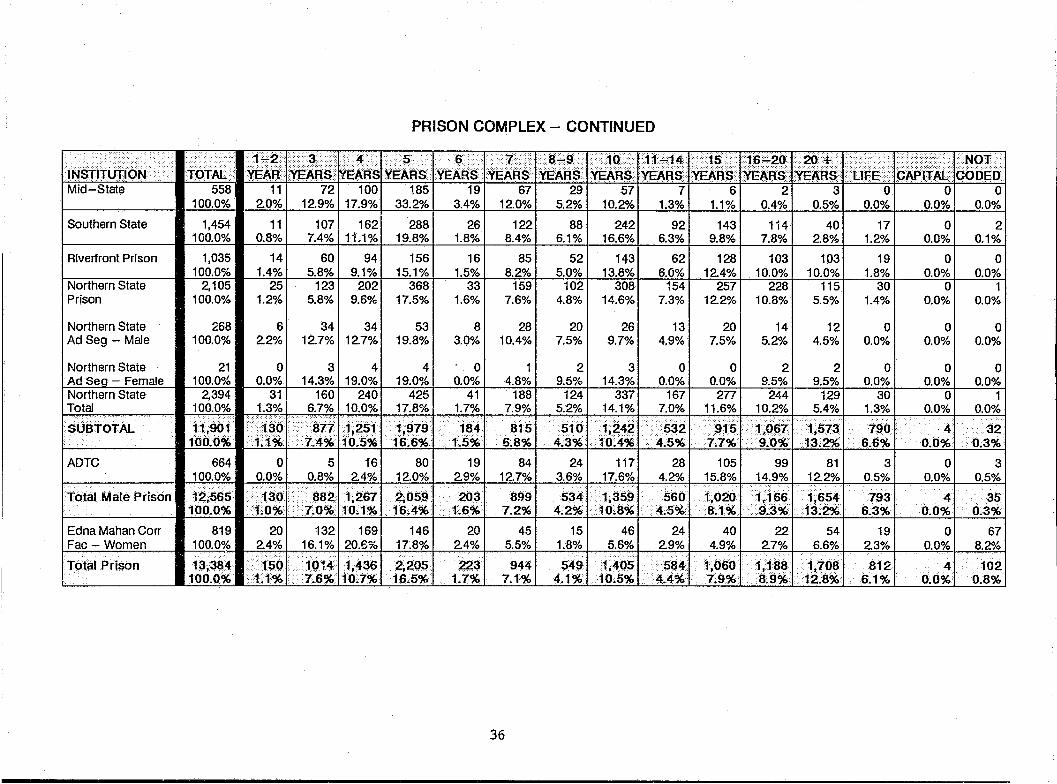
PRISON COMPLEX - CONTINUED
5.2% 0.0% Mid-State • 558. 111 7211001 1851 191 671 291 571 71 61 21 31 01 01 0
10.2<'10 1.3% 100.0% 2.0%1 12.9%117.9%1 33.2% 3.4% I 12.0% 1.1% 0.4% 0.5% 0.0% 0.0%
Southern State
Riverfront Prison
Northern State Prison
Northern State Ad Seg - Male
Northern State Ad Seg - Female Northern State Total
.$lJBTOTAL
ADTC
1,454 100.0%
1,035 100.0%
2, 105 100.0%
268 100.0%
21 100.0%
2,394 100.0%
1t,901 10fJ.O%
664
11 0.8%
14 1.4%
25 1.2%
1071 1621 288 7.4% 11.1% 19.8%
60 1 94 1 156 5.8% 9.1% 15.1%
1231 2021 368 5.8% 9.6% 17.5%
61 34
1 34 1 53 2.2% 12.7% 12.7% 19.8%
01 31 41 4 0.0% 14.3% 19.0% 19.0%
311 16012401 425 1.3% 6.7% 10.0% 17.8%
'\1a61.ifPiI125tl. 1979 J.1% --,-1;4%1~.S%, 1~.6%
o 5 16 100.0%. 0.0% I 0.8% I 2.4%
80 12.0%
26 1.8%
16 1.5%
33 1.6%
122 8.4%
85 8.2%
159 7.6%
81 28 3.0% 10.4%
o 0.0%
41 1.7%
184' 1~5%
19
4.8% 188
7.9%
8Ui 6~8%
84 2.9% I 12.7%
Total Male Prison 125651 <tjb' •.. ·.· 88211267 10tio%iio% '.7j)%1(JJ%
2,059·1 203 1. 899 1.6A% . 1Ji% 7.2%
Edna Mahan Corr 819 20 Fac - Women 100.0% 2.4%
Tptal Prison 13,3a4<1sd . 100.0%tl%
132 169 146 16.1% 20.6% 17.8%
j 0 14 1,436 2;205 7~6% to" 7% 16.5%
20 2.4% -.... -223
1.7%
45 5.5%
944 7.1%
36
881 242 6.1% 16.6%
92 6.3%
143 9.8%
114 7.8%
40 2.8%
521 143 5.0% 13.8%
621 1281 1031 103 6.0% 12.4% 10.0% 10.0%
1021 308 4.8% 14.6%
1541 2571 2281 115 7.3% 12.2% 10.8% 5.5%
20 7.5%
26 9.7%
13 4.9%
21 31 0 9.5% 14.3% 0.0%
1241 337 1 167 5.2% 14.1% 7.0%
20 7.5%
14 5.2<'10
01 2 0.0% 9.5%
2771 244 11.6% 10.2%
12 4.5%
2 9.5%
129 5.4%
17 1.2%
19 1.8%
30 1.4%
o 0.0%
o 0.0%
30 1.3%
/;\21.j~~~1 4~3~T 7}~r .~?o6~fJ1a~i:.l.6::~ 241 1171 28 105 99 81
3.6% I 17.6% 4.2% I 15.8% I 14.9% I 12.2%
5341. l,a59 I. 5601 1,0291 1,166.1 1,654 4.2% •. AO~8% .... ,,$.;5%8,1%/.9;3% .. 13~.2%
15 46 24 40 1.8% 4.9%
549 1,060 4.1% 7.9%
22 54 2.7% 6.6%
1,jB~ 1,70B 8;9%.12.8%
3 0.5%
7.93 6.3%
19 2.3%
812 6.1%
o 0.0%
o 0.0%
o 0.0%
o 0.0%
2 0.1%
o 0.0%
1 0.0%
o 0.0%
01 0 0.0% 0.0%
0.0~1 0.0%
O~O.,! 1 O.33~ 01 3
0.0%
. 4 0.0%
o 0.0%
4 OJ) %
0.5%
35 0.3%
67 8.2%
102 0.8%

PRISON COMPLEX MALES BY TOTAL MAXIMUM TERM ON DECEMBER 31, 1992
6-9 YEARS 13%
10 YEARS 10%
(EXCLUDES ADTC)
16-20 YEARS 9%
1-2 YEARS 1%
LI FE 7%
- In the chart above, we see that 29% of all Prison Complex males are serving terms of 16 years or more (including those serving life terms).
- Seventy-four percent (74%) of all offenders at New Jersey State Prison-Main are serving sentences of 16 years or more, with 489 of those serving life sentences. .,
- Forty-four percent (44%) of all offend.ers at East Jersey State Prison-Main are serving sentences of 15 years or less with 56% serving sentences of 16 years or more. .,
- Sixty percent (60%) of all offenders at Bayside State Prison-Main are serving sentences of 5 years or less. .,
.. Refer to table on pages 35 and 36
37

BY TOTAL MAXIMUM TERM ON DECEMBER 31, 1992
10 YEARS 18%
ADTC
6-9 YEARS 19%
3-5 YEARS 15%
20 + YEARS 12%
16-20 YEARS 15%
- Forty-eight percent (48%) of the offenders at the Adult Diagnostic and Treatment Center are serving sentences of 11 years or more.
38
EDNA MAHAN CORRECTIONAL FACILITY FOR WOMEN
",=,.,.,..,..~--l L I F E I 2%
10 YEARS 6%
20 + YEARS 7%
NOT CODED 6-9 YEARS 8%
10%
- Fifty-seven (57%) of the female offenders at Edna Mahan Correctional Facility for Women are serving sentences of five years or less.
- A total of 81% have terms of less than 15 years.
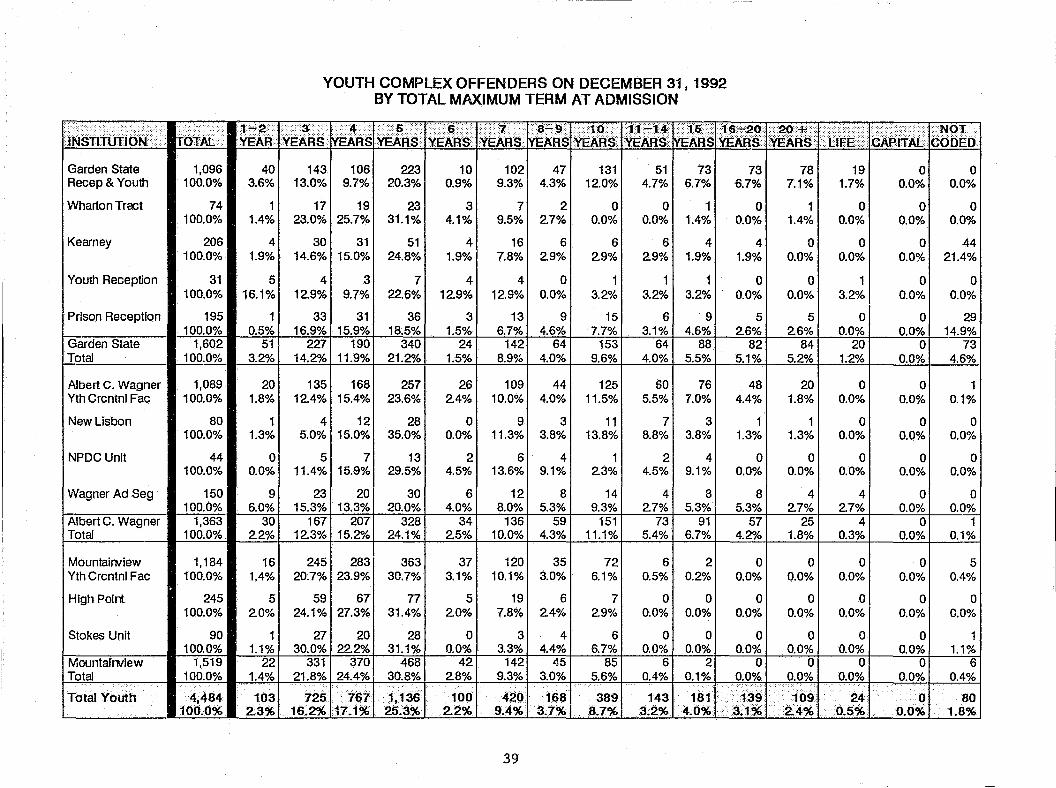
,~§f,+ilii6~·· ....... j~2·
IfdrAi.. .YEAR Garden State 1,096 40 Recep & Youth 100.0% 3.6%
Wharton Treet 74 1 100.0% 1.4%
Kearney 206 4 100.0% 1.9%
Youth Reception 31 5 100.0% 16.1%
Prison Reception 195 1 100.0% 0.5%
Garden State 1,602 51 Total 100.0% 3.2%
Albert C. Wagner 1,089 20 Yth Crcntnl Fac 100.0% 1.8%
New Lisbon 80 1 100.0% 1.3%
NPDC Unit 44 0 100.0% 0.0%
Wagner Ad Seg 150 9 100.0% 6.0%
Albert C. Wagner 1,363 30 Total 100.0% 2.2%
Mountairwiew 1,184 16 Yth Crcntnl Fac 100.0% 1.4%
High Palrt 245 5 100.0% 2.0%
Stokes Unit 90 1 100.0% 1.1%
Mountalmlew 1,519 22 Total 100.0% 1.4%
Total Youth 4,484 103 10()'0% 2.3%
YOUTH COMPLEX OFFENDERS ON DECEMBER 31, 1992 BY TOTAL MAXIMUM TERM AT ADMISSION
~~~S: .····4···.· .. ~ri~. ·.:::.<.·:· •. 6.;··· .... · . L7 ....•. ·•· y~~~~ .<I.PC. ~A~~ ~}.~§ ~~~: YEARS .YEARS YEARS YEARS.
143 106 223 10 102 47 131 51 73 73 13.0% 9.7% 20.3% 0.9% 9.3% 4.3% 12.0% 4.7% 6.7% 6.7%
17 19 23 3 7 2 0 0 1 0 23.0% 25.7% 31.1% 4.1% 9.5% 2.7% 0.0% 0.0% 1.4% 0.0%
30 31 51 4 16 6 6 6 4 4 14.6% 15.0% 24.8% 1.9% 7.8% 2.9% 2.9% 2.9% 1.9% 1.9%
4 3 7 4 4 0 1 1 1 0 12.9% 9.7% 22.6% 12.9% 12.9% 0.0% 3.2% 3.2% 3.2% 0.0%
33 31 36 3 13 9 15 6 9 5 16.9% 15.9% 18.5% 1.5% 6.7% 4.6% 7.7% 3.1% 4.6% 2.6%
227 190 340 24 142 64 153 64 88 82 14.2% 11.9% 21.2% 1.5% 8.9% 4.0% 9.6% 4.0% 5.5% 5.1%
135 168 257 26 109 44 125 60 76 48 12.4% 15.4% 23.6% 2.4% 10.0% 4.0% 11.5% 5.5% 7.0% 4.4%
4 12 28 0 9 3 11 7 3 1 5.0% 15.0% 35.0% 0.0% 11.3% 3.8% 13.8% 8.8% 3.8% 1.3%
5 7 13 2 6 4 1 2 4 0 11.4% 15.9% 29.5% 4.5% 13.6% 9.1% 2.3% 4.5% 9.1% 0.0%
23 20 30 6 12 8 14 4 8 8 15.3% 13.3% 20.0% 4.0% 8.0% 5.3% 9.3% 2.7% 5.3% 5.3%
167 207 328 34 136 59 151 73 91 57 12.3% 15.2"10 24.1% 2.5% 10.0% 4.3% 11.1% 5.4% 6.7% 4.2%
245 283 363 37 120 35 72 6 2 0 20.7% 23.9% 30.7% 3.1% 10.1% 3.0% 6.1% 0.5% 0.2% 0.0%
59 67 77 5 19 6 7 0 0 0 24.1% 27.3% 31.4% 2.0% 7.8% 2.4% 2.9% 0.0% 0.0% 0.0%
27 20 28 0 3 4 6 0 0 0 30.0% 22.2% 31.1% 0.0% 3.3% 4.4% 6.7% 0.0% 0.0% 0.0%
331 370 468 42 142 45 85 6 2 0 21.8% 24.4% 30.8% 2.8% 9.3% 3.0% 5.6% 0.4% 0.1% 0.0%
.... . .. 767 ·',136 420 168 ..13~ 725 100 389 143 181
16.2% 17.1% 25.3% 2,2% 9.4% 3;7% 8.7% 3;2% 4.0% ··3.1%
39
.:gq+:. ;t;~~.· • 6A~i¥AL ·.:·NOT· YEARS. CODED
78 19 0 0 7.1% 1.7% 0.0% 0.0%
1 0 0 0 1.4% 0.0% 0.0% 0.0%
0 0 0 44 0.0% 0.0% 0.0% 21.4%
0 1 0 0.0~1 0.0% 3.2% 0.0%
5 0 0 29 2.6% 0.0% 0.0% 14.9%
84 20 0 73 5.2% 1.2% 0.0% 4.6%
20 0 0 1 1.8% 0.0% 0.0% 0.1%
1 0 0 0 1.3% 0.0% 0.0% 0.0%
0 0 0 0 0.0% 0.0% 0.0% 0.0%
4 4 0 0 2.7% 2.7% 0.0% 0.0%
25 4 0 1 1.8% 0.3% 0.0% 0.1%
0 0 0 5 0.0% 0.0% 0.0% 0.4%
0 0 0 0 0.0% 0.0% 0.0% 0.0%
0 0 0 1 0.0% 0.0% 0.0% 1.1%
0 0 0 6 0.0% 0.0% 0.0% 0.4%
. His 24 0 80 2.4% 0.5% 0.0% 1.8%

ADULT OFFENDERS IN OTHER FACILTIES
1-2 3 .. 5 6 7 INStitUTIoN TOTAL YEAR YEARS rvEARS YEARS ~RS YEARS
County Jail 2,838 194 605 687 707 48 161 100.0% 6.8% 21.3% 24.2% 24.9% 1.7% 5.7%
Halfway House 501 16 42 74 133 9 43 100.0% 3.2% - 8.4% 14.8% 26.5% 1.8% 8.6%
Central Medical 44 2 1 5 7 1 2 100.0% 4.5% 2.3% 11.4% 15.9% 2.3% 4.5%
Total 3383 212 648 766 847 58 206 Other Facilities 100.0% 6.3% 19.2% 22.6% 25.0% 1.7% 6.1%
tdtal Adtiiis 2t.~1 465 .. . c .. :.:'."., .' ·:·c .. ··:···'· .... : ...... ,.. . .', ..
2;3812;969 4il88 , 38'1 1.510 100.0,*, 2.2% 11.~14;()<x.j9;1"'.1.8"" .... 7.4%
YOUTH COMPLEX OFFENDERS
r'tJ~Vi~DED 2% 20 + YRS 2%
11-20 YRS 10%
6-9 YRS 15%
- Thirty-one percent (31,.) of the offenders at Garden State, 30,. of the offenders at Albert C. Wagner and 6,. of the offenders at Mountalnvlew are serving sentences of 10 years or more .•
8-9 !YEARS
88 3.1%
21 4.2%
2 4.5%
111 3.3%
828 3.9'"
- Ninety-three percent (93,.) of the offenders at Mountainvlew, 69,. of the offenders at Albert C. Wagner and 65,.
• Refer to table on page 39.
of the offenders at Garden State are serving sentences of less than 10 years ••
- Twenty-four (24) youth Complex ~"_"''''ft .. o ~'-A 00'-,,;""_ I .fA q~nt"nt'!:"!ll .•
40
10 YEARS
129 4.5%
55 11.0%
5 11.4%
189 5.S%
1.983 9.3%
11-14 15 16-20 20+ YEARS iYEARS YEARS YEAA$ LIFE
45 48 Zl 17 4 1.6% 1.7% 1.0% 0.6% 0.1%
22 24 30 15 16 4.4% 4.8% 6.0% . 3.0% 3.2%
2 4 7 5 1 4.5% 9.1% 15.9% 11.4% 2.3%
69 76 64 37 21 2.0% 2.2% 1.9% 1.1% 0.6%
'1·391 .. > •. :;".:.
196 1;317 1.854 sS7, 3.1% 6.2"'- 6.5" ~:1% 4J)%
ADULTS IN OTHER FACILITIES
NOT CAPitAl. CObED
0 78 0.0% 2.7%
0 1 0.0% 0.2%
0 0 0.0% 0.0%'
0 79 0.0% 2.3%
4- 261 0.0% 1.2%
NOT CODED 2% LIFE 1%
20 + YRS 1%
11-20 YRS 6%
- Only 25% of all adult offenders in ·Other Facilities· are serving sentences In excess of 5 years. This compares to 64,. In the Prison Complex . These figures a~e conslstsnt with the generally less serious offenders housed in County Jails and Halfway Houses.

..
JUVENILE COMPLEX OFFENDERS ON DECEMBER 31, 1992 BY TOTAL MAXIMUM TERM AT ADMISSION
': ' ... .. ·'2 . ,; .. ,4 5~9 1Q + , ·· .•... 1 ~JR~< NOt _ lNSllWriON . TOTAL·· YEAR· YEARS YEARS YEARS YEARS UFE,> CODED
New Jersey Training School
Lloyd McCorkle Trng School/Boys
Lloyd McCorkle Trng School/Girls
Juvenile Medium Security Facility
Total Juvenile
392 93 160 43 20 10 10 3 100.0% 23.7% 40.8% 11.0% 5.1% 2.6% 2.6% 0.8%
7 4 2 0 1 0 0 0 100.0% 57.1% 28.6% 0.0% 14.3% 0.0% 0.0% 0.0%
8 3 4 0 1 0 0 0 100.0% 37.5% 50.0% 0.0% 12.5% 0.0% 0.0% 0.0%
115 18 57 13 12 3 7 0 100.0% 15.7% 49.6% 11.3% 10.4% 2.6% 6.1% 0.0%
522 118 223 t. 56 34 13 17 3 100.0% 22.6% 42.7"'- 10.7" 6.5" 2.5% 3.3% 0.6%
11%
1-2 YRS 65% LI F E 1% 10 .. YRS 3%
5-9 YRS 2%
- Sixty-five percent (65%) of the offenders in the Juvenile Complex are serving sentences of ress than three years.
- Please Note: The New Jersey Training School for Boys was utilizing 7 adult inmates as para-professionals as of December 31. 1992. Additionally. there is one cottage at the New Jersey Training School which houses up to 36 sentenced adults. This accounts for most of the lengthier terms seen in the table above.
41
i
53 13.5%
0 0.0%
0 0.0%
5 4.3% ....
58 11.1%
OFFENDER CHARACTERISTICS REPORT - 1992
MANDA TORY MINIMUM TERM
FIFTY - FOUR PERCENT (54%) OF ALL ADULT RESIDENTS HOUSED IN THE STATE SYSTEM HAVE SENTENCES WHICH INCLUDE PAROLE INELIGIBILITY TERMS.
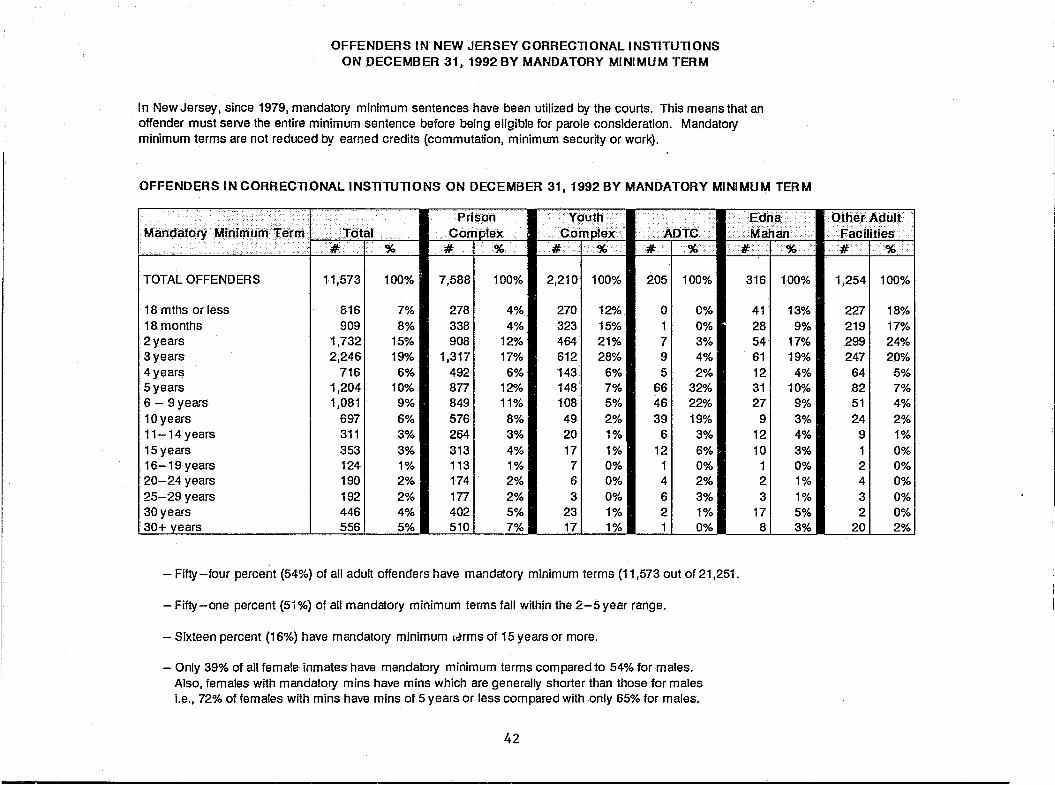
OFFENDERS IN NEW .JERSEY CORRECTIONAL INSTITUTIONS ON DECEMBER 31, 1992 BY MANDATORY MINIMUM TERM
In New Jersey, since 1979, mandatory minimum sentences have been utilized by the courts. This means that an offender must serve the entire minimum sentence before being eligible for parole consideration. Mandatory minimum terms are not reduced by earned credits (commutation, minimum security or work).
OFFENDERS IN CORRECTIONAL INSTITUTIONS ON DECEMBER 31, 1992 BY MANDATORY MINIMUM TERM
........................ .. Prispn ·····Youtli ............... ... :~'!h~'l. Mandatory MiriimiJrilTEirm ...Total COmplex CIPh< om ex .'.~AOTC ..... :.. .. .'.
II. % #: % # '<'X,". It "%. ... # ... % . . ...... " ....
TOTAL OFFENDERS 11,573 100% 7,588 100% 2,210 100% 205 100% 316 100%
18 mths or less 816 7% 278 4% 270 12"10 0 0% 41 13% 18 months 909 8% 338 4% 323 15% 1 0% 28 9% 2 years 1,732 15% 908 12% 464 21% 7 3% 54 17% 3 years 2,246 19% 1,317 17% 612 28% 9 4% 61 19% 4 years 716 6% 492 6% 143 6% 5 2% 12 4% 5 years 1,204 10% 877 12"10 148 7% 66 32% 31 10% 6 - 9 years 1,081 9% 849 11% 108 5% 46 22% 27 9% 10years 697 6% 576 8% 49 2% 39 19% 9 3% 11-14years 311 3% 264 3% 20 1% 6 3% 12 4% 15 years 353 3% 313 4% 17 1% 12 6% 10 3% 16-19 years 124 1% 113 1% 7 0% 1 0% 1 0% 20-24 years 190 2% 174 2% 6 0% 4 2% 2 1% 25-29 years 192 2% 177 2% 3 0% 6 3% 3 1% 30 years 446 4% 402 5% 23 1% 2 1% 17 5% 30+ years
-- --55~
----5% 510 7% 17 1% 1 0% 8 3%
-------_ ..
- Fifty-four percent (54%) of all adult offenders have mandatory minimum terms (11,573 out of 21,251.
- Fifty-one percent (51 %) of all mandatory minimum terms fall within the 2-5 year range.
- Sixteen percent (16%) have mandatory minimum Idrms of 15 years or more.
- Only 39% of all female inmates have mandatory minimum terms compared to 54% for males. Also, females with mandatory mins have mins which are generally shorter than those for males Le., 72% of females with mins have mins of 5 years or less compared with only 65% for males.
42
1·.()~~b;l~i~~lfl 11/· .% •.•• !
1,254 100% I
227 18% 219 17% 299 24% 247 20%
64 5% 82 7% 51 4% 24 2%
9 1% 1 0% 2 0% 4 0% 3 0% 2 0%
20 2%
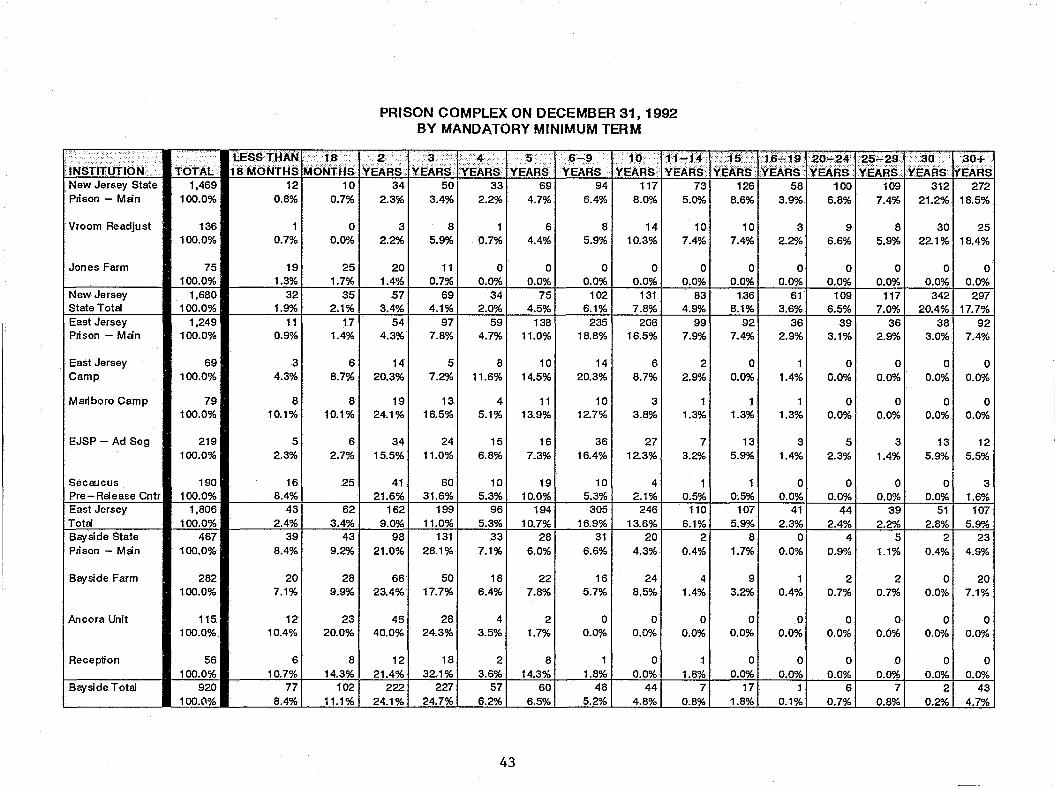
:,' ... ... LESSn-:lAN t.46~~~S 'INSifrUTION.····· TOTAL 18 MONTHs New Jersey State 1,469 12 10 Prison - Man 100.0% 0.8% 0.7%
Vroom Readjust 136 1 0 100.0% 0.7% 0.0%
Jones Farm 75 19 25 100.0% 1.3% 1.7%
New Jersey 1,680 32 35 State Total 100.0% 1.9% 2.1% East Jersey 1,249 11 17 Prison - Man 100.0% 0.9% 1.4%
East Jersey 69 3 6 Camp 100.0% 4.3% 8.7%
Marlboro Camp 79 8 8 100.0% 10.1% 10.1%
EJSP - Ad Seg 219 5 6 100.0% 2.3% 2.7%
Secaucus 190 16 25 Pre-Release Cntr 100.0% 8.4% East Jersey 1,806 43 62 Total 100.0% 2.4% 3.4% Bayside State 467 39 43 Prison - Man 100.0% 8.4% 9.2%
Bayside Farm 282 20 28 100.0% 7.1% 9.9%
Ancora Unit 115 12 23 100.0% 10.4% 20.0%
Reception 56 6 8 100.0% 10.7% 14.3%
Bayside Total 920 77 102 100.0% 8.4% 11.1%
PRISON COMPLEX ON DECEMBER 31, 1992 BY MANDATORY MINIMUM TERM
•· .. 2··· •. ·, 3· . .:···,:.'.,4:.·, ·5 ()~9 ..·lq ·j1·~t .. · YEARS·. YEARS YEARS. YEARS YEARS· YEARS· YEARS
34 50 33 69 94 117 73 2.3% 3.4% 2.2% 4.7% 6.4% 8.0% 5.0%
3 8 1 6 8 14 10 2.2% 5.9% 0.7% 4.4% 5.9% 10.3% 7.4%
20 11 0 0 0 0 0 1.4% 0.7% 0.0% 0.0% 0.0% 0.0% 0.0%
57 69 34 75 102 131 83 3.4% 4.1% 2.0% 4.5% 6.1% 7.8% 4.9%
54 97 59 138 235 206 99 4.3% 7.8% 4.7% 11.0% 18.8% 16.5% 7.9%
14 5 8 10 14 6 2 20.3% 7.2% 11.6% 14.5% 20.3% 8.7% 2.9%
19 13 4 11 10 3 1 24.1% 16.5% 5.1% 13.9% 12.7% 3.8% 1.3%
34 24 15 16 36 27 7 15.5% 11.0% 6.8% 7.3% 16.4% 12.3% 3.2%
41 60 10 19 10 4 1 21.6% 31.6% 5.3% 10.0% 5.3% 2.1% 0.5%
162 199 96 194 305 246 110 9.0% 11.0% 5.3% 10.7% 16.9% 13.6% 6.1%
98 131 33 28 31 20 2 21.0% 28.1% 7.1% 6.0% 6.6% 4.3% 0.4%
66 50 18 22 16 24 4 23.4% 17.7% 6.4% 7.8% 5.7% 8.5% 1.4%
46 28 4 2 0 0 0 40.0% 24.3% 3.5% 1.7% 0.0% 0.0% 0.0%
12 18 2 8 1 0 1 21.4% 32.1% 3.6% 14.3% 1.8% 0.0% 1.8%
222 227 57 60 48 44 7 24.1% 24.7% 6.2% 6.5% 5.2% 4.8% 0.8%
43
~~k~~·: 1.6'+19 202 24- 25;29 . so. i·: .. '30+ YEARs YEARS YEARS YEARs· tiEARs
126 58 100 109 312 272 8.6% 3.9% 6.8% 7.4% 21.2% 18.5%
10 3 9 8 30 25 7.4% 2.2% 6.6% 5.9% 22.1% 18.4%
0 0 0 0 0 0 0.0% 0.0% 0.0% 0.0% 0.0% 0.0%
136 61 109 117 342 297 8.1% 3.6% 6.5% 7.0% 20.4% 17.7%
92 36 39 36 38 92 7.4% 2.9% 3.1% 2.9% 3.0% 7.4%
0 1 0 0 0 0 0.0% 1.4% 0.0% 0.0% 0.0% 0.0%
1 1 0 0 0 0 1.3% 1.3% 0.0% 0.0% 0.0% 0.0010
13 3 5 3 13 12 5.9% 1.4% 2.3% 1.4% 5.9% 5.5%
1 0 0 0 0 3 0.5% 0.0% 0.0% 0.0% 0.0% 1.6%
107 41 44 39 51 107 5.9% 2.3% 2.4% 2.2% 2.8% 5.9%
8 0 4 5 2 23 1.7% 0.0% 0.9% 1.1% 0.4% 4.9%
9 1 2 2 0 20 3.2% 0.4% 0.7% 0.7% 0.0% 7.1%
0 0 0 0 0 0 0.0% 0.0% 0.0% 0.0% 0.0% 0.0%
0 0 0 0 0 0 0.0% 0.0% 0.0% 0.0% 0.0% 0.0%
17 1 6 7 2 43 1.8% 0.1% 0.7% 0.8% 0.2% 4.7%
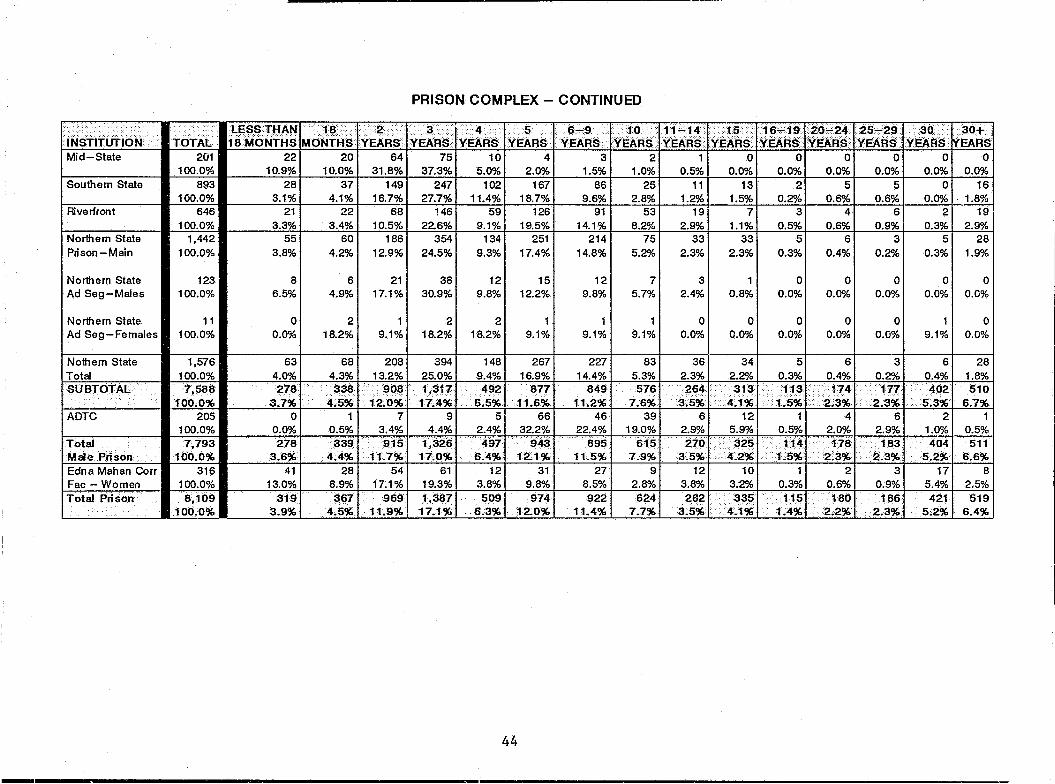
.• INSTITUTION Mid-State
Southern State
Riverfront
Northern State Prison-Main
TOTAL 201
100.0% 893
100.0% 646
100.0% 1,442
100.0%
Northern State I 123 Ad Seg-Males 100.0%
Northern State I 11 Ad Seg-Females 100.0%
Nothern State Total SUBT6'fAL
ADTC
Total M ti e Pri son Edna Mahan Corr Fac - Women Total Pri son
1,576 100.0% 7,588
100.0% 205
100.0% 7,793
100.0% 316
100.0% 8,109
100.0%
PRISON COMPLEX - CONTINUED
lESS THAN I •.. ···.·.fti · .• ··I·i~f •• ·····.······I· ... 3<'r.' 4 .•.•.•....•• 1.... 5 ..•.•. ·1···· .6":9-]> ,} 0·· ' .. ,lli~11I't5116R19r2()+?4T25,;29r~~tr. ··.,30+ 18 MONTHS MON'fHSYEARS YEARs. YEARS, YEARS . YEARS IVEARSYEARS YEARS S>:EARSYEARslvEARsJYEJ\Rs!YEARs
22 10.9%
28 3.1%
21 3.3%
55 3.8%
8 6.5%
a 0.0%
63 4.0% 278
3.7% a
0.0% 278
3.6%. 41
13.0% 319
3.9%
20 10.0%
37 4.1%
22 3.4%
60 4.2%
64 31.8%
149 16.7%
68 10.5%
186 12.9%
75 37.3%
247 27.7%
146 22.6%
354 24.5%
10 5.0%
102 11.4%
59 9.1%
134 9.3%
4 2.0%
167 18.7%
126 19.5%
251 17.4%
61 211 38 1 121 15 4.9% 17.1 % 30.9% 9.8% 12.2%
21 1 I 21 2 18.2% 9.1% 18.2% 18.2%1 9.1%
68 4.3% 338
4.5%
0.5% ,'339 4;4%
28 8.9%
208 13.2% 90~
12.0% 7
3.4% 915
11.7% 54
17.1%
3671 969 4.5~ 11.9%
394 25.0% 1;3fT t1A%
9 4.4%
1,326 17.0%
61 19.3% 1,387
17.1%
1481 267 9.4% 16.9%
6:1~1 j1~~ 51 66
2.4% 32.2%
497., 943 6.4% 12.1%
121 31 3.8% 9.8% 5091'" '974
6.3% 12.0%
44
3 1.5%
86 9.6%
91 14.1%
214 14.8%
12 9.8%
9.1%
227 14.4%
849 11.2%
46 22.4%
895 11.5%
27 8.5% 922
11.4%
2 1.0%
25 2.8%
53 8.2"A>
75 5.2%
7 5.7%
9.1%
83 5.3% 576
7.6% 39
19.0% 615
7.9% 9
2.8% 624
7.7%
0.5% 11
1.2% 19
2.9% 33
2.3%
3 2.4%
a 0.0%
36
a 0.0%
13 1.5%
7 1.1%
33 2.3%
0.8%
o 0.0%
34
a 0.0%
2 0.2%
3 0.5%
5 0.3%
a 0.0%
a 0.0%
5
a 0.0%
5 0.6%
4 0.6%
6 0.4%
a 0.0%
o 0.0%
6
a 0.0%
5 0.6%
6 0.9%
3 0.2%
o 0.0%
o 0.0%
3 2.3% I 2.2"A> I 0.3% I 0.4% I 0.2%
3~lJJ '4~11:J ••• l]5~r ·~g~r ,2~~.· 61 121 11 41 6
2.9% 5.9% 0.5% 2.0% 2.9%
2701· 325 1' .1141 1781" 183 3.5%4.~L5')(i2.3% ,~.3%
12 3.8% 282
3.5%
10 3.2% 335
. 4.1%
0.3% ',.115 104%
2 0.6% 180
2.2%
3 0.9% 186
2.3%,
01 a 0.0% 0.0%
01 16 O.O"A> 1.8%
21 19 0.3% 2.9%
51 28 0.3% 1.9%
01 a 0.0% 0.0%
a 9.1%1 0.0%
61 28 0.4% 1.8% 4021 510
5.3% 6.7%
1.0:.1 0.5%
4041 511 5.2% 6.6%
171 8 5.4% 2.5%
421 I 519 5~2% 6A%
........................................................................ --............ ----~----.. -------------------------------------------------------------------------------------------------
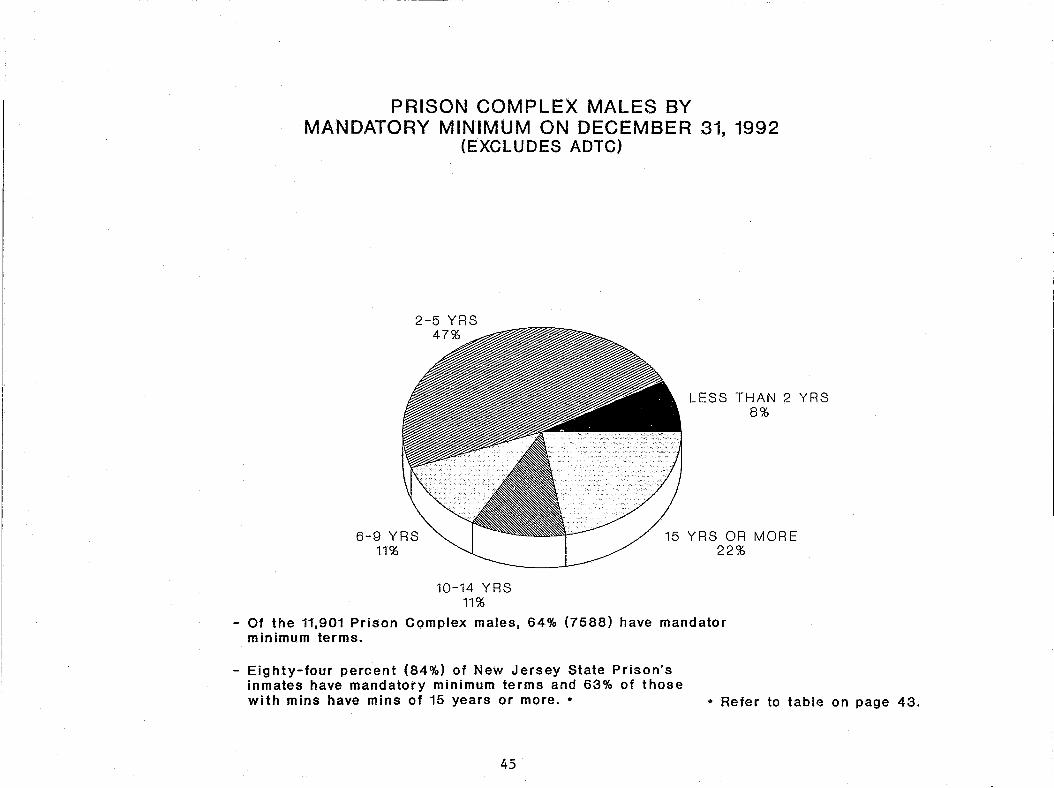
PRISON COMPLEX MALES BY MANDATORY MINIMUM ON DECEMBER 31, 1992
(EXCLU DES ADTC)
10-14 YRS 11%
LESS THAN 2 YRS 8%
15 YRS OR MORE 22%
- Of the 11,901 Prison Complex males, 64% (7588) have mandator minimum terms.
- Eig hty-four percent (84%) of New Jersey State Prison's inmates have mandatory minimum terms and 63% of those with mins have mins of 15 years or more. .. + Refer to table on page 43.
45

BY MANDATORY MINIMUM TERMS ON DECEMBER 31, 1992
ADTC
2-5 YRS 43%
EDNA MAHAN CORRECTIONAL FACILITY FOR WOMEN
LESS THAN 2 YRS 2
2-5 YRS 50%
6-9 YRS 23% 15 YRS OR MORE 13% 15 YRS OR MORE 1
10-14 YRS 22%
- ADTC's population includes 31% with mandatory minimum terms.
Of those with mandatory minimums 42% have mins of 5 years or less.
- Only 13% have mins of 15 years or longer.
46
10-14 YRS 7% 6-9 YRS 9%
- At Edna Mahan, 39% of the females housed have mandatory minimum terms.
- Seventy one percent (71%) of the females with mins have mins of 5 years or less.
- Only 13% have mins of 15 years or longer.
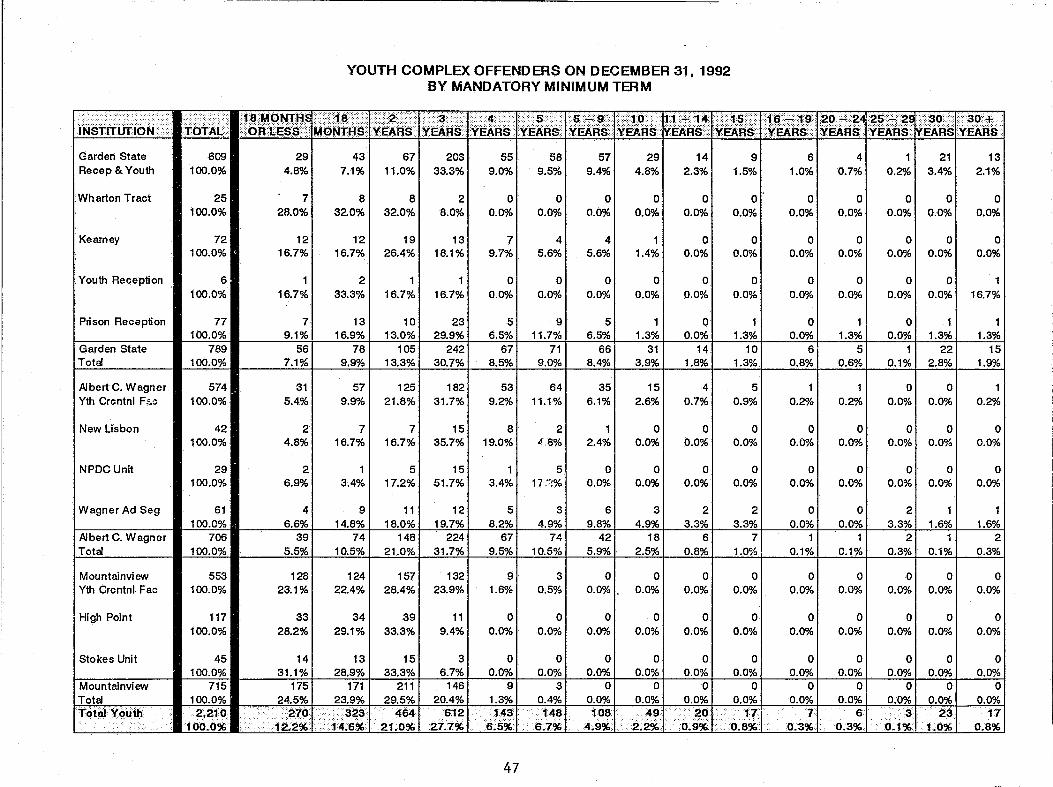
-~- ----~-~-------------------------------------------------------------
.i~si~lit,6~ •••• ··~·.-. Garden State Recep & Youth
Wharton Tract
Kearney
Youth Reception
Prison Reception
Garden State Total
Albert C. Wagner Yth Crcntnl F~c
New Lisbon
NPDC Unit
Wagner Ad Seg
Albert C. Wagner Total
Mountainview Yth Crcntnl Fac
High Point
Stokes Unit
Mountainview Total TotalY ()tJth
609 100.0%
25 100.0%
72 100.0%
6 100.0%
77 100.0%
789 100.0%
574 100.0%
42 100.0%
29 100.0%
61 100.0%
706 100.0%
553 100.0%
117 100.0%
45 100.0%
715 100.0% 2,2.jO
100.0%
YOUTH COMPLEX OFFENDERS ON DECEMBER 31, 1992 BY MANDATORY MINIMUM TERM
29 4.8%
7 28.0%
12 16.7%
16.7%
7 9.1%
56 7.1%
31 5.4%
2 4.8%
2 6.9%
4 6.6%
39 5.5%
128 23.1%
33 28.2%
14 31.1%
175
43 7.1%
8 32.0%
12 16.7%
2 33.3%
13 16.9%
78 9.9%
57 9.9%
7 16.7%
3.4%
9 14.8%
74 10.5%
124 22.4%
34 29.1%
671 203 11.0% 33.3%
81 2 32.0% 8.0%
191 13 26.4% 18.1%
1 16.7% I 16.7%
101 23 13.0% 29.9%
1051 242 13.3% 30.7%
1251 182 21.8% 31.7%
71 15 16.7% 35.7%
51 15 17.2% 51.7%
11 I 12 18.0% 19.7%
1481 224 21.0% 31.7%
1571 132 28.4% 23.9%
391 11 33.3% 9.4%
131 15 28.9% 33.3%
3 6.7%
1711 211 24.5% 1 23.9% 1 29.5%
146 20.4%
<270 .-_ •..•... 323 464 .. I· - -, -12;2%.-h~6%· 2U)~
612 27.1%
55 9.0%
o 0.0%
7 9.7%
o 0.0%
5 6.5%
67 8.5%
53 9.2%
8 19.0%
3.4%
5 8.2%
67 9.5%
9 1.6%
o 0.0%
58 9.5%
o 0.0%
4 5.6%
o 0.0%
9 11.7%
71 9.0%
64 11.1%
2 48%
5 17 .:!%
3 4.9%
74 10.5%
3 0.5%
o 0.0%
01 0 0.0% 0.0%
91 3 1.3% 0.4% 1431. 148
6.5% -6.7%
47
571 29 9.4% 4.8%
01 0 0.0% 0.0%
41 1 5.6% 1.4%
01 0 0.0% 0.0%
51 1 6.5% 1.3%
661 31 8.4% 3.9%
351 15 6.1% 2.6%
110
2.4% 0.0%
01 0 0.0% 0.0%
61 3 9.8% 4.9%
421 18 5.9% 2.5%
01 0 0.0%. 0.0%
01 0 0.0% 0.0%
o 0.0%
o 0.0% "108
4.9%
o 0.0%
o 0.0%
49 2.2%
14 2.3%
o 0.0%
o 0.0%
o 0.0%
o 0.0%
14 1.8%
4 0.7%
o 0.0%
o 0.0%
2 3.3%
6 0.8%
o 0.0%
o 0.0%
9 1.5%
o 0.0%
o 0.0%
o 0.0%
1.3% 10
1.3%
5 0.9%
o 0.0%
o 0.0%
2 3.3%
7 1.0%
o 0.0%
o 0.0%
01 0 0.0% 0.0%
01 0 0.0% 0.0%
o.~I.o.~l
6 1.0%
o 0.0%
o 0.0%
o 0.0%
o 0.0%
6 0.8%
0.2",.{.
o 0.0%
o 0.0%
o 0.0%
0.1%
o 0.0%
o 0.0%
o 0.0%
o 0.0%
7 0.3%
4 0.7%
o 0.0%
o 0.0%
o 0.0%
1.3% 5
0.6%
0.2%
o 0.0%
o 0.0%
o 0.0%
0.1%
o 0.0%
o 0.0%
o 0.0%
o 0.0%
6 0.3%
21 0.2%1 3.4%
01 0 0.0% 0.0%
01 0 0.0% 0.0%
01 0 0.0% 0.0%
01 1 0.0% 1.3%
11 22 0.1% 2.8%
01 0 0.0% 0.0%
01 0 0.0% 0.0%
01 0 0.0% 0.0%
2 3.3% I 1.6%
0.3~1 0.1%
01 0 0.0% 0.0%
01 0 0.0% 0.0%
01 0 0.0% 0.0%
01 0 0.0% 0.0%
(L1~11~:~
13 2.1%
o 0.0%
o 0.0%
16.7%
1.3% 15
1.9%
1 0.2%
o 0.0%
o 0.0%
1.6% 2
0.3%
o 0.0%
o 0.0%
o 0.0%
o 0.0%
17 0.8%
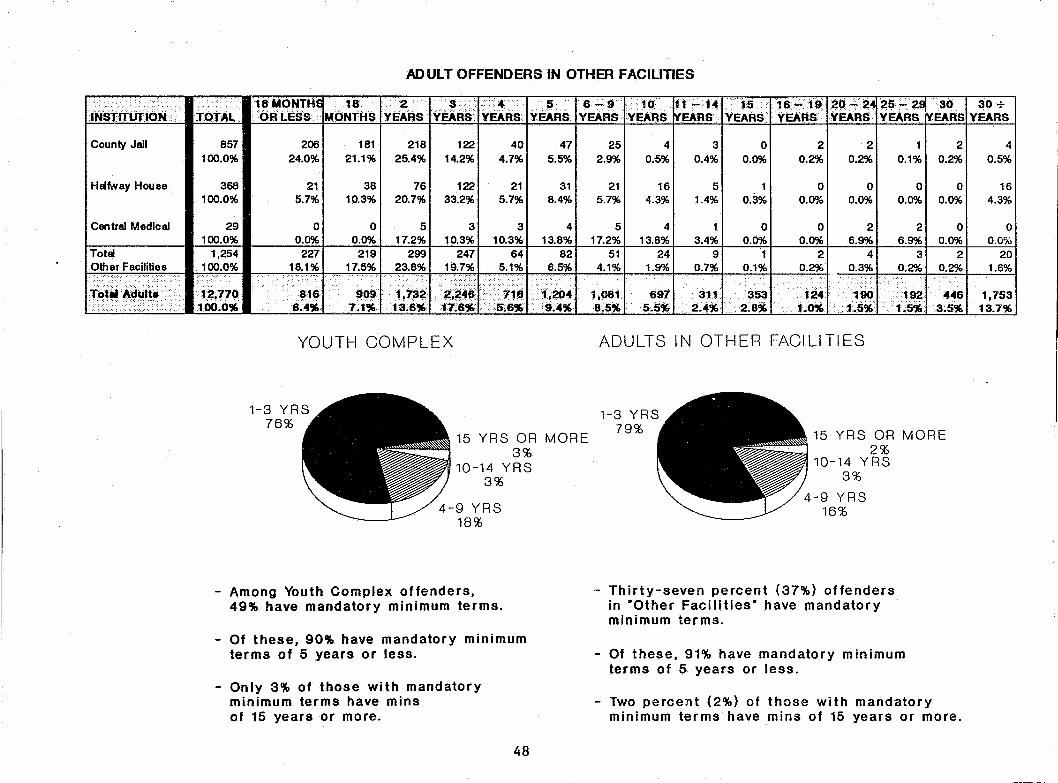
.:.:--.. ': . .. ,
.IN~TrrtiiION
County Jall
Helmay Hou8e
Central Medical
Total Other Facilitio8
TOTAL
857 100.0%
368 100.0%
29 100.0%
1,254 100.0%
~-l
ADULT OFFENDERS IN OTHER FACILITIES
1~"'QtfTH~ ·•· .. 18 . f2 ····I· .. ··~·.· •. ·.l>4.. ·?5 ':'200 .1 30 + OR LESS ; MONTHS IYEARSYEARS YEARS; yEARS !yEARS YEARS
206 24.0%
1811 2181 1221 40 1 471 25 21.1% 25.4% 14.2% 4.7% 5.5% 2.9%
21 5.7%
381 761 1221 211 31 1 21 10.3% 20.7% 33.2% 5.7% 8.4% 5.7%
01 0 0.0% 0.0%
2271 219 18.1% 17.5%
51 31 31 4 17.2% 10.3% 10.3% 13.8%
2991 2471 64 1 82 23.8% 19.7% 5.1% 6.5%
5 17.2%
51 4.1%
41 31 0 0.5% 0.4% 0.0%
161 51 1 4.3% 1.4% 0.3%
4 13.8%
24 1.9%
o 3.4% I 0.0%
91 1 0.7% 0.1%
2 0.2%
o 0.0%
o 0.0%
2 0.2%
2 0.2%
o 0.0%
2 6.9%
4 0.3%
11 21 4 0.1% 0.2% 0.5%
01 01 16 0.0% 0.0% 4.3%
21 0 6.9% 0.0%
31 2 0.2% 0.2%
o 0.0%
20 1.6%
To.j'A~~lt~ tI1~r:: l::1 -/1': l~~:~1127~~J:~r:I·~~: 1.081. 8.5%
691 5.5"
I
3111 ~53 2.4')(,· . 2.8~ 1!~11~~11}5~1 3~~ 1,753
13.7%
YOUTH COMPLEX
15 YRS OR MORE 3%
10-14 YRS 3%
4-9 YRS 18%
- Among Youth Complex offenders, 49% have mandatory minimum terms.
Of these, 90% have mandatory minimum terms of 5 years or less.
- Only 3% of those with mandatory minimum terms have mins of 15 years or more.
48
ADULTS IN OTHER FACILITIES
o
0% 15 YRS OR MORE
2% ~110-14 YRS
3%
4-9 YRS 16%
- Thirty-seven percent (37%) offenders in ·Other Facilities· have mandatory minimum terms.
Of these, 91% have mandatory minimum terms of 5 years or less.
- Two percent (2%) of those with mandatory minimum terms have mins of 15 years or more.