LNCS 8149 - Attenuation Correction Synthesis for Hybrid ...Attenuation Correction Synthesis for...
8
Attenuation Correction Synthesis for Hybrid PET-MR Scanners Ninon Burgos 1 , Manuel Jorge Cardoso 1,2 , Marc Modat 1, 2 , Stefano Pedemonte 1 , John Dickson 3 , Anna Barnes 3 , John S. Duncan 4 , David Atkinson 5 , Simon R. Arridge 1 , Brian F. Hutton 3,6 , and Sebastien Ourselin 1,2 1 Centre for Medical Image Computing, University College London, London, UK 2 Dementia Research Centre, University College London, London, UK 3 Institute of Nuclear Medicine, University College London, London, UK 4 Department of Clinical and Experimental Epilepsy, UCL IoN, London, UK 5 Centre for Medical Imaging, University College London, London, UK 6 Centre for Medical Radiation Physics, University of Wollongong, NSW, Australia Abstract. The combination of functional and anatomical imaging tech- nologies such as Positron Emission Tomography (PET) and Computed Tomography (CT) has shown its value in the preclinical and clinical fields. In PET/CT hybrid acquisition systems, CT-derived attenuation maps enable a more accurate PET reconstruction. However, CT pro- vides only very limited soft-tissue contrast and exposes the patient to an additional radiation dose. In comparison, Magnetic Resonance Imag- ing (MRI) provides good soft-tissue contrast and the ability to study functional activation and tissue microstructures, but does not directly provide patient-specific electron density maps for PET reconstruction. The aim of the proposed work is to improve PET/MR reconstruction by generating synthetic CTs and attenuation-maps. The synthetic images are generated through a multi-atlas information propagation scheme, locally matching the MRI-derived patient’s morphology to a database of pre-acquired MRI/CT pairs. Results show improvements in CT synthesis and PET reconstruction accuracy when compared to a segmentation method using an Ultrashort-Echo-Time MRI sequence. 1 Introduction Positron Emission Tomography/Magnetic Resonance Imaging (PET/MRI) scan- ners are expected to offer a new range of applications in neuro-oncology, neurode- generative diseases, such as Alzheimer’s disease, and epilepsy [1]. To accurately quantify the radionuclide uptake, PET data need to be corrected for photon attenuation. The attenuation information is usually obtained from a transmis- sion scan in standalone PET or derived from a Computed Tomography (CT) image in combined PET/CT. As MRI intensities do not reflect the electron den- sities, alternative methods must be developed for PET/MRI acquisitions. These methods can be classified in three categories: segmentation, atlas, and emission- based approaches. In segmentation-based methods, uniform linear attenuation coefficients are assigned to tissue classes obtained by segmenting an MRI image. K. Mori et al. (Eds.): MICCAI 2013, Part I, LNCS 8149, pp. 147–154, 2013. c Springer-Verlag Berlin Heidelberg 2013
Transcript of LNCS 8149 - Attenuation Correction Synthesis for Hybrid ...Attenuation Correction Synthesis for...

Attenuation Correction Synthesisfor Hybrid PET-MR Scanners
Ninon Burgos1, Manuel Jorge Cardoso1,2, Marc Modat1,2, Stefano Pedemonte1,John Dickson3, Anna Barnes3, John S. Duncan4, David Atkinson5,Simon R. Arridge1, Brian F. Hutton3,6, and Sebastien Ourselin1,2
1 Centre for Medical Image Computing, University College London, London, UK2 Dementia Research Centre, University College London, London, UK
3 Institute of Nuclear Medicine, University College London, London, UK4 Department of Clinical and Experimental Epilepsy, UCL IoN, London, UK
5 Centre for Medical Imaging, University College London, London, UK6 Centre for Medical Radiation Physics, University of Wollongong, NSW, Australia
Abstract. The combination of functional and anatomical imaging tech-nologies such as Positron Emission Tomography (PET) and ComputedTomography (CT) has shown its value in the preclinical and clinicalfields. In PET/CT hybrid acquisition systems, CT-derived attenuationmaps enable a more accurate PET reconstruction. However, CT pro-vides only very limited soft-tissue contrast and exposes the patient toan additional radiation dose. In comparison, Magnetic Resonance Imag-ing (MRI) provides good soft-tissue contrast and the ability to studyfunctional activation and tissue microstructures, but does not directlyprovide patient-specific electron density maps for PET reconstruction.
The aim of the proposed work is to improve PET/MR reconstructionby generating synthetic CTs and attenuation-maps. The synthetic imagesare generated through a multi-atlas information propagation scheme,locally matching the MRI-derived patient’s morphology to a database ofpre-acquired MRI/CT pairs. Results show improvements in CT synthesisand PET reconstruction accuracy when compared to a segmentationmethod using an Ultrashort-Echo-Time MRI sequence.
1 Introduction
Positron Emission Tomography/Magnetic Resonance Imaging (PET/MRI) scan-ners are expected to offer a new range of applications in neuro-oncology, neurode-generative diseases, such as Alzheimer’s disease, and epilepsy [1]. To accuratelyquantify the radionuclide uptake, PET data need to be corrected for photonattenuation. The attenuation information is usually obtained from a transmis-sion scan in standalone PET or derived from a Computed Tomography (CT)image in combined PET/CT. As MRI intensities do not reflect the electron den-sities, alternative methods must be developed for PET/MRI acquisitions. Thesemethods can be classified in three categories: segmentation, atlas, and emission-based approaches. In segmentation-based methods, uniform linear attenuationcoefficients are assigned to tissue classes obtained by segmenting an MRI image.
K. Mori et al. (Eds.): MICCAI 2013, Part I, LNCS 8149, pp. 147–154, 2013.c© Springer-Verlag Berlin Heidelberg 2013

148 N. Burgos et al.
In atlas-based methods, an anatomical model or dataset is deformed to matchthe patient’s anatomy in order to apply the attenuation map from the model tothe patient data. The third class of methods exploits PET emission data froma time-of-flight PET system and anatomical information from MR images tocompute the attenuation maps.
In the method from Martinez-Möller et al. [2], the body is segmented intofour classes: background, lungs, fat and soft-tissues. While the results obtained inwhole-body studies are satisfactory, the lack of bone information has a significantimpact on the quantification of the radionuclide uptake in brain studies [3].Keereman et al. [4] used Ultrashort-Echo-Time (UTE) sequences to distinguishcortical bone, air and soft tissue. Berker et al. [5] developed a 4-class tissuesegmentation technique applied to brain studies. Cortical bone, air, fat and soft-tissues are segmented using a combined UTE/Dixon MRI sequence. Although theoverall voxel classification accuracy reached is superior to the accuracy obtainedwithout Dixon or UTE components, the bone segmentation is still inaccuratein complex regions such as nasal sinuses [5]. Johansson et al. [6] described aGaussian mixture regression model that links the MRI intensity values to the CTHounsfield units (HU). Schreibmann et al. [7] developed a multimodality opticalflow deformable model that maps patient MRI images to a CT atlas. In theHofmann et al. method [8], local information derived from a pattern recognitiontechnique and global information obtained by an atlas registration are combinedto predict a pseudo-CT image from a given MR image. All these methods assumea one-to-one correspondence between MRI and CT intensities. However, severalmaterials such as cerebrospinal fluid, air and bone have similar intensities in aT1-weighted MRI image but distinct values in a CT image. Considering localinformation may enhance the results, but inaccuracies still remain at boundariessuch as air and bone in the nasal sinuses.
The proposed method follows the principle of multi-atlas information propa-gation in order to synthesize an attenuation correction map from an MRI image.As an alternative to a one-to-one mapping from the observed MRI intensitiesto CT-like intensities, one can exploit the concept of morphological similaritybetween subjects. When used in the context of segmentation propagation [9],a set of segmented anatomical atlases from several subjects are mapped to atarget subject and subsequently fused according to the morphological similar-ity between the mapped and the target anatomical images. This morphologicalsimilarity, normally interpreted as an image similarity measure, is used to en-force the fact that the most morphologically similar atlases should carry moreweight during the fusion process [10]. This work will exploit the same idea inthe context of intensity propagation and fusion. The developed algorithm makesuse of a pre-acquired set of aligned MRI/CT image pairs from multiple subjectsto propagate in a voxel wise fashion the CT intensities corresponding to similarMRIs. The proposed approach relies on the concept of morphological similarityrather than the assumption of one-to-one intensity mapping between the MRIand the CT. This enables the synthesization of a patient-specific pseudo CTimage, from which the attenuation map is then generated.

Attenuation Correction Synthesis for Hybrid PET-MR Scanners 149
2 Method
In PET/CT imaging, the main technique to correct for attenuation is to derivethe attenuation coefficients from a CT image. In the case of a hybrid PET/MRscanner, the only anatomical and structural information available is an MRimage. A diagram illustrating the proposed method in which a synthetic CT isobtained from a given MRI is shown in Figure 1.
2.1 MR-CT Database Preprocessing and Inter-subject Mapping
The database consists of pairs of T1-weighted MRI and CT brain images. Foreach subject, the MRI is affinely aligned to the CT using a symmetric approachbased on Ourselin et al. [11]. Even though this is an intra-subject alignment, afull affine registration is used to compensate for possible gradient distortions inthe MRI scans.
In order to synthesise the CT for a given MRI, one first needs to register allthe MRIs in the atlas database to the target MRI. This inter-subject coordinatemapping is obtained using a symmetric global registration followed by a cubicB-spline parametrisation non-rigid registration, using normalised mutual infor-mation as a measure of similarity [12]. All the CTs in the atlas database are thenmapped to the target subject using the transformation that maps the subject’scorresponding MRI in the atlas database to the target MRI. Through this regis-tration and resampling procedure, one obtains a series of MRI/CT pairs alignedto the MRI of the target subject.
2.2 CT Synthesis
The proposed framework uses a local image similarity measure between thetarget MRI and the set of registered MRIs as a metric of the underlying
W1
W2
Wn
Affine alignment Resampling Intensity fusion
LNCC1
LNCC2
LNCCn
Inter-subject mapping
.........
Fig. 1. CT synthesis diagram for a given MRI image. All the MRIs in the atlas set areregistered to the target MRI. The CTs in the atlas set are then mapped using the sametransformation to the target MRI. A similarity measure (LNCC) between the mappedand target MRIs is converted to weights (W) to reconstruct the target CT.
150 N. Burgos et al.
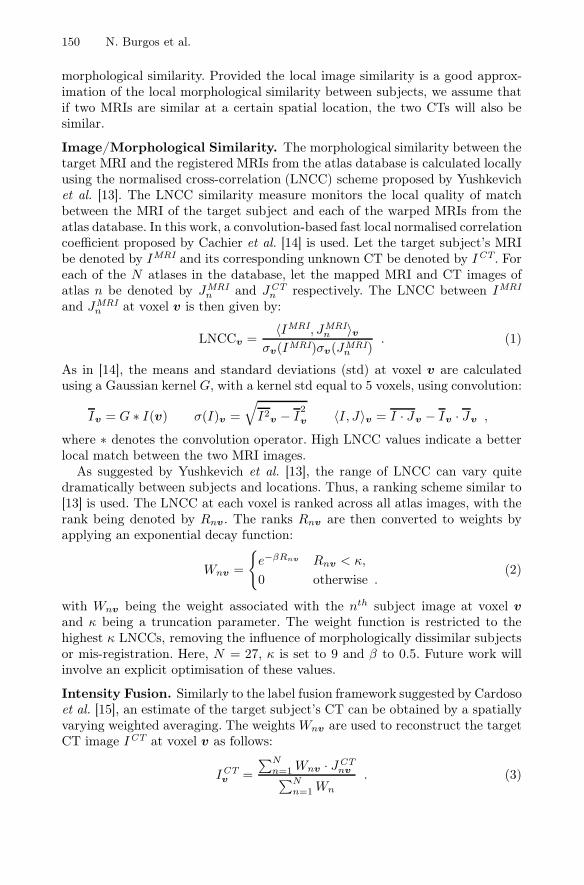
morphological similarity. Provided the local image similarity is a good approx-imation of the local morphological similarity between subjects, we assume thatif two MRIs are similar at a certain spatial location, the two CTs will also besimilar.
Image/Morphological Similarity. The morphological similarity between thetarget MRI and the registered MRIs from the atlas database is calculated locallyusing the normalised cross-correlation (LNCC) scheme proposed by Yushkevichet al. [13]. The LNCC similarity measure monitors the local quality of matchbetween the MRI of the target subject and each of the warped MRIs from theatlas database. In this work, a convolution-based fast local normalised correlationcoefficient proposed by Cachier et al. [14] is used. Let the target subject’s MRIbe denoted by IMRI and its corresponding unknown CT be denoted by ICT. Foreach of the N atlases in the database, let the mapped MRI and CT images ofatlas n be denoted by JMRI
n and JCTn respectively. The LNCC between IMRI
and JMRIn at voxel v is then given by:
LNCCv =〈IMRI, JMRI
n 〉vσv(IMRI)σv(JMRI
n ). (1)
As in [14], the means and standard deviations (std) at voxel v are calculatedusing a Gaussian kernel G, with a kernel std equal to 5 voxels, using convolution:
Iv = G ∗ I(v) σ(I)v =
√I2v − I
2
v 〈I, J〉v = I · Jv − Iv · Jv ,
where ∗ denotes the convolution operator. High LNCC values indicate a betterlocal match between the two MRI images.
As suggested by Yushkevich et al. [13], the range of LNCC can vary quitedramatically between subjects and locations. Thus, a ranking scheme similar to[13] is used. The LNCC at each voxel is ranked across all atlas images, with therank being denoted by Rnv . The ranks Rnv are then converted to weights byapplying an exponential decay function:
Wnv =
{e−βRnv Rnv < κ,
0 otherwise .(2)
with Wnv being the weight associated with the nth subject image at voxel vand κ being a truncation parameter. The weight function is restricted to thehighest κ LNCCs, removing the influence of morphologically dissimilar subjectsor mis-registration. Here, N = 27, κ is set to 9 and β to 0.5. Future work willinvolve an explicit optimisation of these values.
Intensity Fusion. Similarly to the label fusion framework suggested by Cardosoet al. [15], an estimate of the target subject’s CT can be obtained by a spatiallyvarying weighted averaging. The weights Wnv are used to reconstruct the targetCT image ICT at voxel v as follows:
ICTv =
∑Nn=1 Wnv · JCT
nv∑Nn=1 Wn
. (3)

Attenuation Correction Synthesis for Hybrid PET-MR Scanners 151
2.3 Attenuation Map
To obtain the attenuation map (μ-map), the synthetic CT image is resampled tothe PET resolution. The resampled CT image is then matched to the PET’s pointspread function (PSF) by filtering it with a 6mm full-width at half-maximumGaussian filter. According to [16], the CT values expressed in HU are convertedto PET attenuation coefficients in cm−1 by a bilinear transformation:
μ =
⎧⎨⎩μwater
(1 + ICT
1000
)ICT ≤ 0 HU
μwater
(1 + ICT
1000ρwater(μbone−μwater)μwater(ρbone−ρwater)
)ICT > 0 HU
(4)
where μwater and μbone represent the attenuation coefficients at the PET 511keV energy for water and bone respectively and ρwater and ρbone represent theattenuation coefficients at the CT energy respectively. These values are set toμwater = 0.096 cm−1, μbone = 0.172 cm−1, ρwater = 0.184 cm−1 and ρbone =0.428 cm−1
3 Validation and Results
Data. All the data used in this work were acquired with two scanners. The T1-weighted MRIs (3.0T; TR/TE, 1800ms/2.73ms; flip angle 9◦; resolution 0.527 ×0.527 × 0.9 mm3) and UTE attenuation maps (resolution 1.562 × 1.562 × 1.562mm3) were acquired on a Siemens Biograph mMR hybrid PET/MR scanner;the CTs (resolution 0.586 × 0.586 × 1.25 mm3), and reconstructed PETs (radio-pharmaceutical: FDG; resolution 1.953 × 1.953 × 3.27 mm3) on a GE DiscoveryST PET/CT scanner.
Validation Scheme. The synthesization performance of the proposed algo-rithm is validated against ground truth data. The quantitative validation con-sists of three steps:
– The pseudo CT (pCT) is compared to the subject’s ground truth CT imageat the original resolution, validating the accuracy of the CT reconstruction.
– The pCT is resampled to the PET’s resolution and convolved with the pointspread function, validating how accurate the CT synthesis is at the resolutionrelevant for PET reconstruction.
– The PET image is reconstructed using the pCT-derived μ-map and com-pared with the ground truth PET reconstructed using the CT-based μ-map,validating the accuracy of the PET attenuation correction.
The dataset consists of T1-weighted MRI, CT and PET brain images from 28subjects. In 17 cases, MRI data are truncated at the front and back of the head.As UTE μ-map images are also available for 4 subjects, synthesization perfor-mance of the proposed algorithm is compared to the UTE-based synthesizationmethod. All quantitative assessments are performed using a leave-one-out cross-validation scheme.

152 N. Burgos et al.
Table 1. Average (std) of the MAR between the ground truth (high-resolution CT,PET-resolution CT and CT-reconstructed PET) and the corresponding synthetic im-ages, using both the proposed method (pCT) and UTE. The common datasets consistof 4 subjects with a non-truncated T1 and a known UTE µ-map, the untruncateddatasets consist of 7 subjects with a non-truncated T1 but no associated UTE µ-mapand the truncated datasets gather 17 subjects with a truncated T1 image. "No AC"corresponds to the residuals without attenuation correction. PETs are quantitativelynormalised using the pons as the reference region.
High-res CT PET-res CT Reconstructed PETpCT UTE pCT UTE No AC pCT UTE
Common data (N=4) 100 (3) 190 (25) 77 (4) 194 (17) 1.66 (0.15) 0.23 (0.05) 0.74 (0.09)Untruncated data (N=7) 102 (10) - 73 (15) - 0.85 (0.64) 0.12 (0.09) -Truncated data (N=17) 108 (10) - 84 (10) - 1.10 (0.51) 0.18 (0.10) -
Pseudo CT Reconstruction Accuracy. Using only the MRI image of thesubject, a pseudo CT image is generated using the proposed method. This gen-erated CT is then compared to the ground truth CT. The metric used for valida-tion is the mean absolute residual, defined as MAR =
∑v |GTCT
v − ICTv |. This
metric is estimated between the ground truth CT (GTCT ) and the pseudo CT(ICT ) for every subject in the database. The same MAR metric is also used toassess the synthesis accuracy after resampling the pCT to the PET resolutionand simulating the PET PSF. When available, the MAR is computed betweenthe UTE μ-map and the ground truth CT at both CT and PET resolutions.The average (std) MAR, measured in Hounsfield units, across all the subjectsin the database and for both experiments is presented in Table 1. The errorobtained with the pCT method is half that of the error obtained with the UTEmethod. The results also emphasize the robustness of the algorithm in the caseof a truncated target MRI. Examples of ground truth CTs and μ-maps, pseudoCTs and pseudo μ-maps and UTE-based μ-maps are presented in Figure 2.
PET Reconstruction Accuracy. Due to the unavailability of the raw PETdata, we make use of the PET reconstruction provided by the PET/CT scan-
T1 CT μ-map pCT pCT μ-map UTE μ-map
Fig. 2. Acquired T1-weighted MRI, CT and µ-map, pseudo CT and µ-map generatedby the proposed method and UTE-based µ-map for two subjects

Attenuation Correction Synthesis for Hybrid PET-MR Scanners 153
μ-map PET pCT μ-map pCT PET UTE μ-map UTE PET
Fig. 3. (From left to right) The ground truth µ-map and PET reconstruction followedby the equivalent images generated using the proposed method and UTE-based meth-ods, for two subjects. All methods are normalised to the same scale.
ner. To reconstruct the PET with the pCT-based μ-map, we follow a projec-tion/reconstruction technique similar to Hofmann et al. [8]. The original PET,the original μ-map and the pCT-based μ-map are projected to obtain sino-grams. The original attenuation correction is removed from the PET and thenon-corrected PET is then corrected using the pCT μ-map. Following the samepipeline, we also reconstruct PET images using the CT μ-map (this PET is con-sidered as the ground truth) and the UTE μ-map. The iterative reconstructionis performed using a GPU accelerated rotation-based projection and backpro-jection algorithm developed by Pedemonte et al. [17]. Results of PET recon-structions using different attenuation maps are displayed in Figure 3. The MARis computed between the ground truth PET and the non-corrected, pCT andUTE-PET. Results are shown in Table 1. The error obtained using the pCTμ-map is three times smaller than the error obtained using the UTE μ-map.
4 ConclusionThis paper presents a simple CT and attenuation map synthesis algorithm basedon a multi-atlas information propagation scheme. While the sharpness of thesynthetic CT images is lower than the ground-truth subject’s CT at the originalresolution, this problem is greatly reduced at the resolution and PSF of thePET image. Overall, the proposed algorithm provides an improvement in PETreconstruction accuracy when compared to the UTE-based correction.
Acknowledgements. This work was supported by an IMPACT studentshipfunded jointly by Siemens and the UCL FES, the EPSRC (EP/K005278/1 andEP/H046410/1) and the CBRC Strategic Investment Award (#168).
References1. Von Schulthess, G.K., Kuhn, F.P., Kaufmann, P., Veit-Haibach, P.: Clinical
positron emission tomography/magnetic resonance imaging applications. Seminarsin Nuclear Medicine 43(1), 3–10 (2013)
154 N. Burgos et al.
2. Martinez-Möller, A., Souvatzoglou, M., Delso, G., Bundschuh, R.A., Chefd’hotel,C., Ziegler, S.I., Navab, N., Schwaiger, M., Nekolla, S.G.: Tissue classification as apotential approach for attenuation correction in whole-body PET/MRI: evaluationwith PET/CT data. Journal of Nuclear Medicine 50(4), 520–526 (2009)
3. Schleyer, P.J., Schaeffter, T., Marsden, P.K.: The effect of inaccurate bone attenua-tion coefficient and segmentation on reconstructed PET images. Nuclear MedicineCommunications 31(8), 708–716 (2010)
4. Keereman, V., Fierens, Y., Broux, T., De Deene, Y., Lonneux, M., Vandenberghe,S.: MRI-based attenuation correction for PET/MRI using ultrashort echo timesequences. Journal of Nuclear Medicine 51(5), 812–818 (2010)
5. Berker, Y., Franke, J., Salomon, A., Palmowski, M., Donker, H.C.W., Temur, Y.,Izquierdo-Garcia, D., Fayad, Z.A., Kiessling, F., Schulz, V.: MRI-based attenuationcorrection for hybrid PET/MRI systems: a 4-class tissue segmentation techniqueusing a combined ultrashort-echo-time/Dixon MRI sequence. JNM 53(5) (2012)
6. Johansson, A., Karlsson, M., Nyholm, T.: CT substitute derived from MRI se-quences with ultrashort echo time. Medical Physics 38(5), 2708 (2011)
7. Schreibmann, E., Nye, J.A., Schuster, D.M., Martin, D.R., Votaw, J., Fox, T.:MR-based attenuation correction for hybrid PET-MR brain imaging systems usingdeformable image registration. Medical Physics 37(5), 2101 (2010)
8. Hofmann, M., Steinke, F., Scheel, V., Charpiat, G., Farquhar, J., Aschoff, P., Brady,M., Schölkopf, B., Pichler, B.J.: MRI-based attenuation correction for PET/MRI:a novel approach combining pattern recognition and atlas registration. Journal ofNuclear Medicine 49(11), 1875–1883 (2008)
9. Heckemann, R.A., Hajnal, J.V., Aljabar, P., Rueckert, D., Hammers, A.: Automaticanatomical brain MRI segmentation combining label propagation and decision fu-sion. NeuroImage 33(1), 115–126 (2006)
10. Sabuncu, M.R., Van Leemput, K., Fischl, B., Golland, P.: A generative model forimage segmentation based on label fusion. TMI 29(10) (2010)
11. Ourselin, S., Roche, A., Subsol, G.: Reconstructing a 3D structure from serialhistological sections. Image and Vision Computing 19(2001), 25–31 (2000)
12. Modat, M., Ridgway, G.R., Taylor, Z.A., Lehmann, M., Barnes, J., Hawkes, D.J.,Fox, N.C., Ourselin, S.: Fast free-form deformation using graphics processing units.Computer Methods and Programs in Biomedicine 98(3), 278–284 (2010)
13. Yushkevich, P.A., Wang, H., Pluta, J., Das, S.R., Craige, C., Avants, B.B., Weiner,M.W., Mueller, S.: Nearly automatic segmentation of hippocampal subfields in invivo focal T2-weighted MRI. NeuroImage 53(4), 1208–1224 (2010)
14. Cachier, P., Bardinet, E., Dormont, D., Pennec, X., Ayache, N.: Iconic featurebased nonrigid registration: the PASHA algorithm. CVIU 89(2-3) (2003)
15. Cardoso, M.J., Wolz, R., Modat, M., Fox, N.C., Rueckert, D., Ourselin, S.: GeodesicInformation Flows. In: Ayache, N., Delingette, H., Golland, P., Mori, K. (eds.)MICCAI 2012, Part II. LNCS, vol. 7511, pp. 262–270. Springer, Heidelberg (2012)
16. Burger, C., Goerres, G., Schoenes, S., Buck, A., Lonn, A.H.R., Von Schulthess,G.K.: PET attenuation coefficients from CT images: experimental evaluation ofthe transformation of CT into PET 511-keV attenuation coefficients. EuropeanJournal of Nuclear Medicine and Molecular Imaging 29(7), 922–927 (2002)
17. Pedemonte, S., Bousse, A., Erlandsson, K., Modat, M., Arridge, S., Hutton, B.F.,Ourselin, S.: GPU accelerated rotation-based emission tomography reconstruction.In: IEEE Nuclear Science Symposuim, pp. 2657–2661 (2010)