LMF8: The distribution of working hours among couple families · LMF2.2: Patterns of employment and...
22
OECD Family Database www.oecd.org/els/family/database.htm OECD - Social Policy Division - Directorate of Employment, Labour and Social Affairs 1 Updated: 16-10-16 LMF2.2: Patterns of employment and the distribution of working hours for couples with children Definitions and methodology This indicator presents information on patterns of employment and the distribution of paid working hours for couples with at least one child (aged 0-to-14). Data on couples’ working patterns are presented using five possible combinations of working arrangements: i. Both partners full-time; ii. One partner full-time, one partner part-time; iii. One partner full-time, one partner not working; iv. Both partners not working; v. Other, which includes any other combination of working arrangement – such as both parents working part-time or one parent working time and one parent not working – and couples where information on either partner’s working hours are missing. And on the distribution of working hours using four possible ‘usual weekly working hour bands’: i. 1-29 hours per week; ii. 30-39 hours per week; iii. 40-44 hours per week; iv. 45 hours per week or more. Definitions of ‘working’ and ‘employed’ follow ILO guidelines, with all people who during a specified reference period were either in paid employment or were self-employed for at least one hour being classified as in ‘employment’. Data on working hours generally refer to usual weekly working hours (which include regular overtime) in the main job – unless individuals report that they do not have usual set hours in their main job, in which case the individual's actual hours worked in their main job during the survey reference week are used instead – and the distinction between part-time and full-time employment generally follows the OECD’s common 30-hour definition, with part-time employment defined as usual weekly working hours of less than 30 hours per week in the main job, and full-time employment as usual weekly working hours of 30 or more per week in the main job. (See the notes to the charts and tables and data and comparability issues for exceptions). To highlight differences across socio-economic groups in couples’ working patterns and in the working hours of adults in couples with children, selected data for both are also presented by levels of education attainment: a. Incidence of full-time dual-earner couples and of jobless couples in couple households with children (0-14), by couples’ combined level of education, where “couples’ combined level of education” refers to the joint educational status of both partners, and may take on six possible values: ‘both low education’; ‘one low education, one moderate education’; ‘one low education, one high education’; ‘both moderate education’; ‘one moderate education, one high education’; and, ‘both high education’. b. Distribution of working hours for employed men and employed women in couple households with children (0-14), by level of education. In both cases levels of education attainment are measured using the standard three-part ordinal variable based on the ISCED 2011 classification system: 'low education' corresponds to a highest level of educational attainment at ISCED 2011 levels 0-2 (early-childhood education, primary or lower secondary Other relevant indicators: LMF1.1: Children in families by employment status; LMF1.2: Maternal employment; LMF2.1: Distribution of working hours among men and women; and, SF1.2: Children in families.
Transcript of LMF8: The distribution of working hours among couple families · LMF2.2: Patterns of employment and...

OECD Family Database www.oecd.org/els/family/database.htm OECD - Social Policy Division - Directorate of Employment, Labour and Social Affairs
1 Updated: 16-10-16
LMF2.2: Patterns of employment and the distribution of working hours for couples with children
Definitions and methodology
This indicator presents information on patterns of employment and the distribution of paid working
hours for couples with at least one child (aged 0-to-14). Data on couples’ working patterns are presented
using five possible combinations of working arrangements:
i. Both partners full-time;
ii. One partner full-time, one partner part-time;
iii. One partner full-time, one partner not working;
iv. Both partners not working;
v. Other, which includes any other combination of working arrangement – such as both parents
working part-time or one parent working time and one parent not working – and couples where
information on either partner’s working hours are missing.
And on the distribution of working hours using four possible ‘usual weekly working hour bands’:
i. 1-29 hours per week;
ii. 30-39 hours per week;
iii. 40-44 hours per week;
iv. 45 hours per week or more.
Definitions of ‘working’ and ‘employed’ follow ILO guidelines, with all people who during a
specified reference period were either in paid employment or were self-employed for at least one hour
being classified as in ‘employment’. Data on working hours generally refer to usual weekly working hours
(which include regular overtime) in the main job – unless individuals report that they do not have usual set
hours in their main job, in which case the individual's actual hours worked in their main job during the
survey reference week are used instead – and the distinction between part-time and full-time employment
generally follows the OECD’s common 30-hour definition, with part-time employment defined as usual
weekly working hours of less than 30 hours per week in the main job, and full-time employment as usual
weekly working hours of 30 or more per week in the main job. (See the notes to the charts and tables and
data and comparability issues for exceptions).
To highlight differences across socio-economic groups in couples’ working patterns and in the
working hours of adults in couples with children, selected data for both are also presented by levels of
education attainment:
a. Incidence of full-time dual-earner couples and of jobless couples in couple households with children
(0-14), by couples’ combined level of education, where “couples’ combined level of education”
refers to the joint educational status of both partners, and may take on six possible values: ‘both low
education’; ‘one low education, one moderate education’; ‘one low education, one high education’;
‘both moderate education’; ‘one moderate education, one high education’; and, ‘both high
education’.
b. Distribution of working hours for employed men and employed women in couple households with
children (0-14), by level of education.
In both cases levels of education attainment are measured using the standard three-part ordinal variable
based on the ISCED 2011 classification system: 'low education' corresponds to a highest level of
educational attainment at ISCED 2011 levels 0-2 (early-childhood education, primary or lower secondary
Other relevant indicators: LMF1.1: Children in families by employment status; LMF1.2: Maternal employment; LMF2.1: Distribution of working hours among men and women; and, SF1.2: Children in families.
OECD Family Database www.oecd.org/els/family/database.htm OECD - Social Policy Division - Directorate of Employment, Labour and Social Affairs
2 Updated: 16-10-16
education); ‘medium education’ reflects a highest level of educational attainment at ISCED 2011
levels 3-4 (upper secondary and post-secondary non-tertiary education); and ‘high education’
corresponds to a highest level of educational attainment at ISCED 2011 levels 5-8 (short-cycle
tertiary education, bachelor or equivalent, master or equivalent, doctoral or equivalent).
Key findings
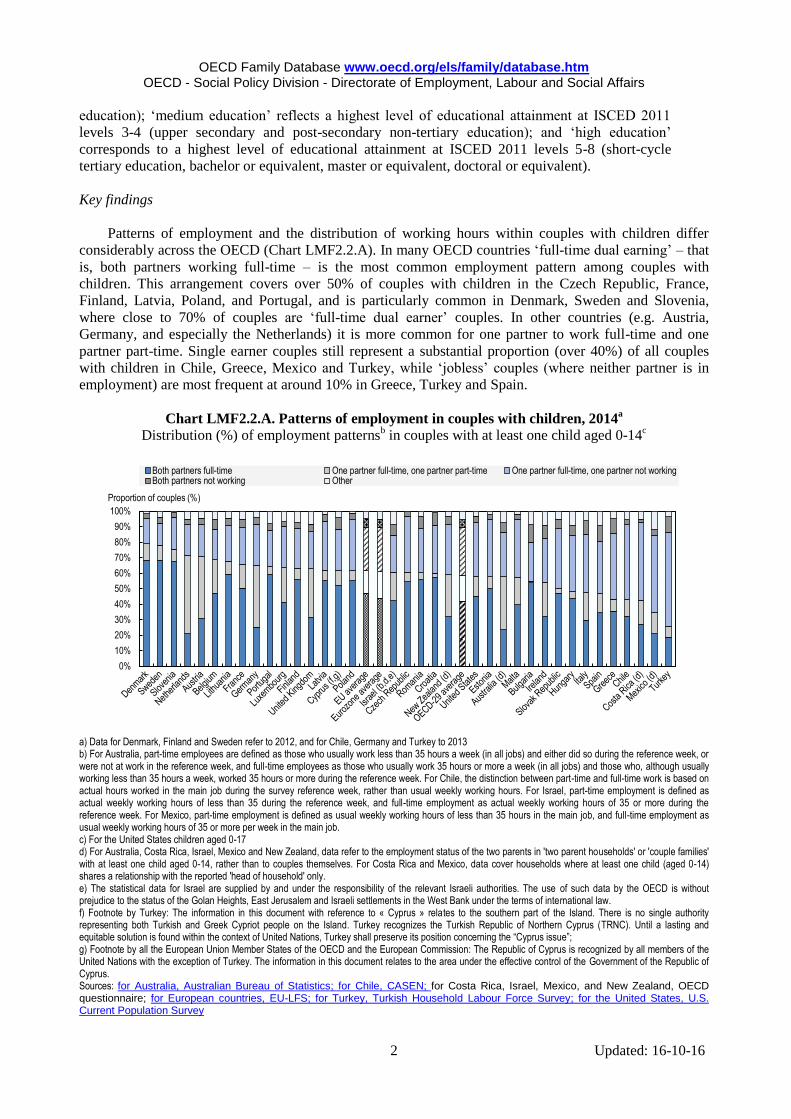
Patterns of employment and the distribution of working hours within couples with children differ
considerably across the OECD (Chart LMF2.2.A). In many OECD countries ‘full-time dual earning’ – that
is, both partners working full-time – is the most common employment pattern among couples with
children. This arrangement covers over 50% of couples with children in the Czech Republic, France,
Finland, Latvia, Poland, and Portugal, and is particularly common in Denmark, Sweden and Slovenia,
where close to 70% of couples are ‘full-time dual earner’ couples. In other countries (e.g. Austria,
Germany, and especially the Netherlands) it is more common for one partner to work full-time and one
partner part-time. Single earner couples still represent a substantial proportion (over 40%) of all couples
with children in Chile, Greece, Mexico and Turkey, while ‘jobless’ couples (where neither partner is in
employment) are most frequent at around 10% in Greece, Turkey and Spain.
Chart LMF2.2.A. Patterns of employment in couples with children, 2014a
Distribution (%) of employment patternsb in couples with at least one child aged 0-14
c
a) Data for Denmark, Finland and Sweden refer to 2012, and for Chile, Germany and Turkey to 2013 b) For Australia, part-time employees are defined as those who usually work less than 35 hours a week (in all jobs) and either did so during the reference week, or were not at work in the reference week, and full-time employees as those who usually work 35 hours or more a week (in all jobs) and those who, although usually working less than 35 hours a week, worked 35 hours or more during the reference week. For Chile, the distinction between part-time and full-time work is based on actual hours worked in the main job during the survey reference week, rather than usual weekly working hours. For Israel, part-time employment is defined as actual weekly working hours of less than 35 during the reference week, and full-time employment as actual weekly working hours of 35 or more during the reference week. For Mexico, part-time employment is defined as usual weekly working hours of less than 35 hours in the main job, and full-time employment as usual weekly working hours of 35 or more per week in the main job. c) For the United States children aged 0-17 d) For Australia, Costa Rica, Israel, Mexico and New Zealand, data refer to the employment status of the two parents in 'two parent households' or 'couple families' with at least one child aged 0-14, rather than to couples themselves. For Costa Rica and Mexico, data cover households where at least one child (aged 0-14) shares a relationship with the reported 'head of household' only. e) The statistical data for Israel are supplied by and under the responsibility of the relevant Israeli authorities. The use of such data by the OECD is without prejudice to the status of the Golan Heights, East Jerusalem and Israeli settlements in the West Bank under the terms of international law. f) Footnote by Turkey: The information in this document with reference to « Cyprus » relates to the southern part of the Island. There is no single authority representing both Turkish and Greek Cypriot people on the Island. Turkey recognizes the Turkish Republic of Northern Cyprus (TRNC). Until a lasting and equitable solution is found within the context of United Nations, Turkey shall preserve its position concerning the “Cyprus issue”; g) Footnote by all the European Union Member States of the OECD and the European Commission: The Republic of Cyprus is recognized by all members of the United Nations with the exception of Turkey. The information in this document relates to the area under the effective control of the Government of the Republic of Cyprus. Sources: for Australia, Australian Bureau of Statistics; for Chile, CASEN; for Costa Rica, Israel, Mexico, and New Zealand, OECD questionnaire; for European countries, EU-LFS; for Turkey, Turkish Household Labour Force Survey; for the United States, U.S. Current Population Survey
0%
10%
20%
30%
40%
50%
60%
70%
80%
90%
100%
Proportion of couples (%)
Both partners full-time One partner full-time, one partner part-time One partner full-time, one partner not workingBoth partners not working Other
OECD Family Database www.oecd.org/els/family/database.htm OECD - Social Policy Division - Directorate of Employment, Labour and Social Affairs
3 Updated: 16-10-16
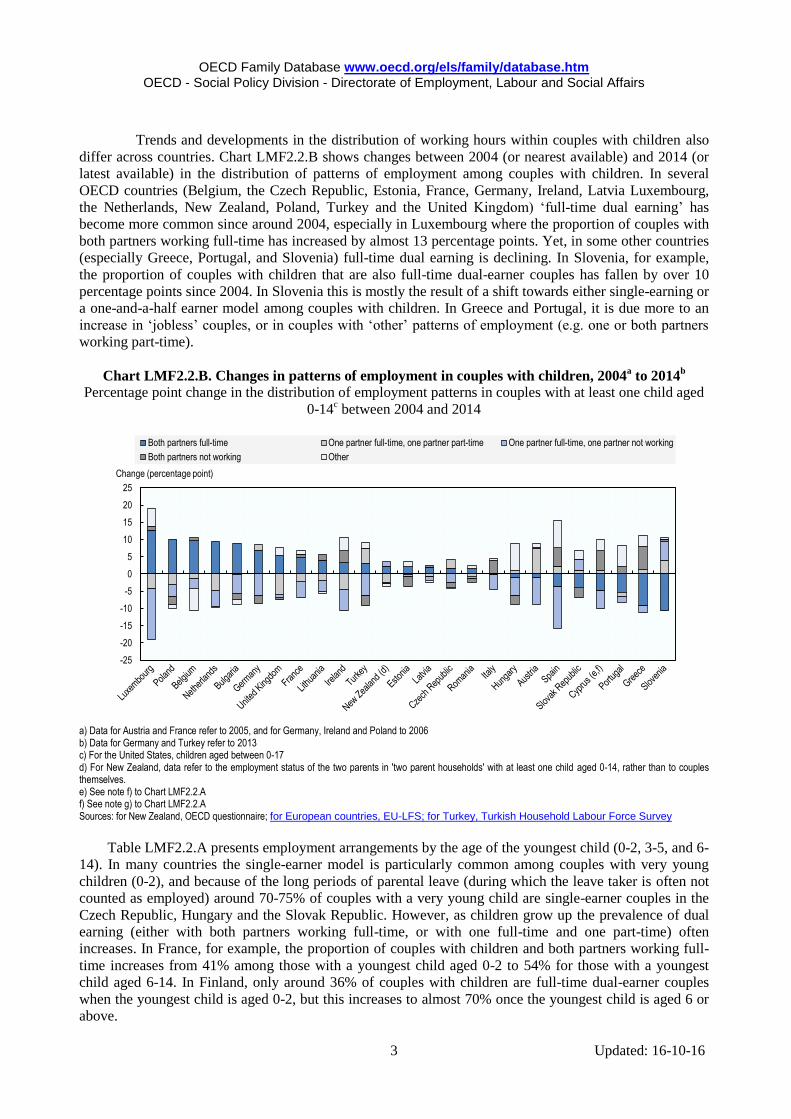
Trends and developments in the distribution of working hours within couples with children also
differ across countries. Chart LMF2.2.B shows changes between 2004 (or nearest available) and 2014 (or
latest available) in the distribution of patterns of employment among couples with children. In several
OECD countries (Belgium, the Czech Republic, Estonia, France, Germany, Ireland, Latvia Luxembourg,
the Netherlands, New Zealand, Poland, Turkey and the United Kingdom) ‘full-time dual earning’ has
become more common since around 2004, especially in Luxembourg where the proportion of couples with
both partners working full-time has increased by almost 13 percentage points. Yet, in some other countries
(especially Greece, Portugal, and Slovenia) full-time dual earning is declining. In Slovenia, for example,
the proportion of couples with children that are also full-time dual-earner couples has fallen by over 10
percentage points since 2004. In Slovenia this is mostly the result of a shift towards either single-earning or
a one-and-a-half earner model among couples with children. In Greece and Portugal, it is due more to an
increase in ‘jobless’ couples, or in couples with ‘other’ patterns of employment (e.g. one or both partners
working part-time).
Chart LMF2.2.B. Changes in patterns of employment in couples with children, 2004a to 2014
b
Percentage point change in the distribution of employment patterns in couples with at least one child aged
0-14c between 2004 and 2014
a) Data for Austria and France refer to 2005, and for Germany, Ireland and Poland to 2006 b) Data for Germany and Turkey refer to 2013 c) For the United States, children aged between 0-17 d) For New Zealand, data refer to the employment status of the two parents in 'two parent households' with at least one child aged 0-14, rather than to couples themselves. e) See note f) to Chart LMF2.2.A f) See note g) to Chart LMF2.2.A Sources: for New Zealand, OECD questionnaire; for European countries, EU-LFS; for Turkey, Turkish Household Labour Force Survey
Table LMF2.2.A presents employment arrangements by the age of the youngest child (0-2, 3-5, and 6-
14). In many countries the single-earner model is particularly common among couples with very young
children (0-2), and because of the long periods of parental leave (during which the leave taker is often not
counted as employed) around 70-75% of couples with a very young child are single-earner couples in the
Czech Republic, Hungary and the Slovak Republic. However, as children grow up the prevalence of dual
earning (either with both partners working full-time, or with one full-time and one part-time) often
increases. In France, for example, the proportion of couples with children and both partners working full-
time increases from 41% among those with a youngest child aged 0-2 to 54% for those with a youngest
child aged 6-14. In Finland, only around 36% of couples with children are full-time dual-earner couples
when the youngest child is aged 0-2, but this increases to almost 70% once the youngest child is aged 6 or
above.
-25
-20
-15
-10
-5
0
5
10
15
20
25
Change (percentage point)
Both partners full-time One partner full-time, one partner part-time One partner full-time, one partner not working
Both partners not working Other

OECD Family Database www.oecd.org/els/family/database.htm OECD - Social Policy Division - Directorate of Employment, Labour and Social Affairs
4 Updated: 16-10-16
Table LMF2.2.A. Patterns of employment in couples with children by age of youngest child, 2014a
Distribution (%) of employment patternsb in couples with at least one child aged 0-14c by age of youngest child
c
Youngest child aged 0-2 Youngest child aged 3-5 Youngest child aged 6-14
Both partners full-time
One partner
full-time, one
partner part-time
One partner
full-time, one
partner not
working
Both partners
not working
Other Both partners full-time
One partner
full-time, one
partner part-time
One partner
full-time, one
partner not
working
Both partners
not working
Other Both partners full-time
One partner
full-time, one
partner part-time
One partner
full-time, one
partner not
working
Both partners
not working
Other
Australia .. .. .. .. .. .. .. .. .. .. .. .. .. .. ..
Austria 30.22 31.51 28.88 4.83 4.56 21.01 47.79 21.23 3.72 6.24 35.10 41.94 15.45 3.80 3.71
Belgium 47.42 17.86 22.45 7.30 4.97 46.27 21.39 21.09 6.26 4.99 46.85 24.41 17.49 5.60 5.65
Canada .. .. .. .. .. .. .. .. .. .. .. .. .. .. ..
Chile (b) 25.44 12.67 51.93 4.06 5.90 33.84 10.16 48.87 2.39 4.74 34.99 9.99 45.80 3.25 5.96
Czech Republic 18.55 5.72 70.36 4.71 0.66 62.90 7.94 26.16 2.56 0.45 78.64 5.33 14.21 1.61 0.21
Denmark 63.87 8.56 21.21 4.52 1.83 71.69 8.63 15.40 1.81 2.47 69.67 12.88 13.33 2.60 1.52
Estonia 14.80 5.62 69.86 5.11 4.61 68.65 7.37 20.25 2.08 1.66 64.72 9.35 22.89 2.15 0.89
Finland 36.31 7.87 44.14 5.04 6.64 61.97 6.79 19.55 4.53 7.17 69.14 7.15 13.04 2.24 8.42
France 41.48 12.71 31.98 7.82 6.01 55.51 15.20 20.03 4.91 4.35 54.48 16.93 19.20 4.32 5.07
Germany 25.10 24.24 40.08 6.41 4.17 24.44 42.72 24.11 4.42 4.30 25.46 47.59 19.86 2.93 4.16
Greece 35.96 6.68 44.83 7.30 5.22 33.86 7.69 44.77 9.06 4.62 36.06 8.04 40.27 10.65 4.98
Hungary 9.39 1.95 70.11 10.23 8.32 52.04 7.34 25.95 6.17 8.50 61.40 4.60 19.55 4.20 10.25
Iceland .. .. .. .. .. .. .. .. .. .. .. .. .. .. ..
Ireland 37.77 19.84 25.51 8.68 8.19 30.68 21.12 30.41 8.75 9.04 27.83 24.48 29.44 8.34 9.92
Israel (b,c,d,e) 36.95 17.41 26.19 7.44 12.00 45.91 18.78 23.21 4.76 7.33 43.29 19.11 22.65 7.52 7.43
Italy 32.22 15.86 38.37 8.04 5.51 29.70 17.70 38.23 8.41 5.97 28.23 18.81 37.14 9.13 6.70
Japan .. .. .. .. .. .. .. .. .. .. .. .. .. .. ..
Korea .. .. .. .. .. .. .. .. .. .. .. .. .. .. ..
Latvia 43.56 5.12 45.31 4.12 1.89 56.53 7.45 30.80 4.06 1.15 62.17 7.25 23.12 4.74 2.73
Luxembourg 43.10 18.69 29.00 1.76 7.44 47.42 23.92 23.86 1.83 2.97 36.98 23.99 26.61 3.83 8.58
Mexico (d) 15.94 10.81 56.68 3.66 12.91 20.02 14.57 50.09 3.95 11.36 23.65 15.08 45.55 3.80 11.93
Netherlands 26.35 43.33 21.74 3.51 5.07 17.31 52.82 20.77 3.67 5.42 18.57 54.52 18.15 3.45 5.32
New Zealand (d) 22.38 22.80 44.43 6.71 3.52 30.04 29.02 32.45 5.20 3.42 39.56 29.35 23.12 4.36 3.49
Norway .. .. .. .. .. .. .. .. .. .. .. .. .. .. ..

OECD Family Database www.oecd.org/els/family/database.htm OECD - Social Policy Division - Directorate of Employment, Labour and Social Affairs
5 Updated: 16-10-16
Poland 49.57 5.86 38.89 4.61 1.07 52.82 7.40 34.16 4.16 1.45 59.90 6.38 28.08 4.17 1.47
Portugal 58.36 5.47 25.01 3.75 7.41 61.39 5.06 22.65 3.56 7.33 58.66 4.95 22.75 4.68 8.96
Slovak Republic 7.63 1.46 72.69 8.62 9.61 50.65 3.92 35.11 7.10 3.23 68.92 3.56 19.48 4.40 3.65
Slovenia 59.74 10.59 25.72 3.33 0.62 65.79 9.56 20.61 2.77 1.28 74.13 5.38 16.74 2.69 1.06
Spain 37.13 12.94 31.01 10.33 8.60 32.20 12.36 33.92 11.00 10.52 33.89 12.08 34.99 9.81 9.23
Sweden 61.21 9.19 20.22 5.47 3.92 72.36 8.70 12.42 2.82 3.70 72.27 10.83 10.13 2.80 3.97
Switzerland .. .. .. .. .. .. .. .. .. .. .. .. .. .. ..
Turkey 13.82 5.60 68.03 9.29 3.26 19.13 7.12 62.88 7.50 3.38 22.35 7.64 53.79 11.72 4.50
United Kingdom 29.35 28.17 27.90 5.47 9.12 25.62 33.90 26.60 5.88 8.01 36.43 32.91 18.39 4.41 7.85
United States 38.30 12.00 41.34 4.52 3.85 43.26 12.33 37.89 3.75 2.77 49.08 13.02 30.74 4.14 3.02
OECD-28 average 34.35 13.59 40.49 5.95 5.60 44.04 16.74 29.41 4.90 4.92 47.59 17.06 25.07 4.90 5.38
Costa Rica (d) 20.66 11.88 61.12 1.32 5.02 26.91 17.80 47.51 2.59 5.20 29.91 16.44 46.39 1.90 5.36
Bulgaria 39.90 0.36 35.84 11.80 12.09
51.68 2.24 25.75 14.36 5.97
59.47 0.94 21.25 9.25 9.09
Croatia 56.78 1.90 33.43 7.86 0.03 63.04 2.00 27.46 6.42 1.07 54.90 3.60 31.03 8.68 1.80
Cyprus (f,g) 51.33 9.20 26.40 6.67 6.40
57.77 7.24 23.92 7.29 3.78
49.62 10.96 28.30 7.71 3.40
Lithuania 57.09 5.38 23.38 7.31 6.84 56.96 9.01 26.39 5.33 2.32 61.91 10.38 20.38 3.31 4.01
Malta 42.03 16.22 36.26 3.39 2.09
39.82 20.07 35.81 2.95 1.35
38.04 17.39 38.64 3.85 2.07
Romania 49.57 3.97 33.25 9.61 3.60 53.90 4.12 30.15 8.73 3.10 57.95 4.57 26.60 7.55 3.33
EU average 39.49 12.01 36.92 6.34 5.23 48.71 15.05 26.34 5.52 4.37 51.48 15.40 23.09 5.10 4.93
Eurozone average 38.30 14.24 35.93 5.96 5.57 45.15 17.85 27.03 5.35 4.61 46.88 18.38 24.42 5.14 5.18
a) Data for Denmark, Finland and Sweden refer to 2012, and for Chile, Germany and Turkey to 2013 b) For Chile, the distinction between part-time and full-time work is based on actual hours worked in the main job during the survey reference week, rather than usual weekly working hours. For Israel, part-time employment is defined as actual weekly working hours of less than 35 during the reference week, and full-time employment as actual weekly working hours of 35 or more during the reference week. For Mexico, part-time employment is defined as usual weekly working hours of less than 35 hours in the main job, and full-time employment as usual weekly working hours of 35 or more per week in the main job. c) For the United States, children aged 0-17 and the age groups 0-2, 3-5 and 6-17. For Israel, the age groups are 0-1, 2-4 and 5-14. d) For Costa Rica, Israel Mexico and New Zealand, data refer to the employment status of the parents in 'two parent households' or 'couple families' with at least one child aged 0-14, rather than to couples themselves. For Costa Rica and Mexico, data cover households where at least one child (aged 0-14) shares a relationship with the reported 'head of household' only. e) See note e) to Chart LMF2.2.A f) See note f) to Chart LMF2.2.A g) See note g) to Chart LMF2.2.A Sources: for Chile, CASEN; for Costa Rica, Israel, Mexico, and New Zealand, OECD questionnaire; for European countries, EU-LFS; for Turkey, Turkish Household Labour Force Survey; for the United States, U.S. Current Population Survey

OECD Family Database www.oecd.org/els/family/database.htm OECD - Social Policy Division - Directorate of Employment, Labour and Social Affairs
6 Updated: 16-10-16
Across OECD countries, couples with children are more likely to be full-time dual-earner couples
when both partners have high levels of educational attainment (Chart LMF2.2.C, Panel A), and are most
likely to be jobless when both have only a low level of educational attainment (Chart LMF2.2.C, Panel B).
On average across OECD countries with available data, almost 55% of couples where both partners share
high levels of education attainment are also full-time dual-earner couples, compared to about 42% of
couples that share moderate levels of educational attainment and about 19% for couples where both
partners have low levels of educational attainment (Chart LMF2.2.C, Panel A). Jobless couples, on the
other hand, make up on average about 23% of couples where both partners have low levels of educational
attainment, but only 4% of couples where both partners have moderate levels of educational attainment and
as few as 1% of couples where both partners are highly educated (Chart LMF2.2.C, Panel B).
Chart LMF2.2.C. Incidence of full-time dual-earning and of joblessness in couples with children, by
couple's combined level of education, 2014a
Proportion (%) of couples with at least one child aged 0-14b where both partners work full-time and where
neither partner works, for couples with a given joint level of education
Note: countries are sorted in descending order according to the overall proportion of couples with children where both partners work full-time and where both partners are not working, respectively a) Data for Finland and Sweden refer to 2012, and for Germany and Turkey to 2013 b) For the United States children aged 0-17 c) See note f) to Chart LMF2.2.A d) See note g) to Chart LMF2.2.A Sources: for European countries, EU-LFS; for Turkey, Turkish Household Labour Force Survey; for the United States, U.S. Current Population Survey
0
10
20
30
40
50
60
70
80
90
100
% Panel A. Proportion (%) of couples with at least one child where both partners work full-time
Both low education One low education, one medium education One low education, one high education
Both medium education One medium education, one high education Both high education
0
10
20
30
40
50
60
% Panel B. Proportion (%) of couples with at least one child where neither partner works
OECD Family Database www.oecd.org/els/family/database.htm OECD - Social Policy Division - Directorate of Employment, Labour and Social Affairs
7 Updated: 16-10-16
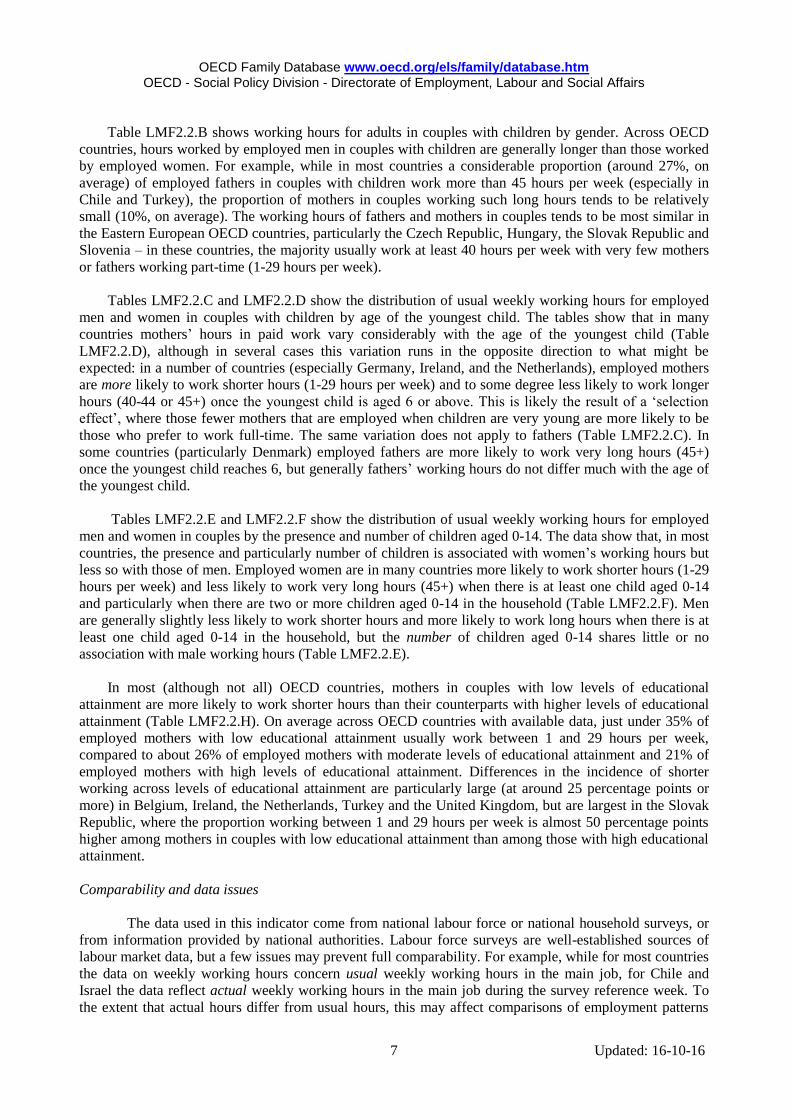
Table LMF2.2.B shows working hours for adults in couples with children by gender. Across OECD
countries, hours worked by employed men in couples with children are generally longer than those worked
by employed women. For example, while in most countries a considerable proportion (around 27%, on
average) of employed fathers in couples with children work more than 45 hours per week (especially in
Chile and Turkey), the proportion of mothers in couples working such long hours tends to be relatively
small (10%, on average). The working hours of fathers and mothers in couples tends to be most similar in
the Eastern European OECD countries, particularly the Czech Republic, Hungary, the Slovak Republic and
Slovenia – in these countries, the majority usually work at least 40 hours per week with very few mothers
or fathers working part-time (1-29 hours per week).
Tables LMF2.2.C and LMF2.2.D show the distribution of usual weekly working hours for employed
men and women in couples with children by age of the youngest child. The tables show that in many
countries mothers’ hours in paid work vary considerably with the age of the youngest child (Table
LMF2.2.D), although in several cases this variation runs in the opposite direction to what might be
expected: in a number of countries (especially Germany, Ireland, and the Netherlands), employed mothers
are more likely to work shorter hours (1-29 hours per week) and to some degree less likely to work longer
hours (40-44 or 45+) once the youngest child is aged 6 or above. This is likely the result of a ‘selection
effect’, where those fewer mothers that are employed when children are very young are more likely to be
those who prefer to work full-time. The same variation does not apply to fathers (Table LMF2.2.C). In
some countries (particularly Denmark) employed fathers are more likely to work very long hours (45+)
once the youngest child reaches 6, but generally fathers’ working hours do not differ much with the age of
the youngest child.
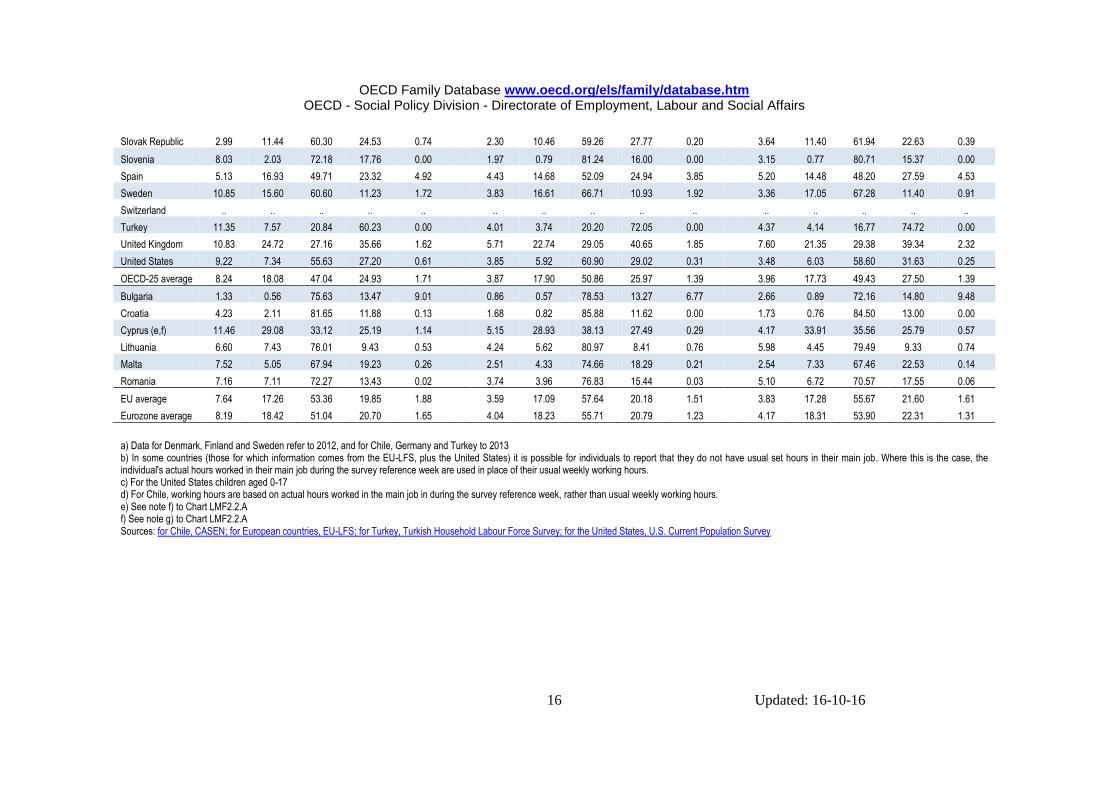
Tables LMF2.2.E and LMF2.2.F show the distribution of usual weekly working hours for employed
men and women in couples by the presence and number of children aged 0-14. The data show that, in most
countries, the presence and particularly number of children is associated with women’s working hours but
less so with those of men. Employed women are in many countries more likely to work shorter hours (1-29
hours per week) and less likely to work very long hours (45+) when there is at least one child aged 0-14
and particularly when there are two or more children aged 0-14 in the household (Table LMF2.2.F). Men
are generally slightly less likely to work shorter hours and more likely to work long hours when there is at
least one child aged 0-14 in the household, but the number of children aged 0-14 shares little or no
association with male working hours (Table LMF2.2.E).
In most (although not all) OECD countries, mothers in couples with low levels of educational
attainment are more likely to work shorter hours than their counterparts with higher levels of educational
attainment (Table LMF2.2.H). On average across OECD countries with available data, just under 35% of
employed mothers with low educational attainment usually work between 1 and 29 hours per week,
compared to about 26% of employed mothers with moderate levels of educational attainment and 21% of
employed mothers with high levels of educational attainment. Differences in the incidence of shorter
working across levels of educational attainment are particularly large (at around 25 percentage points or
more) in Belgium, Ireland, the Netherlands, Turkey and the United Kingdom, but are largest in the Slovak
Republic, where the proportion working between 1 and 29 hours per week is almost 50 percentage points
higher among mothers in couples with low educational attainment than among those with high educational
attainment.
Comparability and data issues
The data used in this indicator come from national labour force or national household surveys, or
from information provided by national authorities. Labour force surveys are well-established sources of
labour market data, but a few issues may prevent full comparability. For example, while for most countries
the data on weekly working hours concern usual weekly working hours in the main job, for Chile and
Israel the data reflect actual weekly working hours in the main job during the survey reference week. To
the extent that actual hours differ from usual hours, this may affect comparisons of employment patterns

OECD Family Database www.oecd.org/els/family/database.htm OECD - Social Policy Division - Directorate of Employment, Labour and Social Affairs
8 Updated: 16-10-16
and the distribution of weekly working hours between Chile and Israel and the remaining countries.
Additionally, while for most countries the distinction between part-time and full-time employment is based
on the OECD’s common 30-hour definition – with part-time employment defined as usual weekly working
hours of less than 30 hours per week in the main job, and full-time employment as usual weekly working
hours of 30 or more per week in the main job – for a few of countries (Australia, Israel and Mexico)
alternative national definitions have been used. Specifically, for Australia part-time workers are defined as
those who usually work less than 35 hours a week (in all jobs) and either did so during the reference week,
or were not at work in the reference week, for Israel part-time workers are those with actual weekly
working hours of less than 35 during the reference week, and for Mexico they are those with usual weekly
working hours of less than 35 hours in the main job. The use in particular of a higher part-time hours
threshold by these countries is likely to increase the proportion of the employed classified as in ‘part-time’
work and, as a result, decrease the proportion of couples with children that are classified as having at least
one partner in full-time employment.
Labour force surveys are also not specifically designed to provide information on families or on
employment by parenthood status or partnership status, and classifications of family relationships may not
always match conventional conceptions. ‘Couples’ are generally defined as two adults living in the same
household that self-identify as partners of one another, regardless of the legal status of the union (i.e. the
definition reflects the “de facto” situation in terms of co-habitation arrangements). Couples where one
partner lives in a separate household are not included. ‘Children’, meanwhile, are generally defined as any
children (including both biological children and step or adoptive children) aged 0-14 (for the United States
0-17) that live in the same household and that are reported as the child of one or both of the parents.
Couples with children who do not live in the same household are generally not included, nor are couples
with children aged 15 or older (for the United States, 18 or older) regardless of whether or not the child
lives in the same household and/or is dependent on the couple. Data for Australia, Costa Rica, Israel,
Mexico and New Zealand refer to two parent households or couple families with at least one child aged 0-
14 rather than couples themselves, and for Costa Rica and Mexico include only those households where at
least one child aged 0-14 is reported as sharing a parent-child relationship with the household head.
As discussed in indicator LMF1.2, cross-national comparisons of parental employment may also be
affected by differences in the treatment of individuals on maternity, paternity or parental leave. It is
difficult to isolate the impact of differences in the treatment of persons on leave on parental employment
rates, but it is possible that different treatments could influence cross-national variations in employment
patterns among and working hours for parents with very young children.
Sources and further reading: OECD (2007), Babies and Bosses: Reconciling Work and Family Life, A Synthesis of Findings for OECD Countries; OECD (2016), Employment Outlook 2016; OECD (2011), Doing Better for Families www.oecd.org/social/family/doingbetter; OECD (2012), Closing the Gender Gap

OECD Family Database www.oecd.org/els/family/database.htm OECD - Social Policy Division - Directorate of Employment, Labour and Social Affairs
9 Updated: 16-10-16
Table LMF2.2.B. Distribution of working hours for employed adults in couples with children, by gender, 2014a
Distribution (%) of usual weekly working hoursb by working hours bands for employed men and women in couples with at least one child aged 0-
14c
Proportion (%) with usual weekly working hours in the given weekly hours band:
Men No information on hours
Women No information on hours 1 to 29 30 to 39 40 to 44 45+ 1 to 29 30 to 39 40 to 44 45+
Australia .. .. .. .. .. .. .. .. .. ..
Austria 3.93 25.88 37.94 32.23 0.03 55.28 24.03 15.26 5.42 0.01
Belgium 4.84 43.31 25.14 25.77 0.94 30.47 48.71 10.79 9.61 0.42
Canada .. .. .. .. .. .. .. .. .. ..
Chile (d) 6.27 3.51 11.47 78.38 0.37 23.58 8.64 14.10 52.81 0.86
Czech Republic 0.85 10.51 61.36 27.28 0.00 9.07 16.91 68.14 5.87 0.00
Denmark 3.04 74.23 7.79 14.85 0.09 11.64 79.76 3.71 4.70 0.20
Estonia 2.66 1.99 84.21 10.54 0.60 11.49 8.82 74.39 5.20 0.10
Finland 2.27 33.75 41.33 18.18 4.46 9.71 63.02 18.59 4.80 3.89
France 3.99 49.72 17.83 27.32 1.14 21.40 55.38 11.40 10.66 1.16
Germany 4.47 22.46 49.14 23.94 0.00 59.17 22.69 14.85 3.30 0.00
Greece 5.75 5.43 48.70 40.12 0.00 17.69 11.45 51.49 19.36 0.00
Hungary 1.96 1.56 79.52 9.23 7.73 7.29 6.20 80.19 2.91 3.41
Iceland .. .. .. .. .. .. .. .. .. ..
Ireland 9.12 32.97 32.58 24.39 0.95 38.30 41.65 15.26 3.81 0.97
Israel .. .. .. .. .. .. .. .. .. ..
Italy 5.61 18.59 52.79 22.59 0.42 37.29 29.55 26.86 6.14 0.16
Japan .. .. .. .. .. .. .. .. .. ..
Korea .. .. .. .. .. .. .. .. .. ..
Latvia 2.12 1.56 87.80 7.94 0.57 9.39 3.82 82.44 3.94 0.41
Luxembourg 2.51 3.57 78.70 11.75 3.47 32.72 15.74 46.27 2.20 3.07
Mexico .. .. .. .. .. .. .. .. .. ..
Netherlands 5.33 32.33 49.46 12.87 0.00 68.76 24.17 5.18 1.89 0.00
New Zealand .. .. .. .. .. .. .. .. .. ..
Norway .. .. .. .. .. .. .. .. .. ..
Poland 1.82 2.20 65.88 30.11 0.00 9.80 7.67 72.41 10.12 0.00
Portugal 2.67 6.75 55.98 28.84 5.76 6.81 13.43 61.68 15.73 2.35

OECD Family Database www.oecd.org/els/family/database.htm OECD - Social Policy Division - Directorate of Employment, Labour and Social Affairs
10 Updated: 16-10-16
Slovak Republic 2.96 10.88 60.54 25.33 0.29 7.12 19.28 61.84 7.44 4.31
Slovenia 2.55 0.77 80.95 15.73 0.00 8.70 3.56 80.12 7.63 0.00
Spain 4.89 14.60 50.00 26.28 4.23 24.67 31.89 32.05 9.21 2.18
Sweden 3.55 16.88 67.05 11.22 1.31 10.75 40.07 41.84 6.15 1.19
Switzerland .. .. .. .. .. .. .. .. .. ..
Turkey 4.21 3.97 18.26 73.55 0.00 29.16 11.39 22.28 37.17 0.00
United Kingdom 6.82 22.20 29.33 39.56 2.10 47.64 29.36 11.15 10.68 1.18
United States 3.71 6.10 59.55 30.37 0.27 19.27 15.96 52.71 11.54 0.52
OECD-25 average 3.92 17.83 50.13 26.73 1.39 24.29 25.33 39.00 10.33 1.06
Bulgaria 1.51 0.77 76.05 13.84 7.82 2.51 1.15 83.69 9.23 3.42
Croatia 1.70 0.79 85.22 12.30 0.00 4.29 1.60 88.69 5.42 0.00
Cyprus (e,f) 4.66 31.78 36.60 26.46 0.49 14.25 48.12 25.48 11.91 0.23
Lithuania 4.96 5.13 80.15 9.03 0.73 9.38 9.24 76.50 2.66 2.22
Malta 2.61 5.86 71.12 20.23 0.18 28.30 27.71 38.86 4.74 0.39
Romania 4.25 4.99 74.48 16.24 0.04 7.91 6.58 75.67 9.77 0.08
EU average 3.69 17.20 56.70 20.86 1.55 21.49 24.70 45.53 7.16 1.12
Eurozone average 4.10 18.28 54.79 21.55 1.28 25.84 26.43 39.44 7.14 1.15
a) Data for Denmark, Finland and Sweden refer to 2012, and for Chile, Germany and Turkey to 2013 b) In some countries (those for which information comes from the EU-LFS, plus the United States) it is possible for individuals to report that they do not have usual set hours in their main job. Where this is the case, the individual's actual hours worked in their main job during the survey reference week are used in place of their usual weekly working hours. c) For the United States children aged 0-17 d) For Chile, working hours are based on actual hours worked in the main job in during the survey reference week, rather than usual weekly working hours. e) See note f) to Chart LMF2.2.A f) See note g) to Chart LMF2.2.A Sources: for Chile, CASEN; for European countries, EU-LFS; for Turkey, Turkish Household Labour Force Survey; for the United States, U.S. Current Population Survey

OECD Family Database www.oecd.org/els/family/database.htm OECD - Social Policy Division - Directorate of Employment, Labour and Social Affairs
11 Updated: 16-10-16
Table LMF2.2.C. Distribution of working hours for employed men in couples with children by age of youngest child, 2014a
Distribution (%) of usual weekly working hoursb by working hours bands for employed men in couples with at least one child aged 0-14
c, by age
group of the youngest child Proportion (%) with usual weekly working hours in the given weekly hours band:
No
information on hours
No
information on hours
No
information on hours
Youngest child aged 0-2 Youngest child aged 3-5 Youngest child aged 6-14
1 to 29 30 to 39 40 to 44 45+ 1 to 29 30 to 39 40 to 44 45+ 1 to 29 30 to 39 40 to 44 45+
Australia .. .. .. .. .. .. .. .. .. .. .. .. .. .. ..
Austria 5.23 27.44 38.27 29.04 0.02 4.81 26.58 36.96 31.55 0.10 2.73 24.58 38.15 34.55 0.00
Belgium 5.52 44.54 26.98 22.06 0.90 4.09 44.02 25.40 25.47 1.02 4.75 42.07 23.70 28.56 0.92
Canada .. .. .. .. .. .. .. .. .. .. .. .. .. .. ..
Chile (d) 7.16 4.39 11.21 77.00 0.24 5.56 2.87 10.79 80.49 0.29 6.13 3.34 11.96 78.09 0.48
Czech Republic 0.94 9.84 65.76 23.46 0.00 0.97 10.32 57.62 31.09 0.00 0.71 11.17 59.96 28.16 0.00
Denmark 3.28 81.14 7.07 8.51 0.00 2.76 74.17 8.02 14.66 0.38 3.01 69.76 8.16 19.04 0.02
Estonia 3.41 1.19 86.63 7.84 0.93 3.68 3.45 77.61 14.91 0.34 1.39 1.63 86.75 9.71 0.52
Finland 2.09 34.96 42.36 17.18 3.42 2.76 34.34 40.70 18.65 3.54 2.21 32.47 40.75 18.80 5.76
France 4.23 53.45 17.24 23.66 1.42 3.44 48.85 18.62 27.73 1.36 4.08 47.53 17.86 29.68 0.85
Germany 4.99 20.96 51.89 22.17 0.00 4.75 21.86 49.51 23.88 0.00 4.05 23.56 47.41 24.98 0.00
Greece 5.54 4.88 50.69 38.89 0.00 5.38 5.59 49.30 39.73 0.00 6.00 5.58 47.62 40.80 0.00
Hungary 2.11 1.04 79.51 10.16 7.18 1.78 1.91 80.45 8.90 6.95 1.94 1.72 79.08 8.81 8.45
Iceland .. .. .. .. .. .. .. .. .. .. .. .. .. .. ..
Ireland 8.69 34.76 33.89 21.89 0.77 8.67 35.20 32.34 22.70 1.09 9.74 30.15 31.60 27.48 1.02
Israel .. .. .. .. .. .. .. .. .. .. .. .. .. .. ..
Italy 5.49 16.98 55.58 21.76 0.19 5.40 18.08 54.28 21.73 0.50 5.77 19.69 50.59 23.44 0.50
Japan .. .. .. .. .. .. .. .. .. .. .. .. .. .. ..
Korea .. .. .. .. .. .. .. .. .. .. .. .. .. .. ..
Latvia 1.31 0.97 90.78 6.33 0.61 2.28 1.56 88.55 7.35 0.25 2.60 1.98 85.29 9.41 0.73
Luxembourg 2.77 3.10 79.99 10.00 4.14 2.30 2.83 78.50 14.67 1.70 2.43 4.21 77.96 11.56 3.84
Mexico .. .. .. .. .. .. .. .. .. .. .. .. .. .. ..
Netherlands 5.89 35.45 48.31 10.36 0.00 5.72 31.72 51.13 11.43 0.00 4.82 30.59 49.52 15.07 0.00
New Zealand .. .. .. .. .. .. .. .. .. .. .. .. .. .. ..
Norway .. .. .. .. .. .. .. .. .. .. .. .. .. .. ..
Poland 1.60 2.12 67.92 28.37 0.00 1.80 2.20 66.35 29.65 0.00 1.98 2.25 64.20 31.56 0.00
OECD Family Database www.oecd.org/els/family/database.htm OECD - Social Policy Division - Directorate of Employment, Labour and Social Affairs
12 Updated: 16-10-16
Portugal 3.10 6.90 55.34 29.86 4.80 2.07 7.66 56.58 28.17 5.52 2.74 6.28 56.02 28.65 6.31
Slovak Republic 3.27 11.27 61.85 23.23 0.37 2.26 11.52 64.41 21.61 0.20 3.08 10.36 58.03 28.24 0.29
Slovenia 3.29 0.33 85.43 10.95 0.00 2.27 1.30 77.46 18.96 0.00 2.15 0.81 79.46 17.59 0.00
Spain 6.42 14.98 50.32 25.80 2.48 4.88 14.28 49.68 26.50 4.65 3.96 14.53 49.95 26.47 5.09
Sweden 3.92 17.38 67.26 10.47 0.97 3.65 18.73 66.58 9.70 1.35 3.18 15.50 67.13 12.62 1.57
Switzerland .. .. .. .. .. .. .. .. .. .. .. .. .. .. ..
Turkey 3.56 3.70 16.93 75.81 0.00 3.53 3.51 17.23 75.73 0.00 5.12 4.45 19.90 70.54 0.00
United Kingdom 6.49 22.75 31.91 36.66 2.19 7.04 22.19 27.73 40.84 2.20 7.00 21.69 27.86 41.49 1.96
United States 4.40 6.76 59.41 29.15 0.29 3.40 6.84 59.93 29.61 0.23 3.50 5.51 59.48 31.23 0.29
OECD-25 average 4.19 18.45 51.30 24.82 1.24 3.81 18.06 49.83 27.03 1.27 3.80 17.26 49.53 27.86 1.54
Bulgaria 1.40 0.68 72.64 14.97 10.32 1.89 0.39 79.30 12.83 5.59 1.37 1.01 75.76 13.90 7.97
Croatia 0.52 0.56 86.33 12.58 0.00 1.05 1.05 85.69 12.20 0.00 2.75 0.79 84.29 12.17 0.00
Cyprus (e,f) 7.09 28.87 41.95 21.68 0.41 4.03 29.91 38.16 27.17 0.72 3.58 34.39 32.76 28.85 0.41
Lithuania 4.75 4.53 83.07 6.92 0.74 4.27 3.82 82.75 8.72 0.44 5.46 6.21 76.83 10.64 0.86
Malta 1.97 6.39 70.52 20.87 0.26 3.07 8.19 66.92 21.81 0.00 2.73 4.44 73.50 19.11 0.23
Romania 4.12 4.50 74.75 16.56 0.07 4.22 5.53 74.56 15.64 0.05 4.29 4.95 74.39 16.34 0.03
EU average 3.91 17.57 58.01 19.01 1.51 3.62 17.40 56.61 21.01 1.36 3.59 16.78 55.88 22.06 1.69
Eurozone average 4.48 18.52 56.37 19.50 1.13 4.01 18.46 54.68 21.72 1.13 3.91 17.95 53.88 22.82 1.44
a) Data for Denmark, Finland and Sweden refer to 2012, and for Chile, Germany and Turkey to 2013 b) In some countries (those for which information comes from the EU-LFS, plus the United States) it is possible for individuals to report that they do not have usual set hours in their main job. Where this is the case, the individual's actual hours worked in their main job during the survey reference week are used in place of their usual weekly working hours. c) For the United States children aged 0-17 and the age groups 0-2, 3-5 and 6-17 d) For Chile, working hours are based on actual hours worked in the main job in during the survey reference week, rather than usual weekly working hours. e) See note f) to Chart LMF2.2.A f) See note g) to Chart LMF2.2.A Sources: for Chile, CASEN; for European countries, EU-LFS; for Turkey, Turkish Household Labour Force Survey; for the United States, U.S. Current Population Survey

OECD Family Database www.oecd.org/els/family/database.htm OECD - Social Policy Division - Directorate of Employment, Labour and Social Affairs
13 Updated: 16-10-16
Table LMF2.2.D. Distribution of working hours for employed women in couples with children by age of youngest child, 2014a
Distribution (%) of usual weekly working hoursb by working hours bands for employed women in couples with at least one child aged 0-14
c, by age
group of the youngest child Proportion (%) with usual weekly working hours in the given weekly hours band:
No
information on hours
No
information on hours
No
information on hours
Youngest child aged 0-2 Youngest child aged 3-5 Youngest child aged 6-14
1 to 29 30 to 39 40 to 44 45+ 1 to 29 30 to 39 40 to 44 45+ 1 to 29 30 to 39 40 to 44 45+
Australia .. .. .. .. .. .. .. .. .. .. .. .. .. .. ..
Austria 49.25 23.95 21.62 5.18 0.00 68.10 18.26 8.56 5.03 0.06 53.28 26.35 14.67 5.71 0.00
Belgium 25.75 53.61 11.76 8.54 0.34 31.23 48.63 11.89 8.08 0.16 33.10 45.62 9.65 11.02 0.60
Canada .. .. .. .. .. .. .. .. .. .. .. .. .. .. ..
Chile (d) 30.79 8.85 12.61 47.63 0.12 22.37 7.03 16.89 53.60 0.12 20.70 9.32 13.49 54.92 1.57
Czech Republic 20.95 13.91 61.35 3.79 0.00 10.26 17.68 67.98 4.08 0.00 5.73 17.25 69.81 7.20 0.00
Denmark 10.12 83.86 2.73 3.28 0.00 10.03 81.98 3.54 3.82 0.62 13.21 76.38 4.36 5.91 0.14
Estonia 27.26 6.64 62.03 4.07 0.00 8.08 10.79 76.81 4.32 0.00 10.21 8.03 75.55 6.03 0.18
Finland 15.07 60.21 17.02 3.44 4.27 9.52 68.21 15.69 3.69 2.89 7.20 62.29 20.50 5.91 4.11
France 21.80 55.53 11.27 9.50 1.90 19.97 58.72 10.68 10.08 0.55 21.84 53.73 11.81 11.58 1.04
Germany 47.00 26.69 22.69 3.62 0.00 61.32 23.32 12.61 2.75 0.00 63.14 20.86 12.62 3.39 0.00
Greece 17.08 9.86 60.82 12.25 0.00 18.04 12.13 52.47 17.36 0.00 17.78 11.76 47.67 22.80 0.00
Hungary 13.86 10.52 67.83 5.29 2.50 10.00 8.04 76.49 2.04 3.43 5.50 5.00 82.99 3.00 3.50
Iceland .. .. .. .. .. .. .. .. .. .. .. .. .. .. ..
Ireland 31.76 46.33 17.40 3.27 1.23 38.43 41.27 15.75 3.80 0.76 43.87 37.84 13.15 4.28 0.86
Israel .. .. .. .. .. .. .. .. .. .. .. .. .. .. ..
Italy 32.67 30.48 32.43 4.31 0.11 37.00 28.76 27.40 6.76 0.07 39.77 29.43 23.79 6.78 0.23
Japan .. .. .. .. .. .. .. .. .. .. .. .. .. .. ..
Korea .. .. .. .. .. .. .. .. .. .. .. .. .. .. ..
Latvia 8.91 3.01 83.27 4.00 0.81 8.79 4.56 81.28 4.85 0.51 9.92 3.83 82.63 3.45 0.18
Luxembourg 28.09 12.73 53.43 1.81 3.93 30.60 20.12 46.45 1.69 1.14 36.79 15.42 41.57 2.71 3.52
Mexico .. .. .. .. .. .. .. .. .. .. .. .. .. .. ..
Netherlands 59.61 33.24 5.93 1.23 0.00 72.88 20.99 4.55 1.58 0.00 72.76 19.84 4.97 2.42 0.00
New Zealand .. .. .. .. .. .. .. .. .. .. .. .. .. .. ..
Norway .. .. .. .. .. .. .. .. .. .. .. .. .. .. ..
Poland 9.77 7.72 75.77 6.75 0.00 11.57 8.61 71.27 8.55 0.00 8.92 7.17 71.18 12.73 0.00
Portugal 6.73 14.54 59.90 16.26 2.56 6.62 12.76 62.71 16.35 1.56 6.92 13.22 62.04 15.23 2.59

OECD Family Database www.oecd.org/els/family/database.htm OECD - Social Policy Division - Directorate of Employment, Labour and Social Affairs
14 Updated: 16-10-16
Slovak Republic 8.93 14.49 36.02 3.22 37.34 7.92 19.05 65.23 6.11 1.69 6.59 20.04 64.36 8.51 0.50
Slovenia 11.24 5.70 77.96 5.10 0.00 11.48 4.03 78.14 6.35 0.00 5.63 1.96 82.52 9.89 0.00
Spain 24.31 35.82 30.77 7.64 1.46 25.79 31.13 32.06 8.19 2.83 24.35 29.84 32.83 10.67 2.32
Sweden 11.48 36.09 46.04 5.30 1.08 9.07 47.20 36.64 6.25 0.85 11.03 39.46 41.35 6.72 1.44
Switzerland .. .. .. .. .. .. .. .. .. .. .. .. .. .. ..
Turkey 31.39 11.73 25.53 31.35 0.00 29.67 11.60 23.26 35.47 0.00 27.91 11.14 20.35 40.60 0.00
United Kingdom 48.20 29.02 9.97 11.62 1.19 53.34 27.21 9.81 8.67 0.97 44.50 30.63 12.67 10.92 1.28
United States 21.08 15.64 51.66 10.86 0.76 19.68 16.62 52.61 10.73 0.36 18.44 15.89 53.15 12.05 0.47
OECD-25 average 24.52 26.01 38.31 8.77 2.38 25.27 25.95 38.43 9.61 0.74 24.36 24.49 38.79 11.38 0.98
Bulgaria 2.06 0.90 86.70 6.37 3.97 3.52 0.82 86.65 7.08 1.93 2.19 1.35 81.74 10.80 3.92
Croatia 2.23 1.22 91.71 4.85 0.00 3.48 2.60 90.34 3.58 0.00 5.84 1.33 86.19 6.64 0.00
Cyprus (e,f) 14.55 49.18 27.66 8.30 0.31 10.40 51.50 25.61 12.49 0.00 16.04 45.76 24.09 13.80 0.31
Lithuania 4.80 5.86 82.62 0.69 6.03 10.47 7.60 78.38 3.35 0.20 11.60 11.99 72.02 3.50 0.89
Malta 26.52 31.18 38.52 3.00 0.79 29.88 32.75 32.93 4.06 0.37 28.49 23.18 42.10 6.06 0.17
Romania 6.88 3.21 82.08 7.40 0.43 7.02 4.77 77.20 11.02 0.00 8.39 7.85 73.82 9.92 0.02
EU average 20.96 25.20 45.62 5.72 2.51 22.31 25.48 44.97 6.50 0.73 21.95 23.84 45.10 8.13 0.99
Eurozone average 24.28 27.32 39.64 5.55 3.21 26.66 27.08 38.91 6.68 0.67 26.80 25.31 38.87 8.09 0.92
a) Data for Denmark, Finland and Sweden refer to 2012, and for Chile, Germany and Turkey to 2013 b) In some countries (those for which information comes from the EU-LFS, plus the United States) it is possible for individuals to report that they do not have usual set hours in their main job. Where this is the case, the individual's actual hours worked in their main job during the survey reference week are used in place of their usual weekly working hours. c) For the United States children aged 0-17 and the age groups 0-2, 3-5 and 6-17 d) For Chile, working hours are based on actual hours worked in the main job in during the survey reference week, rather than usual weekly working hours. e) See note f) to Chart LMF2.2.A f) See note g) to Chart LMF2.2.A Sources: for Chile, CASEN; for European countries, EU-LFS; for Turkey, Turkish Household Labour Force Survey; for the United States, U.S. Current Population Survey

OECD Family Database www.oecd.org/els/family/database.htm OECD - Social Policy Division - Directorate of Employment, Labour and Social Affairs
15 Updated: 16-10-16
Table LMF2.2.E. Distribution of working hours for employed men in couples by presence and number of children, 2014a
Distribution (%) of usual weekly working hoursb by working hours bands for employed men in couples by presence of at least one child aged 0-14
c
and the number of children aged 0-14c
Proportion (%) with usual weekly working hours in the given weekly hours band:
No
information on hours
No
information on hours
No
information on hours
No children aged 0-14 One child aged 0-14 Two or more children aged 0-14
1 to 29 30 to 39 40 to 44 45+ 1 to 29 30 to 39 40 to 44 45+ 1 to 29 30 to 39 40 to 44 45+
Australia .. .. .. .. .. .. .. .. .. .. .. .. .. .. ..
Austria 9.22 25.59 35.88 29.26 0.05 3.93 27.12 38.54 30.40 0.01 3.94 24.61 37.32 34.09 0.04
Belgium 8.02 43.02 22.89 24.80 1.26 4.87 45.24 24.54 24.53 0.81 4.71 41.54 25.42 27.30 1.03
Canada .. .. .. .. .. .. .. .. .. .. .. .. .. .. ..
Chile (d) 9.90 5.02 12.04 72.65 0.39 6.48 3.66 11.60 77.79 0.47 6.00 3.32 11.29 79.16 0.23
Czech Republic 3.51 12.44 59.55 24.37 0.14 1.04 9.17 63.58 26.21 0.00 0.71 11.14 59.65 28.51 0.00
Denmark 11.98 64.57 6.86 16.26 0.34 3.42 74.86 7.77 13.91 0.03 2.81 73.77 7.73 15.56 0.13
Estonia 6.62 1.88 79.41 11.75 0.34 2.05 1.53 86.46 9.12 0.85 3.30 2.35 82.75 11.19 0.41
Finland 8.17 31.11 39.25 15.89 5.57 2.84 33.00 41.97 17.31 4.88 1.84 34.33 40.85 18.83 4.15
France 6.43 46.85 16.35 28.73 1.64 3.98 50.26 18.12 26.89 0.75 3.94 49.34 17.69 27.56 1.46
Germany 9.03 23.50 45.50 21.98 0.00 4.12 22.62 50.21 23.04 0.00 4.72 22.27 48.00 25.01 0.00
Greece 6.92 6.03 45.92 41.12 0.01 5.93 5.01 51.69 37.36 0.00 5.57 5.84 45.67 42.92 0.00
Hungary 3.30 2.42 76.29 9.53 8.47 1.74 1.03 79.58 9.39 8.26 2.15 2.10 79.24 9.13 7.38
Iceland .. .. .. .. .. .. .. .. .. .. .. .. .. .. ..
Ireland 12.45 31.71 31.00 23.46 1.37 8.83 35.40 32.26 22.68 0.84 9.23 31.55 32.76 25.45 1.01
Israel .. .. .. .. .. .. .. .. .. .. .. .. .. .. ..
Italy 8.31 22.25 46.72 22.14 0.58 5.90 18.96 52.84 21.91 0.39 5.24 18.18 52.62 23.49 0.47
Japan .. .. .. .. .. .. .. .. .. .. .. .. .. .. ..
Korea .. .. .. .. .. .. .. .. .. .. .. .. .. .. ..
Latvia 4.31 2.50 84.50 8.36 0.33 2.08 1.66 87.51 8.01 0.74 2.19 1.42 88.07 8.09 0.23
Luxembourg 6.39 3.40 74.49 11.97 3.75 2.89 4.26 79.87 10.00 2.98 2.23 3.06 77.58 13.23 3.89
Mexico .. .. .. .. .. .. .. .. .. .. .. .. .. .. ..
Netherlands 15.34 31.80 42.88 9.97 0.00 6.29 30.01 50.83 12.86 0.00 4.69 33.83 48.58 12.89 0.00
New Zealand .. .. .. .. .. .. .. .. .. .. .. .. .. .. ..
Norway .. .. .. .. .. .. .. .. .. .. .. .. .. .. ..
Poland 5.16 3.72 64.44 26.68 0.00 1.74 2.23 67.46 28.58 0.00 1.88 2.17 64.18 31.76 0.00
Portugal 12.66 8.43 45.73 24.36 8.83 2.52 6.50 57.28 27.94 5.75 2.96 7.22 53.51 30.54 5.78
OECD Family Database www.oecd.org/els/family/database.htm OECD - Social Policy Division - Directorate of Employment, Labour and Social Affairs
16 Updated: 16-10-16
Slovak Republic 2.99 11.44 60.30 24.53 0.74 2.30 10.46 59.26 27.77 0.20 3.64 11.40 61.94 22.63 0.39
Slovenia 8.03 2.03 72.18 17.76 0.00 1.97 0.79 81.24 16.00 0.00 3.15 0.77 80.71 15.37 0.00
Spain 5.13 16.93 49.71 23.32 4.92 4.43 14.68 52.09 24.94 3.85 5.20 14.48 48.20 27.59 4.53
Sweden 10.85 15.60 60.60 11.23 1.72 3.83 16.61 66.71 10.93 1.92 3.36 17.05 67.28 11.40 0.91
Switzerland .. .. .. .. .. .. .. .. .. .. .. .. .. .. ..
Turkey 11.35 7.57 20.84 60.23 0.00 4.01 3.74 20.20 72.05 0.00 4.37 4.14 16.77 74.72 0.00
United Kingdom 10.83 24.72 27.16 35.66 1.62 5.71 22.74 29.05 40.65 1.85 7.60 21.35 29.38 39.34 2.32
United States 9.22 7.34 55.63 27.20 0.61 3.85 5.92 60.90 29.02 0.31 3.48 6.03 58.60 31.63 0.25
OECD-25 average 8.24 18.08 47.04 24.93 1.71 3.87 17.90 50.86 25.97 1.39 3.96 17.73 49.43 27.50 1.39
Bulgaria 1.33 0.56 75.63 13.47 9.01 0.86 0.57 78.53 13.27 6.77 2.66 0.89 72.16 14.80 9.48
Croatia 4.23 2.11 81.65 11.88 0.13 1.68 0.82 85.88 11.62 0.00 1.73 0.76 84.50 13.00 0.00
Cyprus (e,f) 11.46 29.08 33.12 25.19 1.14 5.15 28.93 38.13 27.49 0.29 4.17 33.91 35.56 25.79 0.57
Lithuania 6.60 7.43 76.01 9.43 0.53 4.24 5.62 80.97 8.41 0.76 5.98 4.45 79.49 9.33 0.74
Malta 7.52 5.05 67.94 19.23 0.26 2.51 4.33 74.66 18.29 0.21 2.54 7.33 67.46 22.53 0.14
Romania 7.16 7.11 72.27 13.43 0.02 3.74 3.96 76.83 15.44 0.03 5.10 6.72 70.57 17.55 0.06
EU average 7.64 17.26 53.36 19.85 1.88 3.59 17.09 57.64 20.18 1.51 3.83 17.28 55.67 21.60 1.61
Eurozone average 8.19 18.42 51.04 20.70 1.65 4.04 18.23 55.71 20.79 1.23 4.17 18.31 53.90 22.31 1.31
a) Data for Denmark, Finland and Sweden refer to 2012, and for Chile, Germany and Turkey to 2013 b) In some countries (those for which information comes from the EU-LFS, plus the United States) it is possible for individuals to report that they do not have usual set hours in their main job. Where this is the case, the individual's actual hours worked in their main job during the survey reference week are used in place of their usual weekly working hours. c) For the United States children aged 0-17 d) For Chile, working hours are based on actual hours worked in the main job in during the survey reference week, rather than usual weekly working hours. e) See note f) to Chart LMF2.2.A f) See note g) to Chart LMF2.2.A Sources: for Chile, CASEN; for European countries, EU-LFS; for Turkey, Turkish Household Labour Force Survey; for the United States, U.S. Current Population Survey

OECD Family Database www.oecd.org/els/family/database.htm OECD - Social Policy Division - Directorate of Employment, Labour and Social Affairs
17 Updated: 16-10-16
Table LMF2.2.F. Distribution of working hours for employed women in couples by presence and number of children, 2014a
Distribution (%) of usual weekly working hoursb by working hours bands for employed women in couples by presence of at least one child aged 0-
14c and the number of children aged 0-14
c
Proportion (%) with usual weekly working hours in the given weekly hours band:
No
information on hours
No
information on hours
No
information on hours
No children aged 0-14 One child aged 0-14 Two or more children aged 0-14
1 to 29 30 to 39 40 to 44 45+ 1 to 29 30 to 39 40 to 44 45+ 1 to 29 30 to 39 40 to 44 45+
Australia .. .. .. .. .. .. .. .. .. .. .. .. .. .. ..
Austria 32.62 28.15 27.70 11.44 0.09 47.39 27.60 18.91 6.08 0.02 64.39 19.90 11.04 4.66 0.00
Belgium 33.06 44.61 11.10 10.50 0.74 31.29 47.03 11.16 10.07 0.45 31.23 47.71 10.51 10.15 0.40
Canada .. .. .. .. .. .. .. .. .. .. .. .. .. .. ..
Chile (d) 21.59 8.38 14.72 55.12 0.19 21.79 7.96 14.28 55.68 0.29 26.17 9.63 13.85 48.67 1.69
Czech Republic 6.16 14.97 70.85 7.97 0.05 7.70 15.89 69.70 6.71 0.00 10.62 17.89 66.52 4.97 0.00
Denmark 20.74 68.39 3.67 7.03 0.16 11.57 79.61 3.83 4.68 0.31 11.67 79.93 3.55 4.72 0.13
Estonia 9.17 7.40 76.82 6.54 0.07 8.48 8.04 79.91 3.39 0.18 15.47 9.84 67.10 7.59 0.00
Finland 11.94 58.97 19.52 6.17 3.40 7.58 62.83 20.32 4.89 4.37 11.41 63.17 17.18 4.74 3.50
France 20.62 52.87 11.04 13.63 1.83 17.70 58.00 11.89 10.70 1.71 24.85 52.84 10.95 10.68 0.67
Germany 37.70 28.41 26.96 6.93 0.00 53.07 25.24 17.94 3.75 0.00 67.41 19.24 10.67 2.68 0.00
Greece 14.51 12.17 44.99 28.31 0.02 16.78 10.89 52.26 20.07 0.00 18.84 12.04 50.49 18.62 0.00
Hungary 4.72 3.74 83.36 4.29 3.89 5.80 4.51 82.92 3.74 3.03 9.47 8.77 76.05 1.70 4.01
Iceland .. .. .. .. .. .. .. .. .. .. .. .. .. .. ..
Ireland 35.24 40.48 17.62 5.64 1.02 33.30 44.46 17.48 3.89 0.87 41.63 39.85 13.73 3.75 1.04
Israel .. .. .. .. .. .. .. .. .. .. .. .. .. .. ..
Italy 32.31 31.21 27.72 8.49 0.28 35.42 28.79 29.07 6.57 0.16 39.91 30.68 23.73 5.51 0.17
Japan .. .. .. .. .. .. .. .. .. .. .. .. .. .. ..
Korea .. .. .. .. .. .. .. .. .. .. .. .. .. .. ..
Latvia 9.27 3.64 82.02 4.62 0.45 9.06 3.55 83.08 3.90 0.40 10.06 4.33 81.14 4.04 0.44
Luxembourg 27.11 13.98 49.37 6.67 2.88 31.51 13.30 51.01 2.34 1.84 34.18 17.98 41.77 2.12 3.95
Mexico .. .. .. .. .. .. .. .. .. .. .. .. .. .. ..
Netherlands 56.84 29.13 11.69 2.34 0.00 63.13 27.13 7.18 2.56 0.00 72.63 22.04 3.87 1.46 0.00
New Zealand .. .. .. .. .. .. .. .. .. .. .. .. .. .. ..
Norway .. .. .. .. .. .. .. .. .. .. .. .. .. .. ..
Poland 10.20 7.60 69.83 12.36 0.00 8.74 6.95 73.76 10.55 0.00 11.17 8.60 70.64 9.58 0.00
Portugal 14.42 12.79 51.22 16.88 4.69 6.56 13.03 62.66 15.15 2.60 7.25 14.18 59.86 16.82 1.88

OECD Family Database www.oecd.org/els/family/database.htm OECD - Social Policy Division - Directorate of Employment, Labour and Social Affairs
18 Updated: 16-10-16
Slovak Republic 5.78 19.94 63.50 10.13 0.65 6.83 19.32 61.50 8.70 3.64 7.46 19.55 61.53 6.20 5.25
Slovenia 9.88 2.34 76.76 11.02 0.00 7.31 2.88 82.36 7.46 0.00 10.00 4.19 78.03 7.78 0.00
Spain 20.96 27.83 37.16 11.34 2.71 24.70 31.03 33.20 9.19 1.88 24.39 33.04 30.73 9.27 2.57
Sweden 16.57 30.46 44.48 6.86 1.62 10.57 37.35 44.07 6.50 1.51 10.89 41.95 40.28 5.89 0.99
Switzerland .. .. .. .. .. .. .. .. .. .. .. .. .. .. ..
Turkey 27.48 12.51 19.96 40.05 0.00 21.43 10.24 25.58 42.76 0.00 36.76 12.53 19.05 31.65 0.00
United Kingdom 32.12 34.78 16.66 15.30 1.13 39.86 32.52 13.70 12.35 1.58 54.85 26.56 8.78 9.05 0.77
United States 17.37 15.40 53.43 13.25 0.54 17.11 15.49 55.41 11.56 0.43 21.03 16.30 50.66 11.43 0.58
OECD-25 average 21.14 24.41 40.49 12.92 1.06 21.79 25.35 40.93 10.93 1.01 26.95 25.31 36.87 9.75 1.12
Bulgaria 2.03 1.46 79.61 11.98 4.92 1.64 1.21 84.76 9.68 2.72 4.27 1.04 81.47 8.39 4.83
Croatia 7.60 2.74 83.42 6.24 0.00 3.76 1.49 89.44 5.31 0.00 4.84 1.72 87.89 5.55 0.00
Cyprus (e,f) 16.34 38.56 28.98 15.71 0.41 16.39 42.39 26.72 14.25 0.25 12.67 52.43 24.56 10.12 0.22
Lithuania 13.24 11.60 69.77 5.20 0.20 8.63 10.43 76.69 2.62 1.63 10.44 7.20 76.38 2.73 3.24
Malta 26.59 17.52 49.89 5.92 0.09 23.04 26.13 46.19 4.64 0.00 35.21 30.12 29.05 4.71 0.92
Romania 12.52 8.80 69.26 9.40 0.01 6.27 5.77 78.53 9.39 0.04 10.90 8.07 70.42 10.45 0.15
EU average 19.30 23.38 46.61 9.60 1.12 19.43 24.55 47.51 7.47 1.04 23.86 24.82 43.14 6.93 1.26
Eurozone average 22.50 25.35 41.25 9.87 1.03 23.59 26.42 41.55 7.38 1.05 28.39 26.33 36.96 7.03 1.28
a) Data for Denmark, Finland and Sweden refer to 2012, and for Chile, Germany and Turkey to 2013 b) In some countries (those for which information comes from the EU-LFS, plus the United States) it is possible for individuals to report that they do not have usual set hours in their main job. Where this is the case, the individual's actual hours worked in their main job during the survey reference week are used in place of their usual weekly working hours. c) For the United States children aged 0-17 d) For Chile, working hours are based on actual hours worked in the main job in during the survey reference week, rather than usual weekly working hours. e) See note f) to Chart LMF2.2.A f) See note g) to Chart LMF2.2.A Sources: for Chile, CASEN; for European countries, EU-LFS; for Turkey, Turkish Household Labour Force Survey; for the United States, U.S. Current Population Survey

OECD Family Database www.oecd.org/els/family/database.htm OECD - Social Policy Division - Directorate of Employment, Labour and Social Affairs
19 Updated: 16-10-16
Table LMF2.2.G. Distribution of working hours for employed men in couples with children by level of education, 2014a
Distribution (%) of usual weekly working hoursb by working hours bands for employed men in couples with at least one child aged 0-14
c, by level
of educationd
Proportion (%) with usual weekly working hours in the given weekly hours band:
No
information on hours
No
information on hours
No
information on hours
Low education Medium education High education
1 to 29 30 to 39 40 to 44 45+ 1 to 29 30 to 39 40 to 44 45+ 1 to 29 30 to 39 40 to 44 45+
Australia .. .. .. .. .. .. .. .. .. .. .. .. .. .. ..
Austria 5.03 27.52 49.19 18.19 0.06 3.64 29.76 38.68 27.89 0.03 4.11 19.49 33.95 42.44 0.01
Belgium 6.40 49.90 27.80 14.94 0.96 3.81 46.77 26.93 21.66 0.83 5.22 37.71 22.53 33.51 1.03
Canada .. .. .. .. .. .. .. .. .. .. .. .. .. .. ..
Chile .. .. .. .. .. .. .. .. .. .. .. .. .. .. ..
Czech Republic 0.00 27.41 51.75 20.84 0.00 0.86 12.07 60.80 26.27 0.00 0.93 3.97 64.18 30.92 0.00
Denmark .. .. .. .. .. .. .. .. .. .. .. .. .. .. ..
Estonia 1.14 2.31 82.51 12.91 1.13 1.79 0.88 86.17 10.66 0.51 4.62 3.72 81.54 9.53 0.58
Finland 3.45 23.22 43.33 22.46 7.53 1.74 29.26 46.15 17.92 4.92 2.56 41.50 35.45 17.34 3.15
France 6.14 62.31 13.98 14.65 2.92 3.07 57.86 16.36 21.57 1.15 4.21 33.99 21.37 40.08 0.36
Germany 11.81 21.94 50.53 15.73 0.00 3.83 26.75 50.96 18.46 0.00 3.18 16.34 46.03 34.45 0.00
Greece 6.42 6.49 40.89 46.19 0.00 3.77 3.44 50.00 42.80 0.00 7.92 7.30 53.65 31.13 0.00
Hungary 2.19 2.58 80.40 7.29 7.53 2.10 1.29 78.64 9.46 8.51 1.51 1.77 81.24 9.52 5.95
Iceland .. .. .. .. .. .. .. .. .. .. .. .. .. .. ..
Ireland 15.36 28.00 27.84 27.56 1.24 10.06 33.09 31.84 23.91 1.10 6.22 34.38 34.34 24.37 0.70
Israel .. .. .. .. .. .. .. .. .. .. .. .. .. .. ..
Italy 6.15 13.63 58.68 21.10 0.44 4.26 20.47 52.70 22.18 0.39 8.13 24.54 39.76 27.09 0.48
Japan .. .. .. .. .. .. .. .. .. .. .. .. .. .. ..
Korea .. .. .. .. .. .. .. .. .. .. .. .. .. .. ..
Latvia 3.44 0.65 87.26 8.28 0.36 2.43 1.86 85.62 9.51 0.59 0.93 1.31 92.69 4.44 0.63
Luxembourg 0.56 1.60 88.06 5.50 4.28 2.20 2.27 82.13 9.93 3.46 3.42 4.76 73.69 14.98 3.15
Mexico .. .. .. .. .. .. .. .. .. .. .. .. .. .. ..
Netherlands 6.88 28.14 51.28 13.70 0.00 4.79 31.35 49.64 14.21 0.00 5.28 35.26 48.38 11.08 0.00
New Zealand .. .. .. .. .. .. .. .. .. .. .. .. .. .. ..
Norway .. .. .. .. .. .. .. .. .. .. .. .. .. .. ..
Poland 2.60 3.78 56.60 37.02 0.00 1.28 1.97 63.67 33.08 0.00 2.81 2.42 72.05 22.71 0.00
Portugal 3.01 5.06 59.22 25.93 6.78 1.30 7.12 56.96 29.84 4.78 3.46 10.42 46.95 34.77 4.41

OECD Family Database www.oecd.org/els/family/database.htm OECD - Social Policy Division - Directorate of Employment, Labour and Social Affairs
20 Updated: 16-10-16
Slovak Republic 51.09 3.90 35.86 8.12 1.03 1.47 8.63 62.75 26.82 0.33 0.67 19.28 56.97 23.02 0.05
Slovenia 6.56 1.15 66.27 26.02 0.00 2.32 0.89 82.13 14.66 0.00 2.12 0.45 81.87 15.56 0.00
Spain 5.53 8.97 52.90 26.63 5.97 6.22 12.64 53.57 24.07 3.51 3.58 20.51 45.50 27.25 3.17
Sweden 6.89 13.26 63.81 13.07 2.98 2.86 15.83 69.96 10.31 1.04 3.46 19.41 64.30 11.83 1.00
Switzerland .. .. .. .. .. .. .. .. .. .. .. .. .. .. ..
Turkey 5.42 4.04 10.31 80.24 0.00 2.07 1.85 19.18 76.90 0.00 2.81 6.68 46.04 44.48 0.00
United Kingdom 12.16 22.61 28.98 33.18 3.07 7.31 22.63 29.72 38.69 1.65 4.21 22.15 28.31 43.88 1.45
United States 6.52 10.87 65.61 16.61 0.38 4.01 6.75 62.18 26.74 0.32 2.79 4.39 55.78 36.83 0.21
OECD-24 average 7.60 16.06 51.87 22.44 2.03 3.36 16.32 54.64 24.24 1.44 3.66 16.16 53.33 25.70 1.14
Bulgaria 8.28 1.19 55.50 22.11 12.92 0.55 0.73 76.75 15.00 6.97 0.49 0.67 83.89 7.64 7.31
Croatia 1.56 0.52 81.99 15.93 0.00 1.90 0.74 84.88 12.48 0.00 1.14 1.02 87.30 10.54 0.00
Cyprus (e,f) 10.28 19.57 42.89 26.26 1.00 4.41 30.27 38.70 25.95 0.67 3.10 37.13 32.61 27.01 0.15
Lithuania 7.17 3.06 80.32 9.09 0.35 4.40 4.92 78.08 11.54 1.05 5.30 5.71 82.64 5.96 0.40
Malta 1.84 3.47 72.09 22.23 0.36 3.05 1.51 78.86 16.57 0.00 3.72 15.03 61.39 19.86 0.00
Romania 9.67 11.04 57.72 21.50 0.07 3.47 4.06 75.82 16.61 0.04 0.68 1.20 89.03 9.08 0.00
EU average 7.47 14.57 55.84 19.87 2.26 3.29 15.15 59.57 20.45 1.54 3.44 15.61 57.84 21.85 1.26
Eurozone average 8.33 16.36 54.26 19.24 1.81 3.61 18.41 56.22 20.53 1.23 4.09 19.41 52.17 23.36 0.96
a) Data for Finland and Sweden refer to 2012, and for Germany and Turkey to 2013 b) In some countries (those for which information comes from the EU-LFS, plus the United States) it is possible for individuals to report that they do not have usual set hours in their main job. Where this is the case, the individual's actual hours worked in their main job during the survey reference week are used in place of their usual weekly working hours. c) For the United States children aged 0-17 d) Educational attainment is measured on a three-part ordinal variable (low education, medium education and high education), with distinctions between the three levels corresponding to the usual ISCED classification system: 'low education' corresponds to a highest level of educational attainment at ISCED 2011 levels 0-2 (early-childhood education, primary or lower secondary education); ‘medium education’ reflects a highest level of educational attainment at ISCED 2011 levels 3-4 (upper secondary and post-secondary non-tertiary education); and ‘high education’ corresponds to a highest level of educational attainment at ISCED 2011 levels 5-8 (short-cycle tertiary education, bachelor or equivalent, master or equivalent, doctoral or equivalent). e) See note f) to Chart LMF2.2.A f) See note g) to Chart LMF2.2.A Sources: for European countries, EU-LFS; for Turkey, Turkish Household Labour Force Survey; for the United States, U.S. Current Population Survey

OECD Family Database www.oecd.org/els/family/database.htm OECD - Social Policy Division - Directorate of Employment, Labour and Social Affairs
21 Updated: 16-10-16
Table LMF2.2.H. Distribution of working hours for employed women in couples with children by level of education, 2014a
Distribution (%) of usual weekly working hoursb by working hours bands for employed women in couples with at least one child aged 0-14
c, by
level of educationd
Proportion (%) with usual weekly working hours in the given weekly hours band:
No
information on hours
No
information on hours
No
information on hours
Low education Medium education High education
1 to 29 30 to 39 40 to 44 45+ 1 to 29 30 to 39 40 to 44 45+ 1 to 29 30 to 39 40 to 44 45+
Australia .. .. .. .. .. .. .. .. .. .. .. .. .. .. ..
Austria 55.38 25.51 14.81 4.30 0.00 58.50 23.74 13.54 4.21 0.02 50.55 23.95 17.92 7.57 0.00
Belgium 51.72 40.35 3.68 3.64 0.60 35.37 49.62 7.50 7.15 0.36 24.59 49.44 13.68 11.87 0.43
Canada .. .. .. .. .. .. .. .. .. .. .. .. .. .. ..
Chile .. .. .. .. .. .. .. .. .. .. .. .. .. .. ..
Czech Republic 8.25 26.73 49.41 15.61 0.00 7.68 17.62 68.69 6.00 0.00 12.56 14.24 68.58 4.62 0.00
Denmark .. .. .. .. .. .. .. .. .. .. .. .. .. .. ..
Estonia 16.07 2.04 75.31 6.58 0.00 9.81 5.59 79.33 5.02 0.25 12.18 11.87 70.77 5.19 0.00
Finland 14.42 56.36 23.80 2.99 2.43 10.86 59.22 19.38 5.45 5.09 8.53 66.10 17.60 4.55 3.23
France 37.19 45.67 8.86 4.98 3.29 22.41 59.32 8.82 8.19 1.26 17.47 54.26 13.90 13.71 0.66
Germany 71.65 14.85 11.46 2.04 0.00 62.12 22.42 13.18 2.28 0.00 50.10 25.57 18.84 5.50 0.00
Greece 19.48 13.73 37.56 29.23 0.00 14.80 8.08 51.43 25.69 0.00 19.81 13.85 56.43 9.92 0.00
Hungary 7.89 5.64 78.85 1.43 6.19 7.88 6.56 79.53 3.16 2.86 6.20 5.80 81.60 2.92 3.48
Iceland .. .. .. .. .. .. .. .. .. .. .. .. .. .. ..
Ireland 61.74 26.20 9.80 1.47 0.79 46.45 37.31 12.41 2.76 1.07 32.77 44.86 16.91 4.62 0.83
Israel .. .. .. .. .. .. .. .. .. .. .. .. .. .. ..
Italy 42.32 20.05 29.20 8.09 0.34 36.06 29.58 28.29 5.96 0.11 36.02 35.94 22.80 5.10 0.15
Japan .. .. .. .. .. .. .. .. .. .. .. .. .. .. ..
Korea .. .. .. .. .. .. .. .. .. .. .. .. .. .. ..
Latvia 19.13 2.17 64.31 14.39 0.00 7.19 2.80 84.58 4.86 0.58 10.24 4.87 82.52 2.05 0.32
Luxembourg 40.67 18.07 33.56 0.00 7.70 37.26 15.57 42.26 1.43 3.48 28.09 15.06 52.24 3.12 1.50
Mexico .. .. .. .. .. .. .. .. .. .. .. .. .. .. ..
Netherlands 80.67 13.01 4.66 1.66 0.00 77.88 17.10 3.37 1.65 0.00 56.51 34.27 7.07 2.16 0.00
New Zealand .. .. .. .. .. .. .. .. .. .. .. .. .. .. ..
Norway .. .. .. .. .. .. .. .. .. .. .. .. .. .. ..
Poland 15.39 9.68 57.90 17.03 0.00 8.86 7.19 69.96 13.99 0.00 10.36 8.01 75.48 6.16 0.00
Portugal 9.31 8.41 64.83 15.26 2.18 5.86 12.85 65.89 13.24 2.16 4.96 19.13 54.98 18.24 2.68

OECD Family Database www.oecd.org/els/family/database.htm OECD - Social Policy Division - Directorate of Employment, Labour and Social Affairs
22 Updated: 16-10-16
Slovak Republic 52.39 6.74 37.27 1.55 2.05 5.92 15.88 66.53 8.70 2.98 4.06 29.83 53.02 4.98 8.11
Slovenia 10.66 2.40 73.96 12.98 0.00 10.52 3.64 77.84 8.01 0.00 6.71 3.59 82.97 6.73 0.00
Spain 36.06 16.55 33.00 11.12 3.28 29.93 24.86 33.55 9.58 2.08 17.91 40.98 31.06 8.28 1.78
Sweden 18.23 35.42 39.40 4.97 1.97 13.84 45.11 37.11 2.59 1.35 7.31 36.73 45.87 9.12 0.97
Switzerland .. .. .. .. .. .. .. .. .. .. .. .. .. .. ..
Turkey 38.79 11.04 10.90 39.27 0.00 15.54 5.12 26.69 52.65 0.00 9.70 16.24 52.37 21.69 0.00
United Kingdom 62.92 23.35 7.39 5.03 1.30 53.83 28.10 10.28 6.72 1.07 40.35 31.42 12.66 14.52 1.04
United States 25.12 21.54 47.33 5.49 0.52 20.76 17.52 53.55 7.72 0.46 17.81 14.49 52.71 14.45 0.55
OECD-24 average 34.58 19.37 35.53 9.09 1.42 26.06 22.38 41.47 9.00 1.10 21.08 26.11 43.56 8.13 1.12
Bulgaria 12.00 0.79 62.25 16.72 8.24 2.33 0.15 81.48 12.04 4.00 0.84 2.19 89.98 5.07 1.91
Croatia 21.73 7.95 62.16 8.16 0.00 3.96 1.24 87.99 6.81 0.00 2.48 1.38 93.55 2.60 0.00
Cyprus (e,f) 28.91 19.17 20.22 30.56 1.14 14.87 35.77 32.27 16.75 0.34 12.26 59.10 21.76 6.82 0.07
Lithuania 14.29 8.94 64.59 4.82 7.36 9.24 8.41 74.76 4.13 3.46 9.11 9.72 78.34 1.67 1.15
Malta 36.99 18.07 40.63 3.98 0.32 28.40 19.64 47.36 4.02 0.58 22.15 42.39 29.24 5.98 0.25
Romania 20.00 17.20 48.59 14.22 0.00 6.32 4.44 78.49 10.70 0.05 1.51 2.47 91.48 4.35 0.20
EU average 32.05 17.96 39.17 8.99 1.82 23.26 20.81 47.25 7.45 1.23 18.73 25.44 48.19 6.57 1.06
Eurozone average 36.79 18.86 34.29 8.40 1.66 27.55 23.76 40.12 7.32 1.25 22.32 30.78 39.06 6.74 1.11
a) Data for Finland and Sweden refer to 2012, and for Germany and Turkey to 2013 b) In some countries (those for which information comes from the EU-LFS, plus the United States) it is possible for individuals to report that they do not have usual set hours in their main job. Where this is the case, the individual's actual hours worked in their main job during the survey reference week are used in place of their usual weekly working hours. c) For the United States children aged 0-17 d) Educational attainment is measured on a three-part ordinal variable (low education, medium education and high education), with distinctions between the three levels corresponding to the usual ISCED classification system: 'low education' corresponds to a highest level of educational attainment at ISCED 2011 levels 0-2 (early-childhood education, primary or lower secondary education); ‘moderate education’ reflects a highest level of educational attainment at ISCED 2011 levels 3-4 (upper secondary and post-secondary non-tertiary education); and ‘high education’ corresponds to a highest level of educational attainment at ISCED 2011 levels 5-8 (short-cycle tertiary education, bachelor or equivalent, master or equivalent, doctoral or equivalent). e) See note f) to Chart LMF2.2.A f) See note g) to Chart LMF2.2.A Sources: for European countries, EU-LFS; for Turkey, Turkish Household Labour Force Survey; for the United States, U.S. Current Population Survey


![[4] Working Conditions/Labour Relations - mhlw.go.jp · 116 Measures for Working Hours Overview Major Measures for Working Hours (FY2011) Implementation of inspection and group guidance,](https://static.fdocuments.net/doc/165x107/5b6d15e07f8b9a0d578c6e16/4-working-conditionslabour-relations-mhlwgojp-116-measures-for-working.jpg)