Lloyds Banking Group plc 2016 Half-Year Pillar 3 disclosures 28 ...
25
Lloyds Banking Group plc 2016 Half-Year Pillar 3 disclosures 28 July 2016
Transcript of Lloyds Banking Group plc 2016 Half-Year Pillar 3 disclosures 28 ...
Lloyds Banking Group plc
2016 Half-Year
Pillar 3 disclosures
28 July 2016

LLOYDS BANKING GROUP PLC 2016 HALF-YEAR PILLAR 3 DISCLOSURES
Page 1 of 24
BASIS OF PRESENTATION
This report presents the condensed half-year Pillar 3 disclosures of Lloyds Banking Group plc (‘the Group’) as at 30 June
2016, prepared in accordance with European Banking Authority (EBA) guidelines on Pillar 3 disclosure frequency. The
report should be read in conjunction with the 2016 Lloyds Banking Group Half-Year Results News Release.
The EBA guidelines on Pillar 3 disclosure frequency set out key information that institutions in the EU banking sector
should consider disclosing on a more frequent than annual basis under Pillar 3. The Group’s assessment of these
guidelines has resulted in the disclosure of specific capital and leverage information at the interim quarter ends, with
further detailed analysis provided at half-year as covered by this report. These half-year disclosures remain in addition to
the full annual disclosure of the Group’s Pillar 3 report. Risk-weighted assets by type of risk are included in the individual
half-year Management Reports for the Group’s significant subsidiaries; ‘Lloyds Bank Group’ and ‘Bank of Scotland
Group’.
A number of significant differences exist between accounting disclosures published in accordance with International
Financial Reporting Standards (IFRS) and Pillar 3 disclosures published in accordance with prudential requirements
which prevent direct comparison in a number of areas. Of particular note are the differences surrounding scope of
consolidation, the definition of credit risk exposure and the recognition, classification and valuation of capital securities.
Unless otherwise specified, credit risk exposures are defined as the exposure at default (EAD), prior to the application of
credit risk mitigation (CRM). EAD is defined as the aggregate of drawn (on balance sheet) exposures, undrawn (off
balance sheet) commitments and contingent liabilities, after application of credit conversion factors (CCF), and other
relevant regulatory adjustments. Notable exceptions to this definition include securitisation positions and counterparty
credit risk exposures. A summary, noting the definitions applied, is provided below.
Exposure type Exposure type
Credit risk exposures (excluding securitisation positions) EAD pre CRM1
Counterparty credit risk exposures EAD post CRM
Securitisation positions The aggregate of the Group’s retained or purchased positions, excluding those positions rated below BB- or that are unrated and therefore deducted from capital.
1
For credit risk exposures risk-weighted under the Standardised Approach the EAD pre CRM value is stated net of specific credit risk adjustments (SCRAs). SCRAs relating to credit risk exposures risk-weighted under a relevant Internal Ratings Based (IRB) Approach methodology are netted against expected losses.
FORWARD LOOKING STATEMENTS This document contains certain forward looking statements with respect to the business, strategy and plans of Lloyds Banking Group and its current goals and expectations relating to its future financial condition and performance. Statements that are not historical facts, including statements about Lloyds Banking Group’s or its directors’ and/or management’s beliefs and expectations, are forward looking statements. By their nature, forward looking statements involve risk and uncertainty because they relate to events and depend upon circumstances that will or may occur in the future. Factors that could cause actual business, strategy, plans and/or results (including but not limited to the payment of dividends) to differ materially from the plans, objectives, expectations, estimates and intentions expressed in such forward looking statements made by the Group or on its behalf include, but are not limited to: general economic and business conditions in the UK and internationally; market related trends and developments; fluctuations in interest rates (including low or negative rates), exchange rates, stock markets and currencies; the ability to access sufficient sources of capital, liquidity and funding when required; changes to the Group’s credit ratings; the ability to derive cost savings; changing customer behaviour including consumer spending, saving and borrowing habits; changes to borrower or counterparty credit quality; instability in the global financial markets, including Eurozone instability, the exit by the UK from the European Union (EU) and the potential for one or more other countries to exit the EU or the Eurozone and the impact of any sovereign credit rating downgrade or other sovereign financial issues; technological changes and risks to cyber security; natural, pandemic and other disasters, adverse weather and similar contingencies outside the Group’s control; inadequate or failed internal or external processes or systems; acts of war, other acts of hostility, terrorist acts and responses to those acts, geopolitical, pandemic or other such events; changes in laws, regulations, accounting standards or taxation, including as a result of an exit by the UK from the EU, a further possible referendum on Scottish independence; changes to regulatory capital or liquidity requirements and similar contingencies outside the Group’s control; the policies, decisions and actions of governmental or regulatory authorities or courts in the UK, the EU, the US or elsewhere including the implementation and interpretation of key legislation and regulation; the ability to attract and retain senior management and other employees; requirements or limitations on the Group as a result of HM Treasury’s investment in the Group; actions or omissions by the Group’s directors, management or employees including industrial action; changes to the Group’s post-retirement defined benefit scheme obligations; the provision of banking operations services to TSB Banking Group plc; the extent of any future impairment charges or write-downs caused by, but not limited to, depressed asset valuations, market disruptions and illiquid markets; the value and effectiveness of any credit protection purchased by the Group; the inability to hedge certain risks economically; the adequacy of loss reserves; the actions of competitors, including non-bank financial services and lending companies; and exposure to regulatory or competition scrutiny, legal, regulatory or competition proceedings, investigations or complaints. Please refer to the latest Annual Report on Form 20-F filed with the US Securities and Exchange Commission for a discussion of certain factors together with examples of forward looking statements. Except as required by any applicable law or regulation, the forward looking statements contained in this document are made as of today’s date, and Lloyds Banking Group expressly disclaims any obligation or undertaking to release publicly any updates or revisions to any forward looking statements. The information, statements and opinions contained in this document do not constitute a public offer under any applicable law or an offer to sell any securities or financial instruments or any advice or recommendation with respect to such securities or financial instruments.

LLOYDS BANKING GROUP PLC 2016 HALF-YEAR PILLAR 3 DISCLOSURES
Page 2 of 24
Contents
Table 1: Risk-weighted assets movement by key driver
Table 2: Capital requirements
Table 3: Credit risk exposures
Table 4: Corporate master scale
Table 5: Retail master scale
Table 6: Corporate Main exposure by PD grade
Table 7: Corporate SME exposure by PD grade
Table 8: Central governments and central bank exposures by PD grade
Table 9: Institution exposures by PD grade
Table 10: Residential mortgages (SME) exposures by PD grade
Table 11: Residential mortgages (non-SME) exposures by PD grade
Table 12: Qualifying revolving retail exposures by PD grade
Table 13: Other SME exposures by PD grade
Table 14: Other non-SME exposures by PD grade
Table 15: Corporate Specialised Lending exposures subject to supervisory slotting
Table 16: Lloyds Banking Group own funds template
Table 17: Lloyds Banking Group leverage ratio common disclosure
Table 18: Lloyds Banking Group summary reconciliation of accounting assets and leverage ratio exposures
2016 Half-Year Pillar 3 Update
The following disclosures include information on Lloyds Banking Group’s own-funds, leverage, risk-weighted assets and
capital requirements by type of risk and by exposure class. Additional detail has been included in relation to the Group’s
exposures subject to the Internal Ratings Based (IRB) approach.
At 30 June 2016
At 31 Dec 2015
Key ratios and risk-weighted assets
Fully loaded common equity tier 1 (CET1) capital ratio2 13.0% 13.0%
Fully loaded tier 1 capital ratio 15.4% 15.2%
Fully loaded total capital ratio 18.7% 18.0%
Fully loaded total risk-weighted assets £222,297m £222,747m
Transitional CET1 capital ratio 13.1% 12.8%
Transitional tier 1 capital ratio 16.4% 16.4%
Transitional total capital ratio 21.8% 21.5%
Transitional total risk-weighted assets £222,778m £222,845m
Leverage ratio1,2
4.7% 4.8%
Average leverage ratio3 4.8%
1
Reported on a fully loaded basis. 2
The common equity tier 1 and leverage ratios at 31 December 2015 were reported on a pro forma basis, including the dividend paid by the Insurance business in February 2016 relating to 2015.
3 The average leverage ratio is based on the average of the month end tier 1 capital and exposure measures over the quarter (1 April 2016 to 30 June 2016). The average of 4.8 per cent compares to 4.7 per cent at the start and end of the quarter.

LLOYDS BANKING GROUP PLC 2016 HALF-YEAR PILLAR 3 DISCLOSURES
Page 3 of 24
Table 1: Risk-weighted assets movement by key driver
Credit risk IRB
Credit risk STA
Credit risk
Counterparty credit
risk3
Market risk
Operational risk Total
£m £m £m £m £m £m £m
Fully loaded risk-weighted assets as at 31 December 2015
222,747
Less total threshold risk-weighted assets
1, 2
(10,690)
Risk-weighted assets as at 31 December 2015 151,563 20,443 172,006 10,153 3,775 26,123 212,057
Asset size (1,940) (831) (2,771) (1,220) (137) – (4,128)
Acquisitions and disposals (1,686) – (1,686) 38 – – (1,648)
Model updates 3,229 (28) 3,201 99 (418) – 2,882
Methodology and policy (327) 121 (206) – – – (206)
Asset quality (1,931) 143 (1,788) 1,203 (64) – (649)
Movement in risk levels – – – – (215) – (215)
Foreign exchange movements 2,506 420 2,926 453 (19) – 3,360
Risk-weighted assets as at
30 June 2016 151,414 20,268 171,682 10,726 2,922 26,123 211,453
Threshold risk-weighted assets1
11,325
Transitional risk-weighted assets as at 30June 2016
222,778
Movement to fully loaded risk-weighted assets
2
(481)
Fully loaded risk-weighted assets as at 30 June 2016
222,297 1
Threshold risk-weighted assets reflect the element of significant investments and deferred tax assets that are permitted to be risk-weighted instead of deducted from CET1 capital. Significant investments primarily arise from the investment in the Group’s Insurance business.
2 Differences may arise between transitional and fully loaded threshold risk-weighted assets where deferred tax assets reliant on future profitability and arising from temporary timing differences and significant investments exceed the fully loaded threshold limit, resulting in an increase in amounts deducted from CET1 capital rather than being risk-weighted.
3 Counterparty credit risk includes movements in contributions to the default fund of central counterparties and movements in credit valuation adjustment risk.
The risk-weighted assets movement table provides analysis of the reduction in risk-weighted assets in the period by risk
type and an insight into the key drivers of the movements. The key driver analysis is compiled on a monthly basis
through the identification and categorisation of risk-weighted asset movements and is subject to management judgment.
Movements in credit risk-weighted assets in the six months to 30 June 2016 were driven by the following:
Asset size movements include risk-weighted asset movements arising from new lending and asset run-off. During the
six months to 30 June, credit risk-weighted assets assessed on both Standardised and Internal Ratings Based
approaches decreased by £2.8 billion primarily due to repayments and exits, partly offset by growth in targeted
customer segments.
Disposal of the Group’s interest in Visa Europe and further disposals within the run-off business reduced credit risk-
weighted assets by £1.7 billion.
Model update increases of £3.2 billion were mainly driven by a change in approach for the Retail Buy-to-let mortgage
portfolio and other small model refinements.
Methodology and policy movements include changes due to refinements in the application of regulatory policy.
Asset quality movements capture movements in the assessed quality of assets due to changes in borrower risk,
including changes in the economic environment. Net reductions in credit risk-weighted assets of £1.8 billion primarily
relate to model calibrations and a net change in credit quality, partially offset by increases in valuation of centrally
held strategic equity investments.
Foreign exchange movements reflect the depreciation of Sterling which has contributed to a £2.9 billion increase in
credit risk-weighted assets of which £2.3 billion arose in the final week of June following the outcome of the
EU referendum.

LLOYDS BANKING GROUP PLC 2016 HALF-YEAR PILLAR 3 DISCLOSURES
Page 4 of 24
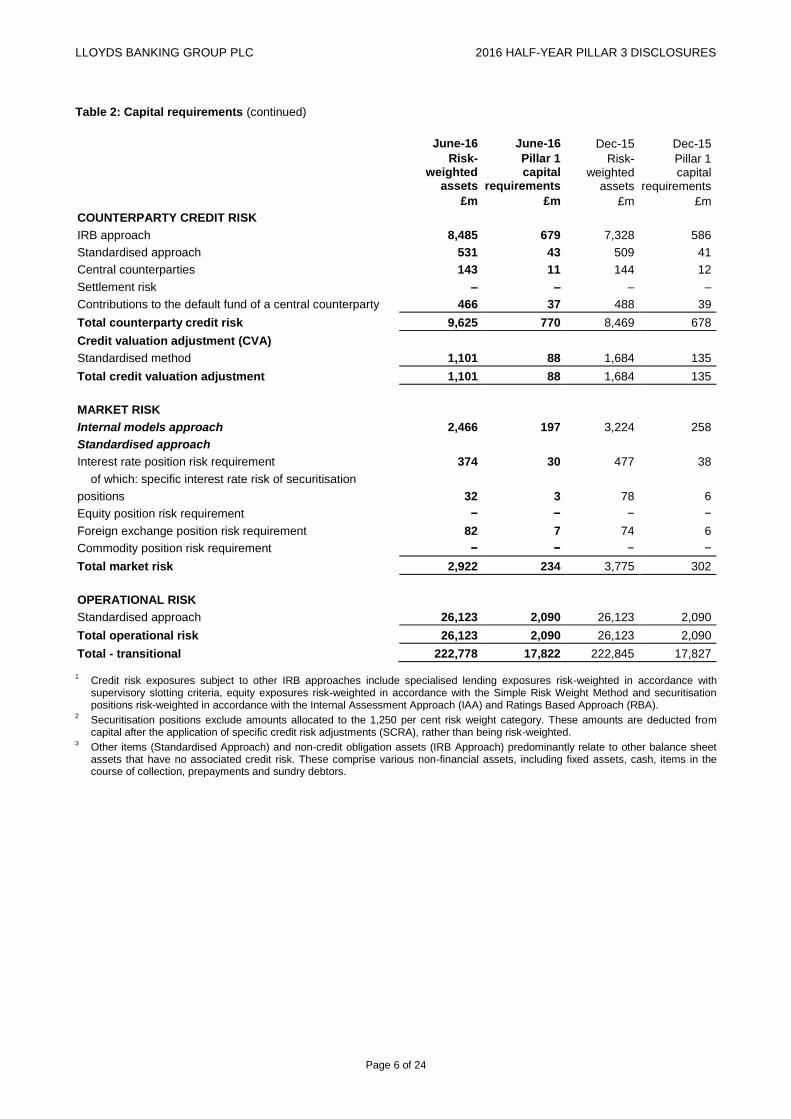
Counterparty credit risk and CVA risk increases of £0.6 billion are principally driven by yield curve and foreign
exchange movements of which £0.9 billion arose in the final week of June following the outcome of the EU referendum,
partially offset by increased capital relief from CVA related hedges.
Market risk-weighted assets reduced by £0.9 billion due to a reduction in the Value-at-Risk multiplier and active
portfolio management.

LLOYDS BANKING GROUP PLC 2016 HALF-YEAR PILLAR 3 DISCLOSURES
Page 5 of 24
The risk-weighted assets and Pillar 1 capital requirements, by key regulatory risk type, of the Group as at 30 June 2016
are presented in the table below.
Table 2: Capital requirements
June-16 June-16 Dec-15 Dec-15 Risk-
weighted assets
Pillar 1 capital
requirements
Risk- weighted
assets
Pillar 1 capital
requirements
CREDIT RISK £m £m £m £m
Exposures subject to the IRB approach
Foundation IRB approach
Corporate – main 43,103 3,448 43,005 3,441
Corporate – SME 8,471 678 8,814 705
Corporate − specialised lending 6 1 8 1
Central governments and central banks 1,661 133 1,347 108
Institutions 1,216 97 1,430 114
Retail IRB approach
Retail mortgages 39,032 3,122 38,252 3,060
of which: residential mortgages (SME) 2,891 231 3,214 257
of which: residential mortgages (non-SME) 36,141 2,891 35,038 2,803
Qualifying revolving retail exposures 12,066 965 12,501 1,000
Other SME 1,766 141 1,807 145
Other non-SME 11,523 922 11,352 908
Other IRB approaches1
Corporate − specialised lending 14,296 1,144 14,386 1,151
Equities − exchange traded 2,484 199 2,837 227
Equities − private equity 5,649 452 5,664 453
Equities − other 1,321 106 1,392 111
Securitisation positions2 3,069 245 3,266 261
Non-credit obligation assets3 5,751 460 5,502 440
Total − IRB approach 151,414 12,113 151,563 12,125
Exposures subject to the standardised approach
Central governments and central banks − − − −
Regional governments or local authorities − − − −
Public sector entities 3 − 2 −
Multilateral development banks − − − −
Institutions 36 3 24 2
Corporates 11,829 946 11,921 954
Retail 3,088 247 2,880 230
Secured by mortgages on immovable property 2,092 167 2,109 168
of which: residential property 2,063 165 2,078 166
of which: commercial property 29 2 31 2
Exposures in default 1,074 86 1,198 96
Other items3 2,146 172 2,309 185
Total − standardised approach 20,268 1,621 20,443 1,635
Total credit risk 171,682 13,734 172,006 13,760
Threshold − significant investments 8,349 668 7,817 625
Threshold − deferred tax 2,976 238 2,971 238
Total credit risk (transitional) 183,007 14,640 182,794 14,623
LLOYDS BANKING GROUP PLC 2016 HALF-YEAR PILLAR 3 DISCLOSURES
Page 6 of 24
Table 2: Capital requirements (continued)
June-16 June-16 Dec-15 Dec-15
Risk- weighted
assets
Pillar 1 capital
requirements
Risk- weighted
assets
Pillar 1 capital
requirements
£m £m £m £m
COUNTERPARTY CREDIT RISK
IRB approach 8,485 679 7,328 586
Standardised approach 531 43 509 41
Central counterparties 143 11 144 12
Settlement risk – – – –
Contributions to the default fund of a central counterparty 466 37 488 39
Total counterparty credit risk 9,625 770 8,469 678
Credit valuation adjustment (CVA)
Standardised method 1,101 88 1,684 135
Total credit valuation adjustment 1,101 88 1,684 135
MARKET RISK
Internal models approach 2,466 197 3,224 258
Standardised approach
Interest rate position risk requirement 374 30 477 38
of which: specific interest rate risk of securitisation
positions 32 3 78 6
Equity position risk requirement − − − −
Foreign exchange position risk requirement 82 7 74 6
Commodity position risk requirement − − − −
Total market risk 2,922 234 3,775 302
OPERATIONAL RISK
Standardised approach 26,123 2,090 26,123 2,090
Total operational risk 26,123 2,090 26,123 2,090
Total - transitional 222,778 17,822 222,845 17,827
1
Credit risk exposures subject to other IRB approaches include specialised lending exposures risk-weighted in accordance with supervisory slotting criteria, equity exposures risk-weighted in accordance with the Simple Risk Weight Method and securitisation positions risk-weighted in accordance with the Internal Assessment Approach (IAA) and Ratings Based Approach (RBA).
2 Securitisation positions exclude amounts allocated to the 1,250 per cent risk weight category. These amounts are deducted from capital after the application of specific credit risk adjustments (SCRA), rather than being risk-weighted.
3 Other items (Standardised Approach) and non-credit obligation assets (IRB Approach) predominantly relate to other balance sheet assets that have no associated credit risk. These comprise various non-financial assets, including fixed assets, cash, items in the course of collection, prepayments and sundry debtors.
LLOYDS BANKING GROUP PLC 2016 HALF-YEAR PILLAR 3 DISCLOSURES
Page 7 of 24
Table 3: Credit risk exposures
June-16 June-16 June-16 Dec-15 Dec-15 Dec-15
Credit risk
exposure
Risk- weighted
assets
Average risk
weight
Credit risk
exposure
Risk- weighted
assets
Average risk
weight
Exposure class £m £m % £m £m %
Exposures subject to the IRB approach
Foundation IRB approach
Corporate – main 80,887 43,103 53% 80,629 43,005 53%
Corporate – SME 12,833 8,471 66% 12,964 8,814 68%
Corporate − specialised lending 5 6 128% 6 8 120%
Central governments and central banks 20,844 1,661 8% 15,716 1,347 9%
Institutions 6,697 1,216 18% 7,364 1,430 19%
Retail IRB approach
Retail mortgages 338,264 39,032 12% 341,807 38,252 11%
of which: residential mortgages (SME) 10,462 2,891 28% 10,517 3,214 31%
of which: residential mortgages (non-SME) 327,802 36,141 11% 331,290 35,038 11%
Qualifying revolving retail exposures 37,424 12,066 32% 36,975 12,501 34%
Other SME 2,493 1,766 71% 2,661 1,807 68%
Other non-SME 15,351 11,523 75% 14,331 11,352 79%
Other IRB approaches1
Corporate − specialised lending 19,836 14,296 72% 19,887 14,386 72%
Equities − exchange traded 857 2,484 290% 978 2,837 290%
Equities − private equity 2,973 5,649 190% 2,981 5,664 190%
Equities − other 357 1,321 370% 376 1,392 370%
Securitisation positions2 20,853 3,069 15% 22,125 3,266 15%
Non-credit obligation assets3 9,387 5,751 61% 9,228 5,502 60%
Total − IRB approach 569,061 151,414 27% 568,028 151,563 27%
Exposures subject to the standardised approach
Central governments and central banks 99,949 – – 88,415 – –
Regional governments or local authorities 1 – 20% 1 – 20%
Public sector entities 3 3 100% 2 2 100%
Multilateral development banks 1,436 – – 997 – –
Institutions 195 36 18% 170 24 14%
Corporates 14,185 11,829 83% 14,463 11,921 82%
Retail 4,735 3,088 65% 4,438 2,880 65%
Secured by mortgages on immovable property 5,783 2,092 36% 5,840 2,109 36%
of which: residential property 5,754 2,063 36% 5,809 2,078 36%
of which: commercial property 29 29 100% 31 31 100%
Exposures in default 923 1,074 116% 1,005 1,198 119%
Other items3 3,324 2,146 65% 3,204 2,309 72%
Total − standardised approach 130,534 20,268 16% 118,535 20,443 17%
Total credit risk 699,595 171,682 25% 686,563 172,006 25%
Threshold – significant investments 3,340 8,349 250% 3,127 7,817 250%
Threshold – deferred tax 1,191 2,976 250% 1,188 2,971 250%
Total credit risk (transitional) 704,126 183,007 26% 690,878 182,794 26% 1
Credit risk exposures subject to other IRB approaches include corporate specialised lending exposures risk-weighted in accordance with supervisory slotting criteria, equity exposures risk-weighted in accordance with the Simple Risk Weight Method and securitisation positions risk-weighted in accordance with the IAA and the RBA.
2 Securitisation positions exclude amounts allocated to the 1,250 per cent risk weight category. These amounts are deducted from capital, after the application of SCRAs, rather than being risk-weighted at 1,250 per cent.
3 Other items (Standardised Approach) and non−credit obligation assets (IRB approach) predominantly relate to other balance sheet assets that have no associated credit risk. These comprise various non−financial assets, including fixed assets, cash, items in the course of collection, prepayments and sundry debtors.

LLOYDS BANKING GROUP PLC 2016 HALF-YEAR PILLAR 3 DISCLOSURES
Page 8 of 24
Exposures subject to the IRB approach – key movements
FIRB Corporate Main
Overall Corporate Main exposures have remained relatively flat, with underlying reductions driven by active portfolio
management, offset by the impact of Sterling depreciation, particularly in the last week of June.
FIRB Corporate SME
The average risk-weight on FIRB Corporate SME lending has reduced to 66 per cent, driven by targeted new lending
which has resulted in an overall improvement in credit quality. This has also led to a reduction in the average PD.
FIRB Central governments and central banks
FIRB Central governments and central banks exposures increased by £5.1 billion driven by an increase in deposits
with the Federal Reserve.
Retail IRB Residential mortgages
Retail IRB residential mortgage exposures decreased by £3.5 billion reflecting the Group’s focus on balancing margin
and risk considerations with volume growth in the current competitive low growth market. The small increase in
average risk weight was driven by model updates.
Retail Qualifying revolving
Retail IRB Qualifying revolving retail exposures increased by £0.4 billion largely due to targeted growth in credit
cards. The average risk weight reduced from 34 per cent to 32 per cent largely due to improved asset quality.
Retail Other non-SME
Retail other (non-SME) exposures have increased by £1.0 billion and average risk weights have reduced from 79 per
cent to 75 per cent primarily as a result of continued growth in UK Motor Finance
Equities
There was a minimal reduction in equities compared to December 2015 as the impact of disposals of certain strategic
investments (including Visa Europe) was largely offset by increases in the valuation of centrally held investments.
Securitisation positions
Securitisation exposures decreased by £1.3 billion mainly due to net sales in the period.
Exposures subject to the Standardised Approach – key movements
Standardised Central governments and central banks
Standardised central governments and central banks’ exposures increased by £11.5 billion primarily due to
management of the liquid asset portfolio, specifically placement of funds with European sovereigns, primarily
Netherlands.
LLOYDS BANKING GROUP PLC 2016 HALF-YEAR PILLAR 3 DISCLOSURES
Page 9 of 24
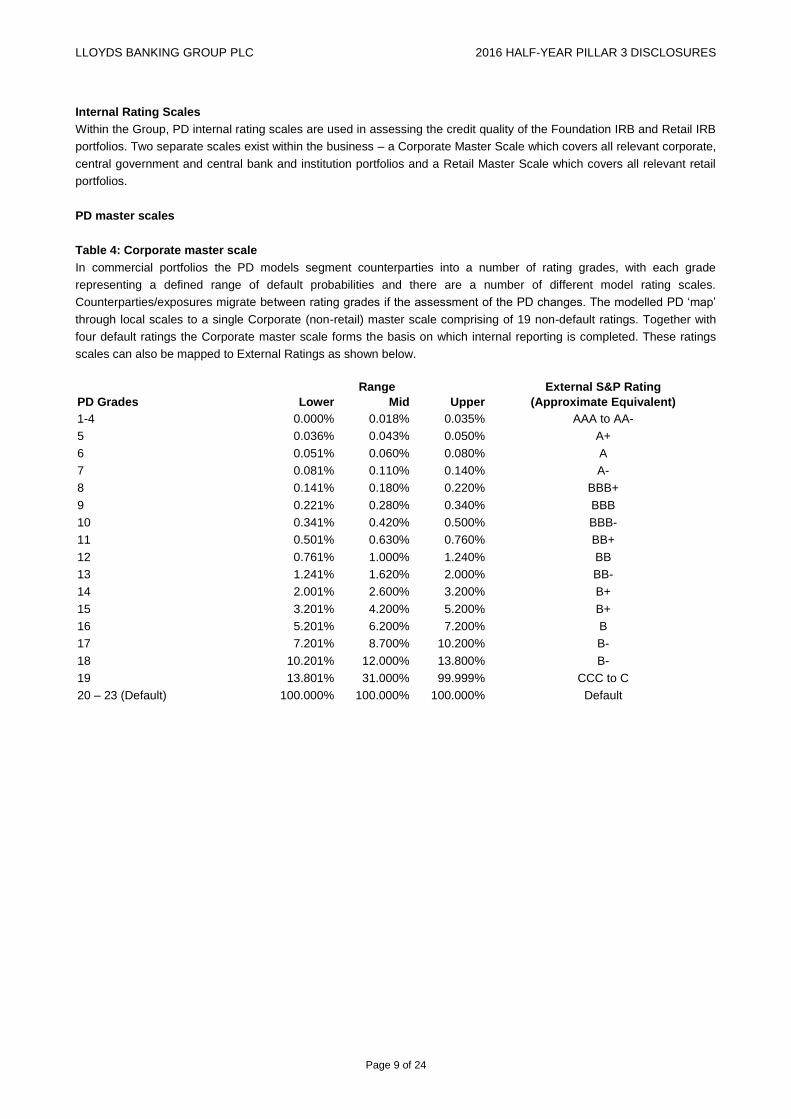
Internal Rating Scales
Within the Group, PD internal rating scales are used in assessing the credit quality of the Foundation IRB and Retail IRB
portfolios. Two separate scales exist within the business – a Corporate Master Scale which covers all relevant corporate,
central government and central bank and institution portfolios and a Retail Master Scale which covers all relevant retail
portfolios.
PD master scales
Table 4: Corporate master scale
In commercial portfolios the PD models segment counterparties into a number of rating grades, with each grade
representing a defined range of default probabilities and there are a number of different model rating scales.
Counterparties/exposures migrate between rating grades if the assessment of the PD changes. The modelled PD ‘map’
through local scales to a single Corporate (non-retail) master scale comprising of 19 non-default ratings. Together with
four default ratings the Corporate master scale forms the basis on which internal reporting is completed. These ratings
scales can also be mapped to External Ratings as shown below.
Range External S&P Rating
PD Grades Lower Mid Upper (Approximate Equivalent)
1-4 0.000% 0.018% 0.035% AAA to AA-
5 0.036% 0.043% 0.050% A+
6 0.051% 0.060% 0.080% A
7 0.081% 0.110% 0.140% A-
8 0.141% 0.180% 0.220% BBB+
9 0.221% 0.280% 0.340% BBB
10 0.341% 0.420% 0.500% BBB-
11 0.501% 0.630% 0.760% BB+
12 0.761% 1.000% 1.240% BB
13 1.241% 1.620% 2.000% BB-
14 2.001% 2.600% 3.200% B+
15 3.201% 4.200% 5.200% B+
16 5.201% 6.200% 7.200% B
17 7.201% 8.700% 10.200% B-
18 10.201% 12.000% 13.800% B-
19 13.801% 31.000% 99.999% CCC to C
20 – 23 (Default) 100.000% 100.000% 100.000% Default

LLOYDS BANKING GROUP PLC 2016 HALF-YEAR PILLAR 3 DISCLOSURES
Page 10 of 24
Table 5: Retail master scale
In the principal retail portfolios, EAD and loss given default models are also in use. For reporting purposes, customers
are segmented into a number of rating grades, each representing a defined range of default probabilities and exposures
migrate between rating grades if the assessment of the counterparty PD changes. The Retail master scale comprises
13 non-default ratings and one default rating.
Range
PD Grades Lower Mid Upper
0 0.000% 0.050% 0.100%
1 0.101% 0.251% 0.400%
2 0.401% 0.601% 0.800%
3 0.801% 1.001% 1.200%
4 1.201% 1.851% 2.500%
5 2.501% 3.501% 4.500%
6 4.501% 6.001% 7.500%
7 7.501% 8.751% 10.000%
8 10.001% 12.001% 14.000%
9 14.001% 17.001% 20.000%
10 20.001% 25.001% 30.000%
11 30.001% 37.501% 45.000%
12 45.001% 72.500% 99.999%
Default 100.000% 100.000% 100.000%
Analysis of credit risk exposures subject to the Foundation IRB Approach
The section that follows provides a detailed analysis, by PD Grade, of credit risk exposures subject to the Foundation
IRB approach.
Disclosures provided in the tables that follow take into account PD floors and LGD floors specified by regulators in
respect of the calculation of regulatory capital requirements.
LLOYDS BANKING GROUP PLC 2016 HALF-YEAR PILLAR 3 DISCLOSURES
Page 11 of 24
Table 6: Corporate Main exposure by PD grade
June-16 June-16 June-16 Dec-15 Dec-15 Dec-15
Credit risk
exposure
Exposure weighted
average PD
Average risk
weight
Credit risk
exposure
Exposure weighted average
PD
Average risk
weight
£m % % £m % %
PD Grades
1 − 4 9,823 0.03% 22.82% 9,675 0.03% 22.93%
5 2,957 0.04% 25.91% 2,872 0.04% 28.29%
6 5,929 0.06% 21.68% 5,879 0.06% 22.61%
7 11,494 0.11% 32.41% 11,489 0.11% 32.37%
8 11,791 0.18% 41.34% 12,507 0.18% 42.08%
9 11,161 0.28% 55.01% 10,342 0.28% 55.17%
10 9,384 0.42% 65.15% 9,714 0.42% 65.34%
11 5,123 0.63% 77.50% 5,396 0.63% 78.40%
12 4,932 1.01% 92.06% 4,753 1.00% 92.06%
13 3,377 1.63% 108.87% 2,864 1.63% 110.86%
14 2,158 2.60% 126.05% 2,567 2.60% 127.72%
15 402 4.18% 144.87% 677 4.14% 134.21%
16 848 6.19% 154.58% 293 6.20% 155.32%
17 332 8.73% 201.26% 424 8.73% 176.91%
18 72 11.80% 217.89% 36 11.72% 230.78%
19 137 24.89% 240.42% 155 19.94% 227.16%
20 – 23 (Default) 967 100.00% – 986 100.00% –
Total 80,887 1.75% 53.29% 80,629 1.75% 53.34%
Table 7: Corporate SME exposure by PD grade
June-16 June-16 June-16 Dec-15 Dec-15 Dec-15
Credit risk
exposure
Exposure weighted
average PD
Average risk
weight
Credit risk
exposure
Exposure weighted average
PD
Average risk
weight
£m % % £m % %
PD Grades
1 − 4 139 0.03% 20.82% 142 0.03% 20.79%
5 140 0.04% 25.48% 157 0.04% 26.06%
6 330 0.06% 25.50% 284 0.06% 22.29%
7 430 0.11% 24.85% 393 0.11% 26.30%
8 498 0.18% 38.98% 299 0.18% 36.03%
9 547 0.28% 47.00% 565 0.28% 46.75%
10 770 0.43% 49.92% 782 0.43% 49.38%
11 2,522 0.63% 59.05% 2,535 0.63% 59.29%
12 2,151 1.06% 71.30% 2,089 1.06% 70.80%
13 1,363 1.66% 81.67% 1,327 1.66% 81.23%
14 1,589 2.60% 91.92% 1,600 2.60% 95.23%
15 380 4.23% 95.53% 389 4.23% 96.34%
16 498 5.88% 110.14% 808 6.02% 124.66%
17 271 8.66% 122.94% 265 8.61% 127.48%
18 231 10.80% 130.18% 220 10.73% 129.01%
19 155 29.01% 152.95% 148 24.88% 157.35%
20 – 23 (Default) 819 100.00% – 961 100.00% −
Total 12,833 8.32% 66.01% 12,964 9.39% 67.99%

LLOYDS BANKING GROUP PLC 2016 HALF-YEAR PILLAR 3 DISCLOSURES
Page 12 of 24
Table 8: Central governments and central bank exposures by PD grade
June-16 June-16 June-16 Dec-15 Dec-15 Dec-15
Credit risk
exposure
Exposure weighted
average PD
Average risk
weight
Credit risk
exposure
Exposure weighted
average PD
Average risk
weight
£m % % £m % %
PD Grades
1 − 4 20,687 0.01% 7.73% 15,716 0.01% 8.57%
5 − − − − − −
6 157 0.06% 39.24% − − −
7 − − − − − −
8 − − − − − −
9 − − − − − −
10 − − − − − −
11 − − − − − −
12 − − − − − −
13 − − − − − −
14 − − − − − −
15 − − − − − −
16 − − − − − −
17 − − − − − −
18 − − − − − −
19 − − − − − −
20 – 23 (Default) − − − − − −
Total 20,844 0.01% 7.97% 15,716 0.01% 8.57%
Table 9: Institution exposures by PD grade
June-16 June-16 June-16 Dec-15 Dec-15 Dec-15
Credit risk
exposure
Exposure weighted
average PD
Average risk
weight
Credit risk
exposure
Exposure weighted average
PD
Average risk
weight
£m % % £m % %
PD Grades
1 − 4 2,088 0.03% 10.47% 2,781 0.03% 11.25%
5 868 0.04% 8.65% 954 0.04% 9.23%
6 2,398 0.06% 11.97% 2,179 0.06% 10.40%
7 371 0.11% 16.11% 387 0.11% 21.98%
8 250 0.18% 36.52% 242 0.18% 43.38%
9 228 0.28% 60.16% 214 0.28% 62.82%
10 156 0.43% 55.12% 218 0.43% 65.24%
11 236 0.67% 61.69% 290 0.73% 75.00%
12 46 1.00% 89.51% 43 1.01% 93.53%
13 6 1.56% 102.61% 7 1.69% 110.81%
14 1 2.10% 103.72% 1 2.20% 132.33%
15 9 4.23% 149.25% 7 4.24% 157.47%
16 − − − − − −
17 − − − − − −
18 26 12.00% 200.46% − − −
19 1 30.62% 245.83% 24 14.50% 247.44%
20 – 23 (Default) 13 100.00% – 17 100.00% −
Total 6,697 0.35% 18.16% 7,364 0.39% 19.42%

LLOYDS BANKING GROUP PLC 2016 HALF-YEAR PILLAR 3 DISCLOSURES
Page 13 of 24
Analysis of credit risk exposures subject to the Retail IRB Approach
This section provides a detailed analysis, by PD Grade, of credit risk exposures subject to the Retail IRB Approach.
Disclosures provided in the tables below take into account PD floors and LGD floors specified by regulators in respect of
the calculation of regulatory capital requirements.
Table 10: Residential mortgages (SME) exposures by PD grade
June-16 June-16 June-16 June-16 June-16 June-16
Credit risk
exposure
Exposure weighted
average PD
Exposure weighted
average LGD
1
Average risk
weight
Undrawn commitments
(gross)
Undrawn commitments
(after CCF) £m % % % £m £m
PD Grade
0 − − − − − −
1 − − − − − −
2 4,755 0.62% 16.08% 11.94% 501 491
3 2,161 1.12% 17.82% 19.80% 147 143
4 1,018 1.67% 18.06% 26.00% 53 52
5 894 2.62% 18.58% 35.24% 40 38
6 632 5.67% 18.90% 53.42% 24 23
7 92 8.04% 18.77% 66.12% 1 1
8 378 10.61% 19.81% 75.50% 14 13
9 175 18.02% 20.01% 90.35% 5 5
10 − – – – – −
11 68 34.10% 19.79% 95.14% 1 1
12 17 78.18% 22.21% 47.33% – −
Default 272 100.00% 8.63% 147.58% 3 3
Total 10,462 4.94% 17.08% 27.63% 789 770
Dec-15 Dec-15 Dec-15 Dec-15 Dec-15 Dec-15
Credit risk
exposure
Exposure weighted average
PD
Exposure weighted average
LGD1
Average risk
weight
Undrawn commitment
(gross)
Undrawn commitment
(after CCF) £m % % % £m £m
PD Grade
0 − − − − − −
1 − − − − − −
2 4,523 0.62% 16.46% 12.28% 475 464
3 2,257 1.12% 17.94% 20.04% 146 142
4 1,054 1.67% 18.48% 26.79% 58 56
5 934 2.62% 18.93% 36.01% 39 38
6 616 5.67% 19.32% 56.39% 27 27
7 72 8.04% 20.70% 72.77% 1 1
8 398 10.61% 20.13% 76.77% 16 15
9 198 18.02% 20.84% 93.75% 5 5
10 − – – – – −
11 70 34.10% 20.19% 98.73% 1 1
12 20 78.18% 21.92% 45.43% − −
Default 375 100.00% 7.91% 164.85% 5 5
Total 10,517 5.98% 17.35% 30.56% 773 754
LLOYDS BANKING GROUP PLC 2016 HALF-YEAR PILLAR 3 DISCLOSURES
Page 14 of 24
Table 11: Residential mortgages (non−SME) exposures by PD grade
June-16 June-16 June-16 June-16 June-16 June-16
Credit risk
exposure
Exposure weighted
average PD
Exposure weighted
average LGD
1
Average risk
weight
Undrawn commitments
(gross)2
Undrawn commitments
(after CCF)
£m % % % £m £m
PD Grade
0 191,947 0.11% 9.43% 2.86% 9,032 8,617
1 89,697 0.46% 11.01% 10.04% 1,758 1,601
2 17,946 1.40% 13.46% 23.88% 196 191
3 6,139 2.29% 15.30% 35.17% 43 40
4 7,656 3.78% 18.01% 51.51% 170 38
5 3,073 6.73% 19.84% 78.80% 2 1
6 2,302 14.22% 14.96% 79.63% − −
7 880 17.54% 14.12% 91.15% − −
8 665 24.55% 15.39% 102.03% − −
9 896 33.65% 11.96% 80.58% − −
10 903 43.85% 12.35% 83.70% − −
11 670 58.76% 12.54% 73.07% 2 2
12 909 74.42% 13.53% 54.42% − −
Default 4,119 100.00% 14.68% 74.33% − −
Total 327,802 2.45% 10.65% 11.03% 11,203 10,490
Dec-15 Dec-15 Dec-15 Dec-15 Dec-15 Dec-15
Credit risk
exposure
Exposure weighted average
PD
Exposure weighted average
LGD1
Average risk
weight
Undrawn commitments
(gross)2
Undrawn commitments
(after CCF) £m % % % £m £m
PD Grade
0 187,636 0.10% 9.34% 2.50% 8,287 7,759
1 94,669 0.47% 10.96% 9.49% 2,038 1,931
2 17,081 1.39% 13.29% 22.32% 155 150
3 7,299 2.27% 14.43% 31.55% 106 106
4 8,954 3.85% 16.44% 45.81% 181 43
5 3,671 7.27% 18.42% 69.99% 6 5
6 2,981 13.49% 14.76% 74.82% − −
7 455 19.15% 19.34% 109.26% − −
8 1,066 25.06% 13.68% 84.77% − −
9 988 31.89% 12.54% 81.54% − −
10 938 43.64% 12.84% 78.48% − −
11 830 56.80% 12.93% 67.77% 2 2
12 703 73.07% 14.07% 51.99% 1 −
Default 4,019 100.00% 14.46% 61.54% − −
Total 331,290 2.46% 10.59% 10.58% 10,776 9,996
1
The 10 per cent LGD floor that applies to residential mortgage exposures is applied at portfolio level rather than at account level. This means that LGD per cent for a given grade can be less than 10 per cent but that for the relevant portfolio cannot.
2 Undrawn commitments predominantly relate to pipeline mortgages, offered but not drawn down by the customer.

LLOYDS BANKING GROUP PLC 2016 HALF-YEAR PILLAR 3 DISCLOSURES
Page 15 of 24
Table 12: Qualifying revolving retail exposures by PD grade
June-16 June-16 June-16 June-16 June-16 June-16
Credit risk
exposure
Exposure weighted
average PD
Exposure weighted
average LGD
Average risk
weight
Undrawn commitments
(gross)
Undrawn commitments
(after CCF)1
£m % % % £m £m
PD Grade
0 11,237 0.05% 76.09% 2.66% 15,407 10,665
1 9,861 0.22% 75.66% 9.12% 14,180 8,088
2 4,601 0.58% 79.41% 21.13% 4,541 2,997
3 2,269 1.00% 79.48% 32.16% 1,820 1,151
4 3,544 1.75% 79.74% 48.94% 2,142 1,457
5 2,229 3.32% 79.84% 77.77% 908 720
6 1,882 6.16% 80.70% 118.65% 890 721
7 480 8.55% 80.38% 144.84% 108 119
8 354 11.59% 80.63% 172.53% 66 84
9 219 16.56% 80.60% 205.94% 35 51
10 134 24.34% 80.51% 239.12% 17 28
11 79 36.08% 80.39% 258.76% 9 15
12 96 66.61% 81.23% 195.97% 6 16
Default 439 100.00% 35.09% 226.57% 40 −
Total 37,424 2.70% 77.07% 32.24% 40,169 26,112
Dec-15 Dec-15 Dec-15 Dec-15 Dec-15 Dec-15
Credit risk
exposure
Exposure weighted average
PD
Exposure weighted average
LGD
Average risk
weight
Undrawn commitments
(gross)
Undrawn commitments
(after CCF)1
£m % % % £m £m
PD Grade
0 10,807 0.05% 76.00% 2.71% 14,803 10,238
1 9,869 0.22% 76.10% 9.21% 13,656 8,271
2 4,220 0.57% 78.41% 20.64% 4,583 2,715
3 2,290 0.99% 79.13% 31.89% 1,901 1,198
4 3,571 1.75% 79.46% 48.80% 2,196 1,544
5 2,345 3.33% 79.58% 77.57% 973 774
6 1,675 6.03% 80.59% 116.86% 788 563
7 722 8.31% 79.99% 141.84% 166 255
8 401 11.47% 80.29% 170.88% 74 91
9 234 16.39% 80.45% 204.68% 36 52
10 148 24.14% 80.05% 237.07% 18 30
11 85 36.15% 79.90% 257.23% 10 15
12 108 67.90% 80.82% 188.61% 7 17
Default 500 100.00% 33.37% 243.96% 38 −
Total 36,975 2.97% 76.88% 33.81% 39,249 25,763
1
Undrawn commitments post credit conversion can exceed the gross undrawn equivalents where there is an assumption that future drawings will be higher than the current limit.

LLOYDS BANKING GROUP PLC 2016 HALF-YEAR PILLAR 3 DISCLOSURES
Page 16 of 24
Table 13: Other SME exposures by PD grade
June-16 June-16 June-16 June-16 June-16 June-16
Credit risk
exposure
Exposure weighted
average PD
Exposure weighted
average LGD
Average risk
weight
Undrawn commitments
(gross)
Undrawn commitments
(after CCF)
£m % % % £m £m
PD Grade
0 − − − − − −
1 − − − − − −
2 929 0.61% 76.11% 58.40% 516 516
3 417 1.12% 76.47% 66.47% 142 142
4 228 1.67% 76.87% 76.96% 59 59
5 306 2.62% 75.83% 85.01% 46 46
6 147 5.67% 78.38% 95.60% 29 29
7 72 8.04% 70.89% 105.65% 5 5
8 91 10.61% 81.32% 113.26% 18 18
9 32 18.02% 79.45% 137.79% 4 4
10 − − − − − −
11 12 34.10% 83.64% 178.63% − −
12 7 78.18% 85.48% 117.98% 1 1
Default 252 100.00% 9.65% 46.59% 4 4
Total 2,493 12.58% 69.76% 70.85% 824 824
Dec-15 Dec-15 Dec-15 Dec-15 Dec-15 Dec-15
Credit risk
exposure
Exposure weighted average
PD
Exposure weighted average
LGD
Average risk
weight
Undrawn commitments
(gross)
Undrawn commitments
(after CCF) £m % % % £m £m
PD Grade
0 − − − − − −
1 − − − − − −
2 990 0.61% 75.29% 48.52% 517 517
3 480 1.12% 75.07% 65.46% 148 148
4 249 1.67% 75.94% 76.44% 60 60
5 332 2.62% 75.63% 85.21% 49 49
6 165 5.67% 76.75% 94.24% 30 30
7 72 8.04% 70.76% 106.61% 5 5
8 104 10.61% 80.64% 113.06% 17 17
9 37 18.02% 80.78% 141.22% 4 4
10 − − − − − −
11 15 34.10% 81.21% 174.25% 1 1
12 8 78.18% 86.66% 119.12% 1 1
Default 209 100.00% 11.21% 48.63% 3 3
Total 2,661 10.43% 70.63% 67.91% 835 835
LLOYDS BANKING GROUP PLC 2016 HALF-YEAR PILLAR 3 DISCLOSURES
Page 17 of 24
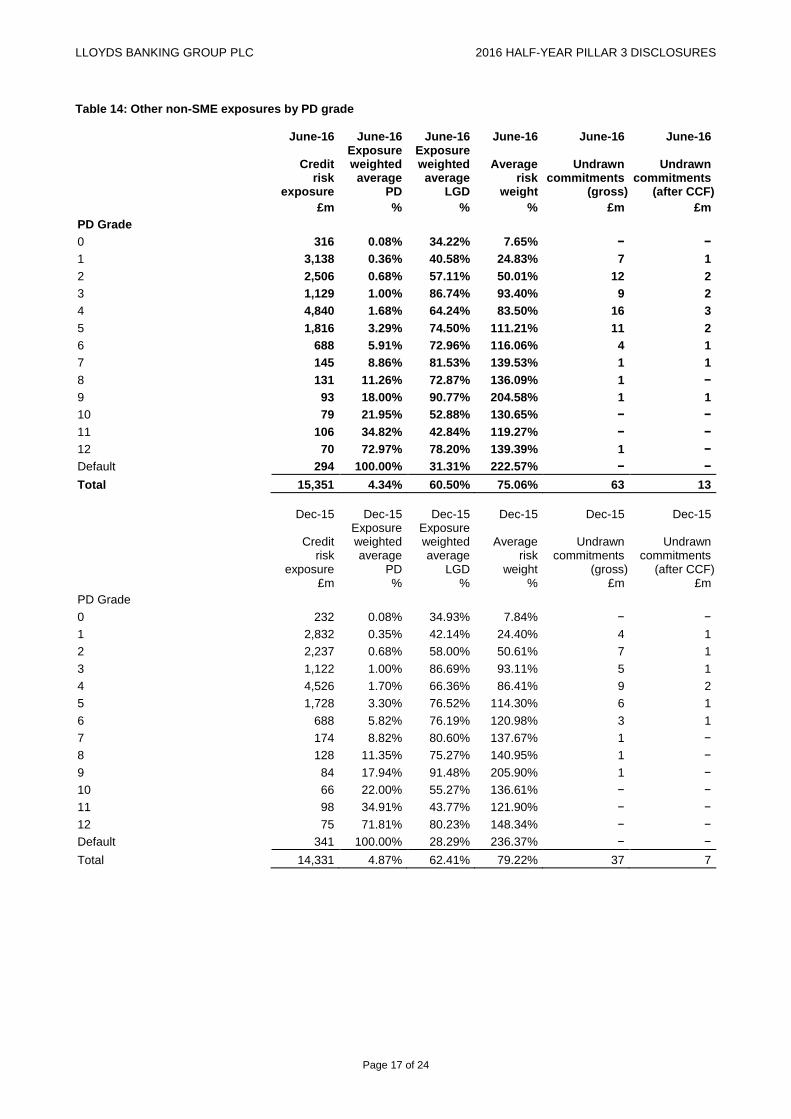
Table 14: Other non-SME exposures by PD grade
June-16 June-16 June-16 June-16 June-16 June-16
Credit risk
exposure
Exposure weighted
average PD
Exposure weighted
average LGD
Average risk
weight
Undrawn commitments
(gross)
Undrawn commitments
(after CCF)
£m % % % £m £m
PD Grade
0 316 0.08% 34.22% 7.65% − −
1 3,138 0.36% 40.58% 24.83% 7 1
2 2,506 0.68% 57.11% 50.01% 12 2
3 1,129 1.00% 86.74% 93.40% 9 2
4 4,840 1.68% 64.24% 83.50% 16 3
5 1,816 3.29% 74.50% 111.21% 11 2
6 688 5.91% 72.96% 116.06% 4 1
7 145 8.86% 81.53% 139.53% 1 1
8 131 11.26% 72.87% 136.09% 1 −
9 93 18.00% 90.77% 204.58% 1 1
10 79 21.95% 52.88% 130.65% − −
11 106 34.82% 42.84% 119.27% − −
12 70 72.97% 78.20% 139.39% 1 −
Default 294 100.00% 31.31% 222.57% − −
Total 15,351 4.34% 60.50% 75.06% 63 13
Dec-15 Dec-15 Dec-15 Dec-15 Dec-15 Dec-15
Credit risk
exposure
Exposure weighted average
PD
Exposure weighted average
LGD
Average risk
weight
Undrawn commitments
(gross)
Undrawn commitments
(after CCF)
£m % % % £m £m
PD Grade
0 232 0.08% 34.93% 7.84% − −
1 2,832 0.35% 42.14% 24.40% 4 1
2 2,237 0.68% 58.00% 50.61% 7 1
3 1,122 1.00% 86.69% 93.11% 5 1
4 4,526 1.70% 66.36% 86.41% 9 2
5 1,728 3.30% 76.52% 114.30% 6 1
6 688 5.82% 76.19% 120.98% 3 1
7 174 8.82% 80.60% 137.67% 1 −
8 128 11.35% 75.27% 140.95% 1 −
9 84 17.94% 91.48% 205.90% 1 −
10 66 22.00% 55.27% 136.61% − −
11 98 34.91% 43.77% 121.90% − −
12 75 71.81% 80.23% 148.34% − −
Default 341 100.00% 28.29% 236.37% − −
Total 14,331 4.87% 62.41% 79.22% 37 7
LLOYDS BANKING GROUP PLC 2016 HALF-YEAR PILLAR 3 DISCLOSURES
Page 18 of 24
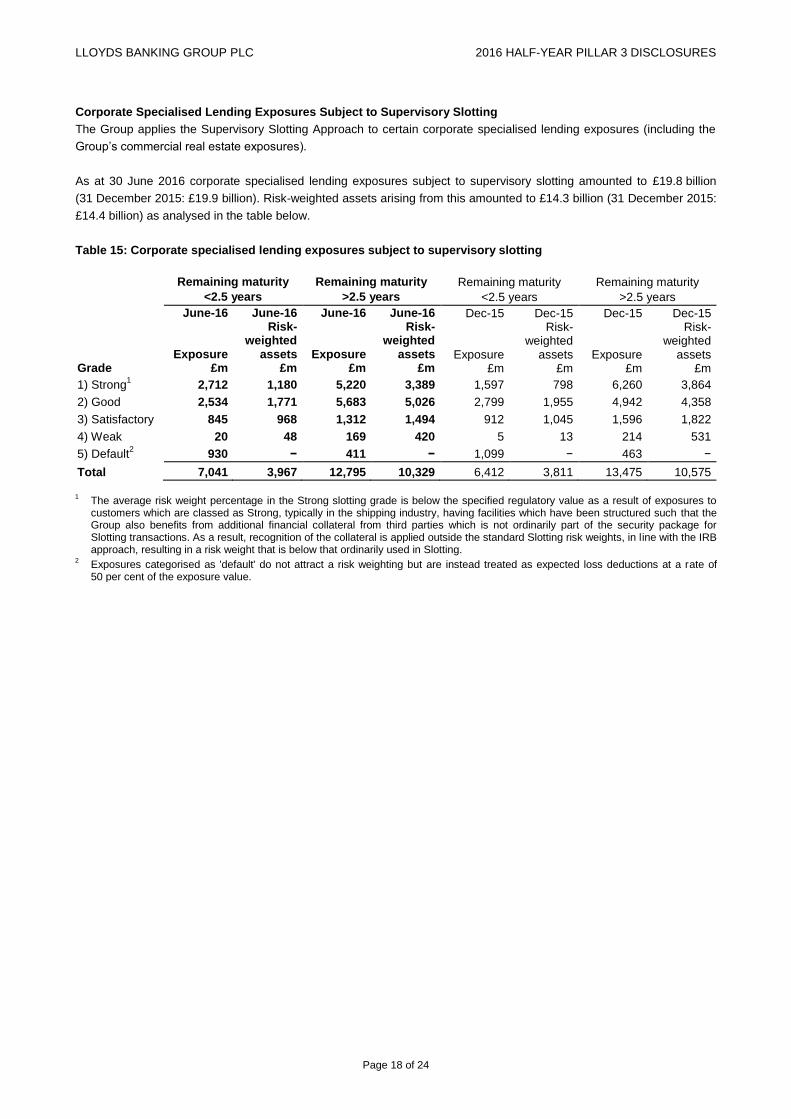
Corporate Specialised Lending Exposures Subject to Supervisory Slotting
The Group applies the Supervisory Slotting Approach to certain corporate specialised lending exposures (including the
Group’s commercial real estate exposures).
As at 30 June 2016 corporate specialised lending exposures subject to supervisory slotting amounted to £19.8 billion
(31 December 2015: £19.9 billion). Risk-weighted assets arising from this amounted to £14.3 billion (31 December 2015:
£14.4 billion) as analysed in the table below.
Table 15: Corporate specialised lending exposures subject to supervisory slotting
Remaining maturity Remaining maturity Remaining maturity Remaining maturity
<2.5 years >2.5 years <2.5 years >2.5 years
June-16 June-16 June-16 June-16 Dec-15 Dec-15 Dec-15 Dec-15
Exposure
Risk- weighted
assets Exposure
Risk- weighted
assets Exposure
Risk- weighted
assets Exposure
Risk- weighted
assets Grade £m £m £m £m £m £m £m £m
1) Strong1 2,712 1,180 5,220 3,389 1,597 798 6,260 3,864
2) Good 2,534 1,771 5,683 5,026 2,799 1,955 4,942 4,358
3) Satisfactory 845 968 1,312 1,494 912 1,045 1,596 1,822
4) Weak 20 48 169 420 5 13 214 531
5) Default2 930 − 411 − 1,099 − 463 −
Total 7,041 3,967 12,795 10,329 6,412 3,811 13,475 10,575
1
The average risk weight percentage in the Strong slotting grade is below the specified regulatory value as a result of exposures to customers which are classed as Strong, typically in the shipping industry, having facilities which have been structured such that the Group also benefits from additional financial collateral from third parties which is not ordinarily part of the security package for Slotting transactions. As a result, recognition of the collateral is applied outside the standard Slotting risk weights, in line with the IRB approach, resulting in a risk weight that is below that ordinarily used in Slotting.
2 Exposures categorised as 'default' do not attract a risk weighting but are instead treated as expected loss deductions at a rate of 50 per cent of the exposure value.
LLOYDS BANKING GROUP PLC 2016 HALF-YEAR PILLAR 3 DISCLOSURES
Page 19 of 24
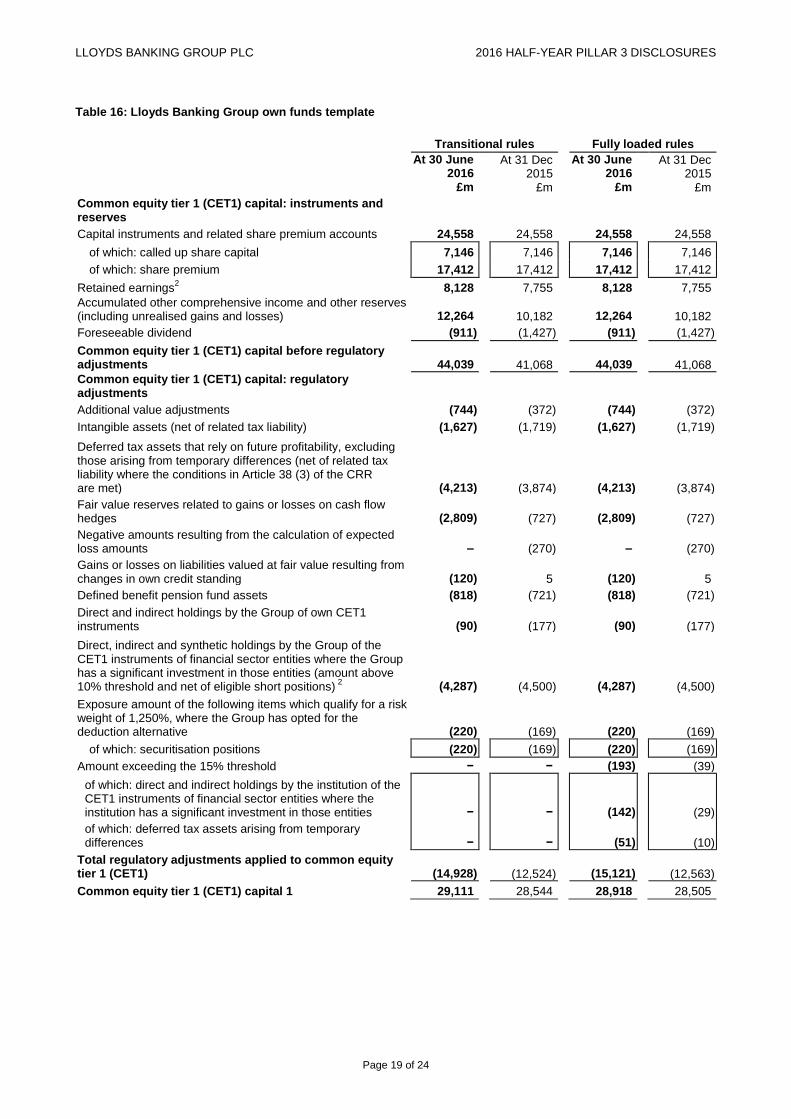
Table 16: Lloyds Banking Group own funds template
Transitional rules Fully loaded rules
At 30 June 2016
At 31 Dec 2015
At 30 June 2016
At 31 Dec 2015
£m
£m
£m £m
Common equity tier 1 (CET1) capital: instruments and reserves
Capital instruments and related share premium accounts 24,558
24,558
24,558
24,558
of which: called up share capital 7,146
7,146
7,146
7,146
of which: share premium 17,412
17,412
17,412
17,412
Retained earnings2 8,128
7,755
8,128
7,755
Accumulated other comprehensive income and other reserves (including unrealised gains and losses) 12,264
10,182
12,264
10,182
Foreseeable dividend (911)
(1,427)
(911)
(1,427)
Common equity tier 1 (CET1) capital before regulatory adjustments 44,039
41,068
44,039
41,068
Common equity tier 1 (CET1) capital: regulatory adjustments
Additional value adjustments (744)
(372)
(744)
(372)
Intangible assets (net of related tax liability) (1,627)
(1,719)
(1,627)
(1,719)
Deferred tax assets that rely on future profitability, excluding those arising from temporary differences (net of related tax liability where the conditions in Article 38 (3) of the CRR are met) (4,213)
(3,874)
(4,213)
(3,874)
Fair value reserves related to gains or losses on cash flow hedges (2,809)
(727)
(2,809)
(727)
Negative amounts resulting from the calculation of expected loss amounts –
(270)
–
(270)
Gains or losses on liabilities valued at fair value resulting from changes in own credit standing (120)
5
(120)
5
Defined benefit pension fund assets (818)
(721)
(818)
(721)
Direct and indirect holdings by the Group of own CET1 instruments (90)
(177)
(90)
(177)
Direct, indirect and synthetic holdings by the Group of the CET1 instruments of financial sector entities where the Group has a significant investment in those entities (amount above 10% threshold and net of eligible short positions)
2 (4,287)
(4,500)
(4,287)
(4,500)
Exposure amount of the following items which qualify for a risk weight of 1,250%, where the Group has opted for the deduction alternative (220)
(169)
(220)
(169)
of which: securitisation positions (220)
(169)
(220) (169)
Amount exceeding the 15% threshold −
−
(193)
(39)
of which: direct and indirect holdings by the institution of the CET1 instruments of financial sector entities where the institution has a significant investment in those entities −
−
(142)
(29)
of which: deferred tax assets arising from temporary differences −
−
(51)
(10)
Total regulatory adjustments applied to common equity tier 1 (CET1) (14,928) (12,524) (15,121) (12,563)
Common equity tier 1 (CET1) capital 1 29,111 28,544 28,918 28,505
LLOYDS BANKING GROUP PLC 2016 HALF-YEAR PILLAR 3 DISCLOSURES
Page 20 of 24
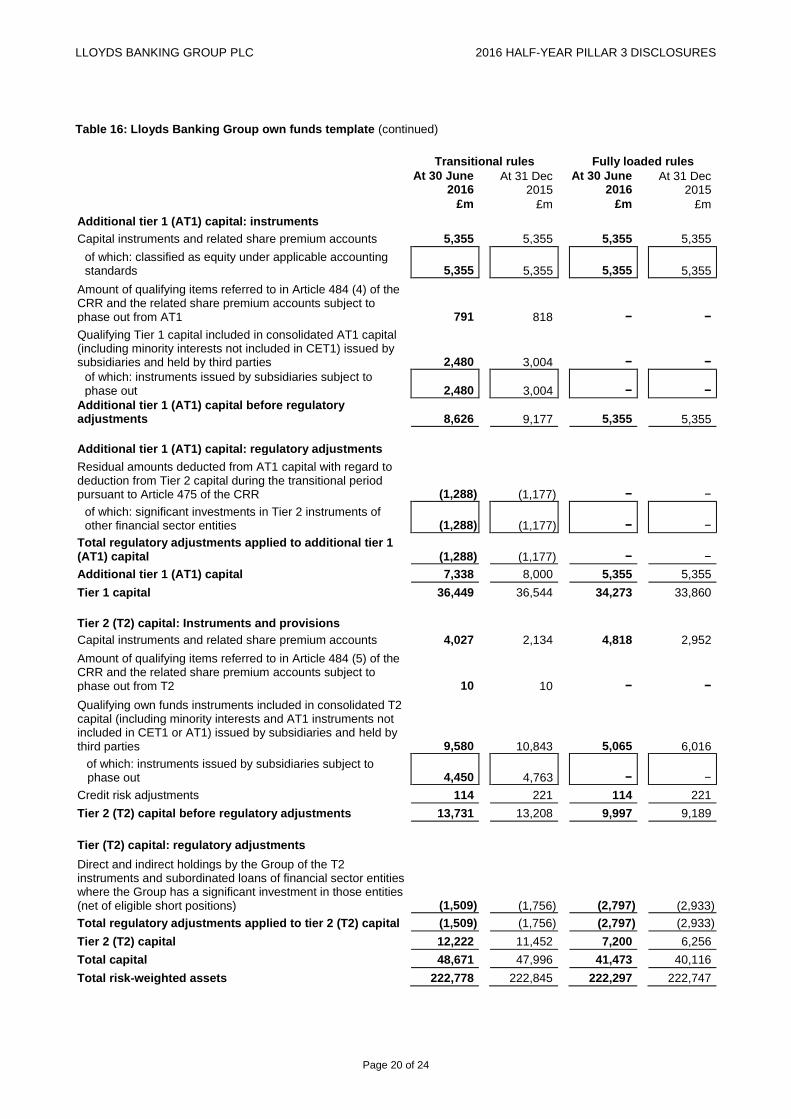
Table 16: Lloyds Banking Group own funds template (continued)
Transitional rules Fully loaded rules
At 30 June 2016
At 31 Dec 2015
At 30 June 2016
At 31 Dec 2015
£m £m £m £m
Additional tier 1 (AT1) capital: instruments
Capital instruments and related share premium accounts 5,355
5,355 5,355 5,355
of which: classified as equity under applicable accounting standards 5,355
5,355 5,355 5,355
Amount of qualifying items referred to in Article 484 (4) of the CRR and the related share premium accounts subject to phase out from AT1 791
818
−
−
Qualifying Tier 1 capital included in consolidated AT1 capital (including minority interests not included in CET1) issued by subsidiaries and held by third parties 2,480
3,004
−
−
of which: instruments issued by subsidiaries subject to phase out 2,480
3,004 − −
Additional tier 1 (AT1) capital before regulatory adjustments 8,626
9,177 5,355 5,355
Additional tier 1 (AT1) capital: regulatory adjustments Residual amounts deducted from AT1 capital with regard to
deduction from Tier 2 capital during the transitional period pursuant to Article 475 of the CRR (1,288)
(1,177) −
−
of which: significant investments in Tier 2 instruments of other financial sector entities (1,288) (1,177) − −
Total regulatory adjustments applied to additional tier 1 (AT1) capital (1,288) (1,177) − −
Additional tier 1 (AT1) capital 7,338 8,000 5,355 5,355
Tier 1 capital 36,449 36,544 34,273 33,860
Tier 2 (T2) capital: Instruments and provisions
Capital instruments and related share premium accounts 4,027
2,134
4,818
2,952
Amount of qualifying items referred to in Article 484 (5) of the CRR and the related share premium accounts subject to phase out from T2 10
10
−
−
Qualifying own funds instruments included in consolidated T2 capital (including minority interests and AT1 instruments not included in CET1 or AT1) issued by subsidiaries and held by third parties 9,580
10,843
5,065
6,016
of which: instruments issued by subsidiaries subject to phase out 4,450
4,763
−
−
Credit risk adjustments 114
221
114
221
Tier 2 (T2) capital before regulatory adjustments 13,731 13,208 9,997 9,189
Tier (T2) capital: regulatory adjustments Direct and indirect holdings by the Group of the T2
instruments and subordinated loans of financial sector entities where the Group has a significant investment in those entities (net of eligible short positions) (1,509)
(1,756)
(2,797)
(2,933)
Total regulatory adjustments applied to tier 2 (T2) capital (1,509) (1,756) (2,797) (2,933)
Tier 2 (T2) capital 12,222 11,452 7,200 6,256
Total capital 48,671 47,996 41,473 40,116
Total risk-weighted assets 222,778 222,845 222,297 222,747

LLOYDS BANKING GROUP PLC 2016 HALF-YEAR PILLAR 3 DISCLOSURES
Page 21 of 24
Table 16: Lloyds Banking Group own funds template (continued)
Transitional rules Fully loaded rules
At 30 June 2016
At 31 Dec 2015
At 30 June 2016
At 31 Dec 2015
£m £m £m £m
Capital ratios and buffers Common Equity Tier 1
(as a percentage of risk exposure amount) 13.1%
12.8%
13.0%
12.8%
Tier 1 (as a percentage of risk exposure amount) 16.4%
16.4%
15.4%
15.2%
Total capital (as a percentage of risk exposure amount) 21.8%
21.5%
18.7%
18.0%
Institution specific buffer requirement (CET1 requirement in accordance with article 92(1)(a) plus capital conservation and countercyclical buffer requirements, plus systemic risk buffer, plus the systemically important institution buffer (G-SII or O-SII buffer), expressed as a percentage of risk exposure amount) 0.628%
0.001%
0.628%
0.001%
of which: capital conservation buffer requirement3 0.625%
−
0.625%
−
of which: countercyclical buffer requirement 0.003%
0.001%
0.003%
0.001%
Common Equity Tier 1 available to meet buffers (as a percentage of risk exposure amount)
1 8.6%
8.3%
8.5%
8.3%
Amounts below the threshold for deduction (before risk weighting)
Direct and indirect holdings of the capital of financial sector entities where the Group does not have a significant investment in those entities (amount below 10% threshold and net of eligible short positions) 1,379
1,552
1,379
1,552
Direct and indirect holdings by the Group of the CET1 instruments of financial sector entities where the Group has a significant investment in those entities (amount below 10% threshold and net of eligible short positions) 3,340
3,127
3,340
3,127
Deferred tax assets arising from temporary differences (amount below 10% threshold, net of related tax liability where the conditions in 38 (3) are met) 1,191
1,188
1,191
1,188
Applicable caps on the inclusion of provisions in Tier 2 Credit risk adjustments included in T2 in respect of exposures
subject to internal ratings-based approach (prior to the application of the cap) 114
221
114
221
Cap on inclusion of credit risk adjustments in T2 under internal ratings-based approach 958
953
958
953
Capital instruments subject to phase−out arrangements (only applicable between 1 Jan 2013 and 1 Jan 2022)
Current cap on AT1 instruments subject to phase out arrangements 3,305 3,856 − −
Amount excluded from AT1 due to cap (excess over cap after redemptions and maturities) 1,861 671 − −
Current cap on T2 instruments subject to phase out arrangements 8,600 10,034 − −
1
Excluding CET1 required to meet Pillar 2A requirements under fully loaded. 2
The presentation of the deconsolidation of the Group's insurance entities has been amended at June 2016 with comparative figures restated accordingly.
3 The capital conservation buffer requirement is the percentage applicable at the reporting date. This will increase to 2.5 per cent by 2019.

LLOYDS BANKING GROUP PLC 2016 HALF-YEAR PILLAR 3 DISCLOSURES
Page 22 of 24
Table 17: Lloyds Banking Group leverage ratio common disclosure
At 30 June 2016
At 31 Dec 2015
Fully loaded
Fully loaded
£m £m
On-balance sheet exposures (excluding derivatives and SFTs)
On-balance sheet items (excluding derivatives, SFTs and fiduciary assets, but including collateral) 626,734
609,110
Asset amounts deducted in determining Tier 1 capital (10,627) (9,112)
Total on-balance sheet exposures (excluding derivatives, SFTs and fiduciary assets) 616,107 599,998
Derivative exposures
Replacement cost associated with all derivatives transactions (i.e. net of eligible cash variation margin) 9,923
6,392
Add-on amounts for PFE associated with all derivatives transactions (mark-to-market method) 13,050
12,966
Gross-up for derivatives collateral provided where deducted from the balance sheet assets pursuant to the applicable accounting framework 762
2,371
Deductions of receivables assets for cash variation margin provided in derivatives transactions (3,527)
(3,689)
Adjusted effective notional amount of written credit derivatives 857 813
Adjusted effective notional offsets and add-on deductions for written credit derivatives (158) (131)
Total derivative exposures 20,907 18,722
Securities financing transaction exposures
Gross SFT assets (with no recognition of netting), after adjusting for sales accounting transactions 38,586
39,604
Netted amounts of cash payables and cash receivables of gross SFT assets (3,356) (5,909)
Counterparty credit risk exposure for SFT assets 1,793 3,361
Total securities financing transaction exposures 37,023 37,056
Other off-balance sheet exposures
Off-balance sheet exposures at gross notional amount 129,834 129,491
Adjustments for conversion to credit equivalent amounts (69,961) (73,067)
Other off-balance sheet exposures 59,873 56,424
Capital and total exposure measure
Tier 1 capital 34,273 33,860
Leverage ratio total exposure measure 733,910 712,200
Leverage ratio
Leverage ratio 4.7% 4.8%

LLOYDS BANKING GROUP PLC 2016 HALF-YEAR PILLAR 3 DISCLOSURES
Page 23 of 24
Table 18: Lloyds Banking Group summary reconciliation of accounting assets and leverage ratio exposures
At 30 June 2016
At 31 Dec 2015
Fully loaded
Fully loaded
£m £m
Total assets as per published financial statements 848,232 806,688
Adjustment for entities which are consolidated for accounting purposes but are outside the scope of regulatory consolidation (140,421) (135,926)
Adjustments for derivative financial instruments (23,587) (9,235)
Adjustments for securities financing transactions (SFTs) 440 3,361
Adjustment for off-balance sheet items (i.e. conversion to credit equivalent amounts of off-balance sheet exposures) 59,873 56,424
Other adjustments (10,627) (9,112)
Leverage ratio total exposure measure 733,910 712,200

LLOYDS BANKING GROUP PLC 2016 HALF-YEAR PILLAR 3 DISCLOSURES
Page 24 of 24
CONTACTS
For further information please contact:
INVESTORS AND ANALYSTS
Douglas Radcliffe
Group Investor Relations Director
020 7356 1571
Mike Butters
Director of Investor Relations
020 7356 1187
Andrew Downey
Director of Investor Relations
020 7356 2334
CORPORATE AFFAIRS
Ed Petter
Group Media Relations Director
020 8936 5655
Matt Smith
Head of Corporate Media
020 7356 3522
Registered office: Lloyds Banking Group plc, The Mound, Edinburgh, EH1 1YZ
Registered in Scotland no. 95000