Estuarine Dynamics. Summary of previous lessons. Estuarine Dynamics.


Liz
Sulli
van,
Ocr
acok
e Is
land
, NC

4
Coastal Resources—Tidal Estuaries, ShorelineWaters, and Coral Reefs
Mariana Islands, and the DelawareRiver Basin Commission (collectivelyreferred to as states in the rest of thischapter) rated general water qualityconditions in some of their estuarinewaters (Appendix C, Table C-2,contains individual state data). PuertoRico’s information on its estuarinewaters was based on linear milesrather than square miles, and conse-quently could not be aggregated withinformation reported by the otherstates.
Altogether, these states assessed31,072 square miles of estuarinewaters, which equals 36% of the87,369 square miles of estuarinewaters in the nation. The states based51% of their assessments on moni-tored data and evaluated 32% of theassessed estuarine waters with qualita-tive information (see Appendix C,Table C-2, for individual state infor-mation). The states did not specifywhether 17% of the assessed estuarinewaters were monitored or evaluated.
The number of assessed estuarinesquare miles increased slightlybetween 1998 and 2000, as did thepercentage of total estuarine areaassessed. This is primarily due toincreases in the area assessed in a fewstates. California, Florida, Mississippi,and Washington all assessed signifi-cantly more estuarine area in 2000than in 1998.
The states constantly revise theirassessment methods in an effort toimprove their accuracy and precision.
The United States’ coastalresources include nearly 90,000 squaremiles of estuarine waters, more than5,500 miles of Great Lakes shoreline,nearly 60,000 miles of ocean shore-line, and extensive coral reef areas.This chapter discusses the states’water quality findings for thesediverse resources.
The findings in this chapterlargely agree with the water qualityand ecological assessment of thenation’s estuaries provided in theNational Coastal Condition Report,EPA-620/R-01/005, published inMarch 2002. The National CoastalCondition Report was based on datafrom a variety of federal, state, andlocal sources, including EPA’sNational Coastal AssessmentProgram, with samples taken fromover 1,000 randomly selected sites inthe estuaries of the United States. Fora copy of this report, visit http://www.epa.gov/owow/oceans/nccr/index.html.
ESTUARIESEstuaries are the waters where
rivers meet the oceans and includebays and tidal rivers. These watersserve as nursery areas for manycommercial and recreational fishspecies and most shellfish popula-tions, including shrimp, oysters,clams, crabs, and scallops.
Twenty-three of the 27 coastalstates, the District of Columbia, theCommonwealth of the Northern
Estuaries Assessed by States
27,227 square miles = 74% assessedTotal square miles: 36,890e
1992
26,847 square miles = 78% assessedTotal square miles: 34,388d
1994
aSource:bSource:cSource:dSource:eSource:
2000 state Section 305(b) reports.1998 state Section 305(b) reports.1996 state Section 305(b) reports.1994 state Section 305(b) reports.1992 state Section 305(b) reports.
28,819 square miles = 72% assessedTotal square miles: 39,839c
1996
36% Assessed
64% Not Assessed
31,072 square miles = 36% assessedTotal square miles = 87,369a
2000
28,687 square miles = 32% assessedTotal square miles: 90,465b
1998

26 Chapter Four Coastal Resources: Tidal Estuaries, Shoreline Waters, and Coral Reefs
These changes, however, limit thecomparability of data from year toyear. Similarly, differences in stateassessment methods limit meaningfulcomparisons of estuarine informationsubmitted by individual states. Statesdevote varying resources to monitor-ing biological integrity, water chem-istry, and toxic pollutants in fishtissues. The wide range in waterquality ratings reported by the statesreflects both differences in water qual-ity and differences in monitoring andassessment methods.
Summary of UseSupport
The states reported that 49% oftheir assessed estuarine waters havegood water quality that fully supportsdesignated uses (Figure 4-1). Of theassessed waters, 45% fully supportuses and nearly 4% are threatened
for one or more uses. Some form of pollution or habitat degradationimpairs the remaining 51% ofassessed estuarine waters.
Individual UseSupport
Individual use support assessmentprovides important details about thenature of water quality problems inour nation’s surface waters. The statesestablish specific designated uses forwaterbodies through their water qual-ity standards. For reporting purposes,the states consolidate their moredetailed uses into five general usecategories. The standard uses forestuaries are aquatic life support, fishconsumption, shellfish harvesting,primary contact recreation (such asswimming and diving), and secondarycontact recreation (such as boating).Few states designate saline estuarine
36% assessed64% not assessed
Total estuaries = 87,369 square milesa
Total assessed = 31,072 square miles
Of the assessed estuarine waters:
• 51% were monitored • 32% were evaluated • 17% were not specified
Assessed Waters
Assessed Water Quality
51% Impairedfor one ormore uses
49% Good
aSource: 2000 state Section 305(b) reports.
49% of ASSESSED
estuaries have good
water quality.Threatened
for One or More Uses
Impairedfor One or More Uses
Summary of Use Supportin Assessed Estuaries
Fully SupportingAll Uses
Figure 4-1
Good49%
<4%
45%
51%
This figure presents the status of the assessed square miles of estuaries. Of 31,072 square milesassessed, 49% fully support their designated uses and 51% are impaired for one or more uses.Less than 4% of assessed waters are fully supporting uses but threatened.Based on data contained in Appendix C, Table C-2.
Note: Figures may not add up to 100% due to rounding.

Chapter Four Coastal Resources: Tidal Estuaries, Shoreline Waters, and Coral Reefs 27
waters for drinking water supply useand agricultural use because of hightreatment costs.
Twenty-two states reported theindividual use support status of theirestuarine waters (see Appendix C,Table C-3, for individual state infor-mation). Most often, these statesexamined aquatic life conditions and swimming use in their estuarinewaters (Figure 4-2). The statesreported that pollutants:
■ Impact aquatic life in 11,391 squaremiles of estuarine waters (about 52%of the 22,047 square miles assessed foraquatic life support).
■ Restrict fish consumption in 6,255square miles of estuarine waters (about48% of the 12,940 square milesassessed for fish consumption).
■ Restrict shellfish harvesting in5,288 square miles of estuarine waters(25% of the 20,967 square milesassessed for shellfishing use support).
■ Violate swimming criteria in 3,245square miles of estuarine waters (15% of the 21,169 square milesassessed for swimming use support).
Water QualityProblems Identified in Estuaries
When states and tribes ratewaters as impaired, they also try toidentify the causes and sources ofimpairment. Figures 4-3 and 4-4identify the pollutants and sources ofpollutants that impair the most squaremiles of assessed estuarine waters.
It is important to note that infor-mation about pollutants and sources is incomplete. The states do not
Good Impaired(Partially
Supporting orNot Supporting)
Percent
22,047
12,940
20,967
21,169
9,524
Figure 4-2
48
(Fully Supportingor Threatened)Designated
Use
4852
75
25
85
15
23
77
Good water qualitysupports shellfishingin 75% of thewaters assessed
Individual Use Support in Estuaries
SquareMiles
Assessed
Fish Consumption
Aquatic Life Support
Primary Contact –Swimming
Secondary Contact
Shellfishing
52
This figure presents a tally of the square miles of estuaries assessedby states for each category of designated use. For each category, thefigure summarizes the proportion of the assessed waters ratedaccording to quality.Based on data contained in Appendix C, Table C-3.

28 Chapter Four Coastal Resources: Tidal Estuaries, Shoreline Waters, and Coral Reefs
always report the pollutant or sourceof pollutants affecting every impairedestuarine waterbody. In some cases,they may recognize that water qualitydoes not fully support a designateduse but may not have adequate data todocument the specific pollutant orstressor responsible for the impair-ment. Sources of impairment are evenmore difficult to identify than pollut-ants and stressors.
Pollutants and ProcessesImpacting Estuaries
Twenty-five states reportedpollutants and processes related tohuman activities that impact some of their estuarine waters (see Appen-dix C, Table C-4, for individual stateinformation). Often, more than onepollutant or stressor impacts a singleestuarine waterbody. In such cases, thestates and other jurisdictions count asingle square mile of estuary undereach pollutant or stressor categorythat affects the estuary. Therefore,the percentages of estuarine watersimpaired by all the pollutant andstressor categories do not add up to100% in Figure 4-3.
The states identified more squaremiles of estuarine waters polluted bymetals than any other pollutant orstressor (Figure 4-3). States reportedthat metals, primarily mercury, pollute8,077 square miles of estuarine waters(26% of the assessed estuarine watersand 52% of the impaired estuarinewaters). Similar to lakes, this is mainlydue to the widespread detection of mercury in fish tissue samples.Mercury bioaccumulates in fish tissue,and the consumption of fish with highconcentrations of mercury can beharmful to human health. The healthrisk is higher for sensitive populationssuch as pregnant women, nursingwomen, and children. Nine states havestatewide fish consumption advisories
for mercury in coastal and/or estuarinewaters that recommend restricting theconsumption of fish from thosewaters.
The states determined that pesticides pollute 5,985 square miles(19% of the assessed estuarine watersand 38% of the impaired estuarinewaters). Pesticides such as DDT andchlordane pose risks to human healthand aquatic life because they bioaccu-mulate in fish tissues.
Oxygen depletion from organicwastes impacts 5,324 square miles ofestuarine waters (17% of the assessedestuarine waters and 34% of theimpaired estuarine waters). Oxygendepletion may trigger fish kills andfoul odors, and can adversely affectaquatic life.
The states reported that patho-gens impair 4,764 square miles ofestuarine waters (15% of the assessedestuarine waters and 30% of theimpaired estuarine waters). Moststates monitor indicator bacteria, suchas E. coli, that inhabit the digestivetracts of humans and other warm-blooded animals and populate sewagein high densities. The presence ofsuch bacteria in water samples is anindicator that an estuary is contami-nated with sewage that may containnumerous viruses and bacteria thatcause illness in people.
Sources of PollutantsImpacting Estuaries
Twenty-five states reportedsources of pollution related to humanactivities that affect some of theirestuarine waters (see Appendix C,Table C-5, for individual state infor-mation). These states reported thatunknown sources impaired the great-est number of estuarine square miles(7,592 square miles). Of the knownsources, states report that municipalpoint sources (sewage treatment

Chapter Four Coastal Resources: Tidal Estuaries, Shoreline Waters, and Coral Reefs 29
Leading Pollutants/Stressors Square Miles
64%NotAssessed
36%ASSESSED
49%Good
51%IMPAIRED
Total Estuaries87,369 square miles
ASSESSED Estuaries31,072 square miles
14,873squaremiles
15,676squaremiles
8,077
5,985
5,324
4,764
3,652
2,622
2,494
Percent of ASSESSED Estuarine Square Miles
Metals
Pesticides
Oxygen-Depleting Substances
Pathogens (Bacteria)
Priority Toxic Organic Chemicals
PCBs
Total Dissolved Solids
Percent of IMPAIRED Estuarine Square Miles
0 5 10 15 20 25
0 10 20 30 40 50
States assessed 36% of the total square miles of estuaries for the 2000 report. The larger pie charton the left illustrates this proportion. The smaller pie chart on the right shows that, for the sub-set of assessed waters, 49% are rated as good and 51% as impaired. When states identify watersthat are impaired, they describe the pollutants or processes causing or contributing to the impair-ment. This bar chart presents the leading causes and the number of estuarine square milesimpacted. The percent scales on the upper and lower x-axes of the bar chart provide differentperspectives on the magnitude of the impact of these pollutants. The lower axis compares thesquare miles impacted by the pollutant to the total ASSESSED square miles. The upper axiscompares the square miles impacted by the pollutant to the total IMPAIRED square miles.Based on data contained in Appendix C, Table C-4.
Note: Percentages do not add up to 100% because more than one pollutant or source may impair anestuary.
Figure 4-3
Leading POLLUTANTS in Impaired Estuaries The pollutants/processesand sources shown heremay not correspond directly to one another(i.e., the leading pollutantmay not originate from theleading source). This mayoccur because a majorpollutant may be releasedfrom many minor sources.It also happens whenstates do not have theinformation to determineall the sources of a particu-lar pollutant/stressor.
30 Chapter Four Coastal Resources: Tidal Estuaries, Shoreline Waters, and Coral Reefs
Leading Sources Square Miles
5,779
5,045
4,116
3,692
2,811
2,171
1,913
0 5 10 15 20
Percent of ASSESSED Estuarine Square Miles
Municipal Point Sources
Urban Runoff/Storm Sewers
Industrial Discharges
Atmospheric Deposition
Agriculture
Hydrologic Modifications
Resource Extraction
0 10 20 30 40Percent of IMPAIRED Estuarine Square Miles
64%NotAssessed
36%ASSESSED
49%Good
51%IMPAIRED
Total Estuaries87,369 square miles
ASSESSED Estuaries31,072 square miles
14,873squaremiles
15,676squaremiles
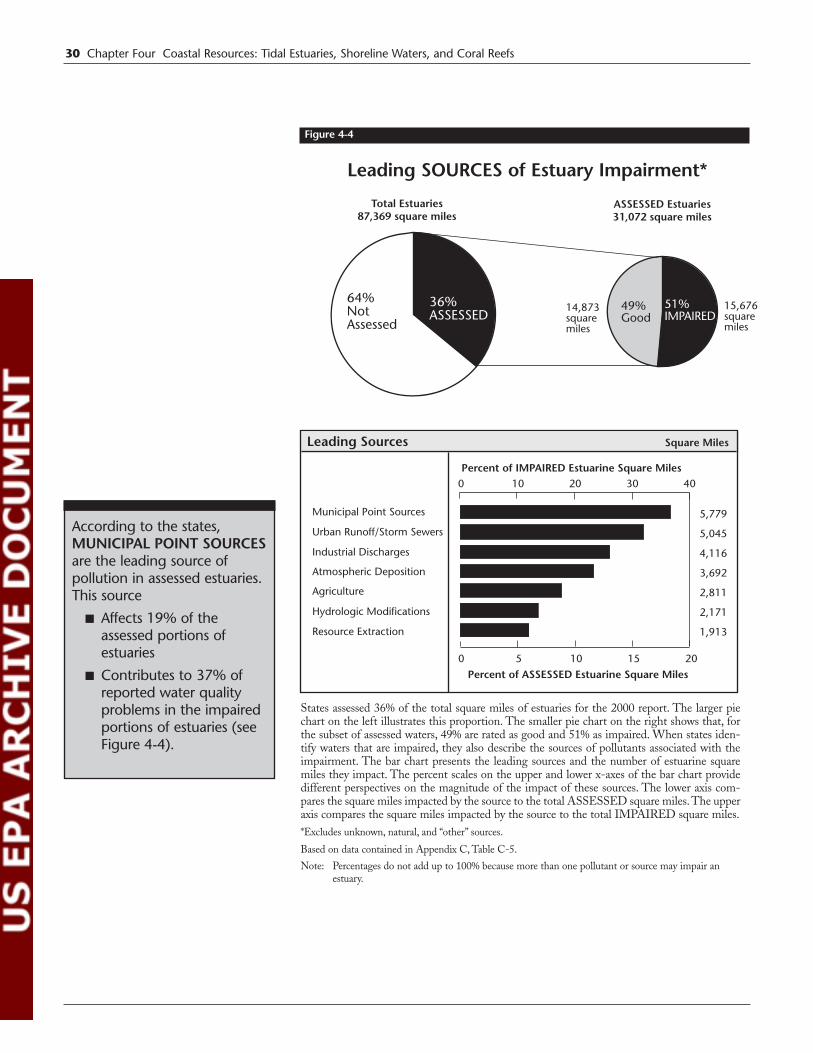
States assessed 36% of the total square miles of estuaries for the 2000 report. The larger piechart on the left illustrates this proportion. The smaller pie chart on the right shows that, forthe subset of assessed waters, 49% are rated as good and 51% as impaired. When states iden-tify waters that are impaired, they also describe the sources of pollutants associated with theimpairment. The bar chart presents the leading sources and the number of estuarine squaremiles they impact. The percent scales on the upper and lower x-axes of the bar chart providedifferent perspectives on the magnitude of the impact of these sources. The lower axis com-pares the square miles impacted by the source to the total ASSESSED square miles.The upperaxis compares the square miles impacted by the source to the total IMPAIRED square miles.*Excludes unknown, natural, and “other” sources.
Based on data contained in Appendix C, Table C-5.
Note: Percentages do not add up to 100% because more than one pollutant or source may impair an estuary.
Figure 4-4
Leading SOURCES of Estuary Impairment*
According to the states,MUNICIPAL POINT SOURCESare the leading source of pollution in assessed estuaries.This source
■ Affects 19% of the assessed portions of estuaries
■ Contributes to 37% of reported water quality problems in the impaired portions of estuaries (see Figure 4-4).
Chapter Four Coastal Resources: Tidal Estuaries, Shoreline Waters, and Coral Reefs 31
plants) are the most widespreadsource of pollution in their assessedestuarine waters. Pollutants in munici-pal discharges degrade aquatic life orinterfere with public use of 5,779square miles of estuarine waters (19%of the assessed estuarine waters and37% of the impaired estuarine waters)(Figure 4-4). The states also reportedthat pollution from urban runoff andstorm sewers impact 5,045 squaremiles of estuarine waters (16% of theassessed estuarine waters and 32% ofthe impaired estuarine waters); indus-trial discharges pollute 4,116 squaremiles of estuarine waters (13% of theassessed estuarine waters and 26% ofthe impaired estuarine waters); andatmospheric deposition of pollutantsimpacts 3,692 square miles of estua-rine waters (12% of the assessed estu-arine waters and 24% of the impairedestuarine waters).
GREAT LAKESSHORELINE
The Great Lakes—Superior,Michigan, Huron, Erie, andOntario—are an important part ofthe physical and cultural heritage ofNorth America. These vast inlandfreshwater seas provide water forconsumption, transportation, power,recreation, fisheries, and a host ofother uses. The Great Lakes basin ishome to more than 10% of the U.S.population and some of the world’slargest concentrations of industrialcapacity. Many consider the GreatLakes the United States’ fourthseacoast.
Six of the eight Great Lakesstates rated general water quality con-ditions in 5,066 miles of Great Lakesshoreline in their 2000 Section 305(b)reports (see Appendix F, Tables F-1and F-2, for individual state informa-tion). These states based less than 1%of their assessments on monitoreddata and evaluated 75% of theassessed shoreline miles with qualita-tive information. The states did notspecify whether the remaining 25% ofthe assessed shoreline miles weremonitored or evaluated.
Summary of UseSupport
The states reported that 22% oftheir assessed Great Lakes shorelinemiles have good water quality thatfully supports designated uses, and allof these supporting waters are threat-ened for one or more uses (Figure 4-5). Some form of pollution or habi-tat degradation impairs the remaining78% of assessed Great Lakes shore-line. This degradation leads to fishconsumption advisories. It is impor-tant to note that two Great Lakesstates, Ohio and Wisconsin, did notreport summary use support status fortheir shoreline waters. EPA used theiraquatic life use support information torepresent summary water qualityconditions. Nearly all of the assessedGreat Lakes shoreline supportsrecreation and drinking water uses.

32 Chapter Four Coastal Resources: Tidal Estuaries, Shoreline Waters, and Coral Reefs
Individual UseSupport
The states establish specific desig-nated uses for waterbodies throughtheir water quality standards. Forreporting purposes, the states consoli-date their more detailed uses into sixgeneral use categories. The standarduses of Great Lakes waters are aquaticlife support, fish consumption, pri-mary contact recreation (such asswimming and diving), secondarycontact recreation (such as boating),drinking water supply, and agriculturaluse.
Six of the eight Great Lakesstates reported the individual usesupport status of their Great Lakesshoreline (see Appendix F, Table F-3,for individual state information).These states report that swimming,secondary contact, drinking water
supply, and agricultural uses are met innearly all assessed shoreline miles(Figure 4-6). The greatest impacts toGreat Lakes shoreline are on fishingactivities.
The states bordering the GreatLakes have issued advisories to restrictconsumption of fish caught alongtheir entire shorelines. Dependingupon location, mercury, PCBs, pesti-cides, or dioxins are found in fishtissues at levels that exceed standardsset to protect human health. Thewater concentrations of most organo-chlorine compounds have declineddramatically since control measuresbegan in the mid-1970s. As a result,concentrations of these contaminantsin fish tissue have also declined,although 4,976 shoreline miles (100%of the assessed Great Lakes waters)still fail to fully support fish consump-tion uses.
Threatenedfor One or More Uses
22%
Impairedfor One or More Uses
Summary of Use Supportin Assessed Great Lakes Shoreline Waters
Figure 4-5
Good22%
78%
This figure presents the status of the assessed Great Lakes shoreline waters. Of the 5,066 milesof Great Lakes shoreline assessed, 22% fully support their designated uses but are threatened,and 78% are impaired for one or more uses.Based on data contained in Appendix F, Table F-2.
Great Lakes Shoreline Miles Assessedby States
5,319 miles = 99% assessedTotal shoreline miles: 20,121e
1992
5,224 miles = 94% assessedTotal shoreline miles: 5,559d
1994
5,186 miles = 94% assessedTotal shoreline miles: 5,521c
1996
8% NotAssessed
92%Assessed
5,066 miles = 92% assessedTotal shoreline miles = 5,521a
2000
4,950 miles = 90% assessedTotal shoreline miles: 5,521b
1998
Of the assessed Great Lakes shorelinewaters:
• <1% were monitored• 75% were evaluated• 25% were not specified
22% Good
78%Impairedfor oneor moreusers
Assessed Water Quality
aSource:bSource:cSource:dSource:eSource:
2000 state Section 305(b) reports.1998 state Section 305(b) reports.1996 state Section 305(b) reports.1994 state Section 305(b) reports.1992 state Section 305(b) reports.
Note: Numbers may not add up to 100% due to rounding.

Chapter Four Coastal Resources: Tidal Estuaries, Shoreline Waters, and Coral Reefs 33
Water QualityProblems Identified in Great LakesShoreline Waters
Only four Great Lakes statesidentified pollutants and sources ofpollutants degrading Great Lakesshoreline (Appendix F, Tables F-4 andF-5, contain individual state informa-tion). Limited conclusions can bedrawn from this fraction of thenation’s Great Lakes shoreline miles.The major causes of impairment citedby the four states were priority toxicorganic chemicals, nutrients, patho-gens, and sedimentation. In addition,oxygen-depleting substances, foulodor and taste, and PCBs causedwater quality impairments (Figure 4-7).
The states reported that contami-nated sediments, urban runoff andstorm sewers, and agriculture are theprimary sources of pollutants thatimpair their Great Lakes shorelinewaters (Figure 4-8). Atmosphericdeposition, habitat modification, landdisposal, and septic tanks were alsocited as sources of pollution.
Drinking Water Supply
Fish Consumption
Primary Contact –Swimming
Agriculture
Secondary Contact
Good Impaired(Partially
Supporting or NotSupporting)
Percent
1,343
4,976
3,663
3,256
3,313
3,250
Figure 4-6
82
(Fully Supportingor Threatened)Designated
Use
18
100
0
97
3
100
<1
100
0
2
98
Good waterquality supportsswimming in 97%of the shorelinemiles assessed.
Individual Use Support in the Great Lakes
MilesAssessed
Aquatic Life Support
This figure presents a tally of the miles of Great Lakes shorelineassessed by states for each category of designated use. For eachcategory, the figure summarizes the proportion of the assessedwaters rated according to quality.Based on data contained in Appendix F, Table F-3.

34 Chapter Four Coastal Resources: Tidal Estuaries, Shoreline Waters, and Coral Reefs
Percent of ASSESSED Great Lakes Shoreline Miles
Percent of IMPAIRED Great Lakes Shoreline Miles
497
109
102
98
73
53
43
Leading Pollutants/Stressors Miles
Priority Toxic Organic Chemicals
Nutrients
Pathogens (Bacteria)
Sedimentation/Siltation
Oxygen-Depleting Substances
Taste and Odor
PCBs
0 2 4 6 8 10 12
0 2 4 6 8 10 1612 14
22%Good
Total Great Lakes Shoreline5,521 miles
ASSESSED Great Lakes Shoreline5,066 miles
1,095 miles
92%ASSESSED
8%NotAssessed
78%IMPAIRED3,955 miles
States assessed 92% of the total miles of Great Lakes shoreline for the 2000 report. The largerpie chart on the left illustrates this proportion. The smaller pie chart on the right shows that, forthe subset of assessed waters, 22% are rated as good and 78% as impaired. When states identifywaters that are impaired, they describe the pollutants or processes causing or contributing to theimpairment. The bar chart presents the leading causes and the number of Great Lakes shorelinemiles impacted. The percent scales on the upper and lower x-axes of the bar chart providedifferent perspectives on the magnitude of the impact of these pollutants. The lower axiscompares the miles impacted by the pollutant to the total ASSESSED miles. The upper axiscompares the miles impacted by the pollutant to the total IMPAIRED miles.Based on data contained in Appendix F, Table F-4.
Note: Percentages do not add up to 100% because more than one pollutant or source may impair a segment of Great Lakes shoreline.
Figure 4-7
Leading POLLUTANTS in ImpairedGreat Lakes Shoreline Waters

Chapter Four Coastal Resources: Tidal Estuaries, Shoreline Waters, and Coral Reefs 35
g p
22%Good
Total Great Lakes Shoreline5,521 miles
ASSESSED Great Lakes Shoreline5,066 miles
1,095 miles
92%ASSESSED
8%NotAssessed
78%IMPAIRED
Percent of ASSESSED Great Lakes Shoreline Miles
Percent of IMPAIRED Great Lakes Shoreline Miles
Contaminated Sediments
Urban Runoff/Storm Sewers
Agriculture
Atmospheric Deposition
Habitat Modification
Land Disposal
Septic Tanks
519
152
75
71
62
61
61
MilesLeading Sources
3,955 miles
0 2 4 6 8 10 12
0 2 4 6 8 10 1612 14
States assessed 92% of the total miles of Great Lakes shoreline for the 2000 report. The largerpie chart on the left illustrates this proportion. The smaller pie chart on the right shows that, forthe subset of assessed waters, 22% are rated as good and 78% as impaired. When states identifywaters that are impaired, they also describe the sources of pollutants associated with the impair-ment. The bar chart presents the leading sources and the number of Great Lakes shoreline milesthey impact. The percent scales on the upper and lower x-axes of the bar chart provide differentperspectives on the magnitude of the impact of these sources. The lower axis compares the milesimpacted by the source to the total ASSESSED miles. The upper axis compares the milesimpacted by the source to the total IMPAIRED miles.Based on data contained in Appendix F, Table F-5.
Note: Percentages do not add up to 100% because more than one pollutant or source may impair a segment of Great Lakes shoreline.
Figure 4-8
Leading SOURCES of Great LakesShoreline Impairment
The pollutants/processesand sources shown heremay not corresponddirectly to one another(i.e., the leading pollutantmay not originate from theleading source). This mayoccur because a majorpollutant may be releasedfrom many minor sources.It also happens whenstates do not have theinformation to determineall the sources of a particu-lar pollutant/stressor.

(including Alaska’s 36,000 miles ofcoastline) or 14% of the 22,618 milesof national coastline excluding Alaska.The states based 34% of their assess-ments on monitored data and 59% onqualitative information (see AppendixC, Table C-6, for individual stateinformation). The states did notspecify whether 7% of the assessedcoastal shoreline waters were moni-tored or evaluated.
Summary of UseSupport
The states reported that 86%(2,755 miles) of their assessed oceanshoreline miles have good quality thatsupports a healthy aquatic communityand public activities (Figure 4-9). Ofthe assessed waters, 79% fully supportdesignated uses and 7% are threatenedfor one or more uses. Some form ofpollution or habitat degradationimpairs the remaining 14% of theassessed shoreline.
36 Chapter Four Coastal Resources: Tidal Estuaries, Shoreline Waters, and Coral Reefs
OCEAN SHORE-LINE WATERS
The oceans are of incalculablevalue to our planet. The global oceanaffects the health and safety of theworld by providing food, recreation,local weather amelioration, and globalclimate stabilization. Predictions saythat 75% of the U.S. population willlive, work, or play along ocean coastsby the year 2015.
Fourteen of the 27 coastal statesand territories rated general waterquality conditions in some of theircoastal waters (see Appendix C, TableC-6, for individual state information).Texas provided information on itsocean shoreline waters based onsquare miles rather than linear miles.Consequently, their data could not beaggregated with those reported by theother states.
Altogether, these states assessed3,221 miles of ocean shoreline, whichequals 5.5% of the nation’s coastline
Ocean Shoreline Waters Assessedby States
Including Alaska’s Ocean Shoreline
3,398 miles = 17% assessedTotal ocean shoreline miles: 20,121e
1992
5,208 miles = 9% assessedTotal ocean shoreline miles: 58,421d
1994
aSource:bSource:cSource:dSource:eSource:
2000 state Section 305(b) reports.1998 state Section 305(b) reports.1996 state Section 305(b) reports.1994 state Section 305(b) reports.1992 state Section 305(b) reports.
3,651 miles = 6% assessed Totalocean shoreline miles: 22,585c
1996
6% Assessed
94% Not Assessed
3,221 miles = 6% assessedTotal ocean shoreline miles = 58,618a
2000
3,130 miles = 5% assessedTotal ocean shoreline miles: 66,645b
1998
14% Impaired for one or more uses
86% Good
Assessed Water Quality Threatenedfor One or More Uses
Impairedfor One or More Uses
Summary of Use Supportin Assessed Ocean Shoreline Waters
Fully SupportingAll Uses
Figure 4-9
Good86%
7%
79%
14%
This figure presents the status of the assessed miles of ocean shoreline. Of the 3,218 miles oceanshoreline assessed, 86% fully support their designated uses and 14% are impaired for one or moreuses. Seven percent of the assessed waters are fully supporting uses but threatened.Note: Numbers may not add to 100% due to rounding.Based on data contained in Appendix C, Table C-6.

Chapter Four Coastal Resources: Tidal Estuaries, Shoreline Waters, and Coral Reefs 37
Individual UseSupport
The states establish specific desig-nated uses for waterbodies throughtheir water quality standards. Forreporting purposes, the states consoli-date their more detailed uses into fivegeneral use categories. The standarduses of ocean coastal waters consist ofaquatic life support, fish consumption,shellfish harvesting, primary contactrecreation (such as swimming anddiving), and secondary contact recre-ation (such as boating). Few statesdesignate saline ocean waters fordrinking water supply and agriculturaluse because of high treatment costs.
The states provided limited infor-mation on individual use support inocean shoreline waters (Appendix C,Table C-7, contains individual stateinformation). Swimming was themost often rated use. Limited conclu-sions can be drawn from this fractionof the nation’s ocean shoreline miles.The reporting states indicated that thegreatest impacts to coastal shorelineare on swimming and shellfishing(Figure 4-10). It is important to notethat 15 states have adopted statewidecoastal fish consumption advisories formercury, PCBs, and other pollutants.The effect of these advisories is notreflected in Figure 4-10.
Good Impaired(Partially
Supporting or NotSupporting)
Percent
2,079
1,136
1,420
2,521
1,925
Figure 4-10
94
(Fully Supportingor Threatened)Designated
Use
9
91
86
14
85
15
9
91
Good water qualitysupports swimming in 85% of thewaters assessed
Individual Use Support in Ocean Shoreline Waters
MilesAssessed
Fish Consumption
Aquatic Life Support
Primary Contact –Swimming
Secondary Contact
Shellfishing
6
This figure presents a tally of the miles of ocean shoreline assessedby states for each category of designated use. For each category, thefigure summarizes the proportion of the assessed waters ratedaccording to quality.Based on data contained in Appendix C, Table C-7.

38 Chapter Four Coastal Resources: Tidal Estuaries, Shoreline Waters, and Coral Reefs
Water QualityProblems Identified in Ocean ShorelineWaters
Of the 14 states that reported oncoastal waters, 10 identified pollutantsand sources of pollutants degradingocean shoreline waters (Appendix C,Tables C-8 and C-9, contain individ-ual state information). The primarypollutants and stressors reported bythe 10 states include bacteria (patho-gens), oxygen-depleting substances,turbidity and suspended solids,(Figure 4-11). The primary sourcesreported include urban runoff andstorm sewers, nonpoint sources, landdisposal of wastes, septic tanks, andmunicipal point sources (sewage treat-ment plants (Figure 4-12).
Leading Pollutants/Stressors
Pathogens (Bacteria)
Oxygen-DepletingSubstances
Turbidity
Suspended Solids
Oil and Grease
Metals
Nutrients
Percent of ASSESSED Shoreline Miles
384
102
53
50
48
46
43
0 4
0 10 20 30 40 50 60 70Percent of IMPAIRED Shoreline Miles
Miles
94%NotAssessed
6%ASSESSED
86%Good
14%IMPAIRED
Total Ocean Shoreline58,618 miles
ASSESSED Ocean Shoreline3,221 miles*
2,755miles
434miles
2 6 10
80 90
8 12
States assessed 6% of the total miles of ocean shoreline for the 2000 report. The larger pie charton the left illustrates this proportion. The smaller pie chart on the right shows that, for the subsetof assessed waters, 86% are rated as good and 14% as impaired. When states identify waters thatare impaired, they describe the pollutants or processes causing or contributing to the impairment.The bar chart presents the leading causes and the number of ocean shoreline miles impacted. Thepercent scales on the upper and lower x-axes of the bar chart provide different perspectives on themagnitude of the impact of these pollutants. The lower axis compares the miles impacted by thepollutant to the total ASSESSED miles. The upper axis compares the miles impacted by thepollutant to the total IMPAIRED miles.Based on data contained in Appendix C, Table C-8.
*Includes miles assessed as not attainable.Note: Percentages do not add up to 100% because more than one pollutant or source may impair a segment
of ocean shoreline.
Figure 4-11
Leading POLLUTANTS in ImpairedOcean Shoreline Waters

Chapter Four Coastal Resources: Tidal Estuaries, Shoreline Waters, and Coral Reefs 39
Leading Sources
0 4
Urban Runoff/StormSewers
Nonpoint Sources
Land Disposal
Septic Tanks
Municipal Point Sources
Industrial Discharges
Construction
Percent of ASSESSED Shoreline Miles
0 10 20 30 40 50 60
Percent of IMPAIRED Shoreline Miles
241
142
123
103
89
76
29
Miles
94%NotAssessed
6%ASSESSED
86%Good
14%IMPAIRED
Total Ocean Shoreline58,618 miles
ASSESSED Ocean Shoreline3,221 miles†
2,755miles
434miles
2 6 8
States assessed 6% of the total miles of ocean shoreline for the 2000 report. The larger piechart on the left illustrates this proportion. The smaller pie chart on the right shows that, forthe subset of assessed waters, 86% are rated as good and 14% as impaired. When states iden-tify waters that are impaired, they also describe the sources of pollutants associated with theimpairment. The bar chart presents the leading sources and the number of ocean shorelinemiles they impact. The percent scales on the upper and lower x-axes of the bar chart providedifferent perspectives on the magnitude of the impact of these sources. The lower axiscompares the miles impacted by the source to the total ASSESSED miles. The upper axiscompares the miles impacted by the source to the total IMPAIRED miles.Based on data contained in Appendix C, Table C-9.
*Excludes natural sources.†Includes miles assessed as not attainable.
Note: Percentages do not add up to 100% because more than one pollutant or source may impair asegment of ocean shoreline.
Figure 4-12
Leading SOURCES of OceanShoreline Impairment*
The pollutants/processesand sources shown heremay not corresponddirectly to one another(i.e., the leading pollutantmay not originate from theleading source). This mayoccur because a majorpollutant may be releasedfrom many minor sources.It also happens whenstates do not have theinformation to determineall the sources of a particu-lar pollutant/stressor.
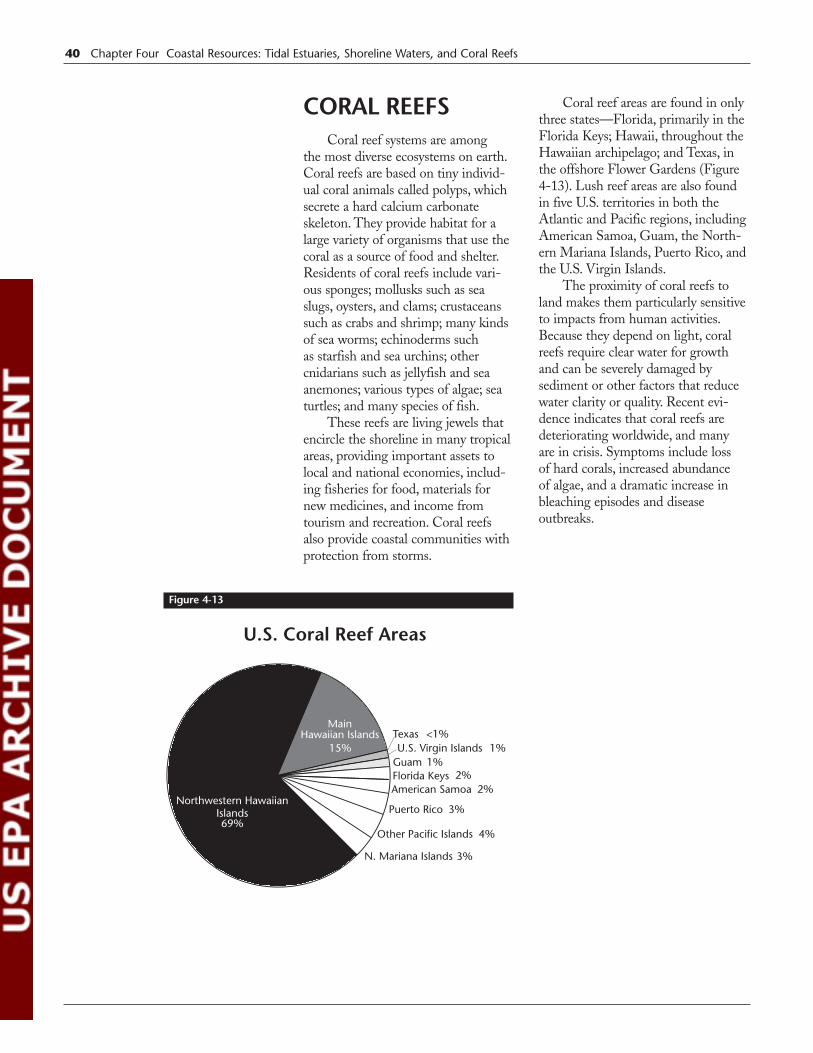
CORAL REEFSCoral reef systems are among
the most diverse ecosystems on earth.Coral reefs are based on tiny individ-ual coral animals called polyps, whichsecrete a hard calcium carbonateskeleton. They provide habitat for alarge variety of organisms that use thecoral as a source of food and shelter.Residents of coral reefs include vari-ous sponges; mollusks such as seaslugs, oysters, and clams; crustaceanssuch as crabs and shrimp; many kindsof sea worms; echinoderms such as starfish and sea urchins; othercnidarians such as jellyfish and seaanemones; various types of algae; seaturtles; and many species of fish.
These reefs are living jewels thatencircle the shoreline in many tropicalareas, providing important assets tolocal and national economies, includ-ing fisheries for food, materials fornew medicines, and income fromtourism and recreation. Coral reefsalso provide coastal communities withprotection from storms.
Coral reef areas are found in onlythree states—Florida, primarily in theFlorida Keys; Hawaii, throughout theHawaiian archipelago; and Texas, inthe offshore Flower Gardens (Figure4-13). Lush reef areas are also foundin five U.S. territories in both theAtlantic and Pacific regions, includingAmerican Samoa, Guam, the North-ern Mariana Islands, Puerto Rico, andthe U.S. Virgin Islands.
The proximity of coral reefs toland makes them particularly sensitiveto impacts from human activities.Because they depend on light, coralreefs require clear water for growthand can be severely damaged bysediment or other factors that reducewater clarity or quality. Recent evi-dence indicates that coral reefs aredeteriorating worldwide, and many are in crisis. Symptoms include loss of hard corals, increased abundance of algae, and a dramatic increase inbleaching episodes and diseaseoutbreaks.
40 Chapter Four Coastal Resources: Tidal Estuaries, Shoreline Waters, and Coral Reefs
U.S. Coral Reef Areas
MainHawaiian Islands
15%
N. Mariana Islands 3%
Florida Keys 2%American Samoa 2%
Puerto Rico 3%
Other Pacific Islands 4%
Northwestern HawaiianIslands69%
Texas <1%U.S. Virgin Islands 1%
Guam 1%
Figure 4-13
Chapter Four Coastal Resources: Tidal Estuaries, Shoreline Waters, and Coral Reefs 41
Coral Reef DegradationNatural impacts to coral reefs
occur as a result of hurricanes andsevere storms. Outbreaks of Crown-of-Thorn starfish populations thatfeed voraciously on coral polyps killlarge parts of Pacific Ocean reefs.Coral bleaching and other coraldiseases are also stressing coral reefecosystems in both the Atlantic andPacific.
Human activities also can causesignificant impacts to coral popula-tions. These activities include:
■ Introduction of alien species fromballast water of international cargoships
■ Removal of selected tropical fishand invertebrate species for the aquar-ium trade
■ Commercial and recreational fishingpressures
■ Marine debris, petroleum, and othertoxic chemical spills
■ Nutrient pollution from nonpointsource agricultural runoff or frompoint source discharges from sewagetreatment facilities
■ Sediment runoff
■ Offshore dredging activities
■ Marine tourism
■ Urbanization of coastal areas.
In an effort to prevent further loss of coral reef ecosystems, the U.S.Coral Reef Task Force was establishedin 1998. The task force comprisesmany federal agencies including EPA,and is charged with mapping andmonitoring coral reefs, researchingcoral reef degradation, working toimplement measures to protect coralreefs, and promoting coral reef conser-vation worldwide. More informationon the interagency efforts to study andprotect coral reefs is available on theInternet at http://coralreef.gov.
In 2000, a major protectionmeasure was enacted for the coralreefs of the northwest HawaiianIslands, which represent nearly 70% of the coral reefs in U.S. waters.The area was designated as a federalEcosystem Reserve and is the largestnature preserve ever established in theUnited States. It will protect morethan 4,000 square miles of some ofthe most extensive and pristine coralreefs in U.S. waters. The reefs extendfrom near-shore areas just beneath theocean surface to a depth of 600 feet,as much as 100 miles out to sea.
For more information on each of the states and territories with coralreef resources, refer to Chapter 10(state summaries).