Living Income Report - ICI Cocoa Initiative...Living Income Report Rural Ghana Cocoa growing areas...
64
Living Income Report Rural Ghana Cocoa growing areas of Ashanti, Central, Eastern, and Western Regions By: Sally Smith, Research Consultant, with Daniel Sarpong, University of Ghana Photos courtesy of University of Ghana Series 1, Report 1, 21 September 2018 Prepared for: The Living Income Community of Practice www.living-income.com
Transcript of Living Income Report - ICI Cocoa Initiative...Living Income Report Rural Ghana Cocoa growing areas...

Living Income Report Rural Ghana Cocoa growing areas of Ashanti, Central, Eastern, and Western Regions
By: Sally Smith, Research Consultant, with Daniel Sarpong, University of Ghana
Photos courtesy of University of Ghana
Series 1, Report 1, 21 September 2018
Prepared for: The Living Income Community of Practice
www.living-income.com
Living Income Report for Cocoa Growing Regions of Ghana
© Living Income Community of Practice 2
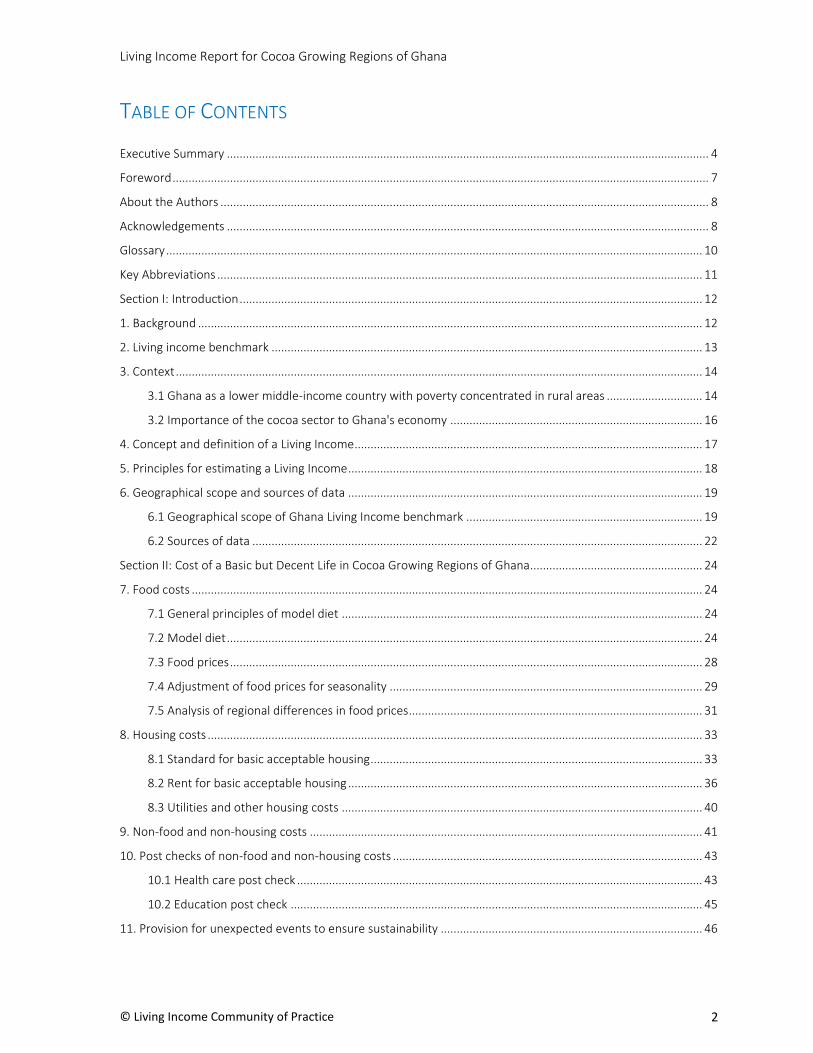
TABLE OF CONTENTS
Executive Summary ....................................................................................................................................................... 4
Foreword ........................................................................................................................................................................ 7
About the Authors ......................................................................................................................................................... 8
Acknowledgements ....................................................................................................................................................... 8
Glossary ........................................................................................................................................................................ 10
Key Abbreviations ........................................................................................................................................................ 11
Section I: Introduction ................................................................................................................................................. 12
1. Background .............................................................................................................................................................. 12
2. Living income benchmark ....................................................................................................................................... 13
3. Context ..................................................................................................................................................................... 14
3.1 Ghana as a lower middle-income country with poverty concentrated in rural areas .............................. 14
3.2 Importance of the cocoa sector to Ghana's economy ............................................................................... 16
4. Concept and definition of a Living Income ............................................................................................................. 17
5. Principles for estimating a Living Income ............................................................................................................... 18
6. Geographical scope and sources of data ............................................................................................................... 19
6.1 Geographical scope of Ghana Living Income benchmark .......................................................................... 19
6.2 Sources of data ............................................................................................................................................. 22
Section II: Cost of a Basic but Decent Life in Cocoa Growing Regions of Ghana...................................................... 24
7. Food costs ................................................................................................................................................................ 24
7.1 General principles of model diet ................................................................................................................. 24
7.2 Model diet ..................................................................................................................................................... 24
7.3 Food prices .................................................................................................................................................... 28
7.4 Adjustment of food prices for seasonality .................................................................................................. 29
7.5 Analysis of regional differences in food prices............................................................................................ 31
8. Housing costs ........................................................................................................................................................... 33
8.1 Standard for basic acceptable housing ........................................................................................................ 33
8.2 Rent for basic acceptable housing ............................................................................................................... 36
8.3 Utilities and other housing costs ................................................................................................................. 40
9. Non-food and non-housing costs ........................................................................................................................... 41
10. Post checks of non-food and non-housing costs ................................................................................................. 43
10.1 Health care post check ............................................................................................................................... 43
10.2 Education post check ................................................................................................................................. 45
11. Provision for unexpected events to ensure sustainability .................................................................................. 46
Living Income Report for Cocoa Growing Regions of Ghana
© Living Income Community of Practice 3
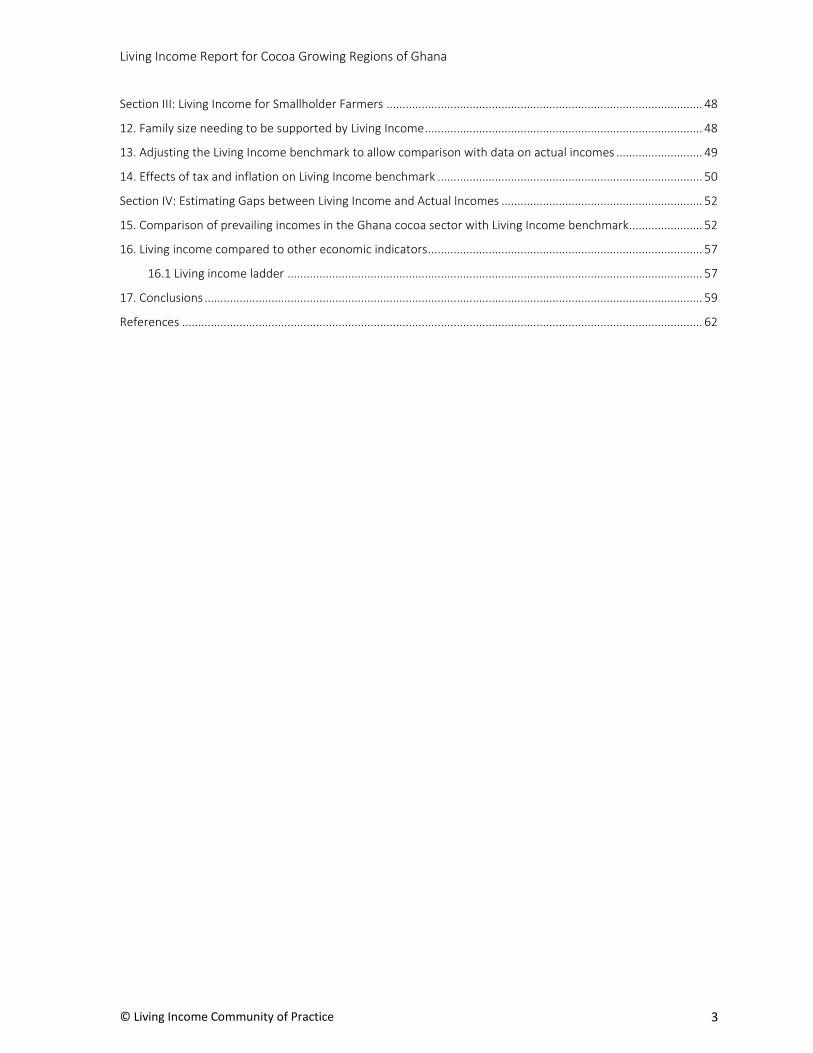
Section III: Living Income for Smallholder Farmers ................................................................................................... 48
12. Family size needing to be supported by Living Income ....................................................................................... 48
13. Adjusting the Living Income benchmark to allow comparison with data on actual incomes ........................... 49
14. Effects of tax and inflation on Living Income benchmark ................................................................................... 50
Section IV: Estimating Gaps between Living Income and Actual Incomes ............................................................... 52
15. Comparison of prevailing incomes in the Ghana cocoa sector with Living Income benchmark ....................... 52
16. Living income compared to other economic indicators ...................................................................................... 57
16.1 Living income ladder .................................................................................................................................. 57
17. Conclusions ............................................................................................................................................................ 59
References ................................................................................................................................................................... 62
Living Income Report for Cocoa Growing Regions of Ghana
© Living Income Community of Practice 4
EXECUTIVE SUMMARY
This report presents a Living Income benchmark for cocoa producing areas of Ghana. The benchmark was commissioned by the Living Income Community of Practice, which brings together sustainability standards systems, businesses, government bodies, NGOs, finance and producer groups to support activities focused on improving smallholder incomes, and enabling farmers to achieve a decent standard of living. Through this study, and a sister study in Côte d'Ivoire, the Community aims to establish credible, robust Living Income benchmarks for critical cocoa growing regions in the two countries and contribute to the dialogue on how to help farmers reach these benchmarks.
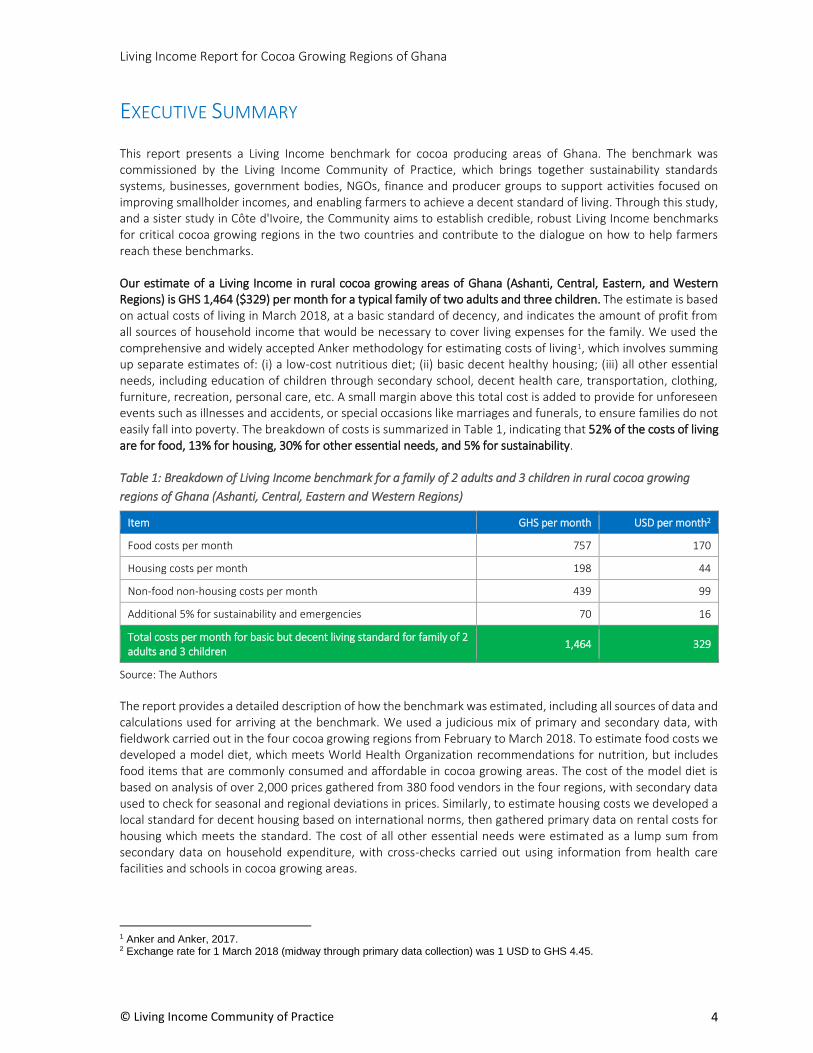
Our estimate of a Living Income in rural cocoa growing areas of Ghana (Ashanti, Central, Eastern, and Western Regions) is GHS 1,464 ($329) per month for a typical family of two adults and three children. The estimate is based on actual costs of living in March 2018, at a basic standard of decency, and indicates the amount of profit from all sources of household income that would be necessary to cover living expenses for the family. We used the comprehensive and widely accepted Anker methodology for estimating costs of living1, which involves summing up separate estimates of: (i) a low-cost nutritious diet; (ii) basic decent healthy housing; (iii) all other essential needs, including education of children through secondary school, decent health care, transportation, clothing, furniture, recreation, personal care, etc. A small margin above this total cost is added to provide for unforeseen events such as illnesses and accidents, or special occasions like marriages and funerals, to ensure families do not easily fall into poverty. The breakdown of costs is summarized in Table 1, indicating that 52% of the costs of living are for food, 13% for housing, 30% for other essential needs, and 5% for sustainability.
Table 1: Breakdown of Living Income benchmark for a family of 2 adults and 3 children in rural cocoa growing
regions of Ghana (Ashanti, Central, Eastern and Western Regions)
Item GHS per month USD per month2
Food costs per month 757 170
Housing costs per month 198 44
Non-food non-housing costs per month 439 99
Additional 5% for sustainability and emergencies 70 16
Total costs per month for basic but decent living standard for family of 2 adults and 3 children
1,464 329
Source: The Authors
The report provides a detailed description of how the benchmark was estimated, including all sources of data and calculations used for arriving at the benchmark. We used a judicious mix of primary and secondary data, with fieldwork carried out in the four cocoa growing regions from February to March 2018. To estimate food costs we developed a model diet, which meets World Health Organization recommendations for nutrition, but includes food items that are commonly consumed and affordable in cocoa growing areas. The cost of the model diet is based on analysis of over 2,000 prices gathered from 380 food vendors in the four regions, with secondary data used to check for seasonal and regional deviations in prices. Similarly, to estimate housing costs we developed a local standard for decent housing based on international norms, then gathered primary data on rental costs for housing which meets the standard. The cost of all other essential needs were estimated as a lump sum from secondary data on household expenditure, with cross-checks carried out using information from health care facilities and schools in cocoa growing areas.
1 Anker and Anker, 2017. 2 Exchange rate for 1 March 2018 (midway through primary data collection) was 1 USD to GHS 4.45.

Living Income Report for Cocoa Growing Regions of Ghana
© Living Income Community of Practice 5
It should be emphasized that the Living Income benchmark is a conservative figure based on minimum standards for decency in the local context, taking into account international conventions and standards in the 21st century. For example, 44% of calories in our model diet come from maize and cassava, and we allow for only two servings of fresh meat or fish a week, with other protein coming from lower cost sources such as dried and salted fish, groundnuts and beans. Our local standard for decent housing allows shared use of toilets and piped water with other households, and includes covered porches as part of the living space. We also assume cocoa farmers send their children to government schools, not private schools, and that most family members are covered by the national health insurance scheme.
This sensitivity to the local context, and transparency in how the figures were arrived at, is important for ensuring the benchmark is widely accepted and helps the ongoing process of stakeholder dialogue around improving smallholder farmer incomes in the Ghanaian cocoa sector. In order to further support this process, an assessment of the gap between our Living Income benchmark and actual incomes was carried out by the Royal Tropical Institute (KIT), using data from their representative survey of 3,045 farming households in cocoa growing areas of Ghana and Côte d'Ivoire3. KIT's analysis4 grouped cocoa farming households into three clusters: male headed households with less than 4 hectares of productive cocoa, which accounted for 58% of cocoa producing households in their survey and were therefore deemed 'typical' cocoa households; female headed households, representing 24% of cocoa producing households in the survey, and male headed households with 4 or more hectares of productive cocoa ('large male headed households', representing 18% of cocoa households). Since the size and composition of households varied across these three groups, we adjusted the Living Income benchmark to better match the average household in each group. This allowed for a more accurate estimate of the gap between actual incomes and a Living Income.
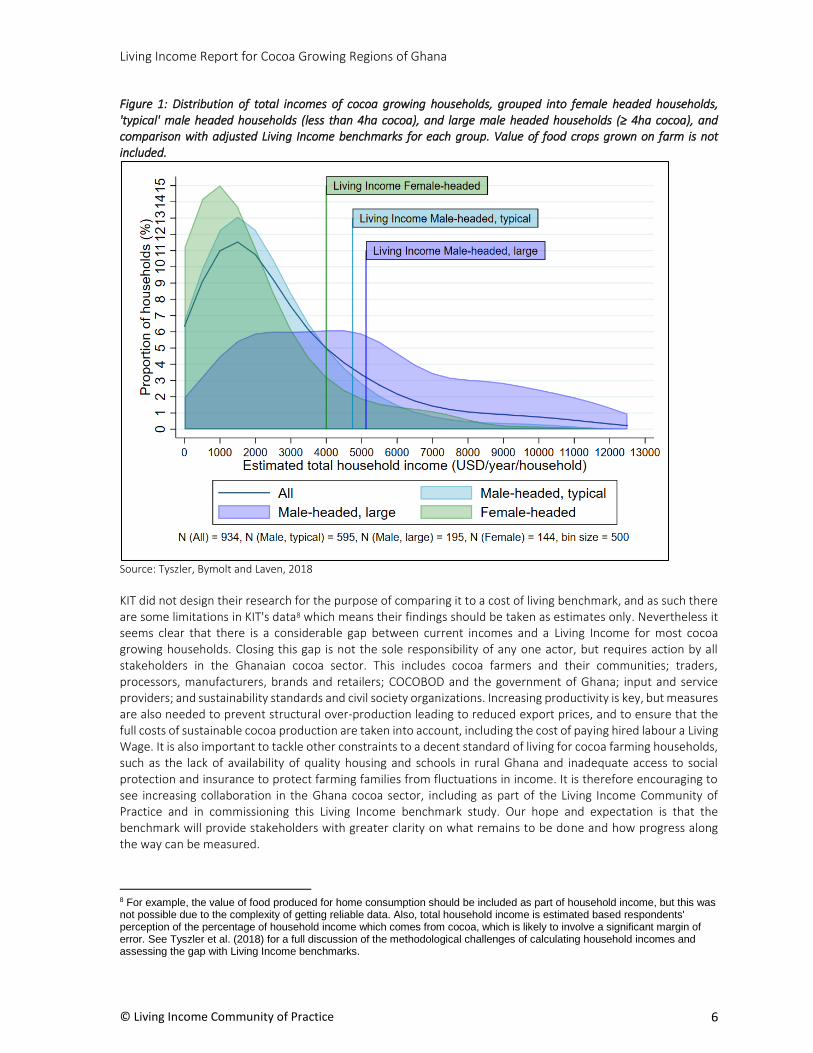
KIT calculated the average income for typical cocoa farming households to be GHS 10,180 ($2,288) per year5, or GHS 848 ($191) per month. This is 48% of the adjusted Living Income benchmark of GHS 1,758 ($395) for that group6. Female headed households have a lower average income of GHS 7,794 ($1,752) per year, or GHS 650 ($146) per month, which equates to 44% of the adjusted Living Income benchmark of GHS 1,484 ($333)7. The average income of large male headed households is GHS 22,714 ($5,104), or GHS 1,893 ($425) per month, which is very close to the adjusted Living Income benchmark of GHS 1,900 ($427) per month. These income estimates do not include or account for the value of food crops produced on the farm. KIT also looked at the percentage of households in each group which achieved the adjusted benchmarks. They found that 9.4% of typical male headed cocoa growing households, 9.7% of female headed households, and 43.6% of large male headed households had incomes which met or exceeded the Living Income benchmark (see Figure 1). Across the whole sample, only 17% of households achieve the benchmark.
3 Bymolt, Laven and Tyszler, 2018 4 Tyszler, Bymolt and Laven, 2018. 5 Adjusted for inflation to March 2018. 6 Based on an average household with 3.5 adults and 2.5 children. 7 Based on an average household with 3 adults and 2 children.
Living Income Report for Cocoa Growing Regions of Ghana
© Living Income Community of Practice 6
Figure 1: Distribution of total incomes of cocoa growing households, grouped into female headed households, 'typical' male headed households (less than 4ha cocoa), and large male headed households (≥ 4ha cocoa), and comparison with adjusted Living Income benchmarks for each group. Value of food crops grown on farm is not included.
Source: Tyszler, Bymolt and Laven, 2018
KIT did not design their research for the purpose of comparing it to a cost of living benchmark, and as such there are some limitations in KIT's data8 which means their findings should be taken as estimates only. Nevertheless it seems clear that there is a considerable gap between current incomes and a Living Income for most cocoa growing households. Closing this gap is not the sole responsibility of any one actor, but requires action by all stakeholders in the Ghanaian cocoa sector. This includes cocoa farmers and their communities; traders, processors, manufacturers, brands and retailers; COCOBOD and the government of Ghana; input and service providers; and sustainability standards and civil society organizations. Increasing productivity is key, but measures are also needed to prevent structural over-production leading to reduced export prices, and to ensure that the full costs of sustainable cocoa production are taken into account, including the cost of paying hired labour a Living Wage. It is also important to tackle other constraints to a decent standard of living for cocoa farming households, such as the lack of availability of quality housing and schools in rural Ghana and inadequate access to social protection and insurance to protect farming families from fluctuations in income. It is therefore encouraging to see increasing collaboration in the Ghana cocoa sector, including as part of the Living Income Community of Practice and in commissioning this Living Income benchmark study. Our hope and expectation is that the benchmark will provide stakeholders with greater clarity on what remains to be done and how progress along the way can be measured.
8 For example, the value of food produced for home consumption should be included as part of household income, but this was not possible due to the complexity of getting reliable data. Also, total household income is estimated based respondents' perception of the percentage of household income which comes from cocoa, which is likely to involve a significant margin of error. See Tyszler et al. (2018) for a full discussion of the methodological challenges of calculating household incomes and assessing the gap with Living Income benchmarks.
Living Income Report for Cocoa Growing Regions of Ghana
© Living Income Community of Practice 7
FOREWORD This study is the first collaborative effort to estimate the costs of a decent standard of living for the cocoa regions in Ghana and test the usefulness of having such a Living Income benchmark. Tracking how sustainability programs are affecting the lives of farming families has long been a challenge for governments, advocates, standard organizations and industry. There have been efforts to help different actors align on the metrics to be used to track progress and the reference benchmarks for poverty and livelihood improvements. The recent momentum to understand Living Wages for workers within the Global Living Wage Coalition has offered the cocoa sector a model of how to determine a credible benchmark for a decent standard of living for farmers in agricultural production regions.
This research is supported by a diverse group of stakeholders invested in the ongoing sustainability of the Ghanaian cocoa sector. The study is coordinated by the Living Income Community of Practice, an open learning space focused on improving incomes of smallholder farmers, led by GIZ, the ISEAL Alliance and the Sustainable Food Lab. Steering Committee members express different interests in this study:
Industry leaders Cargill and Mars are interested in a credible, third party benchmark to inform aspirational targets and assess progress in value chain initiatives;
NGO CARE will use the study to enhance the design and implementation of programs that significantly improve farmers' livelihoods;
Fairtrade International is exploring how to implement its Living Income strategy for cocoa in West Africa, including adapted price-setting, to contribute to higher incomes for farmers.
Public sector organization Gesellschaft für Internationale Zusammenarbeit (GIZ) is keen to see an aspirational threshold added to their donor programs;
Ghana’s largest farmer organization Kuapa Kokoo Union is interested to measure the effectiveness of their member programs on cocoa and non-cocoa crops;
Lindt Cocoa Foundation welcomes the development of this benchmark, as it offers a way to better target sustainable cocoa program interventions towards a Living Income for farmers.
Rainforest Alliance, and their Utz Sector Partnerships Programme, is exploring how to adapt their different strategies to contribute to higher incomes among cocoa farmers.
Advocacy organization, the VOICE Network, has been promoting Living Income and wants the industry to pay fair prices and invest in improving the livelihoods of cocoa farmers;
World Cocoa Foundation is interested to know how this benchmark will be a reference point for company members as they support farmers in their cocoa sustainability programs including CocoaAction M&E systems.
This study aims to contribute practical evidence to the conversation on what constitutes a decent standard of living for cocoa farming families and the gap that needs to be addressed. Having a quantitative, credible study of the costs of living will allow deeper and more evidence based dialogue on assessing whether the collective efforts of government, civil society and industry are adding up to the aspirational goals of a sustainable cocoa sector.
On behalf of the Living Income Community of Practice,
Stephanie Daniels Friederike Martin Marta Maireles Sustainable Food Lab GIZ ISEAL

Living Income Report for Cocoa Growing Regions of Ghana
© Living Income Community of Practice 8
ABOUT THE AUTHORS
Sally Smith is an independent consultant with 20 years research experience of inclusive and sustainable development in the context of global market systems. Previously at the Institute of Development Studies at the University of Sussex, she has conducted studies in various agricultural and non-agricultural sectors (e.g. bananas, coffee, cocoa, horticulture, garments, and personal care), across Africa, Asia and Latin America. She has specialist knowledge of: sustainability standards and fair trade; decent work, Living Wages and Living Incomes; gender and women's empowerment; and impact monitoring and evaluation. During her career she has carried out research for many different organizations, including IFAD, WFP, Fairtrade International, Ethical Trading Initiative, Open Society Foundation and Comic Relief, and has published widely in academic journals and books.
Daniel Sarpong, Ph.D. is Dean of the School of Agriculture, College of Basic and Applied Sciences, University of Ghana, and an Agricultural Economist. He teaches courses at both graduate and undergraduate levels in Microeconomics and Macroeconomics, Research Methodology, Statistics and (Applied) Econometrics, and Scientific Writing and Seminar Delivery. He has over 60 published journal articles, technical publications and other reports. He provides scientific analysis of socio-economics of agricultural households and their impacts on the macro-economy. He has collaborated with several research institutes and universities, including IFPRI, Tufts University, University of Georgia, Global Alliance for Improved Nutrition (GAIN), IDS, ODI, and Leuven University (Sweden).
ACKNOWLEDGEMENTS
The Living Income Community of Practice co-host, Sustainable Food Lab, coordinated this study and a consortium of actors in the cocoa sector provided the financial support. Generous thanks to the funders of this study: Cargill, Fairtrade International, GIZ, Lindt Cocoa Foundation, Mars and Rainforest Alliance UTZ Sector Partnerships Programme.
The coordination and research teams were also supported by the following two committees, without whose
input and support we would not have been able to complete the report nor engage the necessary stakeholders
in Ghana:
Technical Committee and advisors: Martha and Richard Anker, Jessi Grillo (OnUp Consulting -formerly with
Rainforest Alliance); Kristin Komives (ISEAL); Michelle Bhattacharyya (Global Living Wage Coalition); Friedel
Huetz-Adams (Suedwind Institut).
Steering Committee: Jean-Yves Couloud (CARE); Ywe Franken (Cargill); Carla Veldhuyzen (Fairtrade International); Leonie Brühlmann (Lindt Cocoa Foundation); Samuel Adimado (Kuapa Kokoo); Bilal Bawany (Mars Wrigley Confectionery); Noura Hanna (UTZ/Rainforest Alliance); Antonie Fountain (VOICE Network); and Edwin Afari (World Cocoa Foundation).
Living Income Report for Cocoa Growing Regions of Ghana
© Living Income Community of Practice 9
We are also grateful to COCOBOD’s District Officers and field agents, who provided local contextual information and assisted the research team with community entry.
We would particularly like to acknowledge the excellent work of our fieldwork supervisor, Benson Hail, and research assistants, Daniel Elliot Kwantwi and Ebenezer Amoquandoh.
Finally, we would like to thank all the people in the cocoa farming communities we visited, including farmers, food vendors, school officials and health care workers, for the time they so generously gave. We hope this report serves them well.
Living Income Report for Cocoa Growing Regions of Ghana
© Living Income Community of Practice 10
GLOSSARY
Anker methodology A robust and widely accepted methodology for developing Living Wage benchmarks and assessing the gap with actual wages. The Anker methodology can also be used for developing Living Income benchmarks, as both Living Wage and Living Income benchmarks are based on the cost of a basic but decent standard of living for a family.
Basic but decent standard of living A basic but decent standard of living means being able to afford a low-cost and nutritious diet, basic healthy housing, and other essential expenses, including adequate healthcare and education of children through secondary school, and not being at risk of poverty or unaffordable debt due to occasional or unplanned events (marriages, funerals, illnesses, etc.).
Living income The net annual income required for a family in a particular place to afford a decent standard of living for all members of that family. Elements of a decent standard of living include: food, water, housing, education, healthcare, transport, clothing, and other essential needs including provision for unexpected events.
Net annual family income The total amount of income earned by family members over the course of a year – including cash and non-cash income (e.g. food produced by family members for their own consumption) – minus the costs associated with earning that income. It includes income from all sources, including remittances and social protection transfers.
Rural A location with less than 5,000 people is considered rural, as defined by the Ghana Statistical Service.
Typical family A Living Income benchmark is for a typically-sized family in a particular geographical area. The size and composition of the typical family is based on average household size, fertility rate and child mortality rate in the area.
Living Income Report for Cocoa Growing Regions of Ghana
© Living Income Community of Practice 11
KEY ABBREVIATIONS CPI Consumer Price Index
DHS Demographic and Health Survey
FAO Food and Agriculture Organization of the United Nations
GHS Ghana cedis
GLSS Ghana Living Standards Survey
GSS Ghana Statistical Service
HH Household
ha Hectare
JHS Junior High School
kg Kilogram
KIT Royal Tropical Institute [of The Netherlands]
MoFA Ministry of Food and Agriculture
NFNH Non-food non-housing [expenditure]
NHIS National Health Insurance Scheme
PAL Physical activity level
PHC Population and Housing Census
PPP Purchasing Power Parity
SHS Secondary High School
TFR Total fertility rate
U5MR Under five mortality rate
USD United States dollars
WHO World Health Organization
Living Income Report
Rural Ghana Cocoa growing areas of Ashanti, Central, Eastern, and
Western Regions
SECTION I: INTRODUCTION
1. BACKGROUND
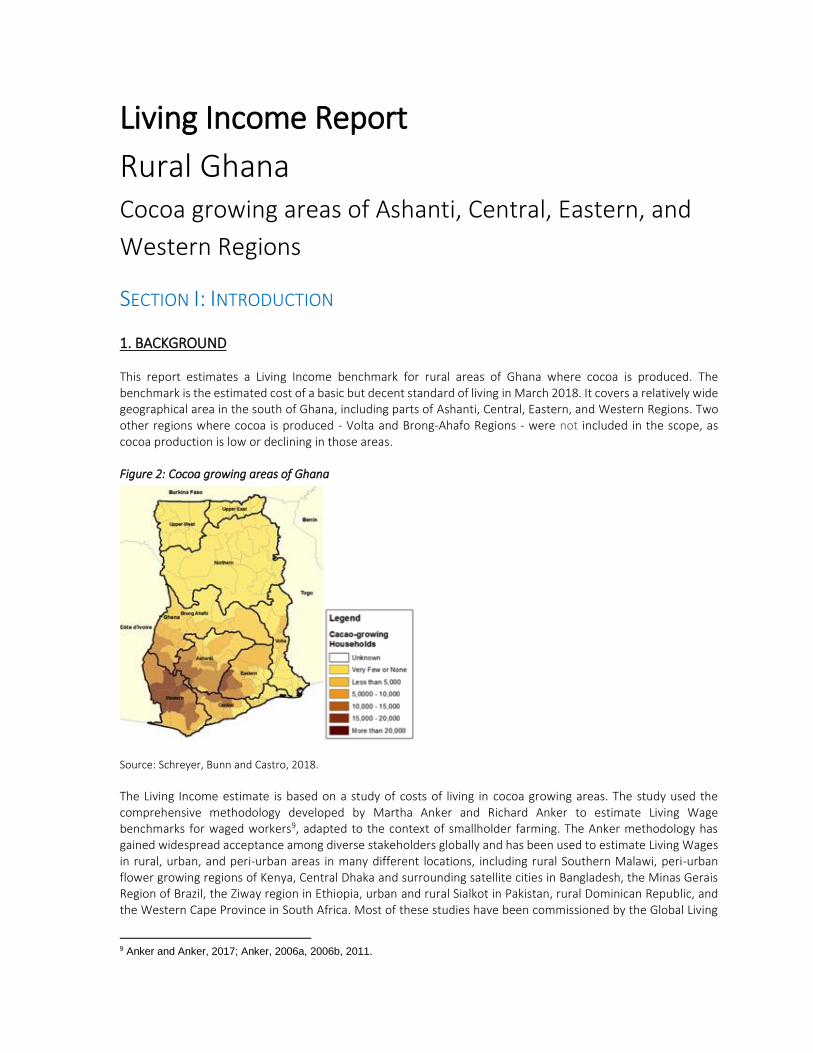
This report estimates a Living Income benchmark for rural areas of Ghana where cocoa is produced. The benchmark is the estimated cost of a basic but decent standard of living in March 2018. It covers a relatively wide geographical area in the south of Ghana, including parts of Ashanti, Central, Eastern, and Western Regions. Two other regions where cocoa is produced - Volta and Brong-Ahafo Regions - were not included in the scope, as cocoa production is low or declining in those areas.
Figure 2: Cocoa growing areas of Ghana
Source: Schreyer, Bunn and Castro, 2018.
The Living Income estimate is based on a study of costs of living in cocoa growing areas. The study used the comprehensive methodology developed by Martha Anker and Richard Anker to estimate Living Wage benchmarks for waged workers9, adapted to the context of smallholder farming. The Anker methodology has gained widespread acceptance among diverse stakeholders globally and has been used to estimate Living Wages in rural, urban, and peri-urban areas in many different locations, including rural Southern Malawi, peri-urban flower growing regions of Kenya, Central Dhaka and surrounding satellite cities in Bangladesh, the Minas Gerais Region of Brazil, the Ziway region in Ethiopia, urban and rural Sialkot in Pakistan, rural Dominican Republic, and the Western Cape Province in South Africa. Most of these studies have been commissioned by the Global Living
9 Anker and Anker, 2017; Anker, 2006a, 2006b, 2011.

Living Income Report for Rural Ghana with focus on Cocoa Growing Regions
© Living Income Community of Practice
13
Wage Coalition (GLWC) which is a partnership between various sustainability standards systems10, the ISEAL Alliance and Richard Anker and Martha Anker.
Building on experience on farmer livelihoods issues and the momentum of the global dialogue on Living Wages, ISEAL, GIZ and Sustainable Food Lab founded the Living Income Community of Practice. The Community brings together standards, businesses, government bodies, NGOs, finance and producer groups to support activities focused on improving smallholder incomes, and enabling farmers to achieve a decent standard of living. It fosters learning and collaboration to: provide methods and guidance on measuring and reporting on current and living incomes, and help understand the gap between these; identify and discuss strategies to help actors take actions that can contribute to closing income gaps.
This study in Ghana, and a sister study in Côte d'Ivoire, were commissioned by the Community of Practice to establish credible, robust Living Income benchmarks for critical cocoa growing regions in the two countries, through transparent research that is supported by key actors in the cocoa sector. The study was made possible through financial and logistical support from Cargill, Fairtrade International, Lindt Cocoa Foundation and UTZ11, with additional logistical support provided by the World Cocoa Foundation (WCF) in Accra. A Steering Committee comprised of industry, farmer organizations and civil society12 provided oversight and commented on draft findings, while a Technical Committee of methodology experts13 provided technical backstopping and recommendations on key methodological questions and decisions. The findings were shared with stakeholders in the Ghanaian cocoa sector in a series of meetings and workshops in February and July of 2018, and they were given the opportunity to comment on a draft of this report. Inputs received through this process have been taken into consideration in finalizing the report.
2. LIVING INCOME BENCHMARK
Our estimate of a Living Income in rural cocoa growing areas of Ghana (Ashanti, Central, Eastern, and Western Regions) is GHS 1,464 ($32914) per month for a family of five people.
This is the net monthly income required for a decent standard of living for a typical family of two adults and three children. The estimate is based on actual costs of living at a basic standard of decency, and indicates the amount of profit from all sources of household income (i.e. minus business expenses) that would be necessary to cover living expenses for the family. The breakdown of costs is summarized in Table 2.
Table 2: Breakdown of Living Income benchmark for a family of 2 adults and 3 children in rural cocoa growing
regions of Ghana (Ashanti, Central, Eastern and Western Regions)
Item GHS per month USD per month
Food costs per month 757 170
Housing costs per month 198 44
Non-food non-housing costs per month 439 99
Additional 5% for sustainability and emergencies 70 16
Total costs per month for basic but decent living standard for family of 2 adults and 3 children
1,464 329
10 Fairtrade International, Forest Stewardship Council (FSC), GoodWeave International, Rainforest Alliance (RA), Social Accountability International (SAI), Sustainable Agriculture Network (SAN), and UTZ. www.globallivingwage.org 11 Now merged with Rainforest Alliance. 12 Jean-Yves Couloud (CARE); Ywe Franken (Cargill); Carla Veldhuyzen (Fairtrade International); Leonie Brühlmann (Lindt Cocoa Foundation); Bilal Bawany (Mars Wrigley Confectionary); Antonie Fountain (VOICE Network); and Edwin Afari (World Cocoa Foundation). 13 Martha Anker, Richard Anker, Jessica Grillo (Rainforest Alliance), and Kristen Komives (ISEAL). 14 Exchange rate for 1 March 2018 (midway through primary data collection) was 1 USD to GHS 4.45.
Living Income Report for Rural Ghana with focus on Cocoa Growing Regions
© Living Income Community of Practice
14
Source: The Authors
It is important to emphasize that the Living Income benchmark is a conservative figure based on minimum standards for decency in the local context, taking into account international conventions and standards in the 21st century. The rest of this report provides a detailed description of how the Living Income benchmark was estimated, including sources of data and calculations used for arriving at the benchmark. The report is detailed because it is critical that stakeholders consider the benchmark to be credible and representative of costs in cocoa growing areas of Ghana, regardless of whether or not smallholder households are able to earn this income now or in the near future. Transparency is also important because one tenet of the Anker methodology is that stakeholders and others should be able to query assumptions and calculations that went into the Living Income benchmark, to help ensure that the benchmark is as reasonable as possible and receives as wide an acceptance as possible. Transparency will also help the ongoing process of stakeholder dialogue in relation to income improvements in the Ghanaian cocoa sector.
3. CONTEXT
3.1 Ghana as a lower middle-income country with poverty concentrated in rural areas
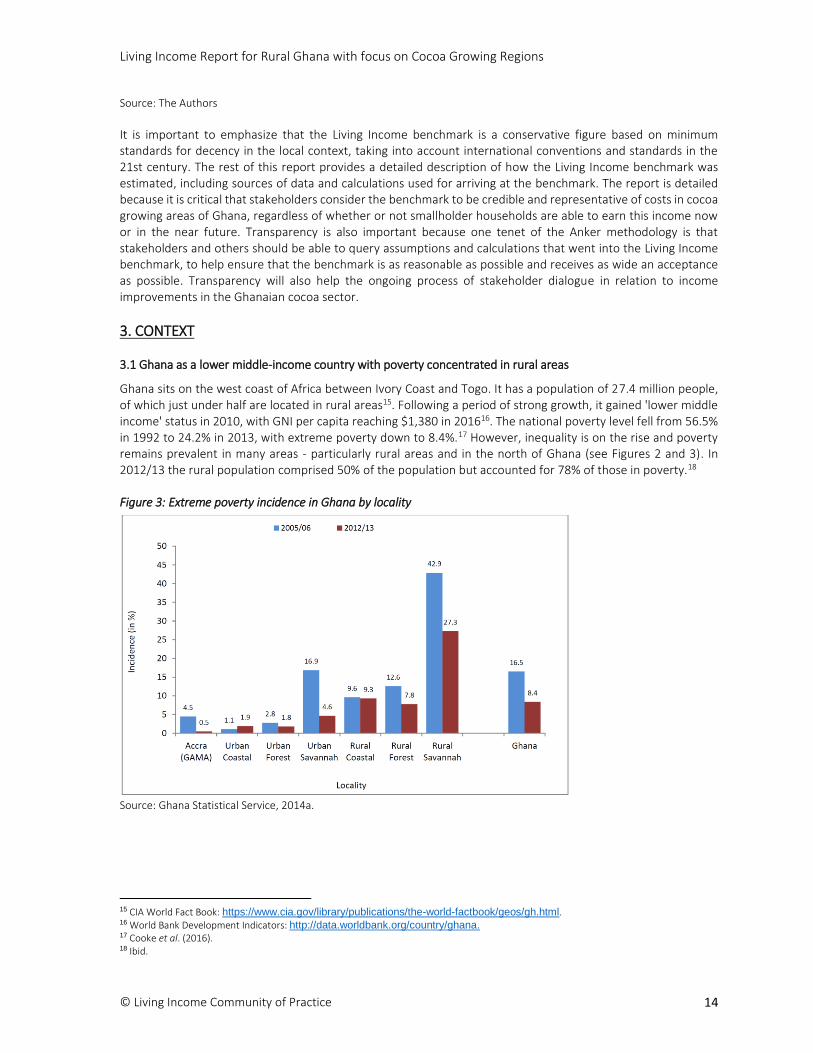
Ghana sits on the west coast of Africa between Ivory Coast and Togo. It has a population of 27.4 million people, of which just under half are located in rural areas15. Following a period of strong growth, it gained 'lower middle income' status in 2010, with GNI per capita reaching $1,380 in 201616. The national poverty level fell from 56.5% in 1992 to 24.2% in 2013, with extreme poverty down to 8.4%.17 However, inequality is on the rise and poverty remains prevalent in many areas - particularly rural areas and in the north of Ghana (see Figures 2 and 3). In 2012/13 the rural population comprised 50% of the population but accounted for 78% of those in poverty.18
Figure 3: Extreme poverty incidence in Ghana by locality
Source: Ghana Statistical Service, 2014a.
15 CIA World Fact Book: https://www.cia.gov/library/publications/the-world-factbook/geos/gh.html. 16 World Bank Development Indicators: http://data.worldbank.org/country/ghana. 17 Cooke et al. (2016). 18 Ibid.
Living Income Report for Rural Ghana with focus on Cocoa Growing Regions
© Living Income Community of Practice
15
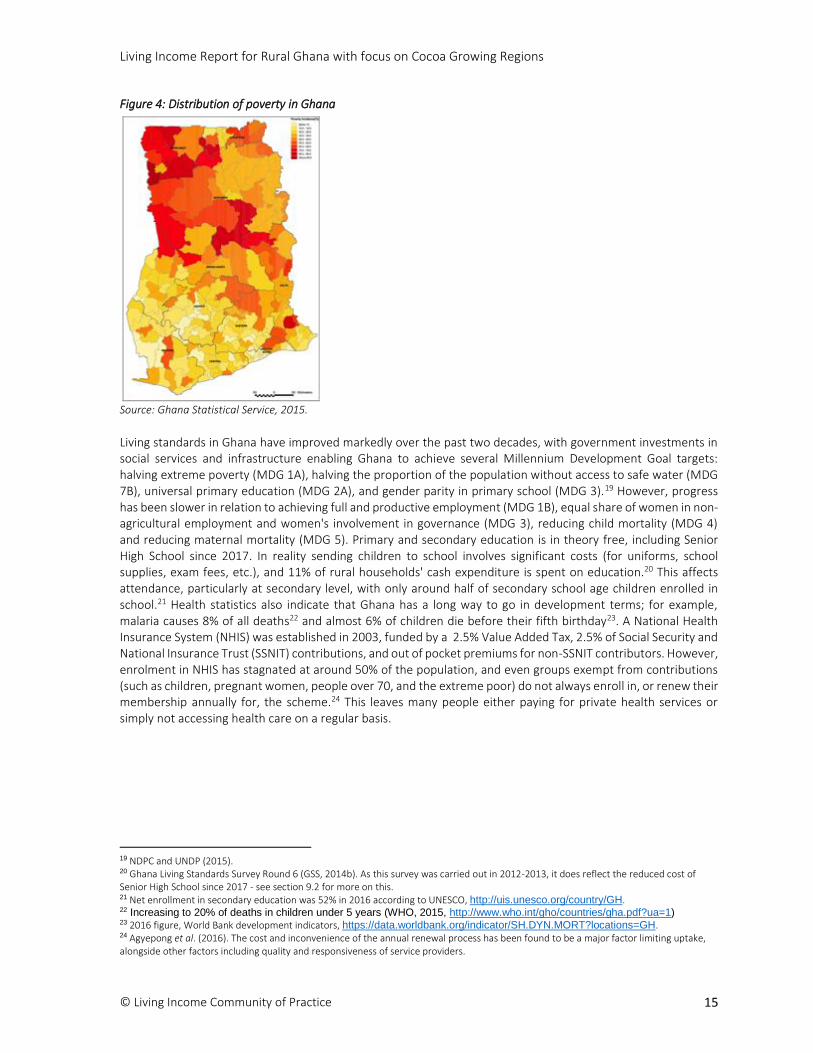
Figure 4: Distribution of poverty in Ghana
Source: Ghana Statistical Service, 2015.
Living standards in Ghana have improved markedly over the past two decades, with government investments in social services and infrastructure enabling Ghana to achieve several Millennium Development Goal targets: halving extreme poverty (MDG 1A), halving the proportion of the population without access to safe water (MDG 7B), universal primary education (MDG 2A), and gender parity in primary school (MDG 3).19 However, progress has been slower in relation to achieving full and productive employment (MDG 1B), equal share of women in non-agricultural employment and women's involvement in governance (MDG 3), reducing child mortality (MDG 4) and reducing maternal mortality (MDG 5). Primary and secondary education is in theory free, including Senior High School since 2017. In reality sending children to school involves significant costs (for uniforms, school supplies, exam fees, etc.), and 11% of rural households' cash expenditure is spent on education.20 This affects attendance, particularly at secondary level, with only around half of secondary school age children enrolled in school.21 Health statistics also indicate that Ghana has a long way to go in development terms; for example, malaria causes 8% of all deaths22 and almost 6% of children die before their fifth birthday23. A National Health Insurance System (NHIS) was established in 2003, funded by a 2.5% Value Added Tax, 2.5% of Social Security and National Insurance Trust (SSNIT) contributions, and out of pocket premiums for non-SSNIT contributors. However, enrolment in NHIS has stagnated at around 50% of the population, and even groups exempt from contributions (such as children, pregnant women, people over 70, and the extreme poor) do not always enroll in, or renew their membership annually for, the scheme.24 This leaves many people either paying for private health services or simply not accessing health care on a regular basis.
19 NDPC and UNDP (2015). 20 Ghana Living Standards Survey Round 6 (GSS, 2014b). As this survey was carried out in 2012-2013, it does reflect the reduced cost of Senior High School since 2017 - see section 9.2 for more on this. 21 Net enrollment in secondary education was 52% in 2016 according to UNESCO, http://uis.unesco.org/country/GH. 22 Increasing to 20% of deaths in children under 5 years (WHO, 2015, http://www.who.int/gho/countries/gha.pdf?ua=1) 23 2016 figure, World Bank development indicators, https://data.worldbank.org/indicator/SH.DYN.MORT?locations=GH. 24 Agyepong et al. (2016). The cost and inconvenience of the annual renewal process has been found to be a major factor limiting uptake, alongside other factors including quality and responsiveness of service providers.
Living Income Report for Rural Ghana with focus on Cocoa Growing Regions
© Living Income Community of Practice
16
3.2 Importance of the cocoa sector to Ghana's economy
Ghana is the world's second largest producer of cocoa beans, after Ivory Coast. The cocoa sector currently represents around 13% of exports25 and 2 percent of GDP26, and is an important source of employment and income in rural areas, involving nearly 800,000 households27.
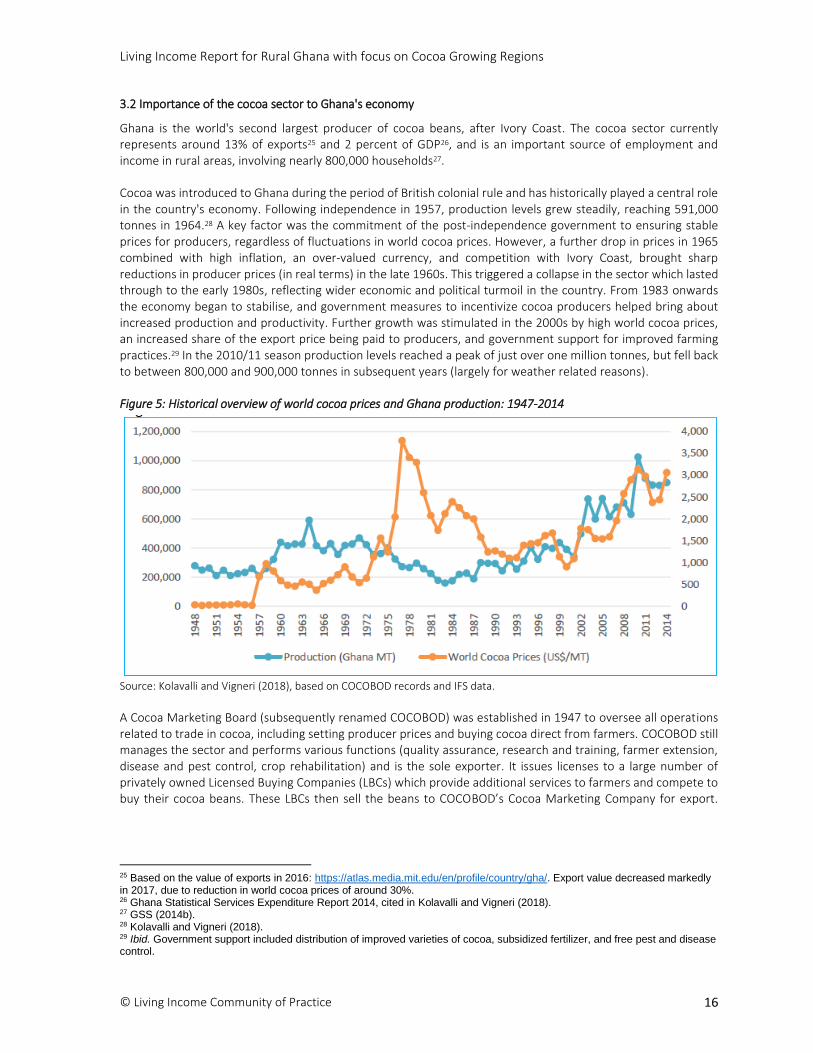
Cocoa was introduced to Ghana during the period of British colonial rule and has historically played a central role in the country's economy. Following independence in 1957, production levels grew steadily, reaching 591,000 tonnes in 1964.28 A key factor was the commitment of the post-independence government to ensuring stable prices for producers, regardless of fluctuations in world cocoa prices. However, a further drop in prices in 1965 combined with high inflation, an over-valued currency, and competition with Ivory Coast, brought sharp reductions in producer prices (in real terms) in the late 1960s. This triggered a collapse in the sector which lasted through to the early 1980s, reflecting wider economic and political turmoil in the country. From 1983 onwards the economy began to stabilise, and government measures to incentivize cocoa producers helped bring about increased production and productivity. Further growth was stimulated in the 2000s by high world cocoa prices, an increased share of the export price being paid to producers, and government support for improved farming practices.29 In the 2010/11 season production levels reached a peak of just over one million tonnes, but fell back to between 800,000 and 900,000 tonnes in subsequent years (largely for weather related reasons).
Figure 5: Historical overview of world cocoa prices and Ghana production: 1947-2014
Source: Kolavalli and Vigneri (2018), based on COCOBOD records and IFS data.
A Cocoa Marketing Board (subsequently renamed COCOBOD) was established in 1947 to oversee all operations related to trade in cocoa, including setting producer prices and buying cocoa direct from farmers. COCOBOD still manages the sector and performs various functions (quality assurance, research and training, farmer extension, disease and pest control, crop rehabilitation) and is the sole exporter. It issues licenses to a large number of privately owned Licensed Buying Companies (LBCs) which provide additional services to farmers and compete to buy their cocoa beans. These LBCs then sell the beans to COCOBOD’s Cocoa Marketing Company for export.
25 Based on the value of exports in 2016: https://atlas.media.mit.edu/en/profile/country/gha/. Export value decreased markedly in 2017, due to reduction in world cocoa prices of around 30%. 26 Ghana Statistical Services Expenditure Report 2014, cited in Kolavalli and Vigneri (2018). 27 GSS (2014b). 28 Kolavalli and Vigneri (2018). 29 Ibid. Government support included distribution of improved varieties of cocoa, subsidized fertilizer, and free pest and disease control.

Living Income Report for Rural Ghana with focus on Cocoa Growing Regions
© Living Income Community of Practice
17
Farmers are also supported through various donor and industry funded programmes, as well as certification schemes.
Since 1983 producer prices and the share of the export price allocated to other agents involved in production and marketing, including COCOBOD and government, have been set in accordance with recommendations of a Producer Price Review Committee (PPRC). PPRC is an independent body chaired by the Ministry of Finance and Economic Planning which bases its recommendations on projections of world cocoa prices, exchange rates, production levels, and prices in neighbouring countries.30 Over the past decade world cocoa prices have been relatively strong, but between September 2016 and February 2017 they fell from above $3,000 per tonne to below $1,900.31 The price drop has been put down to multiple factors, including oversupply, panic selling by speculators in stock markets, and poor decision-making by cocoa authorities in Ivory Coast.32 Although in many countries this has seen the prices paid to farmers slashed, farmers in Ghana have been protected by the government's policy of maintaining producer prices at the 2016/2017 level, even for the second season crop (the light crop) which was sold at a discounted price of $1,600 per tonne. This meant the share of the export price going to farmers for the main crop increased from 65% to 83%, while for the light crop COCOBOD incurred a loss of $210 per tonne.33 While good for farmers, it is unclear whether this strategy can be sustained into the future.
4. CONCEPT AND DEFINITION OF A LIVING INCOME34
The concept of a Living Income is based on the idea that families should not just earn enough to cover their basic subsistence and survival (i.e. poverty alleviation), they should be able to afford a decent standard of living, and to participate in social and cultural life. The following definition has been agreed by the Living Income Community of Practice:
“A Living Income is the net annual income required for a family in a particular place to afford a decent standard of living for all members of that family. Elements of a decent standard of living include: food, water, housing, education, healthcare, transport, clothing, and other essential needs including provision for unexpected events."
The net annual family income is the total amount of income earned by family members over the course of a year – including cash and non-cash income (e.g. food produced by family members for their own consumption) – minus the costs associated with earning that income. It includes income from all sources, including remittances and social protection transfers.
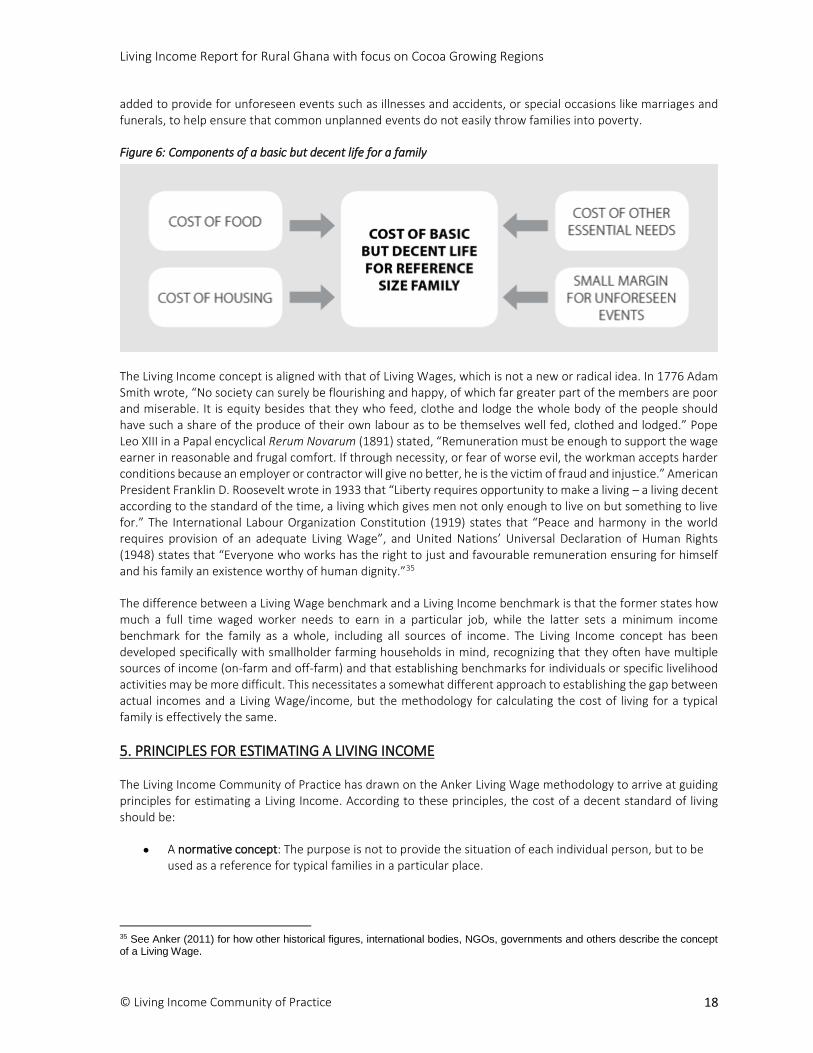
Figure 6 illustrates the four factors that contribute to a decent living as defined globally, allowing for certain adjustments based on local conditions. Living costs are estimated by summing up separate estimates of: (i) a low-cost nutritious diet; (ii) basic decent healthy housing; (iii) all other essential needs, including education of children through secondary school, decent health care, transportation, clothing, furniture, recreation, personal care, etc. The costs of food and housing are estimated individually based on normative standards and primary data, whereas the costs of all other essential needs are estimated as a lump sum using secondary data, as it would be difficult, time consuming and costly to agree normative standards and cost each area separately. However, cross-checks are done to ensure a sufficient amount is allowed for adequate access to healthcare and education of children through secondary school. A small margin above this total cost of a basic but decent lifestyle is then
30 Ibid. Smuggling of cocoa between neighbouring countries is common, based on which country offers the highest price in any given year. The intention is therefore to set producer prices which are not substantially different from those of other countries in the region. 31 Fountain and Huetz-Adams (2018). 32 Ibid. 33 COCOBOD press release 2 November 2017: https://cocobod.gh/news_details/id/132/PRESS%20RELEASE:%20RESPONSE%20TO%20THE%20MINORITY%20PRESS%20STATEMENT%20ON%20COCOA. 34 This section and others related to the concept and principles of Living Income are based on materials produced by the Living Income Community of Practice, particularly Grillo (2018), the Ankers' book on measuring Living Wages (2017), and Living Wage benchmark reports authored by the Ankers.
Living Income Report for Rural Ghana with focus on Cocoa Growing Regions
© Living Income Community of Practice
18
added to provide for unforeseen events such as illnesses and accidents, or special occasions like marriages and funerals, to help ensure that common unplanned events do not easily throw families into poverty.
Figure 6: Components of a basic but decent life for a family
The Living Income concept is aligned with that of Living Wages, which is not a new or radical idea. In 1776 Adam Smith wrote, “No society can surely be flourishing and happy, of which far greater part of the members are poor and miserable. It is equity besides that they who feed, clothe and lodge the whole body of the people should have such a share of the produce of their own labour as to be themselves well fed, clothed and lodged.” Pope Leo XIII in a Papal encyclical Rerum Novarum (1891) stated, “Remuneration must be enough to support the wage earner in reasonable and frugal comfort. If through necessity, or fear of worse evil, the workman accepts harder conditions because an employer or contractor will give no better, he is the victim of fraud and injustice.” American President Franklin D. Roosevelt wrote in 1933 that “Liberty requires opportunity to make a living – a living decent according to the standard of the time, a living which gives men not only enough to live on but something to live for.” The International Labour Organization Constitution (1919) states that “Peace and harmony in the world requires provision of an adequate Living Wage”, and United Nations’ Universal Declaration of Human Rights (1948) states that “Everyone who works has the right to just and favourable remuneration ensuring for himself and his family an existence worthy of human dignity.”35
The difference between a Living Wage benchmark and a Living Income benchmark is that the former states how much a full time waged worker needs to earn in a particular job, while the latter sets a minimum income benchmark for the family as a whole, including all sources of income. The Living Income concept has been developed specifically with smallholder farming households in mind, recognizing that they often have multiple sources of income (on-farm and off-farm) and that establishing benchmarks for individuals or specific livelihood activities may be more difficult. This necessitates a somewhat different approach to establishing the gap between actual incomes and a Living Wage/income, but the methodology for calculating the cost of living for a typical family is effectively the same.
5. PRINCIPLES FOR ESTIMATING A LIVING INCOME
The Living Income Community of Practice has drawn on the Anker Living Wage methodology to arrive at guiding principles for estimating a Living Income. According to these principles, the cost of a decent standard of living should be:
A normative concept: The purpose is not to provide the situation of each individual person, but to be used as a reference for typical families in a particular place.
35 See Anker (2011) for how other historical figures, international bodies, NGOs, governments and others describe the concept of a Living Wage.
Living Income Report for Rural Ghana with focus on Cocoa Growing Regions
© Living Income Community of Practice
19
Globally applicable: International minimum standards guide the estimation of cost of living components.
Locally adapted: In making choices about the acceptable application of the methodology, those affected by the benchmark should be at the centre. This means that considerations should be locally adapted to cultural norms and conditions while meeting international basic decency standards.
Income-source agnostic: The cost of a decent standard of living for a family of a certain size is the same for all families of that size in that particular place irrespective of what their livelihood activities look like.
Reflective of annual needs: The cost of a decent standard of living should reflect the family’s needs during an average year, not an annualized estimate of the family’s total costs over a lifetime (e.g. inclusive of old age, etc). The one exception to this would be to account for some degree of savings to absorb variations in costs that are common to all types of families and that normally occur only once every few years (e.g. marriages, funerals).
Based on market prices: Costs are estimated based on obtaining goods and services in the market, even if in practice families may obtain some goods from their own farms or businesses.
Recognizable: The decisions made to establish a cost of living benchmark should be transparent and understandable by those conducting research or using the benchmark.
Replicable and practical: The approach and judgments taken to estimate costs of living should be replicable and practical.
Alignment with the Anker Methodology on Living Wage: To the extent possible, the Living Income methodology is aligned with the Anker Methodology on Living Wage as outlined in Living Wages Around the World: Manual for Measurement (2017).
As indicated above, the Living Income benchmark is for a typical size family in a particular place. The size and composition of a 'typical' family is based on national statistics for the location(s) covered by the Living Income benchmark. The rationale for using the family as the reference unit rather than the 'household' is that households often exclude family members who have migrated for work or education, and/or include people who do not pool their income (both relatives and non-relatives). In contrast, the Living Income concept is based on the idea of a single economic unit with shared income, and the principle that family members should be able to live together without the need to migrate. However, household is often used as the unit of measure in income surveys, which complicates matters when it comes to calculating the gap between actual incomes and a Living Income benchmark. As such, it is sometimes necessary to make adjustments either to the Living Income benchmark, or to the income data, for the specific purpose of calculating the gap. The latter is only possible if income data can be disaggregated by household member and information on pooling of resources is available. Making adjustments on the Living Income benchmark side is somewhat more straightforward, as it involves creating a second benchmark for the 'typical' household size and composition according to the income survey. This is what has been done in this report in order to assess the Living Income gap in the Ghana cocoa sector using data from a recent survey by the Royal Tropical Institute among cocoa growing households (see Chapters 13 and 15).
6. GEOGRAPHICAL SCOPE AND SOURCES OF DATA
6.1 Geographical scope of Ghana Living Income benchmark
Cocoa is grown in 6 of the 10 administrative regions in Ghana: Ashanti, Brong Ahafo, Central, Eastern, Volta and Western. Table 3 shows the volumes of cocoa purchased by COCOBOD from each region in the 2015/2016 season. More than half of all cocoa came from Western Region, with Ashanti being the next most important region, accounting for around a sixth of total volumes. The remaining cocoa was evenly split between Central, Eastern and Brong Ahafo, with Volta producing a negligible amount. Production in Brong Ahafo is expected to go down in

Living Income Report for Rural Ghana with focus on Cocoa Growing Regions
© Living Income Community of Practice
20
the coming years, due to changing agro-ecological conditions linked to climate change36, and stakeholders at the launch workshop did not consider it a priority to include relative to other regions (given limited resources for the study). On this basis, Volta and Brong Ahafo regions were not included in the scope of the Living Income benchmark.
Table 3: Distribution of COCOBOD cocoa purchases by administrative region (2015/16)
Region COCOBOD purchases (MT) % of total
Western 415,302 53.3%
Ashanti 133,462 17.4%
Central 75,870 9.8%
Eastern 75,787 9.7%
Brong Ahafo 74,943 9.6%
Volta 2,680 0.4%
Source: COCOBOD37
Living Income benchmarks are based on a combination of primary and secondary data relevant to the geographical area in scope. The Anker methodology requires that primary data are collected in locations that are typical of the larger geographical area so that the Living Income benchmark can be considered representative of the area as a whole. Analysis by Ghana's Statistical Service (GSS) suggests that there is some variation in costs across the administrative regions where cocoa is produced (see Figure 7), although the extent and direction of variation is unclear when it comes to cocoa growing areas specifically. As such, primary data was collected in all four cocoa regions, with one Cocoa District38 purposively selected from each region to: (i) focus on Cocoa Districts with high levels of cocoa production; (ii) include a variety of factors known to affect costs of living (see Table 4).
Figure 7: Regional cost of living indices
Source: Ghana Statistical Service, 2014a.
36 Schreyer, Bunn and Castro, 2018. 37 https://cocobod.gh/weakly_purchase.php 38 COCOBOD organizes its services around 7 regions and 67 Cocoa Districts. These are similar to, but not exactly the same as, Ghana's national administrative regions and districts. Western Region is split by COCOBOD into Western North and Western South, with Western South including some parts of Central Region. Typically one Cocoa District will cover a geographical area which includes several administrative districts.

Living Income Report for Rural Ghana with focus on Cocoa Growing Regions
© Living Income Community of Practice
21
Table 4: Selection of Cocoa Districts for primary data collection
Region Selected Cocoa
District
COCOBOD
purchases
2015/2016 (MT)
Poverty
incidence39
Proximity to major city
Presence of
galamsey40
Ashanti Antoakrom 12,948 9.6% Yes Yes
Central Asikuma 10,201 24.0% No No
Eastern Nkawkaw 10,963 18.2% Somewhat Yes
Western Bonso Nkwanta 24,764 13.9% No No
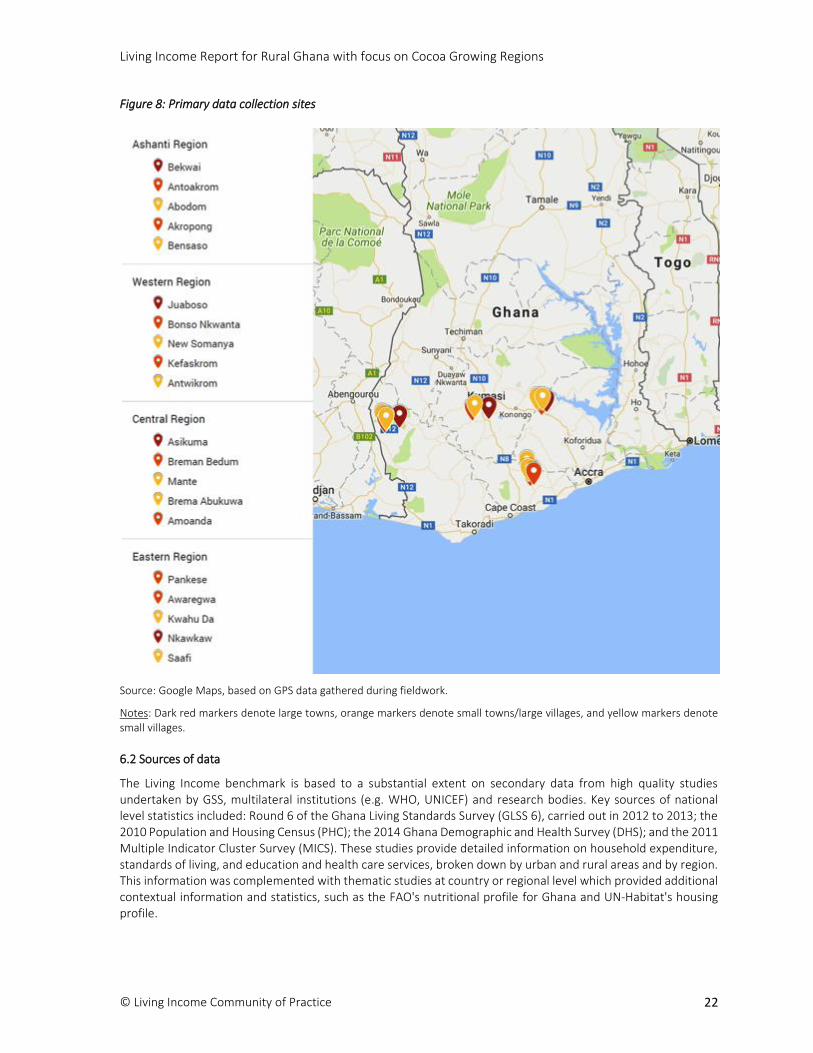
Cocoa Districts are divided into 'Communities' which include a varying number of towns, villages and hamlets in a geographically defined area. Typically a Community has one small town surrounded by a number of villages, which in turn are surrounded by hamlets and individual farms. There are cocoa farmers living in all of these different types of location. The research team worked with COCOBOD's district level staff to purposively select two small towns/large villages and two smaller villages per Cocoa District, spread across two to three Communities. In addition, some data was collected from larger towns in the vicinity of these small towns and villages, as farming households use markets, hospitals and/or secondary schools in these larger towns. The map below shows all locations where primary data was collected.
39 The main administrative district associated with each Cocoa District was used as the reference point for the poverty incidence. Poverty headcounts for each administrative districts were taken from Ghana Statistical Service's Poverty Mapping Report (2015). 40 Galamsey is the local term for small scale and artisanal mining, which has increasingly been taken up in cocoa growing regions of Ghana, and which is thought to push up costs of living as well as the cost of hired labour.
Living Income Report for Rural Ghana with focus on Cocoa Growing Regions
© Living Income Community of Practice
22
Figure 8: Primary data collection sites
Source: Google Maps, based on GPS data gathered during fieldwork.
Notes: Dark red markers denote large towns, orange markers denote small towns/large villages, and yellow markers denote small villages.
6.2 Sources of data
The Living Income benchmark is based to a substantial extent on secondary data from high quality studies undertaken by GSS, multilateral institutions (e.g. WHO, UNICEF) and research bodies. Key sources of national level statistics included: Round 6 of the Ghana Living Standards Survey (GLSS 6), carried out in 2012 to 2013; the 2010 Population and Housing Census (PHC); the 2014 Ghana Demographic and Health Survey (DHS); and the 2011 Multiple Indicator Cluster Survey (MICS). These studies provide detailed information on household expenditure, standards of living, and education and health care services, broken down by urban and rural areas and by region. This information was complemented with thematic studies at country or regional level which provided additional contextual information and statistics, such as the FAO's nutritional profile for Ghana and UN-Habitat's housing profile.
Living Income Report for Rural Ghana with focus on Cocoa Growing Regions
© Living Income Community of Practice
23
Primary data collection was undertaken for the purposes of gathering up-to-date information related to costs for a nutritious diet and decent housing in the specific context of cocoa growing areas. Information was also gathered to cross check secondary data on education and health care expenditure. This involved gathering food price data from multiple markets, stores and street traders; visiting a range of residential areas to find out about housing costs; and talking to staff in schools and health care professionals in hospitals, clinics, pharmacies and chemical stores. This data collection was guided by focus group discussions with cocoa farmers in each Cocoa District about where they live and shop, what kinds of food they prefer, and their use of health and education services. The fieldwork took place from 14 February to 17 March 2018, involving the lead researcher plus a fieldwork supervisor and two research assistants from the Department of Agricultural Economics and Agribusiness at the University of Ghana.

Living Income Report for Rural Ghana with focus on Cocoa Growing Regions
© Living Income Community of Practice
24
SECTION II: COST OF A BASIC BUT DECENT LIFE IN COCOA GROWING
REGIONS OF GHANA
7. FOOD COSTS
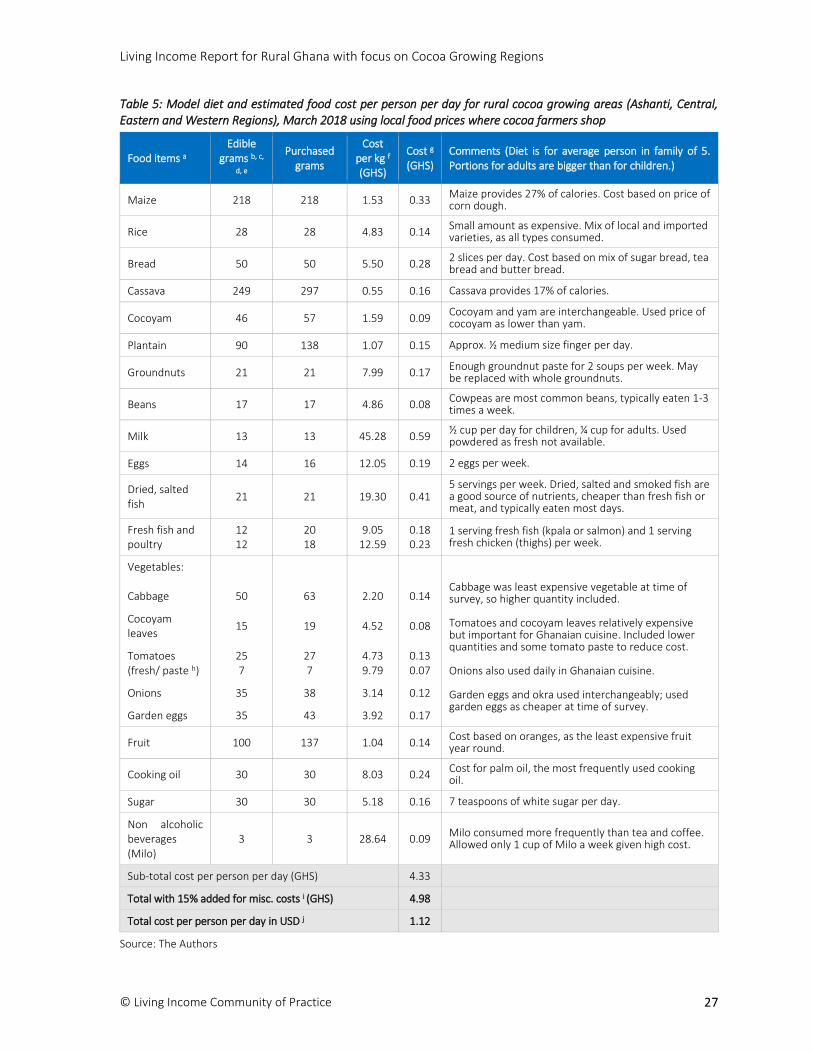
The cost of food was estimated using local food prices and a low cost nutritious model diet for Ghana for a reference family size of 5 persons (2 adults and 3 children)41. The estimated cost of the model diet is GHS 4.98 ($1.12) per family member per day (average cost taking into account higher costs for adults than for children). This implies GHS 757 ($170) per month for a low cost nutritious diet for our reference size family. Full details on how this estimate was arrived at are provided below.
7.1 General principles of model diet
The following general principles were used to establish the model diet that we used to estimate food costs for cocoa growing regions. Our model diet needed to be:
1) Nutritious (i.e. meets WHO recommendations as regards having sufficient calories as well as acceptable quantities of proteins, fats, carbohydrates, and fruits and vegetables) to help ensure that families have enough to eat and can be healthy.
2) Relatively low in cost for a nutritious diet. This approach means that relatively inexpensive foods are included in the model diet in order to reflect how cost conscious families shop for food while maintaining nutritional standards.
3) Consistent with Ghana's development level. For this reason, our model diet includes a relatively low (but nutritionally acceptable) percentage of calories from proteins since proteins are expensive per calorie. At the same time, percent of calories from proteins meets WHO/FAO minimum requirements.
4) Consistent with local food preferences, local food availability and local food costs. For this reason our model diet includes considerable amounts of cassava, maize, plantain, and dried fish, which are low cost foods which are eaten regularly in cocoa growing areas, as well as smaller amounts of more expensive but nevertheless popular foods, such as rice, bread and tomatoes.
7.2 Model diet
The model diet we used to estimate a Living Income for cocoa growing regions is shown in Table 5. It was developed through an iterative process, starting with Ghana's Ministry of Health Dietary and Physical Activity Guidelines (2009). Adjustments were made to bring the diet more in line with actual consumption42 using GLSS 6 data on food expenditure, FAO's Food Balance Sheet43 and Nutrition Country Profile44, research reports with information on food consumption and nutrition in southern areas of Ghana45, research on food crops grown by rural households in cocoa growing regions46, and information from focus group discussions with cocoa farmers. Further adjustments were made to ensure that the diet provides recommended amounts of macronutrients (protein, fat, carbohydrate) and micro nutrients and minerals. The final set of adjustments were based on taking into consideration food costs in cocoa growing regions, to arrive at a nutritious but affordable diet for smallholder farming families.
41 In Section III of this report, an explanation is given for how the reference family size was calculated. 42 Dietary guidelines typically do not give much consideration to food costs, and can therefore be more expensive than is warranted for estimating a Living Wage. Using data on actual consumption of different kinds of foods helps to adjust for this as well as takes into consideration food preferences. 43 See: http://ghana.opendataforafrica.org/bbyzsob/ghana-fao-stat-food-nutrition-and-food-security. 44 FAO (2009). 45 Frimpong (2013), Osei-Asare (2013), Nti (2008). 46 Bymolt, Laven and Tyszler, 2018.
Living Income Report for Rural Ghana with focus on Cocoa Growing Regions
© Living Income Community of Practice
25
Our model diet has 2294 calories. This was based on Schofield equations47 that are widely used to estimate calorie needs based on age, sex, height48 and activity level49, and the size and composition of our reference family. We assume that one adult in the family has a heavy physical activity level and one has a moderate physical activity level, taking into account the types of paid and unpaid work and other activities that adults in cocoa growing areas engage in on a daily basis (e.g. farming, marketing, petty trade, household chores, collecting water, preparing food, etc.).50 Percentages of calories from protein (11.7%), fats (24.3%) and carbohydrates (63.9%) meet minimum WHO/FAO standards for a nutritious diet. The 326 grams of fruit, vegetables and legumes included in the diet helps to provide a variety of micronutrients and minerals, while also taking into account the relatively high cost of such foods and that achieving the WHO/FAO daily recommended level of 400 grams per day is unrealistic for a lower middle income country like Ghana.51
Our model diet includes:
High quantities of cassava and maize as they are inexpensive sources of calories and central to the Ghanaian diet in cocoa growing regions, for example as fufu, banku, kenkey, gari and koko.
Small quantity of rice, enough for around two large servings per week, as it is popular but relatively expensive.
Around two slices of bread per day, even though it is relatively expensive, as this reflects typical consumption among cocoa farming households.
Moderate amount of plantain and cocoyam (or yam), as they are inexpensive, commonly grown alongside cocoa, and used widely in fufu and as side dishes.
Enough meat and fish for at least one serving per day, but mainly in the form of dried, salted or smoked fish as this is the cheapest source of animal protein.
A small amount of milk (½ cup per day for children and ¼ cup per day for adults).
2 eggs per week, in line with dietary guidelines.
Small amounts of groundnuts and cowpeas as they are good sources of protein but typically not eaten daily.
The least costly vegetables available locally, with the exception of tomatoes which are included due to their use in most Ghanaian soups and stews, and cocoyam leaves, which are used to make the popular kontomire stew and are a good source of micronutrients.
The least costly fruit available year round, namely oranges. Other fruits such as mangoes and papaya are eaten when in season, but were scarce at the time of the fieldwork so it was not possible to establish a representative price for them.
47 See: https://en.wikipedia.org/wiki/Schofield_equation. 48 Average height for adult women in Ghana was taken from Subramanian et al. (2011). A standard ratio of 1 to 1.08 for adult female
to adult male heights was used to arrive at the height for Ghanaian men. 49 This is in line with the daily calorie requirements for adults and children used by the Ghana Statistical Service, cited in Frimpong (2013), namely 2900 calories for adults, 2250 for children 6-17 years, and 1150 for children under 6 years. Assuming a reference family of 2 adults, 2 children aged 6-17 and 1 child aged under 6, this gives an average of 2290 calories per household member. 50 Usually both men and women in cocoa farming households in Ghana are involved in non-mechanized farming. This is usually assumed to be heavy physical activity, with high energy consumption. However, a recent study in northern Ghana using modern technology to measure activity levels suggests that men and women in smallholder farming households may in reality spend more time on moderate and light activities than on heavy activities (Zanello et al., 2017). As such, the calorie requirement calculations for the model diet were based on a conservative estimate of one adult with heavy and one adult with moderate physical activity levels. 51 See Anker and Anker (2017) for a full discussion of this topic. They recommend 300g of fruit, vegetables and legumes per day in low income countries, and an additional 25g per day for each increase in the level of development, with 400g only for high income countries. Ghana is a lower middle income country, which implies a recommendation of 325g of fruit, vegetables and legumes.
Living Income Report for Rural Ghana with focus on Cocoa Growing Regions
© Living Income Community of Practice
26
30 grams of oil for cooking, which is quite high but realistic for the Ghanaian cuisine. Palm oil was selected, as the most frequently used cooking oil in the study area.
A standard amount of sugar (6 teaspoons per day) for sweetening food and drinks.
One cup of Milo per week. This is the most popular hot drink among cocoa farmers, but it is expensive and therefore not affordable on a daily basis.
It should be noted that the amount of milk included falls well short of recommended guidelines for good nutrition, particularly for young children and pregnant women52, but is deemed realistic given fresh milk is not available locally and powdered milk is very expensive. The reduced quantity is also justified by the fact that dried fish are frequently consumed whole including bones (as very small fish), which provides an alternative source of calcium. Even so, milk represents close to 12% of the cost of the model diet.
To allow families some variation in what they eat, including occasional consumption of high cost foods, 10% was added to the cost of the model diet. An additional 2% was added to cover spices and condiments, such as garlic, ginger, chilli, salt and stock cubes, all of which are used for making soups and stews. Finally, 3% was added to account for spoilage and wastage, which is a conservative amount given that cocoa farming households rarely have a fridge.
52 Ghana's Ministry of Health Dietary and Physical Activity Guidelines (2009) recommend two to four servings of milk per day for adults and children. This is in line with nutritional guidelines worldwide (see Anker, 2017).
Living Income Report for Rural Ghana with focus on Cocoa Growing Regions
© Living Income Community of Practice
27
Table 5: Model diet and estimated food cost per person per day for rural cocoa growing areas (Ashanti, Central, Eastern and Western Regions), March 2018 using local food prices where cocoa farmers shop
Food items a Edible
grams b, c,
d, e
Purchased grams
Cost per kg f (GHS)
Cost g (GHS)
Comments (Diet is for average person in family of 5. Portions for adults are bigger than for children.)
Maize 218 218 1.53 0.33 Maize provides 27% of calories. Cost based on price of corn dough.
Rice 28 28 4.83 0.14 Small amount as expensive. Mix of local and imported varieties, as all types consumed.
Bread 50 50 5.50 0.28 2 slices per day. Cost based on mix of sugar bread, tea bread and butter bread.
Cassava 249 297 0.55 0.16 Cassava provides 17% of calories.
Cocoyam 46 57 1.59 0.09 Cocoyam and yam are interchangeable. Used price of cocoyam as lower than yam.
Plantain 90 138 1.07 0.15 Approx. ½ medium size finger per day.
Groundnuts 21 21 7.99 0.17 Enough groundnut paste for 2 soups per week. May be replaced with whole groundnuts.
Beans 17 17 4.86 0.08 Cowpeas are most common beans, typically eaten 1-3 times a week.
Milk 13 13 45.28 0.59 ½ cup per day for children, ¼ cup for adults. Used powdered as fresh not available.
Eggs 14 16 12.05 0.19 2 eggs per week.
Dried, salted fish
21 21 19.30 0.41 5 servings per week. Dried, salted and smoked fish are a good source of nutrients, cheaper than fresh fish or meat, and typically eaten most days.
Fresh fish and poultry
12 12
20 18
9.05 12.59
0.18 0.23
1 serving fresh fish (kpala or salmon) and 1 serving fresh chicken (thighs) per week.
Vegetables: Cabbage
50
63
2.20
0.14
Cabbage was least expensive vegetable at time of survey, so higher quantity included. Tomatoes and cocoyam leaves relatively expensive but important for Ghanaian cuisine. Included lower quantities and some tomato paste to reduce cost. Onions also used daily in Ghanaian cuisine. Garden eggs and okra used interchangeably; used garden eggs as cheaper at time of survey.
Cocoyam leaves
15 19 4.52 0.08
Tomatoes (fresh/ paste h)
25 7
27 7
4.73 9.79
0.13 0.07
Onions 35 38 3.14 0.12
Garden eggs 35 43 3.92 0.17
Fruit 100 137 1.04 0.14 Cost based on oranges, as the least expensive fruit year round.
Cooking oil 30 30 8.03 0.24 Cost for palm oil, the most frequently used cooking oil.
Sugar 30 30 5.18 0.16 7 teaspoons of white sugar per day.
Non alcoholic beverages (Milo)
3 3 28.64 0.09 Milo consumed more frequently than tea and coffee. Allowed only 1 cup of Milo a week given high cost.
Sub-total cost per person per day (GHS) 4.33
Total with 15% added for misc. costs i (GHS) 4.98
Total cost per person per day in USD j 1.12
Source: The Authors
Living Income Report for Rural Ghana with focus on Cocoa Growing Regions
© Living Income Community of Practice
28
Notes:
a Specific food item(s) used to represent each food group are the lowest cost food item(s) per edible gram found in the market survey, taking into account the local cuisine and cocoa farmer preferences to ensure acceptability of the model diet. b Edible (consumed) quantity differs from purchased quantity for foods with inedible parts, such as fruits and vegetables with inedible stem or skin, egg with shell, or fish with head, tail and scales. The percentage edible for each purchased food is taken from the FAO's West African Food Composition Table (2012). c Number of calories, proteins, carbohydrates and fats per 100 grams for each food item are estimated using the values reported in the FAO source noted above, supplemented by the United States Department of Agriculture (USDA) online nutritional values database (www.ndb.nal.usda.gov/ndb/foods). For corn dough the nutritional values were based on a ratio of 80% corn flour to 20% water. d In addition to having a sufficient number of calories (2294), our model diet meets WHO recommendations for proteins (10-15% of all calories), fats (15-30% of all calories) and carbohydrates (less than 75% of all calories). Approximately 12% of calories in the model diet are from proteins, 24% are from fats and oils, and 64% are from carbohydrates. e Calories required by adult males, adult females and children were calculated using Schofield equations recommended by WHO/FAO, taking into account adult height, levels of physical activity for adults and children. The average number of calories required per person for our reference family of 5 was calculated, giving an average of 2294 per person. f Cost per kilo is based on prices observed in venues where cocoa farmers shop (markets, container stores, table top stores, etc). g Cost for each food item was calculated by multiplying purchased quantity (not edible grams) by cost per kilo. h 7 grams of tomato paste is equivalent to 28 edible grams of fresh tomatoes. i 2% was added to food cost for salt, chilli, garlic, ginger, other spices and stock cubes which are widely used in the local cuisine. This is in line with the percentage of household expenditure which is allocated to 'spices' in the Ghana Living Standards Survey Round 4 (the last survey which gave a separate figure for spices); 3% added as a conservative estimate of wastage and spoilage; 10% added to allow for variety in the diet and occasional consumption of higher value food items. j Exchange rate used to convert Ghana Cedis to USD was 4.45, the official exchange rate for 1 March 2018 (midway through primary data collection) according to https://www.oanda.com/fx-for-business/historical-rates.
7.3 Food prices
To estimate the cost of our model diet, we collected food prices from places where cocoa farmers typically shop for each food item, so that the cost is based on what they actually pay. Although cocoa farming households produce much of their own food, the Living Income benchmark is for a particular geographical area, not a specific livelihood activity, and therefore the cost of food is based on market prices. Cocoa farmers anyway told us that they need to purchase even common food crops like cassava, maize, plantain and cocoyam at certain times of the year. They said they buy all food items locally in the villages and small towns close to where they live, only buying in large markets in nearby towns or cities when they are going there anyway to sell their produce or, in the case of traders, to buy goods to sell. As such, we focused the data collection on villages and small towns, but also collected prices in one large town per Cocoa District to see how they compared with local prices.
In total we collected over 2,000 prices from 380 different vendors. This included vendors in open air markets (all food items), container stores and table top stores (food crops, dry goods, bread, processed fish, eggs), cold stores selling fresh fish and meat, and home-based and itinerant sellers (food crops, eggs, processed fish, bread). We found that average prices in large towns were lower53 for a few items (processed fish, fresh chicken, oranges) but higher for others, notably common food crops (cassava, plantain, cocoyam, garden eggs). We decided to exclude the prices from large towns as: (i) there are relatively few food items which are cheaper in large towns, and they are not items which can be bought in bulk for storage; (ii) this more closely reflects the way cocoa farming households shop for food.
As can be seen in the photos below, vendors in Ghana often sell foods pre-packaged into small plastic bags or containers. Even when selling food loose, they do not sell by weight - rather they sell by quantity, such as five tomatoes for GHS 2, or three onions for GHS 1. This meant that we had to weigh typical quantities of food which families purchase (including small, medium and large quantities) and then calculate the average cost per kilo. We used an electronic scale for doing this. We also had to collect prices from several vendors in each market, as there is variation in the quantity sold at each price. For example, one vendor may sell four large garden eggs for GHS 1, while another may sell six small garden eggs for the same price. For some food items we also collected prices for
53 At least 10% difference.

Living Income Report for Rural Ghana with focus on Cocoa Growing Regions
© Living Income Community of Practice
29
different qualities or varieties, such as different varieties of rice and different brands of tomato paste. This enabled us to base costs on the least expensive acceptable variety/brand of each food item.
Figure 9: Examples of the types of food vendors where prices were collected
Open market in large town Container store in small town
Small open market in village Itinerant trader in village
Food prices were rigorously analysed to arrive at a representative price per edible gram for each food item in the model diet. This involved calculating average prices across vendors, based on the lowest cost per kilo for each vendor. Interestingly, it was often not cheaper to buy larger quantities of food, such as bigger jars of groundnut paste, larger bottles of palm oil, or higher quantities of dried fish. Even buying a 5kg sack of imported perfumed rice was not consistently cheaper than buying the same type of rice by the cup. Sometimes the smallest quantity of a product, such as a 'tie' of powdered milk or sugar, was actually the cheapest per gram. This is likely to be a result of both vendors and buyers not being conscious of the weight of goods and the relationship between weight and price. As such, we focused on identifying the cheapest price per kilo across all quantities sold by each vendor, rather than excluding very small or very large quantities.
7.4 Adjustment of food prices for seasonality
The price of food, particularly fresh food, is often greatly affected by seasonality of agricultural production. A World Bank analysis of wholesale food prices for a subset of the food items in our model diet indicated particularly high seasonality in prices in Ghana for maize, plantain, tomatoes and oranges, and some seasonality for rice, cassava and cowpeas.54 As such, it was necessary to check the extent to which prices we collected in February/March are representative of average prices across the year. For this we used food price data collected in large markets by the Ministry of Food and Agriculture (MoFA) each month, isolating data for the four regions of the study and comparing March prices with mean prices for 2015 to 2017. The average deviation from the
54 Gilbert et al. (2016).

Living Income Report for Rural Ghana with focus on Cocoa Growing Regions
© Living Income Community of Practice
30
trend for 22 food items in the model diet is presented in Table 6, highlighting commodities with March prices greater than 2 percentage points above the seasonal trend.
Table 6: Percentage deviation of 3-year seasonal prices (March prices) from trend mean for 2015-2017, by region (>2% deviation in bold)
Food item Ashanti Central Eastern Western
Rice - Local -2.077 -2.077 na -0.652
Rice - Imported 0.163 0.256 -1.190 -3.354
Maize dough 0.565 -1.205 0.000 0.186
Bread - sugar -0.173 -0.028 -0.173 0.088
Frozen chicken -0.954 -2.870 -0.239 -0.414
Fresh fish - Kpala -0.393 -0.572 -0.693 -0.276
Dried fish - Koobi 0.065 -0.140 0.168 -2.059
Powdered milk 0.000 -5.263 -1.796 -1.923
Palm oil (red oil) 0.000 0.000 0.000 2.564
Plantain (green) -0.072 -0.236 -0.404 0.315
Oranges 0.457 1.149 -0.864 -1.170
Groundnuts (shelled) -0.650 -0.331 0.138 0.266
Cocoyam leaves -0.895 0.897 0.707 0.683
Garden eggs 0.042 1.138 2.564 -0.619
Onions 0.536 -0.369 0.938 -0.369
Tomatoes (fresh) 1.405 1.493 0.963 -3.457
Tomato paste 6.667 0.717 0.323 -0.043
White beans (cowpea) 0.422 -0.235 -0.632 0.000
Cassava (fresh) -0.886 -1.079 -0.704 -1.075
Cocoyam 0.301 0.301 0.301 0.827
Granulated sugar 0.941 -1.646 -1.802 0.662
Cocoa with milk powder (Milo) -0.678 -2.655 -4.203 -1.303
Source: Authors' calculations using MoFA data on food retail prices
The analysis found that prices in the month of March are close to average annual prices for most commodities (i.e. mean deviance for 2015-2017 is under 2%). Although there are some commodities where the deviance is more than 2%, there is little consistency across regions, i.e. for some regions the March price is higher than average for the year while for others it is lower than the average. The only commodities which suggest a relatively persistent difference were the following:
Garden eggs are 0.1% to 2.6% higher in 3 regions, but 0.6% lower in the other region (Western).
Tomatoes are 1% to 1.5% higher in 3 regions, but 3.5% lower in the other region (Western).
Powdered milk is 0% to 5.2% lower for March than for the year in all regions.
Milo is 0.7% to 4.2% lower for March than for the year in all regions.
Although garden eggs and tomatoes show some seasonal variation for March, this is not consistent or very large, and does not justify making any adjustments to the representative food prices collected in the Living Income survey. Seasonal deviations for processed goods - powdered milk and Milo - are more consistent across regions, but still relatively small. To extend the analysis, the food and non-food Consumer Price Index (CPI) for March of
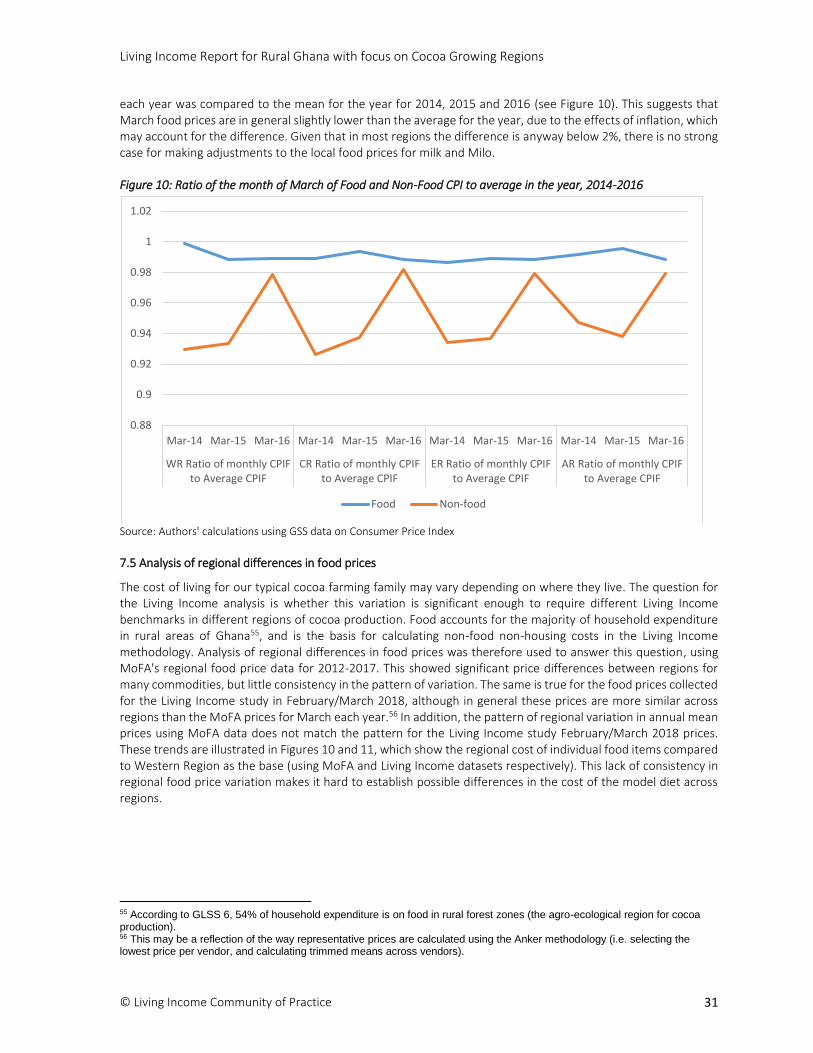
Living Income Report for Rural Ghana with focus on Cocoa Growing Regions
© Living Income Community of Practice
31
each year was compared to the mean for the year for 2014, 2015 and 2016 (see Figure 10). This suggests that March food prices are in general slightly lower than the average for the year, due to the effects of inflation, which may account for the difference. Given that in most regions the difference is anyway below 2%, there is no strong case for making adjustments to the local food prices for milk and Milo.
Figure 10: Ratio of the month of March of Food and Non-Food CPI to average in the year, 2014-2016
Source: Authors' calculations using GSS data on Consumer Price Index
7.5 Analysis of regional differences in food prices
The cost of living for our typical cocoa farming family may vary depending on where they live. The question for the Living Income analysis is whether this variation is significant enough to require different Living Income benchmarks in different regions of cocoa production. Food accounts for the majority of household expenditure in rural areas of Ghana55, and is the basis for calculating non-food non-housing costs in the Living Income methodology. Analysis of regional differences in food prices was therefore used to answer this question, using MoFA's regional food price data for 2012-2017. This showed significant price differences between regions for many commodities, but little consistency in the pattern of variation. The same is true for the food prices collected for the Living Income study in February/March 2018, although in general these prices are more similar across regions than the MoFA prices for March each year.56 In addition, the pattern of regional variation in annual mean prices using MoFA data does not match the pattern for the Living Income study February/March 2018 prices. These trends are illustrated in Figures 10 and 11, which show the regional cost of individual food items compared to Western Region as the base (using MoFA and Living Income datasets respectively). This lack of consistency in regional food price variation makes it hard to establish possible differences in the cost of the model diet across regions.
55 According to GLSS 6, 54% of household expenditure is on food in rural forest zones (the agro-ecological region for cocoa production). 56 This may be a reflection of the way representative prices are calculated using the Anker methodology (i.e. selecting the lowest price per vendor, and calculating trimmed means across vendors).
0.88
0.9
0.92
0.94
0.96
0.98
1
1.02
Mar-14 Mar-15 Mar-16 Mar-14 Mar-15 Mar-16 Mar-14 Mar-15 Mar-16 Mar-14 Mar-15 Mar-16
WR Ratio of monthly CPIFto Average CPIF
CR Ratio of monthly CPIFto Average CPIF
ER Ratio of monthly CPIFto Average CPIF
AR Ratio of monthly CPIFto Average CPIF
Food Non-food
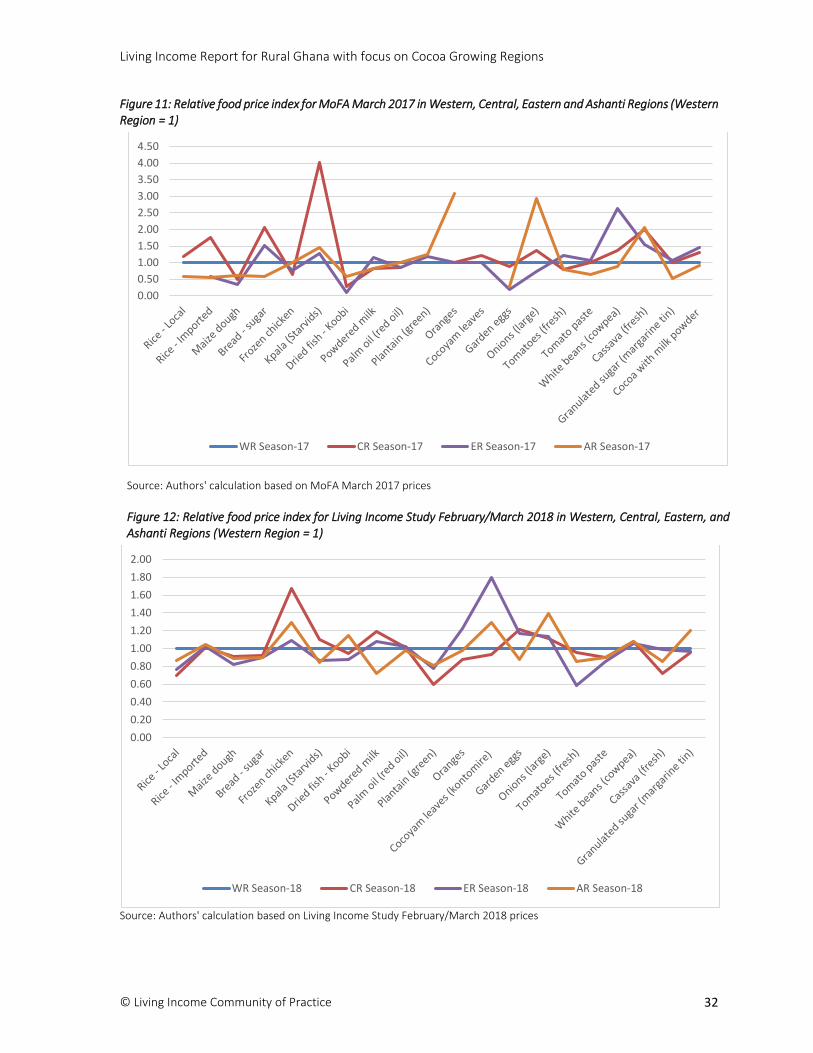
Living Income Report for Rural Ghana with focus on Cocoa Growing Regions
© Living Income Community of Practice
32
Figure 11: Relative food price index for MoFA March 2017 in Western, Central, Eastern and Ashanti Regions (Western Region = 1)
Source: Authors' calculation based on MoFA March 2017 prices
Figure 12: Relative food price index for Living Income Study February/March 2018 in Western, Central, Eastern, and Ashanti Regions (Western Region = 1)
Source: Authors' calculation based on Living Income Study February/March 2018 prices
0.00
0.50
1.00
1.50
2.00
2.50
3.00
3.50
4.00
4.50
WR Season-17 CR Season-17 ER Season-17 AR Season-17
0.00
0.20
0.40
0.60
0.80
1.00
1.20
1.40
1.60
1.80
2.00
WR Season-18 CR Season-18 ER Season-18 AR Season-18
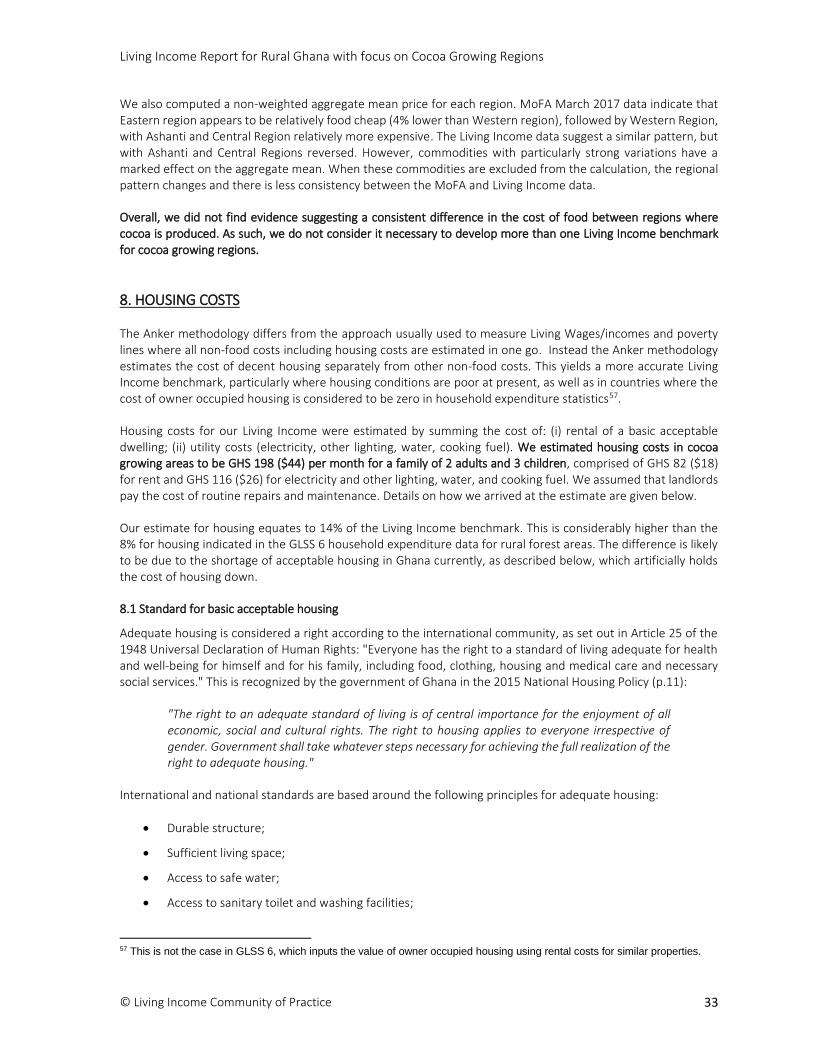
Living Income Report for Rural Ghana with focus on Cocoa Growing Regions
© Living Income Community of Practice
33
We also computed a non-weighted aggregate mean price for each region. MoFA March 2017 data indicate that Eastern region appears to be relatively food cheap (4% lower than Western region), followed by Western Region, with Ashanti and Central Region relatively more expensive. The Living Income data suggest a similar pattern, but with Ashanti and Central Regions reversed. However, commodities with particularly strong variations have a marked effect on the aggregate mean. When these commodities are excluded from the calculation, the regional pattern changes and there is less consistency between the MoFA and Living Income data.
Overall, we did not find evidence suggesting a consistent difference in the cost of food between regions where cocoa is produced. As such, we do not consider it necessary to develop more than one Living Income benchmark for cocoa growing regions.
8. HOUSING COSTS
The Anker methodology differs from the approach usually used to measure Living Wages/incomes and poverty lines where all non-food costs including housing costs are estimated in one go. Instead the Anker methodology estimates the cost of decent housing separately from other non-food costs. This yields a more accurate Living Income benchmark, particularly where housing conditions are poor at present, as well as in countries where the cost of owner occupied housing is considered to be zero in household expenditure statistics57.
Housing costs for our Living Income were estimated by summing the cost of: (i) rental of a basic acceptable dwelling; (ii) utility costs (electricity, other lighting, water, cooking fuel). We estimated housing costs in cocoa growing areas to be GHS 198 ($44) per month for a family of 2 adults and 3 children, comprised of GHS 82 ($18) for rent and GHS 116 ($26) for electricity and other lighting, water, and cooking fuel. We assumed that landlords pay the cost of routine repairs and maintenance. Details on how we arrived at the estimate are given below.
Our estimate for housing equates to 14% of the Living Income benchmark. This is considerably higher than the 8% for housing indicated in the GLSS 6 household expenditure data for rural forest areas. The difference is likely to be due to the shortage of acceptable housing in Ghana currently, as described below, which artificially holds the cost of housing down.
8.1 Standard for basic acceptable housing
Adequate housing is considered a right according to the international community, as set out in Article 25 of the 1948 Universal Declaration of Human Rights: "Everyone has the right to a standard of living adequate for health and well-being for himself and for his family, including food, clothing, housing and medical care and necessary social services." This is recognized by the government of Ghana in the 2015 National Housing Policy (p.11):
"The right to an adequate standard of living is of central importance for the enjoyment of all economic, social and cultural rights. The right to housing applies to everyone irrespective of gender. Government shall take whatever steps necessary for achieving the full realization of the right to adequate housing."
International and national standards are based around the following principles for adequate housing:
Durable structure;
Sufficient living space;
Access to safe water;
Access to sanitary toilet and washing facilities;
57 This is not the case in GLSS 6, which inputs the value of owner occupied housing using rental costs for similar properties.
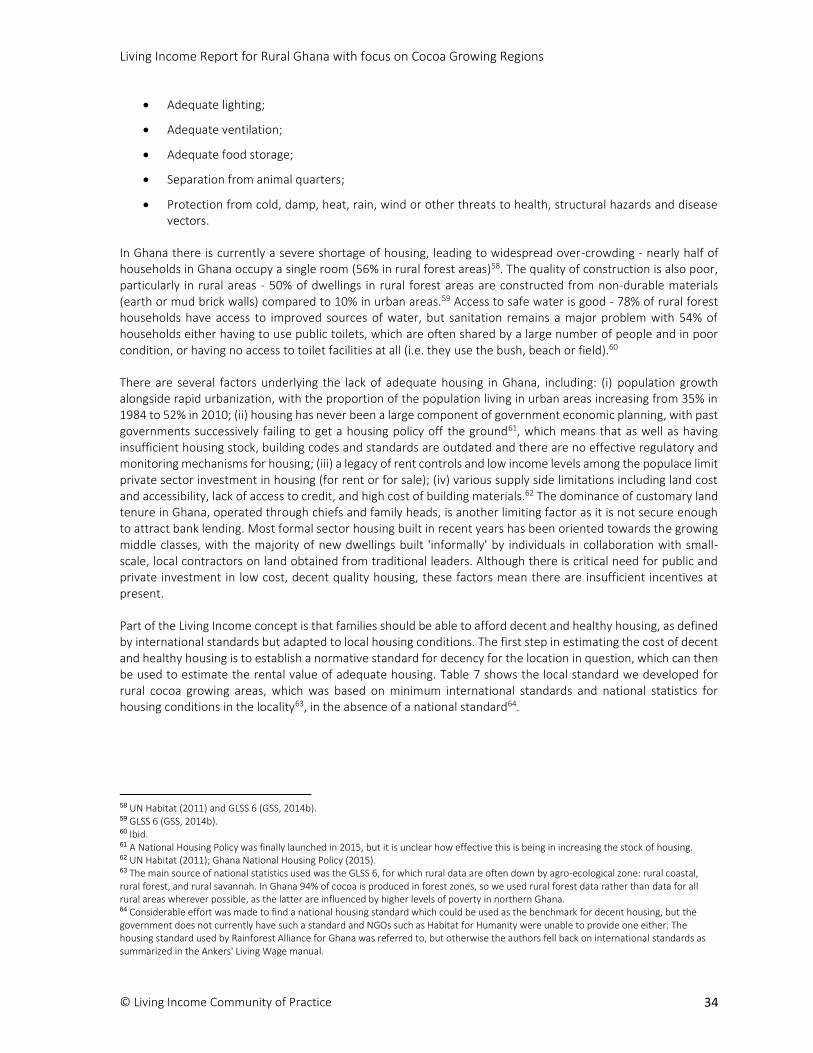
Living Income Report for Rural Ghana with focus on Cocoa Growing Regions
© Living Income Community of Practice
34
Adequate lighting;
Adequate ventilation;
Adequate food storage;
Separation from animal quarters;
Protection from cold, damp, heat, rain, wind or other threats to health, structural hazards and disease vectors.
In Ghana there is currently a severe shortage of housing, leading to widespread over-crowding - nearly half of households in Ghana occupy a single room (56% in rural forest areas)58. The quality of construction is also poor, particularly in rural areas - 50% of dwellings in rural forest areas are constructed from non-durable materials (earth or mud brick walls) compared to 10% in urban areas.59 Access to safe water is good - 78% of rural forest households have access to improved sources of water, but sanitation remains a major problem with 54% of households either having to use public toilets, which are often shared by a large number of people and in poor condition, or having no access to toilet facilities at all (i.e. they use the bush, beach or field).60
There are several factors underlying the lack of adequate housing in Ghana, including: (i) population growth alongside rapid urbanization, with the proportion of the population living in urban areas increasing from 35% in 1984 to 52% in 2010; (ii) housing has never been a large component of government economic planning, with past governments successively failing to get a housing policy off the ground61, which means that as well as having insufficient housing stock, building codes and standards are outdated and there are no effective regulatory and monitoring mechanisms for housing; (iii) a legacy of rent controls and low income levels among the populace limit private sector investment in housing (for rent or for sale); (iv) various supply side limitations including land cost and accessibility, lack of access to credit, and high cost of building materials.62 The dominance of customary land tenure in Ghana, operated through chiefs and family heads, is another limiting factor as it is not secure enough to attract bank lending. Most formal sector housing built in recent years has been oriented towards the growing middle classes, with the majority of new dwellings built 'informally' by individuals in collaboration with small-scale, local contractors on land obtained from traditional leaders. Although there is critical need for public and private investment in low cost, decent quality housing, these factors mean there are insufficient incentives at present.
Part of the Living Income concept is that families should be able to afford decent and healthy housing, as defined by international standards but adapted to local housing conditions. The first step in estimating the cost of decent and healthy housing is to establish a normative standard for decency for the location in question, which can then be used to estimate the rental value of adequate housing. Table 7 shows the local standard we developed for rural cocoa growing areas, which was based on minimum international standards and national statistics for housing conditions in the locality63, in the absence of a national standard64.
58 UN Habitat (2011) and GLSS 6 (GSS, 2014b). 59 GLSS 6 (GSS, 2014b). 60 Ibid. 61 A National Housing Policy was finally launched in 2015, but it is unclear how effective this is being in increasing the stock of housing. 62 UN Habitat (2011); Ghana National Housing Policy (2015). 63 The main source of national statistics used was the GLSS 6, for which rural data are often down by agro-ecological zone: rural coastal, rural forest, and rural savannah. In Ghana 94% of cocoa is produced in forest zones, so we used rural forest data rather than data for all rural areas wherever possible, as the latter are influenced by higher levels of poverty in northern Ghana. 64 Considerable effort was made to find a national housing standard which could be used as the benchmark for decent housing, but the government does not currently have such a standard and NGOs such as Habitat for Humanity were unable to provide one either. The housing standard used by Rainforest Alliance for Ghana was referred to, but otherwise the authors fell back on international standards as summarized in the Ankers' Living Wage manual.
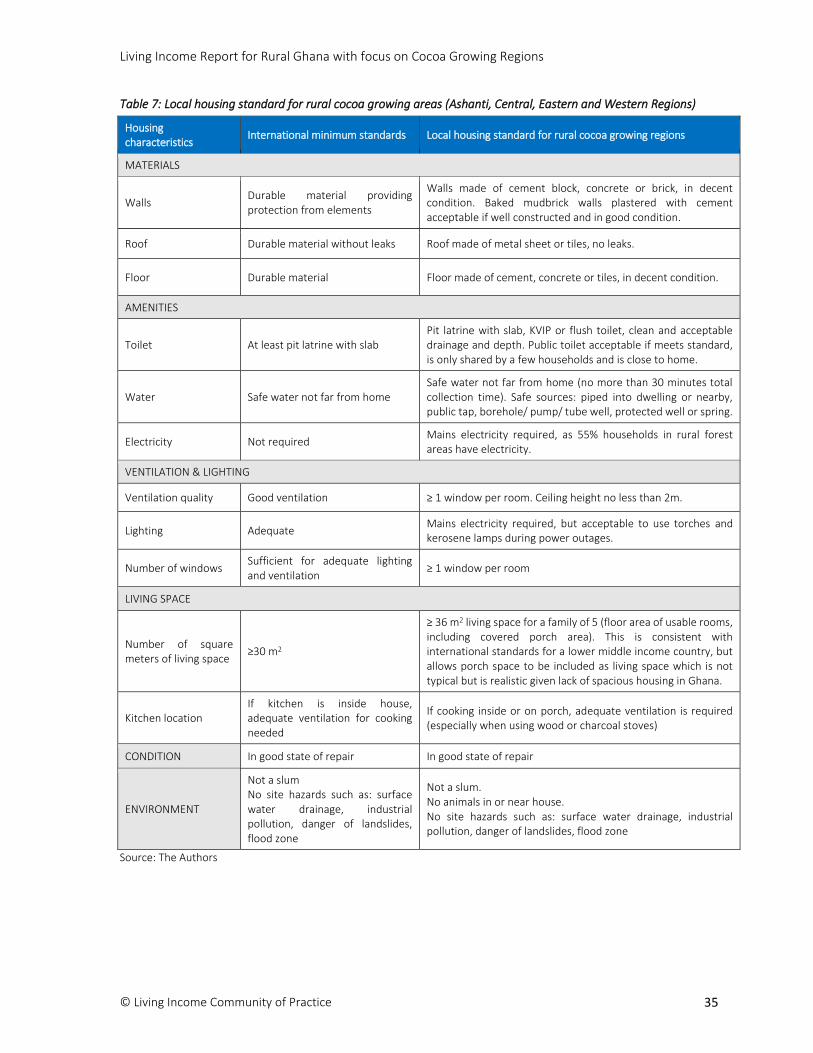
Living Income Report for Rural Ghana with focus on Cocoa Growing Regions
© Living Income Community of Practice
35
Table 7: Local housing standard for rural cocoa growing areas (Ashanti, Central, Eastern and Western Regions)
Housing characteristics
International minimum standards Local housing standard for rural cocoa growing regions
MATERIALS
Walls Durable material providing protection from elements
Walls made of cement block, concrete or brick, in decent condition. Baked mudbrick walls plastered with cement acceptable if well constructed and in good condition.
Roof Durable material without leaks Roof made of metal sheet or tiles, no leaks.
Floor Durable material Floor made of cement, concrete or tiles, in decent condition.
AMENITIES
Toilet At least pit latrine with slab Pit latrine with slab, KVIP or flush toilet, clean and acceptable drainage and depth. Public toilet acceptable if meets standard, is only shared by a few households and is close to home.
Water Safe water not far from home Safe water not far from home (no more than 30 minutes total collection time). Safe sources: piped into dwelling or nearby, public tap, borehole/ pump/ tube well, protected well or spring.
Electricity Not required Mains electricity required, as 55% households in rural forest areas have electricity.
VENTILATION & LIGHTING
Ventilation quality Good ventilation ≥ 1 window per room. Ceiling height no less than 2m.
Lighting Adequate Mains electricity required, but acceptable to use torches and kerosene lamps during power outages.
Number of windows Sufficient for adequate lighting and ventilation
≥ 1 window per room
LIVING SPACE
Number of square meters of living space
≥30 m2
≥ 36 m2 living space for a family of 5 (floor area of usable rooms, including covered porch area). This is consistent with international standards for a lower middle income country, but allows porch space to be included as living space which is not typical but is realistic given lack of spacious housing in Ghana.
Kitchen location If kitchen is inside house, adequate ventilation for cooking needed
If cooking inside or on porch, adequate ventilation is required (especially when using wood or charcoal stoves)
CONDITION In good state of repair In good state of repair
ENVIRONMENT
Not a slum No site hazards such as: surface water drainage, industrial pollution, danger of landslides, flood zone
Not a slum. No animals in or near house. No site hazards such as: surface water drainage, industrial pollution, danger of landslides, flood zone
Source: The Authors
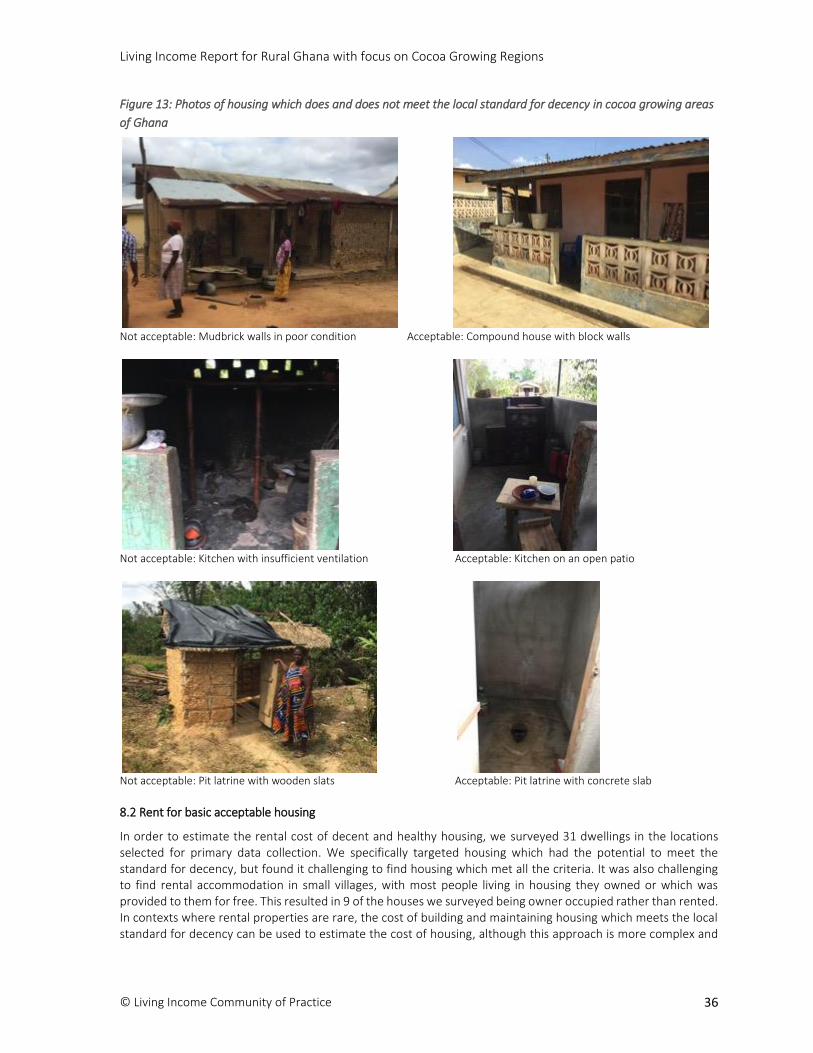
Living Income Report for Rural Ghana with focus on Cocoa Growing Regions
© Living Income Community of Practice
36
Figure 13: Photos of housing which does and does not meet the local standard for decency in cocoa growing areas
of Ghana
Not acceptable: Mudbrick walls in poor condition Acceptable: Compound house with block walls
Not acceptable: Kitchen with insufficient ventilation Acceptable: Kitchen on an open patio
Not acceptable: Pit latrine with wooden slats Acceptable: Pit latrine with concrete slab
8.2 Rent for basic acceptable housing
In order to estimate the rental cost of decent and healthy housing, we surveyed 31 dwellings in the locations selected for primary data collection. We specifically targeted housing which had the potential to meet the standard for decency, but found it challenging to find housing which met all the criteria. It was also challenging to find rental accommodation in small villages, with most people living in housing they owned or which was provided to them for free. This resulted in 9 of the houses we surveyed being owner occupied rather than rented. In contexts where rental properties are rare, the cost of building and maintaining housing which meets the local standard for decency can be used to estimate the cost of housing, although this approach is more complex and

Living Income Report for Rural Ghana with focus on Cocoa Growing Regions
© Living Income Community of Practice
37
less reliable than using rental costs due to the difficulties of gathering accurate data. We took a dual approach, seeking both rental costs and costs of building. Unfortunately, we did not find any examples of low income or government housing projects which could provide us with accurate information on building costs in the study locations65. We managed to gather information on building and maintenance costs from the owners of 7 properties, of which 3 met the standard for decency, but this data was not considered reliable as there were gaps in the data (e.g. market cost of land), full costs were not always accounted for (e.g. cost of labour; borrowing costs for capital), and houses were often built over several years which made it hard to estimate current costs. As such, we decided to base our estimates solely on rental costs.
We found 5 rented houses which met the decency standard, and 7 which did except for not having enough living space for a family of 5. A further 3 houses almost met the standard but fell short on a criteria such as mains electricity and adequate ventilation. The 'typical' dwelling which met, or almost met, the standard has two large rooms (living room and bedroom, known locally as 'chamber and hall'), a covered porch where cooking is done and/or a separate kitchen, and a bathroom and toilet which are shared with a few other households. In a few cases housing was of a standard considered higher than the minimum required for decency. For the 7 rented properties which did not meet the standard at all, the most common reasons were: (i) not enough living space for a family of 5; (ii) inadequate toilet facilities; (iii) poor construction or maintenance of building; (iv) insufficient ventilation of fumes from cooking.
Table 8 gives a summary of the dwellings visited, indicating whether they met the local housing standard or not, and the reasons why. The table also shows the rental costs for each dwelling, including the number of years of rent which tenants had to pay in advance and the date when they paid this advance.
Table 8: Summary of rental housing surveyed in rural cocoa growing areas
Acceptable standard? a
Rent per month (GHS) and Advance paid
Size b & rooms c Comments
Ashanti Region
No 20.8
1 year advance (Feb 2018)
19.8 m2 BR, porch, shared K
& BathR
Compound house. Insufficient living space, poor condition roof, toilet full so not usable, electricity cut off due to non-payment by some tenants, not enough ventilation of smoke from cooking.
Yes except for size
40 1 year advance (Nov.
2017)
25.7 m2
BR, porch, shared BathR + T
Decent standard for current household of 2 people, but not enough living space for family of 5.
Yes except for size
80 1 year advance (Jan
2018)
29.5 m2 LR, BR, porch, shared
BathR + T
Decent standard for current household of 1 person, but not enough living space for family of 5.
Yes except for size
80 2 year advance (Oct
2017)
25.8 m2 LR, BathR incl T,
porch
Semi-detached house in good condition. Decent standard for current household of 1 person, but not enough living space for family of 5.
Yes 100
2.5 year advance (Oct 2017)
39.6 m2 LR, BR, BathR, toilet,
porch
Newly built apartment, good size and decent condition. At higher end of decency as no shared facilities.
Central Region
No 15
6 year advance (Aug 2017)
22.6m2 BR, porch, shared
BathR + T
Living space inadequate. Not enough ventilation. Toilet shared with too many households.
Yes except for size
20 15m2 Decent standard for current household of 1 person, but not enough living space for family of 5.
65 This was confirmed by the Cocoa District Officers in each location.
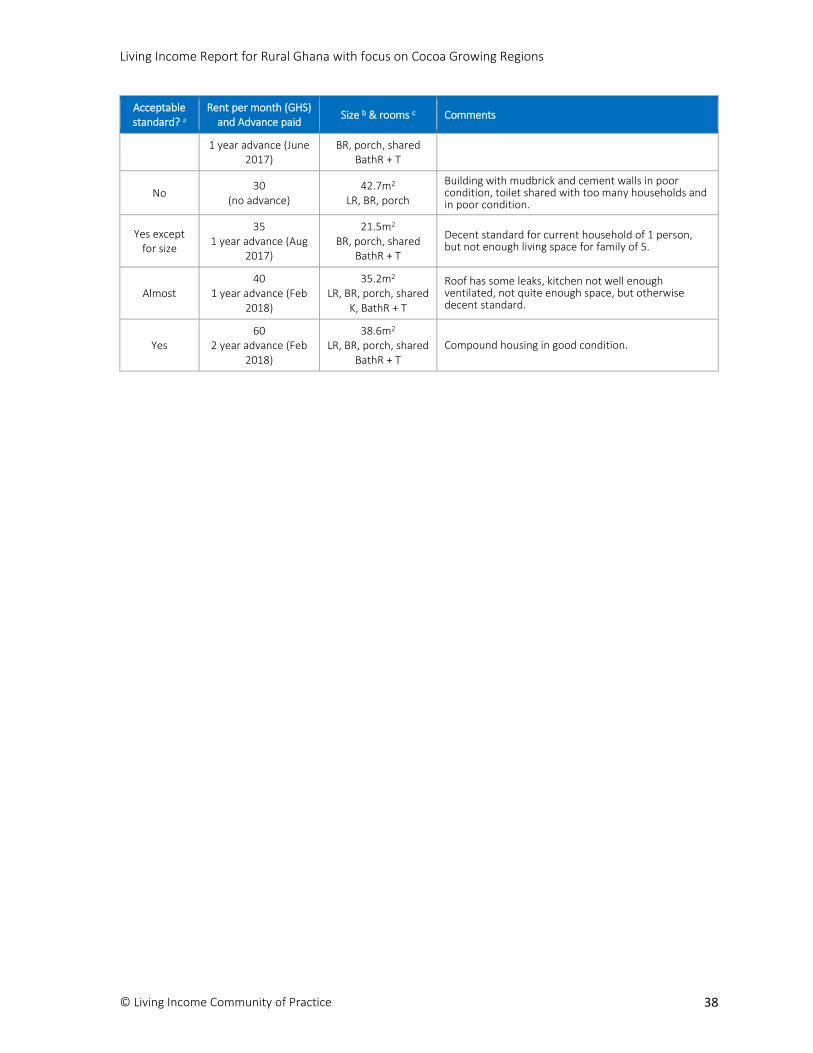
Living Income Report for Rural Ghana with focus on Cocoa Growing Regions
© Living Income Community of Practice
38
Acceptable standard? a
Rent per month (GHS) and Advance paid
Size b & rooms c Comments
1 year advance (June 2017)
BR, porch, shared BathR + T
No 30
(no advance) 42.7m2
LR, BR, porch
Building with mudbrick and cement walls in poor condition, toilet shared with too many households and in poor condition.
Yes except for size
35 1 year advance (Aug
2017)
21.5m2 BR, porch, shared
BathR + T
Decent standard for current household of 1 person, but not enough living space for family of 5.
Almost 40
1 year advance (Feb 2018)
35.2m2 LR, BR, porch, shared
K, BathR + T
Roof has some leaks, kitchen not well enough ventilated, not quite enough space, but otherwise decent standard.
Yes 60
2 year advance (Feb 2018)
38.6m2 LR, BR, porch, shared
BathR + T
Compound housing in good condition.

Living Income Report for Rural Ghana with focus on Cocoa Growing Regions
© Living Income Community of Practice
39
Acceptable standard? a
Rent per month (GHS) and Advance paid
Size b & rooms c Comments
Eastern Region
No 10
1 year advance (Oct 2017)
13.1m2 LR, shared BathR + T
Inadequate living space and construction (e.g. gap between wall and roof).
Yes except for size
Provided free (tenant estimated 20 per
month)
14.6m2 BR, shared BathR + T
Decent standard for current household of 1 person, but not enough living space for family of 5. Rental cost not necessarily reliable.
Almost 20
1 year advance (Jan 2018)
34m2 BR, K, porch, shared
BathR + T
Semi-detached house. Not quite enough space for family of 5, but decent standard.
Yes except for size
40 1 year advance (Dec
2017)
33.9m2 LR, BR, K, shared
BathR + T
Separate house with some shared facilities. Not quite enough space for family of 5, but decent standard.
No 80 incl. electricity 8 months advance
(Oct 2017)
37.4m2 LR, BR, porch, shared
BathR + T
Pit latrine does not have slab and is in poor condition. Insufficient ventilation.
Yes 80
2 year advance (Feb 2018)
39m2 LR, BR, porch, shared
BathR + T
Separate house with some shared facilities.
Yes 80
1 year advance (Sept 2017)
42.8m2 LR, BR, K, porch, shared BathR + T
Self contained apartment. At higher end of decency, though still some shared facilities.
Western Region
No 10
1 year advance (Jan 2018)
19.1m2 BR, porch, shared K,
BathR, T
Not enough space for family of 5, ventilation poor.
No 15
2 year advance (Sept 2016)
22.9m2 LR, BR, shared BathR
+ T
Not enough space for family of 5, windows too small, toilet and bathroom dirty.
Almost Provided free.
(Tenant estimated 41.7 per month)
36.6m2 LR, BR, K, BathR, T
1 of 3 self contained apartments for teachers at local primary school, built by NGO. Decent standard except no mains electricity. Rental cost not necessarily reliable.
Yes 60
4 years advance (2011)
46.1m2 LR, BR, porch, shared
K, BathR, T
Compound housing. Tenant is health worker, so landlord has not charged rent for last 2 years. Rent may be higher at current rates.
Notes: a Dwelling is considered of acceptable standard if it meets all the criteria contained in the local decent housing standard. b Size of dwelling is the total floor area for all rooms, including covered porch areas, but excluding walls. c LR stands for living room, BR is bedroom, K is kitchen, and BathR is bathroom, T is toilet.
The rental cost ranged from GHS 20 per month to GHS 100 per month, with most in the GHS 40-80 range. There were no clear differences between rental costs in small villages compared to large villages and small towns, but
Living Income Report for Rural Ghana with focus on Cocoa Growing Regions
© Living Income Community of Practice
40
this is largely due to the low number of rental properties we found in small villages66. Similarly, the sample was too small to pick up differences between regions.
The rental cost for the 5 houses that met the standard ranged from GHS 60 to GHS 100 per month, with the top end considered somewhat above the minimum standard for decency. For the 6 rented houses that met the standard except for the amount of living space (excluding the house provided rent free), we calculated the cost per square metre and extrapolated this to get an approximate cost for the minimum space for decency of 36m2. This gave us a range of GHS 42 to GHS 112 per month, with a mean of GHS 69. Taking the same approach for housing which did not meet the standard of decency gave us a range of GHS 19 to 48 per month, with a mean of GHS 29.
Taking all the information into consideration, GHS 60-80 per month for renting decent housing seems reasonable at 2018 prices, with GHS 70 considered an appropriate figure to use.
In addition, it is necessary to add an amount to reflect the cost of having to pay 1-2 years rent in advance. This may be borrowing costs or opportunity costs (i.e. lost income from having the money tied up in advance rent rather than invested). The Bank of Ghana calculated the average Annual Percentage Rate (APR) charged on loans and credit at 24.5% at the end of February 2018, while the average Annual Interest rate (AI) for bank deposits was 10.1%. Although most farmers are unlikely to be using banks to borrow or save money, we can use these figures to given a rough estimate of borrowing and opportunity costs in Ghana. It makes sense to use the midway value of 17.3%, as some farmers may have to borrow money why others may have savings which they could otherwise invest. Most people pay 1 year advance, so for rent of GHS 70 per month this would equate to GHS 12 per month. This gives a total rental cost of GHS 82 per month for decent housing.
8.3 Utilities and other housing costs
We estimated the cost of utility and other housing costs using a combination of secondary data and information gathered through the local housing survey. The costs fall into three main areas: electricity and other lighting; water; and cooking fuel. In most cases the cost for repairs and maintenance is covered by the landlord. Tenants sometimes pay for relatively minor one off costs, such as maintaining a polytank or small electrical repairs, but these are relatively rare. As such, it is not considered necessary to include anything for repairs and maintenance in the cost of decent housing.
All but one of the rented houses visited were connected to mains electricity. The average cost per household was GHS 29.65 per month, excluding houses with only one room (as this would not be adequate for decent housing) and a house which had a generator. In addition, most households reported expenditure on batteries and/or kerosene for lamps or torches, as blackouts are common in Ghana, typically occurring several times a week for at least a few hours, if not days at a time.67 Expenditure on batteries and/or kerosene averaged GHS 3.26 per month according to households interviewed.
In the local survey the most common source of water for drinking and for general use was a public standpipe or borehole (26 of 31 houses). In the other cases water was piped to the dwelling or compound, or to a neighbour's house. Sometimes rainwater was collected, or river water used, but not for drinking. In the majority of cases water was paid for (except rain and river water) and usually collected daily in buckets and stored in large plastic barrels with lids. However, in 12 cases there was no charge, or a nominal fee of GHS 1 per month, for water
66 In contexts where rental properties are rare, the cost of building and maintaining housing which meets the local standard for decency can be used to estimate the cost of housing. Unfortunately, we found no examples of low income or government housing projects which could provide us with accurate information on building costs in the study areas. We gathered information on building an maintenance costs from the owners of 7 properties, of which 3 met the standard for decency, but this data is not considered reliable as there were gaps in the data (e.g. for the market cost of land), full costs were not always accounted for (e.g. cost of labour), and houses were often built over several years which made it hard to estimate current costs. 67 Blackouts due to insufficient power supply is a well known problem in Ghana, with blackouts experienced on 159 days in 2015. See: https://phys.org/news/2017-02-ghana.html
Living Income Report for Rural Ghana with focus on Cocoa Growing Regions
© Living Income Community of Practice
41
collected from public boreholes. The average cost was GHS 3.44 per household member per month, giving an average of GHS 17.20 for a family of 5 people.
Cooking fuels used by households in the survey were gas (11 households), gas and charcoal (5 households), charcoal (5 households), gas and wood (1 household), and wood (6 households)68. The households which used wood were excluded, as it is not costly appropriately69, as were households exclusively using gas, rather than a combination of gas and charcoal, as gas is expensive. This gave us average expenditure on fuel of GHS 14.4 per household member per month, meaning an average of GHS 72.0 for a family of 5 people.
This gives a total of GHS 122 per household per month as an estimate for expenditure on utilities from our local housing survey. We compared this with an estimate derived using secondary data on household expenditure, which are based on a representative sample of households across Ghana, but unfortunately not disaggregated by locality for expenditure on utilities. The GLSS 6 found that across Ghana 7.9% of household cash expenditure was on utilities (comprising electricity, gas and other fuels, water supply and miscellaneous services related to dwelling), with the cost of utilities as a percentage of food costs being 14.5%70. The preliminary estimate of the Living Income model diet is GHS 757 per month for a family of 5 people; 14.5% of this gives us an estimate of GHS 110 for utilities. This is somewhat lower than the estimate of GHS 122 from the housing survey, which is somewhat surprising given GLSS 6 indicates that households in rural forest areas spend relatively less on housing and utilities than the average for all Ghana. This may be explained by the fact year-on-year inflation for 'housing, water, electricity, gas and other fuels' was above the general rate of non-food inflation in the years following the GLSS 6 (e.g. 43.8% for March 2014 compared to 19.2% for all non-food, and 26.2% in March 2015 compared to 23.1% for all non-food), although it has been somewhat below the general rate in the past two years (e.g. 7.3% compared to 11.8% for all non-food for March 2018).71 Given this context, it is reasonable to take a midway figure between the two estimates, i.e. GHS 116 per month.
9. NON-FOOD AND NON-HOUSING COSTS
Food and housing make up the majority of household expenditure in Ghana, but there are a range of additional costs which a Living Income needs to cover, including: health care, education, transport, furniture and household equipment, clothing and footwear, personal care, mobile phones, and recreation and culture. It would be too complex and expensive to estimate the cost of all these items separately, so they are grouped together as 'non-food non-housing' costs and estimated using secondary data on current expenditure patterns. Cross-checks are done using primary data for important expenditure groups, notably health and education, to ensure that the amounts included for them are sufficient for decency. This is necessary as current expenditure may be limited by low incomes.
We estimated all non-food non-housing costs for rural cocoa growing areas (Ashanti, Central, Eastern and Western Regions) to be GHS 439 ($99) per month for a family of 2 adults and 3 children. Below we describe the steps taken to arrive at this estimate.
The first step was to calculate the ratio of non-food non-housing (NFNH) expenditure to food expenditure using the most recent Ghana Living Standards Survey data (GLSS 6). We used data specific to rural forest zones, as the most representative for cocoa growing areas72. Table 9 shows that this gave us a mean unadjusted NFNH to Food ratio of 0.72 for our rural cocoa growing areas, which compares to 0.88 for all Ghana.
68 Two dwellings were empty at the time of the survey, and the single male adult in one household said he did not cook. 69 In many cases firewood was said to be 'free', but in reality there is significant labour involved in gathering firewood which implies opportunity costs. 70 Utilities make up 7.9% of cash expenditure compared to 45.8% for food and non-alcoholic beverages. This gives a ratio of 17.2% (cost of utilities as percentage of cost of cash expenditure on food). However, cash expenditure makes up 84% of all expenditure on food, which means the cost of utilities as a percentage of all food expenditure is 14.5%. 71 GSS Statistical Bulletins, Consumer Price Index, http://www.statsghana.gov.gh/cpi_bulletin.html 72 Some data is only available for rural areas in general (e.g. % household expenditure on education), and some only at the national level with no disaggregation by location (e.g. % of household expenditure on tobacco). In such cases we used ratios to
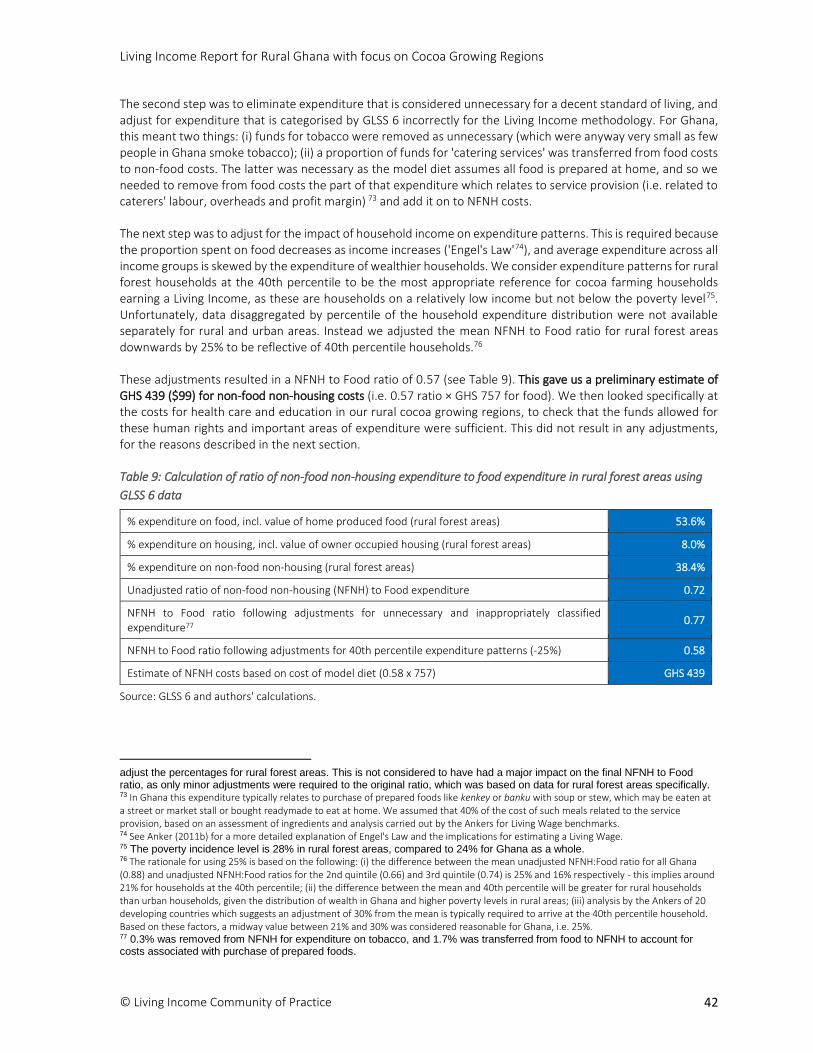
Living Income Report for Rural Ghana with focus on Cocoa Growing Regions
© Living Income Community of Practice
42
The second step was to eliminate expenditure that is considered unnecessary for a decent standard of living, and adjust for expenditure that is categorised by GLSS 6 incorrectly for the Living Income methodology. For Ghana, this meant two things: (i) funds for tobacco were removed as unnecessary (which were anyway very small as few people in Ghana smoke tobacco); (ii) a proportion of funds for 'catering services' was transferred from food costs to non-food costs. The latter was necessary as the model diet assumes all food is prepared at home, and so we needed to remove from food costs the part of that expenditure which relates to service provision (i.e. related to caterers' labour, overheads and profit margin) 73 and add it on to NFNH costs.
The next step was to adjust for the impact of household income on expenditure patterns. This is required because the proportion spent on food decreases as income increases ('Engel's Law'74), and average expenditure across all income groups is skewed by the expenditure of wealthier households. We consider expenditure patterns for rural forest households at the 40th percentile to be the most appropriate reference for cocoa farming households earning a Living Income, as these are households on a relatively low income but not below the poverty level75. Unfortunately, data disaggregated by percentile of the household expenditure distribution were not available separately for rural and urban areas. Instead we adjusted the mean NFNH to Food ratio for rural forest areas downwards by 25% to be reflective of 40th percentile households.76
These adjustments resulted in a NFNH to Food ratio of 0.57 (see Table 9). This gave us a preliminary estimate of GHS 439 ($99) for non-food non-housing costs (i.e. 0.57 ratio × GHS 757 for food). We then looked specifically at the costs for health care and education in our rural cocoa growing regions, to check that the funds allowed for these human rights and important areas of expenditure were sufficient. This did not result in any adjustments, for the reasons described in the next section.
Table 9: Calculation of ratio of non-food non-housing expenditure to food expenditure in rural forest areas using
GLSS 6 data
% expenditure on food, incl. value of home produced food (rural forest areas) 53.6%
% expenditure on housing, incl. value of owner occupied housing (rural forest areas) 8.0%
% expenditure on non-food non-housing (rural forest areas) 38.4%
Unadjusted ratio of non-food non-housing (NFNH) to Food expenditure 0.72
NFNH to Food ratio following adjustments for unnecessary and inappropriately classified expenditure77
0.77
NFNH to Food ratio following adjustments for 40th percentile expenditure patterns (-25%) 0.58
Estimate of NFNH costs based on cost of model diet (0.58 x 757) GHS 439
Source: GLSS 6 and authors' calculations.
adjust the percentages for rural forest areas. This is not considered to have had a major impact on the final NFNH to Food ratio, as only minor adjustments were required to the original ratio, which was based on data for rural forest areas specifically. 73 In Ghana this expenditure typically relates to purchase of prepared foods like kenkey or banku with soup or stew, which may be eaten at a street or market stall or bought readymade to eat at home. We assumed that 40% of the cost of such meals related to the service provision, based on an assessment of ingredients and analysis carried out by the Ankers for Living Wage benchmarks. 74 See Anker (2011b) for a more detailed explanation of Engel's Law and the implications for estimating a Living Wage. 75 The poverty incidence level is 28% in rural forest areas, compared to 24% for Ghana as a whole. 76 The rationale for using 25% is based on the following: (i) the difference between the mean unadjusted NFNH:Food ratio for all Ghana (0.88) and unadjusted NFNH:Food ratios for the 2nd quintile (0.66) and 3rd quintile (0.74) is 25% and 16% respectively - this implies around 21% for households at the 40th percentile; (ii) the difference between the mean and 40th percentile will be greater for rural households than urban households, given the distribution of wealth in Ghana and higher poverty levels in rural areas; (iii) analysis by the Ankers of 20 developing countries which suggests an adjustment of 30% from the mean is typically required to arrive at the 40th percentile household. Based on these factors, a midway value between 21% and 30% was considered reasonable for Ghana, i.e. 25%. 77 0.3% was removed from NFNH for expenditure on tobacco, and 1.7% was transferred from food to NFNH to account for costs associated with purchase of prepared foods.
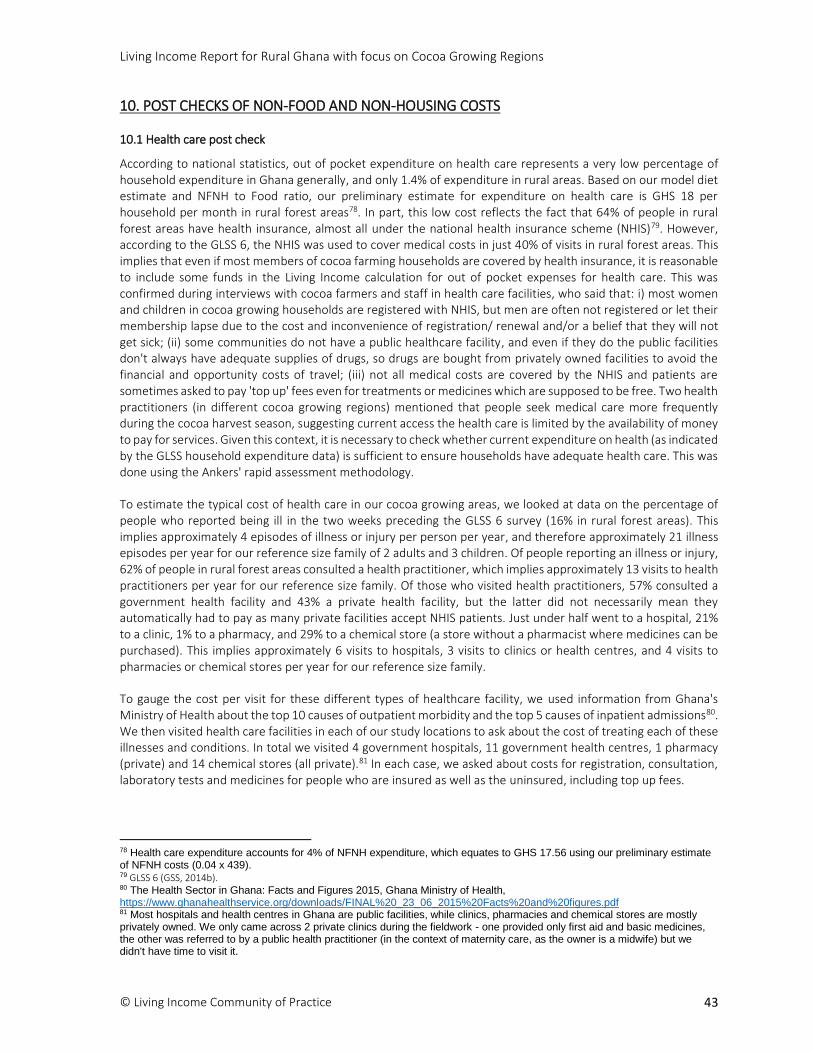
Living Income Report for Rural Ghana with focus on Cocoa Growing Regions
© Living Income Community of Practice
43
10. POST CHECKS OF NON-FOOD AND NON-HOUSING COSTS
10.1 Health care post check
According to national statistics, out of pocket expenditure on health care represents a very low percentage of household expenditure in Ghana generally, and only 1.4% of expenditure in rural areas. Based on our model diet estimate and NFNH to Food ratio, our preliminary estimate for expenditure on health care is GHS 18 per household per month in rural forest areas78. In part, this low cost reflects the fact that 64% of people in rural forest areas have health insurance, almost all under the national health insurance scheme (NHIS)79. However, according to the GLSS 6, the NHIS was used to cover medical costs in just 40% of visits in rural forest areas. This implies that even if most members of cocoa farming households are covered by health insurance, it is reasonable to include some funds in the Living Income calculation for out of pocket expenses for health care. This was confirmed during interviews with cocoa farmers and staff in health care facilities, who said that: i) most women and children in cocoa growing households are registered with NHIS, but men are often not registered or let their membership lapse due to the cost and inconvenience of registration/ renewal and/or a belief that they will not get sick; (ii) some communities do not have a public healthcare facility, and even if they do the public facilities don't always have adequate supplies of drugs, so drugs are bought from privately owned facilities to avoid the financial and opportunity costs of travel; (iii) not all medical costs are covered by the NHIS and patients are sometimes asked to pay 'top up' fees even for treatments or medicines which are supposed to be free. Two health practitioners (in different cocoa growing regions) mentioned that people seek medical care more frequently during the cocoa harvest season, suggesting current access the health care is limited by the availability of money to pay for services. Given this context, it is necessary to check whether current expenditure on health (as indicated by the GLSS household expenditure data) is sufficient to ensure households have adequate health care. This was done using the Ankers' rapid assessment methodology.
To estimate the typical cost of health care in our cocoa growing areas, we looked at data on the percentage of people who reported being ill in the two weeks preceding the GLSS 6 survey (16% in rural forest areas). This implies approximately 4 episodes of illness or injury per person per year, and therefore approximately 21 illness episodes per year for our reference size family of 2 adults and 3 children. Of people reporting an illness or injury, 62% of people in rural forest areas consulted a health practitioner, which implies approximately 13 visits to health practitioners per year for our reference size family. Of those who visited health practitioners, 57% consulted a government health facility and 43% a private health facility, but the latter did not necessarily mean they automatically had to pay as many private facilities accept NHIS patients. Just under half went to a hospital, 21% to a clinic, 1% to a pharmacy, and 29% to a chemical store (a store without a pharmacist where medicines can be purchased). This implies approximately 6 visits to hospitals, 3 visits to clinics or health centres, and 4 visits to pharmacies or chemical stores per year for our reference size family.
To gauge the cost per visit for these different types of healthcare facility, we used information from Ghana's Ministry of Health about the top 10 causes of outpatient morbidity and the top 5 causes of inpatient admissions80. We then visited health care facilities in each of our study locations to ask about the cost of treating each of these illnesses and conditions. In total we visited 4 government hospitals, 11 government health centres, 1 pharmacy (private) and 14 chemical stores (all private).81 In each case, we asked about costs for registration, consultation, laboratory tests and medicines for people who are insured as well as the uninsured, including top up fees.
78 Health care expenditure accounts for 4% of NFNH expenditure, which equates to GHS 17.56 using our preliminary estimate of NFNH costs (0.04 x 439). 79 GLSS 6 (GSS, 2014b). 80 The Health Sector in Ghana: Facts and Figures 2015, Ghana Ministry of Health, https://www.ghanahealthservice.org/downloads/FINAL%20_23_06_2015%20Facts%20and%20figures.pdf 81 Most hospitals and health centres in Ghana are public facilities, while clinics, pharmacies and chemical stores are mostly privately owned. We only came across 2 private clinics during the fieldwork - one provided only first aid and basic medicines, the other was referred to by a public health practitioner (in the context of maternity care, as the owner is a midwife) but we didn't have time to visit it.
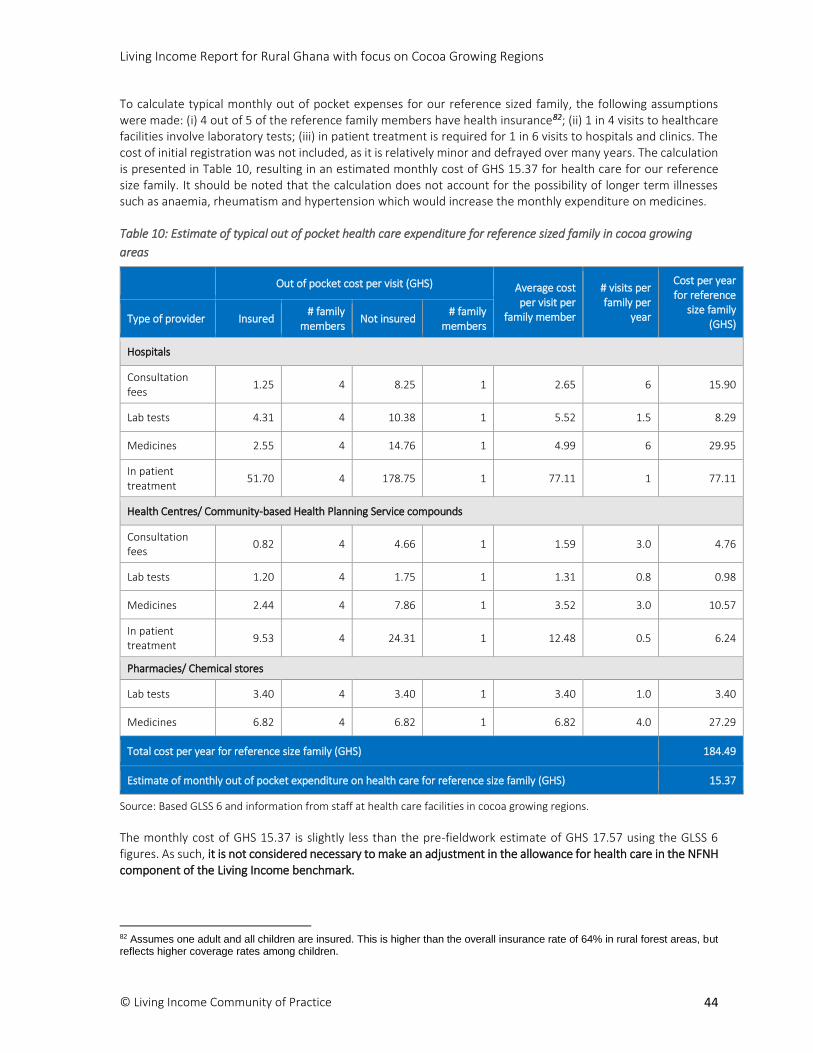
Living Income Report for Rural Ghana with focus on Cocoa Growing Regions
© Living Income Community of Practice
44
To calculate typical monthly out of pocket expenses for our reference sized family, the following assumptions were made: (i) 4 out of 5 of the reference family members have health insurance82; (ii) 1 in 4 visits to healthcare facilities involve laboratory tests; (iii) in patient treatment is required for 1 in 6 visits to hospitals and clinics. The cost of initial registration was not included, as it is relatively minor and defrayed over many years. The calculation is presented in Table 10, resulting in an estimated monthly cost of GHS 15.37 for health care for our reference size family. It should be noted that the calculation does not account for the possibility of longer term illnesses such as anaemia, rheumatism and hypertension which would increase the monthly expenditure on medicines.
Table 10: Estimate of typical out of pocket health care expenditure for reference sized family in cocoa growing
areas
Out of pocket cost per visit (GHS) Average cost per visit per
family member
# visits per family per
year
Cost per year for reference
size family (GHS) Type of provider Insured
# family members
Not insured # family
members
Hospitals
Consultation fees
1.25 4 8.25 1 2.65 6 15.90
Lab tests 4.31 4 10.38 1 5.52 1.5 8.29
Medicines 2.55 4 14.76 1 4.99 6 29.95
In patient treatment
51.70 4 178.75 1 77.11 1 77.11
Health Centres/ Community-based Health Planning Service compounds
Consultation fees
0.82 4 4.66 1 1.59 3.0 4.76
Lab tests 1.20 4 1.75 1 1.31 0.8 0.98
Medicines 2.44 4 7.86 1 3.52 3.0 10.57
In patient treatment
9.53 4 24.31 1 12.48 0.5 6.24
Pharmacies/ Chemical stores
Lab tests 3.40 4 3.40 1 3.40 1.0 3.40
Medicines 6.82 4 6.82 1 6.82 4.0 27.29
Total cost per year for reference size family (GHS) 184.49
Estimate of monthly out of pocket expenditure on health care for reference size family (GHS) 15.37
Source: Based GLSS 6 and information from staff at health care facilities in cocoa growing regions.
The monthly cost of GHS 15.37 is slightly less than the pre-fieldwork estimate of GHS 17.57 using the GLSS 6 figures. As such, it is not considered necessary to make an adjustment in the allowance for health care in the NFNH component of the Living Income benchmark.
82 Assumes one adult and all children are insured. This is higher than the overall insurance rate of 64% in rural forest areas, but reflects higher coverage rates among children.

Living Income Report for Rural Ghana with focus on Cocoa Growing Regions
© Living Income Community of Practice
45
10.2 Education post check
Schooling in Ghana is structured as follows:
Pre-school: 1 year nursery (age 3-4) plus 2 years kindergarten (age 4-6). Kindergarten is considered part of basic education and is compulsory;
Primary: 6 years (age 6-12);
Junior Secondary School, known as Junior High School (JHS): 3 years (age 12-15);
Senior Secondary School, known as Senior High School (SHS): 3 years (age 15-18). SHS may be as
general, technical, vocational, business or agricultural institutions.
National enrolment data indicate that the majority of children in Ghana attend public school rather than private school, particularly at secondary level. School attendance rates reported by the Ministry of Education show that net enrolment is high for kindergarten and primary school, at around 91% for both boys and girls, but below 50% for both junior and senior secondary school (and somewhat lower for girls than boys).83 The majority of children attend public school rather than private school, particularly at secondary level, and most cocoa farmers we spoke to during fieldwork said their children attended government schools. The public education system faces a number of challenges, including a lack of financial and material resources, inadequate school infrastructure, shortage of qualified teachers (particularly in rural and remote communities), and a lack of credible and reliable data on student and teacher performance.84 Nevertheless, sending children to private school is not considered necessary for a basic level of decency in the Ghana context.
National statistics indicate that 8% of household expenditure in rural forest areas is on education85 - a relatively high percentage relative to other countries. On inspecting the data, we see that this is partly explained by the fact that a wide range of costs are covered in Ghana household expenditure statistics as part of this 8%, including clothing, books, transport, food, PTA contributions, expenses on extra classes, and in-kind expenses. Our preliminary estimate of education-related expenditure based on these figures is GHS 88 per month for rural forest areas.86
To find out about educated-related costs in our four cocoa growing regions, we gathered information from officials in 28 schools covering all levels of education. The average cost per child per year including all fees, uniforms, school supplies, meals, and transport, was GHS 371 in kindergarten, GHS 509 in primary school, and GHS 643 in JHS. At SHS level the cost for students in year one was only GHS 522, as the government introduced a policy of free SHS education in September 2017. This compares to an average of GHS 2,120 for students currently in years two and three, who are not within the scope of the new policy, but who will be in future.
Lunch money makes up a significant proportion of these costs, as parents send their children to school with between GHS 0.50 and 5 per day to buy lunch (depending on their age and affordability for the family).87 The Living Income benchmark assumes that all meals are prepared at home. Rather than removing this expenditure from the post check estimate of education costs, it is preferable to calculate the value of children's lunches based on the model diet (which varies depending on the age, and therefore calorie requirements), and then reduce the expenditure on education by the replacement cost of those meals. This brings the figures down to GHS 139 per
83 Ghana Ministry of Education (2015a, 2015b). 84 UNESCO (2015). 85 GLSS 6. 86 As for our estimate of expenditure on health care, these figures are based on calculating the percentage of all NFNH costs which are for education, and then multiplying this percentage by our estimate of NFNH costs. 87 Of the 24 kindergarden/ primary/ JHS schools visited, 6 were participating in the government's School Feeding Programme (SFP) through which students receive a free lunch. However, teachers said that students still bring money to school to supplement the meals provided.

Living Income Report for Rural Ghana with focus on Cocoa Growing Regions
© Living Income Community of Practice
46
child per year in kindergarten, GHS 190 in primary school, GHS 201 in JHS, and GHS 293 (year 1) / 1,611 (years 2 and 3) in SHS.
The next step is to estimate the monthly cost for education for our reference family. This is calculated by multiplying the cost per year in each level of school by the number of years spent at that level, then dividing the total of these amounts by 18 years to arrive at an average cost per year over the 18 years of a child's life. This amount is then multiplied by the 3 children in our reference family to arrive at an estimated cost of GHS 99 per month for education (see Table 11). This amount is 13% higher than the amount estimated using national statistics for rural forest areas (GHS 88). Given the difference is relatively small, and the post check is based on a limited amount of primary data, we feel there is no strong argument to adjust the education component of the estimate for NFNH costs.
Table 11: Post check estimate of education related costs for reference family based on primary data collection
Kinder-garten
Primary JHS SHS Year 1 SHS Years 2
& 3 Total
Average expenditure per student per year, GHS
138.66 190.30 201.26 293.20 1610.86 -
Number of years in level 2 6 3 1 2 -
Annual cost per student x number of years in level, GHS
277.32 1141.80 603.78 293.2 3221.72 5537.82
Average cost per student per year, GHS
- - - - - 395.56
Average cost per child per month, GHS
- - - - - 32.96
Average cost for reference family with 3 children per month (GHS)
- - - - - 98.89
Source: Based GLSS 6 and information from staff at schools in cocoa growing regions.
11. PROVISION FOR UNEXPECTED EVENTS TO ENSURE SUSTAINABILITY
Unforeseen events and expenses, such as accidents, illness or death of family members, can quickly throw people living a basic lifestyle into poverty and debt from which it is often difficult to recover. For this reason it is common when estimating a Living Wage or Living Income to add a small margin above the cost of a basic quality life to allow for unexpected events. It is also common to include some funds to allow for some discretionary spending. Margins of 5% and 10% are the most common. For the Anker Living Wage methodology, a 5% margin on the basic cost of living is generally recommended. In a smallholder farming context (as compared to a waged employment context) there are additional risks to income due to weather-related shocks, climate change, periodic infestation, and global market price fluctuations. However, these risks need to be accounted for on the side of actual incomes, with resiliency costs built into the calculation of net incomes from agricultural production88. This is important because the Living Income benchmark is applicable to any family in a geographic area regardless of livelihood system, and so provision for unexpected events and sustainability should be for those situations which are common across families regardless of how they earn their income. As such, a margin of 5% is considered appropriate for Living Income benchmarks89, unless there are strong reasons to go above this.
A possible reason to allow a higher percentage in Ghana relates to the norm of providing financial support to parents and extended family members if one has the means to do so, and the fact it would socially be
88 Grillo, 2018. 89 Ibid.

Living Income Report for Rural Ghana with focus on Cocoa Growing Regions
© Living Income Community of Practice
47
unacceptable not to do so. Regular giving to churches and other religious bodies is another norm widely practiced in Ghana. Discussions with cocoa farmers indicated that these two types of expenditure can involve significant amounts of money each month. However, they are accounted for under gifts and donations in the household expenditure statistics, and while the amount given may increase with higher levels of income, they are almost always based on affordability (i.e. you give what you can). As such, it is not considered necessary to allow an additional amount for this in the margin for sustainability.
A 5% margin on top of basic costs equates to GHS 70 ($16) per month for unexpected events and discretionary spending. Note that interest and debt payments are excluded from the Living Income calculation, as it is assumed that a Living Income would enable families to stay out of crippling debt.
Living Income Report for Rural Ghana with focus on Cocoa Growing Regions
© Living Income Community of Practice
48
SECTION III: LIVING INCOME FOR SMALLHOLDER FARMERS
12. FAMILY SIZE NEEDING TO BE SUPPORTED BY LIVING INCOME
Living Income is a family concept, as indicated in the definition given at the start of this report. It was therefore necessary to determine an appropriate family size for a typical family in rural cocoa growing areas of Ghana (Ashanti, Central, Eastern and Western Regions).
We use 2 adults and 3 children as the reference family size for our Living Income benchmark. This is based on (i) the number of children that women in rural Ghana typically have ('total fertility rate') and the survival rate of children, and (ii) average household sizes in rural areas, as explained below.
The total fertility rate (TFR) for rural forest areas of Ghana is around 4.5 children. The 2014 Ghana Demographic and Health Survey (DHS) reported that women in rural areas have on average 5.1 children, while the 2010 Population and Housing Census found an average of 5.3 children and the 2011 Multiple Indicator Cluster Survey (MICS) reported an average of 5.5 children. Regional figures suggest the rural averages are skewed upwards by higher fertility rates in northern Ghana - women have an average of between 4.8 and 6.2 children in the 3 northern regions according to the DHS, compared to an average of 3.6 to 4.7 children in the four regions of our study90. The midway point of the 3 data sources for rural areas is 5.3, so 4.5 for rural forest areas represents a moderate downward adjustment to mitigate for the influence of northern Ghana on the figures.
Not all of these children survive: between 8% and 9% of children die before their fifth birthday in rural Ghana.91 As for TFRs, under-5 mortality rates (U5MR) are higher in northern Ghana than elsewhere92, so following the same logic as before we assume a U5MR of around 7.5% for rural forest areas. This gives us an average of around 4.2 surviving children for women in cocoa growing regions. However, we also need to take into account spacing between births93, and that at any given point in time not all children have been born yet and/or are still under 18. For a typical family in cocoa growing regions, the number of children under 18 is therefore likely to be somewhat under 4 (depending on the age of the mother).
Turning to data on household size, the 2010 national census found an average household size of 4.7 people in rural areas, excluding 1 person households (that do not have any dependents) and especially large households (that are likely to have several earners). This compares to a mean household size of 4.5 for all rural areas and 4.1 in rural forest areas according to GLSS 6 (including single person and very large households). This suggests the household size of 4.7 calculated using the census data for rural areas may be on the high side for cocoa growing areas94. Several relatively large scale surveys carried out in the cocoa sector have found a mean or median household size of between 4.4 and 5 people95. However, KIT's recent survey of 1,560 rural households in all cocoa growing regions of Ghana96 found an average household size of 5.8 people, of which 2.6 were children under 18 years.97 These differences in household size and composition are likely to be due to differences in sampling and
90 Between 70% and 84% of people in northern Ghana live in rural areas, compared to 49% for the country as a whole. As such, while only 17.1% of the total population lives in the three northern regions, they account for 26.1% of the rural population. (Figures based on 2010 Population and Housing Census.) 91 DHS (2014) reports an under five mortality of 7.5% for rural areas, PHC (2010) reports 9%, and MICS (2011) report 9.4%. 92 10% to 12% in the 3 northern regions compared to 5.6% to 8% for our 4 cocoa growing region, according to the DHS. 93 Median spacing between births is 38.2 months in rural areas (average 3.2 years between births), with rural women being on average 20.1 years old when they have their first child (DHS, 2014). 94 The mean household size for rural areas in the 2010 PHC was 5 people, which came down to 4.7 once single person and very large households were excluded. 95 Hainmueller et al. (2011) found a median household size of 5 among 3,000 cocoa farming households across 5 regions of Ghana, typically 2 adults and 3 children; Kolavalli and Vigneri (2017) report a mean household size of 5 people among 702 cocoa farming households in 3 regions, based on a 2010 survey; Vigneri and Serra (2016) found a mean household size of 4.4 among 900 cocoa farming households in 2 regions. 96 Bymolt, Laven and Tyszler, 2018. 97 Asamoah et al. (2017) also report larger household sizes than other surveys of cocoa farming households, with 22% of their 1,761 households having between 2 and 4 members, 42% having 5-7 members, and 29% having 8-12 members.
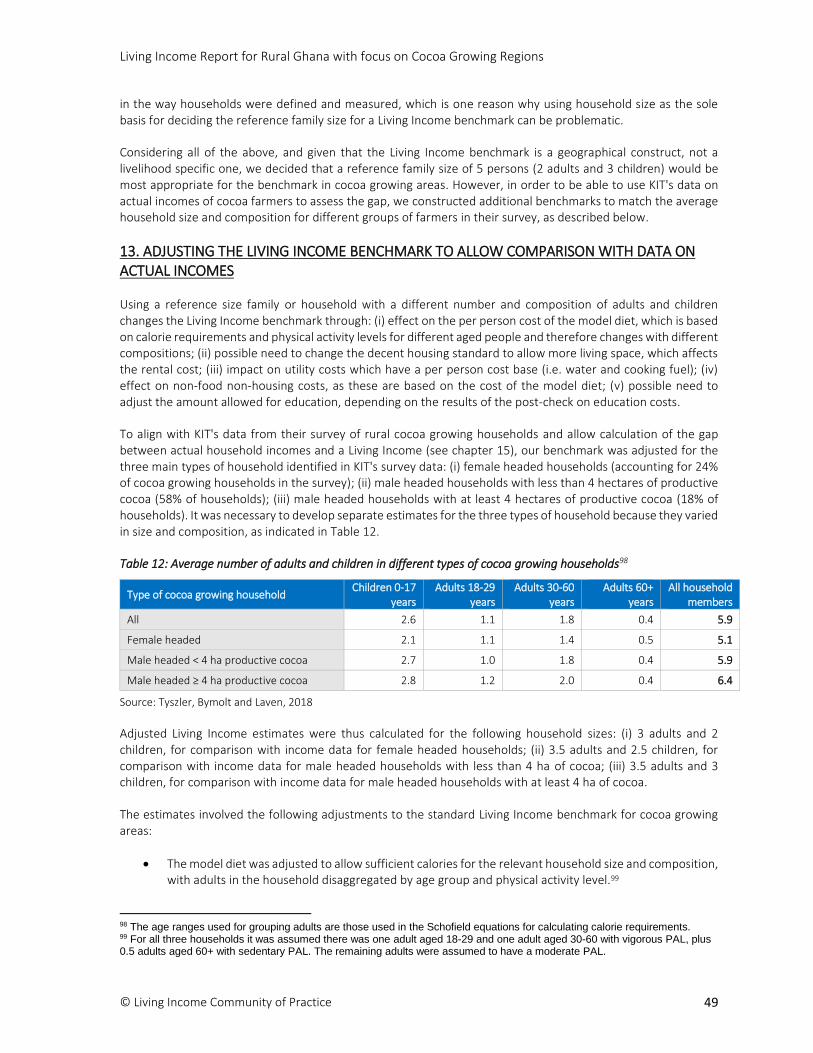
Living Income Report for Rural Ghana with focus on Cocoa Growing Regions
© Living Income Community of Practice
49
in the way households were defined and measured, which is one reason why using household size as the sole basis for deciding the reference family size for a Living Income benchmark can be problematic.
Considering all of the above, and given that the Living Income benchmark is a geographical construct, not a livelihood specific one, we decided that a reference family size of 5 persons (2 adults and 3 children) would be most appropriate for the benchmark in cocoa growing areas. However, in order to be able to use KIT's data on actual incomes of cocoa farmers to assess the gap, we constructed additional benchmarks to match the average household size and composition for different groups of farmers in their survey, as described below.
13. ADJUSTING THE LIVING INCOME BENCHMARK TO ALLOW COMPARISON WITH DATA ON ACTUAL INCOMES
Using a reference size family or household with a different number and composition of adults and children changes the Living Income benchmark through: (i) effect on the per person cost of the model diet, which is based on calorie requirements and physical activity levels for different aged people and therefore changes with different compositions; (ii) possible need to change the decent housing standard to allow more living space, which affects the rental cost; (iii) impact on utility costs which have a per person cost base (i.e. water and cooking fuel); (iv) effect on non-food non-housing costs, as these are based on the cost of the model diet; (v) possible need to adjust the amount allowed for education, depending on the results of the post-check on education costs.
To align with KIT's data from their survey of rural cocoa growing households and allow calculation of the gap between actual household incomes and a Living Income (see chapter 15), our benchmark was adjusted for the three main types of household identified in KIT's survey data: (i) female headed households (accounting for 24% of cocoa growing households in the survey); (ii) male headed households with less than 4 hectares of productive cocoa (58% of households); (iii) male headed households with at least 4 hectares of productive cocoa (18% of households). It was necessary to develop separate estimates for the three types of household because they varied in size and composition, as indicated in Table 12.
Table 12: Average number of adults and children in different types of cocoa growing households98
Type of cocoa growing household Children 0-17
years Adults 18-29
years Adults 30-60
years Adults 60+
years All household
members
All 2.6 1.1 1.8 0.4 5.9
Female headed 2.1 1.1 1.4 0.5 5.1
Male headed < 4 ha productive cocoa 2.7 1.0 1.8 0.4 5.9
Male headed ≥ 4 ha productive cocoa 2.8 1.2 2.0 0.4 6.4
Source: Tyszler, Bymolt and Laven, 2018
Adjusted Living Income estimates were thus calculated for the following household sizes: (i) 3 adults and 2 children, for comparison with income data for female headed households; (ii) 3.5 adults and 2.5 children, for comparison with income data for male headed households with less than 4 ha of cocoa; (iii) 3.5 adults and 3 children, for comparison with income data for male headed households with at least 4 ha of cocoa.
The estimates involved the following adjustments to the standard Living Income benchmark for cocoa growing areas:
The model diet was adjusted to allow sufficient calories for the relevant household size and composition, with adults in the household disaggregated by age group and physical activity level.99
98 The age ranges used for grouping adults are those used in the Schofield equations for calculating calorie requirements. 99 For all three households it was assumed there was one adult aged 18-29 and one adult aged 30-60 with vigorous PAL, plus 0.5 adults aged 60+ with sedentary PAL. The remaining adults were assumed to have a moderate PAL.
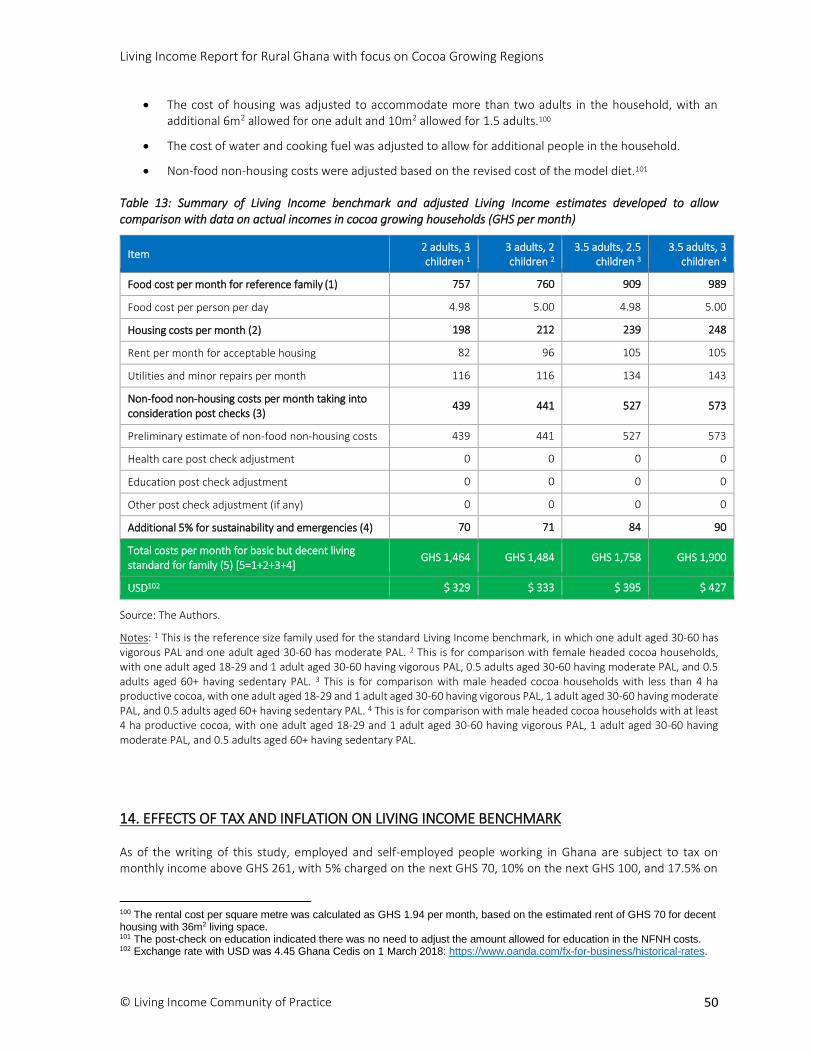
Living Income Report for Rural Ghana with focus on Cocoa Growing Regions
© Living Income Community of Practice
50
The cost of housing was adjusted to accommodate more than two adults in the household, with an additional 6m2 allowed for one adult and 10m2 allowed for 1.5 adults.100
The cost of water and cooking fuel was adjusted to allow for additional people in the household.
Non-food non-housing costs were adjusted based on the revised cost of the model diet.101
Table 13: Summary of Living Income benchmark and adjusted Living Income estimates developed to allow comparison with data on actual incomes in cocoa growing households (GHS per month)
Item 2 adults, 3 children 1
3 adults, 2 children 2
3.5 adults, 2.5 children 3
3.5 adults, 3 children 4
Food cost per month for reference family (1) 757 760 909 989
Food cost per person per day 4.98 5.00 4.98 5.00
Housing costs per month (2) 198 212 239 248
Rent per month for acceptable housing 82 96 105 105
Utilities and minor repairs per month 116 116 134 143
Non-food non-housing costs per month taking into consideration post checks (3)
439 441 527 573
Preliminary estimate of non-food non-housing costs 439 441 527 573
Health care post check adjustment 0 0 0 0
Education post check adjustment 0 0 0 0
Other post check adjustment (if any) 0 0 0 0
Additional 5% for sustainability and emergencies (4) 70 71 84 90
Total costs per month for basic but decent living standard for family (5) [5=1+2+3+4]
GHS 1,464 GHS 1,484 GHS 1,758 GHS 1,900
USD102 $ 329 $ 333 $ 395 $ 427
Source: The Authors.
Notes: 1 This is the reference size family used for the standard Living Income benchmark, in which one adult aged 30-60 has vigorous PAL and one adult aged 30-60 has moderate PAL. 2 This is for comparison with female headed cocoa households, with one adult aged 18-29 and 1 adult aged 30-60 having vigorous PAL, 0.5 adults aged 30-60 having moderate PAL, and 0.5 adults aged 60+ having sedentary PAL. 3 This is for comparison with male headed cocoa households with less than 4 ha productive cocoa, with one adult aged 18-29 and 1 adult aged 30-60 having vigorous PAL, 1 adult aged 30-60 having moderate PAL, and 0.5 adults aged 60+ having sedentary PAL. 4 This is for comparison with male headed cocoa households with at least 4 ha productive cocoa, with one adult aged 18-29 and 1 adult aged 30-60 having vigorous PAL, 1 adult aged 30-60 having moderate PAL, and 0.5 adults aged 60+ having sedentary PAL.
14. EFFECTS OF TAX AND INFLATION ON LIVING INCOME BENCHMARK
As of the writing of this study, employed and self-employed people working in Ghana are subject to tax on monthly income above GHS 261, with 5% charged on the next GHS 70, 10% on the next GHS 100, and 17.5% on
100 The rental cost per square metre was calculated as GHS 1.94 per month, based on the estimated rent of GHS 70 for decent housing with 36m2 living space. 101 The post-check on education indicated there was no need to adjust the amount allowed for education in the NFNH costs. 102 Exchange rate with USD was 4.45 Ghana Cedis on 1 March 2018: https://www.oanda.com/fx-for-business/historical-rates.
Living Income Report for Rural Ghana with focus on Cocoa Growing Regions
© Living Income Community of Practice
51
the next GHS 2,810. This means that on income of GHS 1,464 per month (our Living Income benchmark), tax of GHS 194 would, in theory, be payable. In practice, the vast majority of people in Ghana work in the informal economy103, including smallholder farmers, and have never been registered to pay income tax. In April 2018 the government introduced a new system requiring all citizens to register for a Tax Identification Number (TIN), in an effort to widen the tax base. Without a TIN, people are no longer able to open bank accounts, file a case in court, register land, or obtain a passport or driver's licence. Registration is free and it is reasonable to expect people on a Living Income to be registered. However, whether and when having a TIN translates into people in rural areas paying income tax is far from clear. Certainly it is unlikely in the near future, as it would require the introduction of some form of auditable accounts upon which the amount of taxable income is calculated. Given most people in our rural cocoa growing areas are self-employed and/or employed informally in small scale agriculture, and it is rare for small scale farmers to keep any of kind of accounts, we do not consider it likely that they will be subject to income tax in the near future. For cocoa farmers specifically, it can be argued that some tax is automatically deducted from the producer price set by the PPRC (see chapter 3.2). As such, no allowance has been made in the Living Income benchmark for paying income tax.
All Living Income benchmarks need to be periodically updated to account for inflation and ensure the
benchmark retains its purchasing power. The Anker methodology recommends that this be done annually,
using CPI, and more frequently in high inflation countries. Ghana has historically had high inflation, with the
annual rate averaging 17% from 1998 to 2017104. At the time of the study (March 2018) year on year inflation
stood at 10.4%, just above the Ankers' suggested marker of high inflation countries105. As such, it is
recommended that the Living Income benchmark be updated for inflation every six months, in September and
March each year.
103 According to the GLSS 6 Labour Force Report (GSS, 2014c), 88% of the working population is employed in the informal sector, which includes producers, wholesale and retail traders, and service providers made up of contributing family workers, casual wage workers, home-based workers and street vendors. 104 http://www.tradingeconomics.com/ghana/inflation-cpi. 105 See Anker and Anker (2017), section 20.2.
Living Income Report for Rural Ghana with focus on Cocoa Growing Regions
© Living Income Community of Practice
52
SECTION IV: ESTIMATING GAPS BETWEEN LIVING INCOME AND ACTUAL
INCOMES
15. COMPARISON OF PREVAILING INCOMES IN THE GHANA COCOA SECTOR WITH LIVING INCOME BENCHMARK
No new research on prevailing incomes in the Ghana cocoa sector was done by the study authors. Instead, as part of the funding for this Living Income benchmark study, GIZ funded the Suedwind Institute106 to review existing data on cocoa farmer incomes and costs of production. Suedwind found that the availability of information on cocoa farm income and farm economics is improving, but the data collected in surveys are in some cases unreliable and often not comparable.107 Various reasons for this are identified, including:
Weather: Data on yields collected in different years may differ significantly due to weather patterns.
Price and income: As cocoa prices fluctuate strongly, income data from one year are often not comparable with those from another year.
Book-keeping: Farmers often do not keep books, which affects the quality of data on production area, fertilizer and pesticide use, and labour inputs.
Inflation and conversion rate: High inflation makes it difficult to compare data collected in Ghanaian cedis in different years. Additionally, the cedi has lost significant value against the US dollar during recent years, so data converted into dollars might not accurately reflect the current situation of the cocoa growing families and are not comparable from one year to the next.
Definition of household: Survey vary in how they define households, particularly when it comes to 'cocoa farming households'. Some surveys only include data on farmers for which cocoa is the most important crop, while others include all farmers in the region suitable to grow cocoa, in which cocoa farmers may be the most important subgroup, but many farmers don’t grow cocoa at all or only grow it as a side crop.
Survey questions: The questions used to collect basic data often differ, which can lead to variation in results. For example, some surveys ask: “How many members does your household have?”, while others ask “How many people (or: how many family members) are presently living in your household?”. Similar issues occur with the way data on farm size is collected; some surveys ask: “What is the size of your farm?”, while others start with the question: “Do you know the size of your farm?” and then exclude in the next step all farmers who said they don’t know the size exactly and would obviously guess the figure. Furthermore, some surveys collect data on total farm size, others on the size of productive land, and yet others on fields used for cocoa (sometimes divided into fields in production and fields which have just been replanted).
Household selection: Many surveys focus on farmers who are part of a project run by a company and/or are certified and/or live in a specific region. Surveys commissioned by companies often report significantly higher average yields per hectare than other reports; one reason for this might be that farmers included in the survey have received more training, support to access inputs and finance, and other types of support than 'typical' cocoa farmers. Additionally, some projects choose to work only with farmers with larger plantations and/or already higher than average productivity.
The Royal Tropical Institute's (KIT) 2016/2017 baseline survey of cocoa farming households in Ghana and Côte d’Ivoire (for which the Suedwind Institute was an external partner) tried to avoid the shortcomings noted above. It involved a representative sample of 1,560 rural households in cocoa producing districts of Ashanti, Brong-
106 https://www.suedwind-institut.de/index.php/en/. 107 Huetz-Adams, 2018.
Living Income Report for Rural Ghana with focus on Cocoa Growing Regions
© Living Income Community of Practice
53
Ahafo, Central, Eastern and Western Regions. In addition, the raw data will be made public and thus can be checked more easily than other studies. The Steering Committee and coordinators of this Living Income study decided to contract KIT to use their data to attempt a comparison of actual incomes with the Living Income benchmark. They considered the KIT data to be the most robust, credible, open source data available to the sector for this exercise. Calculating actual household income is a complex task which requires consideration of the following:
Net income from focus crop (in this case cocoa);
Net income from other crops and livestock;
Value of self-consumed crop and livestock;
Net off farm income (e.g. from waged labour and small scale retail and trading activities);
In kind and other sources of income (e.g. remittances, government support, pensions).108
Just calculating net income from a single crop in theory involves consideration of inter alia: production area and volumes produced; volume and cost of inputs used (fertilizers, pesticides, biological controls, storage materials, etc.); amount and cost of hired labour; transport costs, including travel to and from the farm and transporting produce to market; investments in land and other productive resources, and depreciation rates; cost of insurance to protect farmers from the effects of weather and price fluctuation (or a margin to allow for sustainability of the enterprise in the event of such factors); and cost of finance.
In practice, most calculations of household income do not look at all these factors, due to the cost and complexity of doing so - especially given that most smallholder farmers in developing countries farm multiple crops simultaneously as well as having various sources of off farm income. KIT's survey is no exception, particularly as it was designed to answer several different research questions, not just to measure household income. The KIT team used the following approach to estimate total household income:
a) Total household production of cocoa in kgs was computed using only the households which reported knowing their own production figures (91% of cocoa producing households);
b) Total household production of cocoa was converted to value by applying a fixed price of GHS 6.64 per kg109;
c) Expenses were computed per input type (granular fertilizer, liquid fertilizer, herbicides, pesticides and fungicides) and per activity (cost of hired labour for land clearing, land preparation, planting, granular fertilizer application, liquid fertilizer application, manure/compost application, herbicide application, fungicide application, weeding, pruning, harvesting, pod breaking and transporting), imputing the group median values in case of missing observations where a household used an input or hired labour for an activity but didn’t know the amount used;
d) Production costs were subtracted from the value of sales to compute the net household income from cocoa;
e) Net household income from cocoa was extrapolated to total household income using the estimated contribution of cocoa sales to total household income110;
f) Total household income was adjusted for inflation to March 2018, to align with the Living Income benchmark.111
108 Shipman et al. (2016). 109 Derived from the reported price of GHS 425 per 64 kg bag. 110 i.e. If a respondent said 60% of household income was from cocoa, the net income from cocoa was divided by 60 and multiplied by 100 to arrive at the total household income. 111 Using the variation in the CPI (http://data.imf.org/regular.aspx?key=61545849): the reference period of the KIT study, (first quarter of 2016) was 197.77, and the CPI for the first quarter of 2018 (period of the Living Income Benchmark data collection) was 247.06, which implies an increase of almost 25% of the cost of living.

Living Income Report for Rural Ghana with focus on Cocoa Growing Regions
© Living Income Community of Practice
54
One limitation of this approach is that the value of production for home consumption is not included in household income, due to the complexity of calculating accurate values112. Since cocoa farmers produce a significant percentage of their own food, this is an important omission. Having said that, the types of foods they produce do not include many of the higher value items in the model diet, such as rice, bread, milk, fish, sugar and Milo. Furthermore, cocoa farmers interviewed for the Living Income study indicated that they purchase a percentage of almost all food items, including those commonly produced on their farms, at certain times of the year. As such, the overall effect on household income may be relatively limited. Another issue is the fact total household income is computed using respondents' estimates of the share of their total income which comes from cocoa. It is not clear how well cocoa farming households understand their net income from different sources, and as such, how accurate their estimates are. On the cost side there are various expenses which are not taken into account, such as capital outlays for farm equipment and land, full transport-related costs (e.g. getting to and from the farm), and a margin for sustainability. These limitations should be borne in mind when reading the results presented below.
Table 14 summarizes the findings of KIT's analysis, grouping cocoa growing households into the three categories: (i) female headed households; (ii) 'typical' male headed households with less than 4 hectares of productive cocoa; (iii) 'large' male headed households with at least 4 hectares of productive cocoa. KIT calculated the average income for typical cocoa farming households to be GHS 10,180 ($2,288) per year113, or GHS 848 ($191) per month. This is 48% of the adjusted Living Income benchmark of GHS 1,758 ($395) for that group114. Female headed households have a lower average income of GHS 7,794 ($1,752) per year, or GHS 650 ($146) per month, which equates to 44% of the adjusted Living Income benchmark of GHS 1,484 ($333)115. The average income of large male headed households is GHS 22,714 ($5,104), or GHS 1,893 ($425) per month, which is very close to the adjusted Living Income benchmark of GHS 1,900 ($427) per month. These gaps between average annual incomes and the adjusted benchmarks (converted to annual values) are depicted in Figure 14.
Table 14: Estimate of average prevailing incomes in different categories of cocoa growing household, and gap between average incomes and adjusted Living Income estimates
Female headed
households
Typical male headed households
(< 4ha cocoa)
Large male headed households (≥4ha
cocoa)
Productive land (ha/household) 2.2 1.9 6.3
Total cocoa production (kg/year/household) 748 840 2,096
Cocoa yield (kg/ha) 338 438 331
Price (USD/kg) 1.86 1.86 1.86
Value of production (USD/year/household) 1,394 1,566 3,907
Input costs (USD/year/household) 68 86 215
Hired labour costs (USD/year/household) 351 160 501
Total costs (USD/year/household) 419 243 709
Net income from cocoa (USD/year/household) 1,032 1,317 3,089
Share of cocoa in household income (%) 62% 60% 65%
Total annual income (USD/year/household) 1,752 2,288 5,104
Total monthly income (USD/household) 146 191 425
112 See Tyszler, Bymolt and Laven (2018) for a full discussion on the complexity of valuing production for home consumption, and their very rough estimate based on the limited information they were able to collect. 113 Adjusted for inflation to March 2018. 114 Based on an average household with 3.5 adults and 2.5 children. 115 Based on an average household with 3 adults and 2 children.
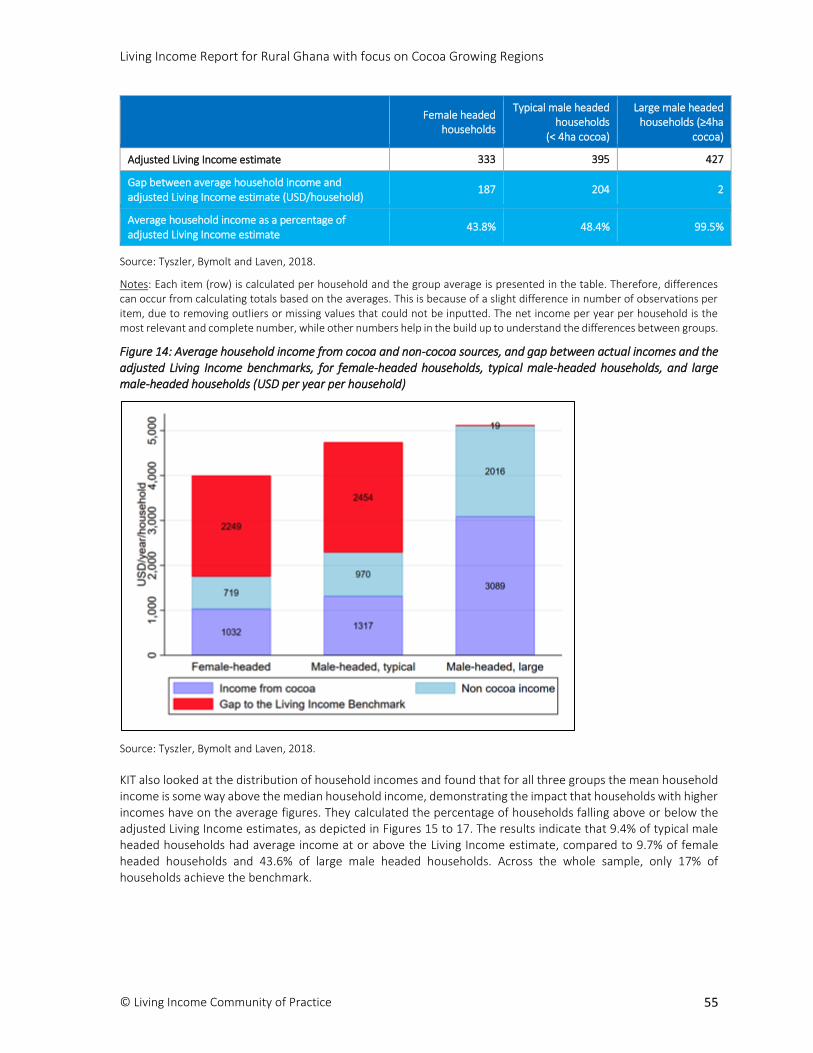
Living Income Report for Rural Ghana with focus on Cocoa Growing Regions
© Living Income Community of Practice
55
Female headed
households
Typical male headed households
(< 4ha cocoa)
Large male headed households (≥4ha
cocoa)
Adjusted Living Income estimate 333 395 427
Gap between average household income and adjusted Living Income estimate (USD/household)
187 204 2
Average household income as a percentage of adjusted Living Income estimate
43.8% 48.4% 99.5%
Source: Tyszler, Bymolt and Laven, 2018.
Notes: Each item (row) is calculated per household and the group average is presented in the table. Therefore, differences can occur from calculating totals based on the averages. This is because of a slight difference in number of observations per item, due to removing outliers or missing values that could not be inputted. The net income per year per household is the most relevant and complete number, while other numbers help in the build up to understand the differences between groups.
Figure 14: Average household income from cocoa and non-cocoa sources, and gap between actual incomes and the adjusted Living Income benchmarks, for female-headed households, typical male-headed households, and large male-headed households (USD per year per household)
Source: Tyszler, Bymolt and Laven, 2018.
KIT also looked at the distribution of household incomes and found that for all three groups the mean household income is some way above the median household income, demonstrating the impact that households with higher incomes have on the average figures. They calculated the percentage of households falling above or below the adjusted Living Income estimates, as depicted in Figures 15 to 17. The results indicate that 9.4% of typical male headed households had average income at or above the Living Income estimate, compared to 9.7% of female headed households and 43.6% of large male headed households. Across the whole sample, only 17% of households achieve the benchmark.
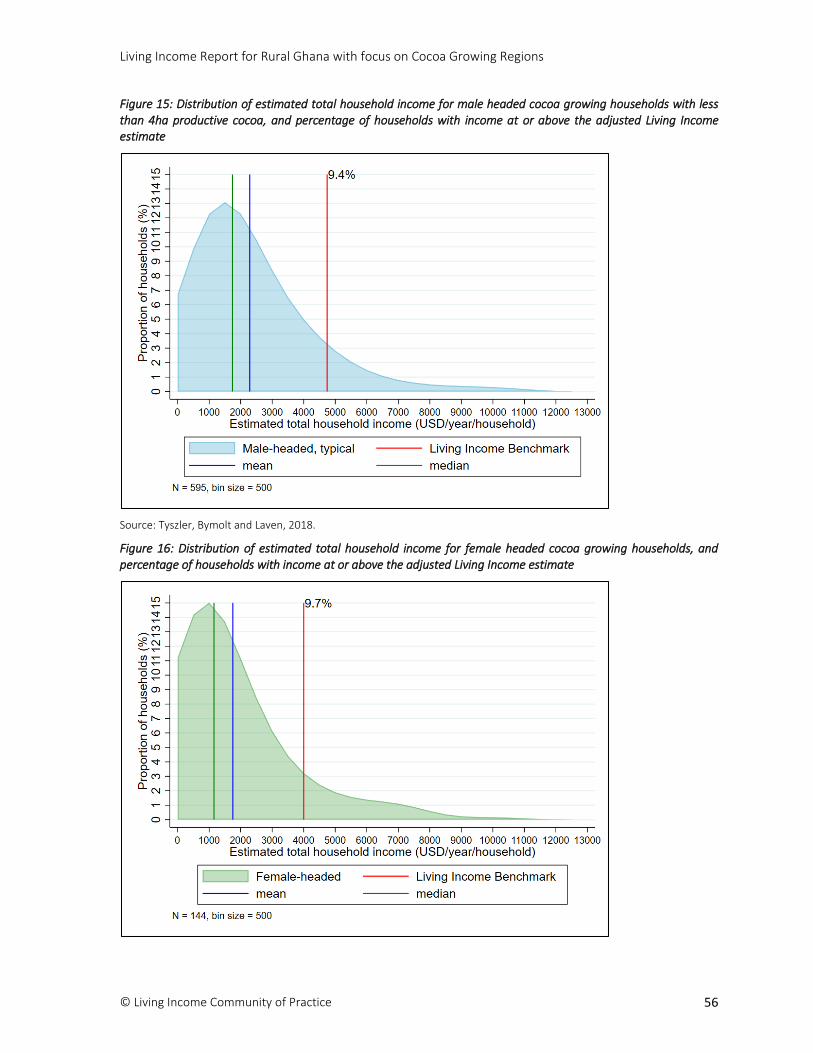
Living Income Report for Rural Ghana with focus on Cocoa Growing Regions
© Living Income Community of Practice
56
Figure 15: Distribution of estimated total household income for male headed cocoa growing households with less than 4ha productive cocoa, and percentage of households with income at or above the adjusted Living Income estimate
Source: Tyszler, Bymolt and Laven, 2018.
Figure 16: Distribution of estimated total household income for female headed cocoa growing households, and percentage of households with income at or above the adjusted Living Income estimate
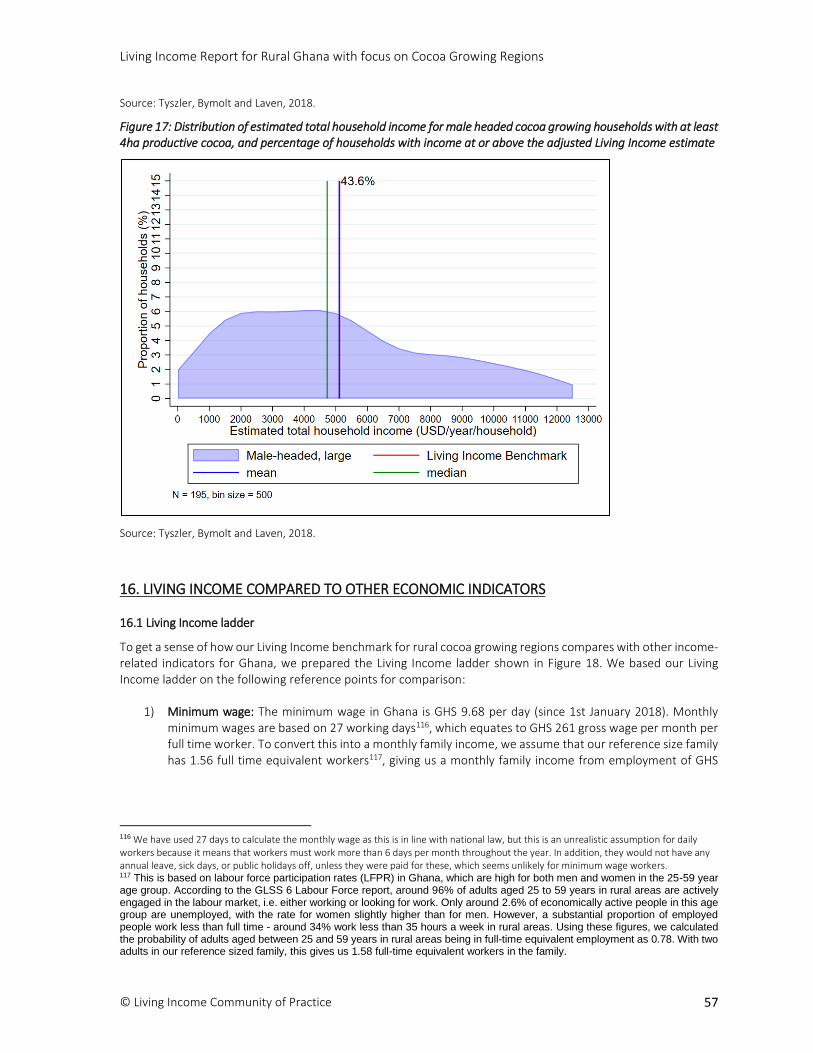
Living Income Report for Rural Ghana with focus on Cocoa Growing Regions
© Living Income Community of Practice
57
Source: Tyszler, Bymolt and Laven, 2018.
Figure 17: Distribution of estimated total household income for male headed cocoa growing households with at least 4ha productive cocoa, and percentage of households with income at or above the adjusted Living Income estimate
Source: Tyszler, Bymolt and Laven, 2018.
16. LIVING INCOME COMPARED TO OTHER ECONOMIC INDICATORS
16.1 Living Income ladder
To get a sense of how our Living Income benchmark for rural cocoa growing regions compares with other income-related indicators for Ghana, we prepared the Living Income ladder shown in Figure 18. We based our Living Income ladder on the following reference points for comparison:
1) Minimum wage: The minimum wage in Ghana is GHS 9.68 per day (since 1st January 2018). Monthly minimum wages are based on 27 working days116, which equates to GHS 261 gross wage per month per full time worker. To convert this into a monthly family income, we assume that our reference size family has 1.56 full time equivalent workers117, giving us a monthly family income from employment of GHS
116 We have used 27 days to calculate the monthly wage as this is in line with national law, but this is an unrealistic assumption for daily workers because it means that workers must work more than 6 days per month throughout the year. In addition, they would not have any annual leave, sick days, or public holidays off, unless they were paid for these, which seems unlikely for minimum wage workers. 117 This is based on labour force participation rates (LFPR) in Ghana, which are high for both men and women in the 25-59 year age group. According to the GLSS 6 Labour Force report, around 96% of adults aged 25 to 59 years in rural areas are actively engaged in the labour market, i.e. either working or looking for work. Only around 2.6% of economically active people in this age group are unemployed, with the rate for women slightly higher than for men. However, a substantial proportion of employed people work less than full time - around 34% work less than 35 hours a week in rural areas. Using these figures, we calculated the probability of adults aged between 25 and 59 years in rural areas being in full-time equivalent employment as 0.78. With two adults in our reference sized family, this gives us 1.58 full-time equivalent workers in the family.

Living Income Report for Rural Ghana with focus on Cocoa Growing Regions
© Living Income Community of Practice
58
408. This is an extremely low income which, as we can see from the national poverty lines below, would not even allow people to meet their basic food needs.
2) National poverty lines: Ghana uses two poverty lines: an upper one, below which an individual is considered to be unable to meet all their food and non-food needs, and a lower poverty line, below which an individual is considered unable to even meet their food needs.118 The upper poverty line was set at GHS 1,314 per adult male equivalent119 per year for 2013, and households below this level are referred to as living in poverty. The lower poverty line was set at GHS 792 per adult male equivalent per year, and households below this level are referred to as living in extreme poverty.
To make a comparison with the Living Income, we need to convert the poverty lines into monthly family income by multiplying by the number of adult (male) equivalents in our reference family size120 and dividing by 12 months. This gives an upper poverty line family income of GHS 427 per month, and a lower poverty line family income of GHS 257 per month, in 2013. Adjusting for inflation to our study month121, this gives an upper poverty line monthly family income of GHS 853 and lower poverty line monthly family income of GHS 513 in March 2018.
3) World Bank poverty lines: The World Bank uses $1.90 PPP122 per person per day as its international poverty line, and $3.20 PPP per person per day as its poverty line for lower middle income countries (which includes Ghana). The latest implied PPP conversion factor for Ghana is 1.55123 which gives an international poverty line of GHS 2.95 per person day, and a lower middle income country poverty line of GHS 4.96 per person per day. Converting this into monthly income for a family of 5, this equates to an international poverty line income of GHS 449 per month, and a lower middle income country poverty line of GHS 754 per month.
4) Average earnings for skilled agricultural and fishery workers: The GLSS 6 Labour Force Report124 provides data on average monthly earnings for different occupations, including both cash and in-kind earnings (but excluding other forms of household income). For the category 'skilled agricultural and fishery workers'125 average monthly earnings were GHS 263 in 2012/2013 when data were collected, with earnings substantially higher for men at GHS 346 compared to GHS 127 for women126. Taking into account inflation since 2012/2013, this would be equivalent to average earnings of GHS 525 per month in March 2018. This is the average across men and women working different numbers of hours per week, with the majority working fewer than 40 hours a week. To convert these figures into family income, we
118 Cooke et al. (2016). 119 The number of adult male equivalents used to calculate national poverty lines uses household composition data and a calorie-based scale which recognizes that adult women, babies and young children require fewer calories than adult men (GSS, 2014). The adult male equivalent ratio for adult women is 0.77. The average adult male equivalent ratio for children aged 0 to 17 is 0.71. 120 Our reference family size equates to 3.9 adult male equivalents ((0.71 x 3 children) + 0.77 female adult + 1 male adult). 121 We assume 5 years of inflation since the GLSS 6 survey took place, and used annual CPI inflation rates for 2013 to 2017 to calculate the March 2018 values. Inflation rates were sourced from the IMF's DataMapper (http://www.imf.org/external/datamapper/PCPIPCH@WEO/GHA), which gave rates of 11.7% for 2013, 15.5% for 2014, 17.2% for 2015, 17.5% for 2016, and 12.4% for 2017. 122 PPP stands for Purchasing Power Parity, which is an economic measure used for comparing the real value of money between countries. The World Bank poverty lines are expressed in $ PPP to allow for comparison between countries - the international poverty line of $1.90 PPP is the international equivalent of what $1.90 would buy in the United States in 2011. 123 The most recent official World Bank PPP conversion factor for Ghana was 1.43 for 2016 (http://data.worldbank.org/indicator/PA.NUS.PRVT.PP?locations=GH). Adjusting for inflation in Ghana and the United States (comparator country), this gives an implied PPP of 1.55 for December 2017 (https://www.quandl.com/data/ODA/GHA_PPPEX-Ghana-
Implied-PPP-Conversion-Rate-LCU-per-USD). 124 GSS 2014c. 125 The ILO definition of this occupational category can be found here: http://www.ilo.org/public/english/bureau/stat/isco/isco88/6.htm. It includes market-oriented agricultural workers and subsistence farmers, but does not include agricultural labourers or helpers who perform simple and routine tasks which require little or no prior experience. 126 This is likely to be related to women doing fewer hours of paid work as skilled agricultural or fisheries workers (on average), but gender discrimination in pay may also be a factor.
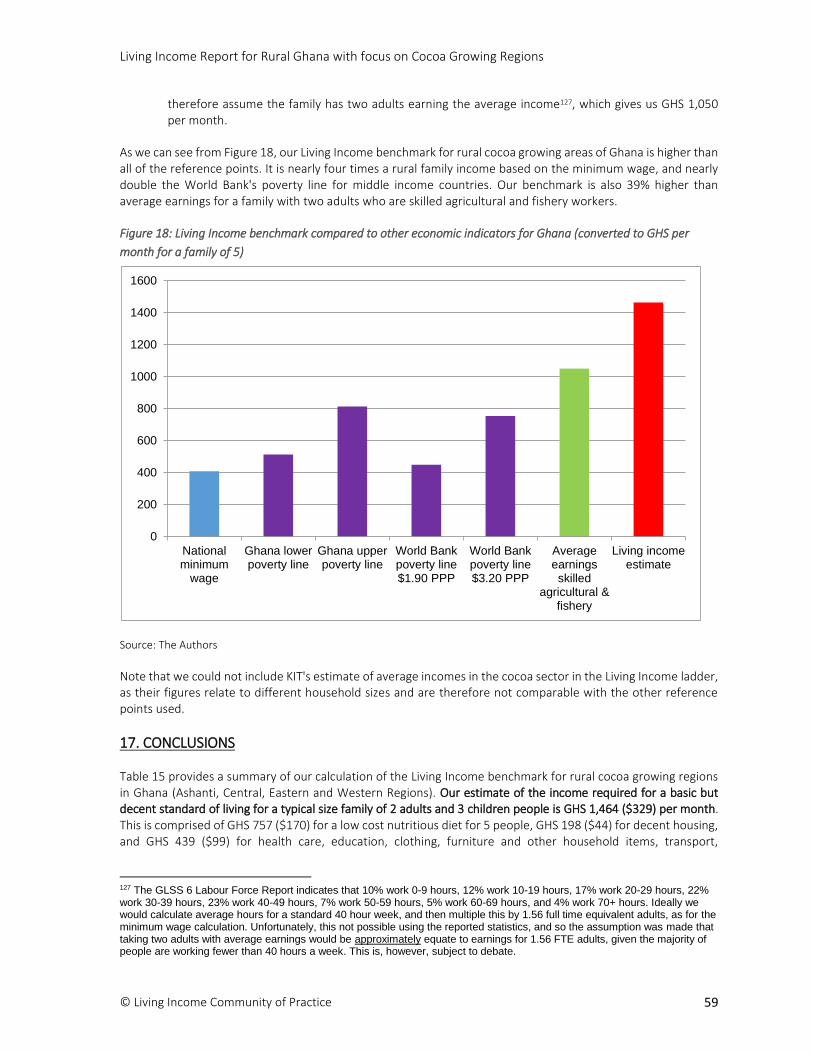
Living Income Report for Rural Ghana with focus on Cocoa Growing Regions
© Living Income Community of Practice
59
therefore assume the family has two adults earning the average income127, which gives us GHS 1,050 per month.
As we can see from Figure 18, our Living Income benchmark for rural cocoa growing areas of Ghana is higher than all of the reference points. It is nearly four times a rural family income based on the minimum wage, and nearly double the World Bank's poverty line for middle income countries. Our benchmark is also 39% higher than average earnings for a family with two adults who are skilled agricultural and fishery workers.
Figure 18: Living Income benchmark compared to other economic indicators for Ghana (converted to GHS per
month for a family of 5)
Source: The Authors
Note that we could not include KIT's estimate of average incomes in the cocoa sector in the Living Income ladder, as their figures relate to different household sizes and are therefore not comparable with the other reference points used.
17. CONCLUSIONS
Table 15 provides a summary of our calculation of the Living Income benchmark for rural cocoa growing regions in Ghana (Ashanti, Central, Eastern and Western Regions). Our estimate of the income required for a basic but decent standard of living for a typical size family of 2 adults and 3 children people is GHS 1,464 ($329) per month. This is comprised of GHS 757 ($170) for a low cost nutritious diet for 5 people, GHS 198 ($44) for decent housing, and GHS 439 ($99) for health care, education, clothing, furniture and other household items, transport,
127 The GLSS 6 Labour Force Report indicates that 10% work 0-9 hours, 12% work 10-19 hours, 17% work 20-29 hours, 22% work 30-39 hours, 23% work 40-49 hours, 7% work 50-59 hours, 5% work 60-69 hours, and 4% work 70+ hours. Ideally we would calculate average hours for a standard 40 hour week, and then multiple this by 1.56 full time equivalent adults, as for the minimum wage calculation. Unfortunately, this not possible using the reported statistics, and so the assumption was made that taking two adults with average earnings would be approximately equate to earnings for 1.56 FTE adults, given the majority of people are working fewer than 40 hours a week. This is, however, subject to debate.
0
200
400
600
800
1000
1200
1400
1600
Nationalminimum
wage
Ghana lowerpoverty line
Ghana upperpoverty line
World Bankpoverty line$1.90 PPP
World Bankpoverty line$3.20 PPP
Averageearningsskilled
agricultural &fishery
Living incomeestimate
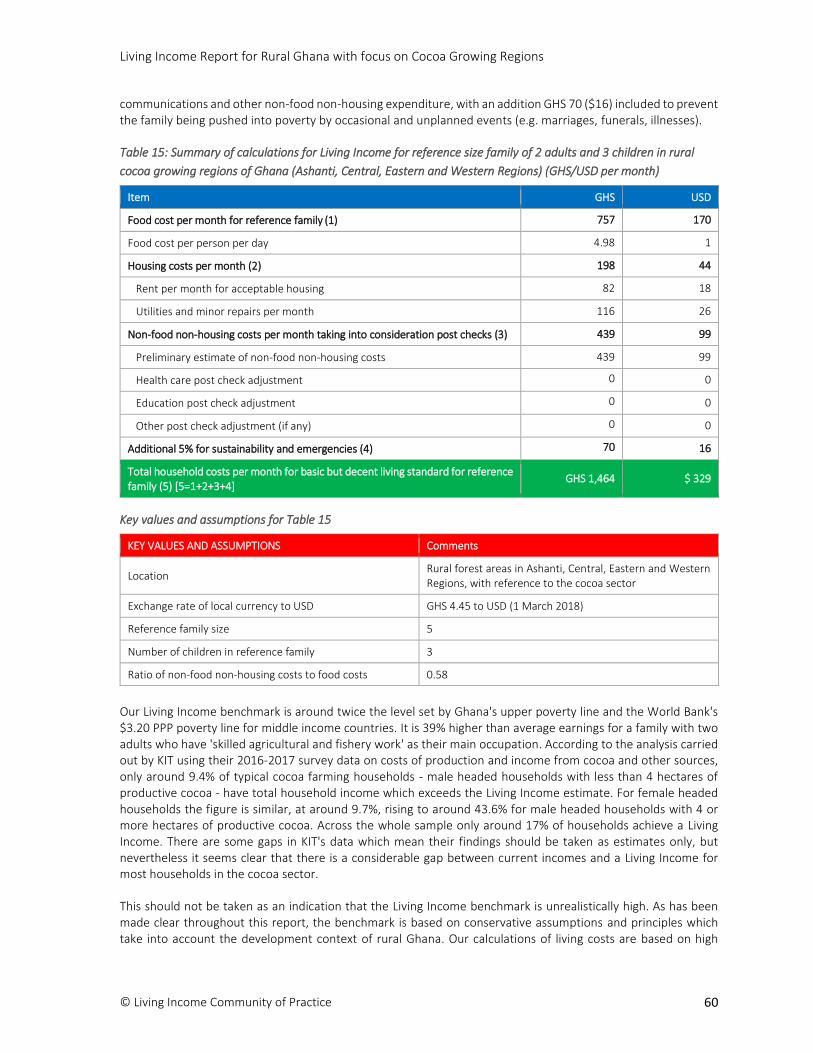
Living Income Report for Rural Ghana with focus on Cocoa Growing Regions
© Living Income Community of Practice
60
communications and other non-food non-housing expenditure, with an addition GHS 70 ($16) included to prevent the family being pushed into poverty by occasional and unplanned events (e.g. marriages, funerals, illnesses).
Table 15: Summary of calculations for Living Income for reference size family of 2 adults and 3 children in rural
cocoa growing regions of Ghana (Ashanti, Central, Eastern and Western Regions) (GHS/USD per month)
Item GHS USD
Food cost per month for reference family (1) 757 170
Food cost per person per day 4.98 1
Housing costs per month (2) 198 44
Rent per month for acceptable housing 82 18
Utilities and minor repairs per month 116 26
Non-food non-housing costs per month taking into consideration post checks (3) 439 99
Preliminary estimate of non-food non-housing costs 439 99
Health care post check adjustment 0 0
Education post check adjustment 0 0
Other post check adjustment (if any) 0 0
Additional 5% for sustainability and emergencies (4) 70 16
Total household costs per month for basic but decent living standard for reference family (5) [5=1+2+3+4]
GHS 1,464 $ 329
Key values and assumptions for Table 15
KEY VALUES AND ASSUMPTIONS Comments
Location Rural forest areas in Ashanti, Central, Eastern and Western Regions, with reference to the cocoa sector
Exchange rate of local currency to USD GHS 4.45 to USD (1 March 2018)
Reference family size 5
Number of children in reference family 3
Ratio of non-food non-housing costs to food costs 0.58
Our Living Income benchmark is around twice the level set by Ghana's upper poverty line and the World Bank's $3.20 PPP poverty line for middle income countries. It is 39% higher than average earnings for a family with two adults who have 'skilled agricultural and fishery work' as their main occupation. According to the analysis carried out by KIT using their 2016-2017 survey data on costs of production and income from cocoa and other sources, only around 9.4% of typical cocoa farming households - male headed households with less than 4 hectares of productive cocoa - have total household income which exceeds the Living Income estimate. For female headed households the figure is similar, at around 9.7%, rising to around 43.6% for male headed households with 4 or more hectares of productive cocoa. Across the whole sample only around 17% of households achieve a Living Income. There are some gaps in KIT's data which mean their findings should be taken as estimates only, but nevertheless it seems clear that there is a considerable gap between current incomes and a Living Income for most households in the cocoa sector.
This should not be taken as an indication that the Living Income benchmark is unrealistically high. As has been made clear throughout this report, the benchmark is based on conservative assumptions and principles which take into account the development context of rural Ghana. Our calculations of living costs are based on high
Living Income Report for Rural Ghana with focus on Cocoa Growing Regions
© Living Income Community of Practice
61
quality national statistics, combined with information gathered locally from food sellers, school officials, health care workers, and other members of the communities where cocoa farmers live. We allow for a healthy but low cost diet using the kinds of foods farming households already eat, with 44% of calories coming from maize and cassava. We allow for only two servings of fresh meat or fish a week, with dried, salted or smoked fish on other days, and other protein coming from low cost sources such as beans and groundnuts. Our local standard for decent housing allows shared use of toilets and piped water with other households, and includes covered porches in the calculation of living space in recognition that living space is at a premium in Ghana. We also assume cocoa farmers send their children to state schools not private schools, and that most family members are covered by the national health insurance scheme. As such, our Living Income benchmark is for a basic but decent standard of living in cocoa growing areas, but meets internationally agreed standards of decency.
Closing the gap between current incomes and the Living Income benchmark is not the sole responsibility of any one actor, but requires action by all stakeholders in the Ghana cocoa sector. This includes cocoa farmers and their communities; traders, processors, manufacturers, brands and retailers; COCOBOD and the government of Ghana; input and service providers; and sustainability standards and civil society organizations. Yields are still relatively low for the majority of cocoa farmers, so measures aimed at improving productivity (e.g. fertilizer subsidies, hybrid clone distribution, technical assistance) should be continued. However, the risk of structural over-production needs to be addressed both nationally and globally - so far Ghana has kept the producer price fairly stable, but downward pressure on export prices is making this increasingly difficult. At the same time, there is a need to understand, and to factor in to consumer and commodity prices, the full costs of sustainable cocoa production, including social and environmental costs. This includes paying attention to the cost and productivity of hired labour, especially given workers should also be earning a Living Wage but are unlikely to be doing so currently.128 It is also important to tackle other constraints to a decent standard of living for cocoa farming households, such as the lack of availability of quality housing and schools in rural Ghana, inadequate access to social protection and insurance to protect farming families from fluctuations in income, socio-cultural norms which create pressure to spend large amounts on things like funerals, and poor understanding among farmers of costs of production and how to manage household income. It is therefore encouraging to see increasing collaboration in the Ghana cocoa sector, including as part of the Living Income Community of Practice and in commissioning this Living Income benchmark study. Our hope and expectation is that the benchmark will provide stakeholders with greater clarity on what remains to be done and how progress along the way can be measured.
128 KIT's data suggest hired labour earn around $5 to $7 per day, depending on the type of work, which equates to between $104 and $146 per month (based on working 5 days a week for 50 weeks of the year). Note that this is a very rough estimate, not taking into account working hours, payments in kind, tax and other deductions, etc. Assuming 1.56 full time equivalent adults in the household, this equates to a typical family income of approximately $162 to $228 per month. This is considerably below the Living Income benchmark of $329 per month. This implies that the gap to a Living Income for cocoa farmers where Living Wages for workers are also considered will likely be considerably larger.

Living Income Report for Rural Ghana with focus on Cocoa Growing Regions
© Living Income Community of Practice
62
REFERENCES
Agyepong, I., Abankwah, D., Abroso, A., Chun, C., Dodoo, J., Lee, S., Mensah, S., Musah, M., Twum, A., Oh, J.,
Park, J., Yang, D., Yoon, K., Otoo, N., and Asenso-Boadi, F. (2016). The “Universal” in UHC and Ghana’s
National Health Insurance Scheme: policy and implementation challenges and dilemmas of a lower
middle income country. BMC Health Services Research, 16:504:
https://bmchealthservres.biomedcentral.com/articles/10.1186/s12913-016-1758-y.
Anker, R. and Anker, M. (2017). Living wages around the world: Manual for measurement. Edward Elgar,
London: http://www.e-elgar.com/shop/living-wages-around-the-world.
Anker, R. (2011a). Estimating a Living Wage: A methodological review. Conditions of work and employment
series, No 29. ILO, Geneva.
Anker, R. (2011b). Engel’s law around the world: 150 years later. Working Paper Series 247. Political Economy
Research Institute, University of Massachusetts, Amherst.
Anker, R (2006a). Living wages around the world: A new methodology and internationally comparable
estimates. International Labour Review, 145 (4).
Anker, R. (2006b). Poverty lines around the world: A new methodology and internationally comparable
estimates. International Labour Review, 145 (4).
Bymolt, R.. Laven, A., and Tyszler, M. (2018). Demystifying the cocoa sector in Ghana and Côte d’Ivoire. The Royal
Tropical Institute (KIT), The Netherlands.
Cooke, E., Hague, S., and McKay, A. (2016). The Ghana Poverty and Inequality Report. ASHASI, UNICEF, University
of Sussex:
https://www.unicef.org/ghana/Ghana_Poverty_and_Inequality_Analysis_FINAL_Match_2016(1).pdf.
Food and Agriculture Organization (2009). Nutrition Country Profile, Republic of Ghana:
ftp://ftp.fao.org/ag/agn/nutrition/ncp/gha.pdf.
Food and Agriculture Organization (2012). West African Food Composition Table:
http://www.fao.org/documents/card/en/c/238ce5e9-acd5-5cb2-8442-6498506aee1c/.
Fountain, A. and Huetz-Adams, F. (2018). Cocoa Barometer 2018.
http://www.cocoabarometer.org/Cocoa_Barometer/Home.html.
Frimpong, S. (2013). Urbanization and Pattern of Urban Food Consumption in Ashanti Region, Ghana:
Implications for Food Security. Journal of Economics and Sustainable Development, 4 (9):
http://iiste.org/Journals/index.php/JEDS/article/view/6487.
Ghana Ministry of Education (2015a). Report on Basic Statistics and Planning Parameters for Basic Education in
Ghana 2014/2015:
http://www.moe.gov.gh/emis/EMIS%20BASIC%20EDUCATION%20DATA/Basic/2014-
2015/Basic%20Report%202014-2015%20No.1.pdf.
Ghana Ministry of Education (2015b). Report on Basic Statistics and Planning Parameters for Senior High Schools
in Ghana 2014/2015:
http://www.moe.gov.gh/emis/EMIS%20BASIC%20EDUCATION%20DATA/Secondary/2014-
2015/SHS%20Report%202014-2015%20No.1.pdf.
Ghana Ministry of Health (2009). Dietary and Physical Activity Guidelines for Ghana:
http://rhnp.gov.gh/admindox/DIETARY%20AND%20PHYSICAL%20ACTIVITY%20GUIDELINES%20FOR%2
0GHANA%20Final%20draft%202_akdits%20(2)_5Feb10[1][1].pdf.
Ghana Ministry of Water Resources, Works and Housing (2015). National Housing Policy:
http://www.mwrwh.gov.gh/index.php/publications/category/13-publications.
Ghana Statistical Service (2011). Ghana Multiple Indicator Cluster Survey with an enhanced Malaria Module and
Biomarker: https://www.unicef.org/ghana/Ghana_MICS_Final.pdf
Living Income Report for Rural Ghana with focus on Cocoa Growing Regions
© Living Income Community of Practice
63
Ghana Statistical Service (2013). 2010 Population and Housing Census, National Analytical Report:
http://www.statsghana.gov.gh/docfiles/2010phc/National_Analytical_Report.pdf.
Ghana Statistical Service (2014a). Poverty Profile in Ghana (2005 - 2013):
http://www.statsghana.gov.gh/docfiles/glss6/GLSS6_Poverty%20Profile%20in%20Ghana.pdf
Ghana Statistical Service (2014b). Ghana Living Standards Survey Round 6 (GLSS 6), Main Report:
http://www.statsghana.gov.gh/glss6.html.
Ghana Statistical Service (2014c). Ghana Living Standards Survey Round 6 (GLSS 6), Labour Force Report:
http://www.statsghana.gov.gh/docfiles/glss6/GLSS6_Labour%20Force%20Report.pdfl.
Ghana Statistical Service (2015). Ghana Poverty Mapping Report:
http://www.statsghana.gov.gh/docfiles/publications/POVERTY%20MAP%20FOR%20GHANA-
05102015.pdf
Ghana Statistical Service, Ghana Health Service, and The DHS Program (ICF International) (2015). Ghana
Demographic and Health Survey 2014: https://dhsprogram.com/pubs/pdf/FR307/FR307.pdf.
Gilbert, C., Christiaensen, L. and Kaminski, J. (2016). Price seasonality in Africa: Measurement and extent. Policy
Research Working Paper 7539. World Bank Group, Africa Region:
http://documents.worldbank.org/curated/en/498741467998767669/pdf/WPS7539.pdf.
Grillo, J. (2018). From Living Wage to Living Income. Considerations for the use of the Anker methodology and
Living Wage data to inform Living Income estimates. ISEAL Alliance.
Huetz-Adams, F. (2018). Cocoa farming households: Compilation of data on household composition, agricultural
resources, cost structures and income. The Suedwind Institute, Bonn.
Kolavalli, S. and Vigneri, M. (2018). Growth through pricing policy: the case of cocoa in Ghana. FAO, Rome.
http://www.fao.org/3/I8329EN/i8329en.pdf.
Osei-Asare, Y. B. (2013). The effects of food price increases on urban household food commodities expenditures
in Ghana. Journal of Economics and Sustainable Development, 4 (6):
http://www.iiste.org/Journals/index.php/JEDS/article/viewFile/5225/11059.
National Development Planning Commission and United Nations Development Programme (2015). Ghana
Millennium Development Goals 2015 Report:
http://www.gh.undp.org/content/dam/ghana/docs/Doc/Inclgro/UNDP_GH_2015%20Ghana%20MDGs
%20Report.pdf.
Nti, C. (2008). Household dietary practices and family nutritional status in rural Ghana. Nutrition Research and
Practice, 2 (1), 35-40: https://www.ncbi.nlm.nih.gov/pmc/articles/PMC2815306/.
Schreyer, F., Bunn, C. and Castro, F. (2018). The economic case for climate action in West African cocoa production. International Center for Tropical Agriculture (CIAT), Cali, Colombia.
Shipman, E., Soto, G., Mullen, J., Gonzalez, M., and Daniels, S. (2016). Measuring smallholder incomes: Towards
better alignment and reporting of farm economic metrics. A joint guidance document of the Committee
on Sustainability Assessment (COSA), the ISEAL Alliance, and the Sustainable Food Lab. Version 1.0.
http://sustainablefoodlab.org/wp-content/uploads/2015/12/Guidance.Farm-economics-
metrics.Nov2016.pdf.
Subramanian, S. V.; Özaltin, E.; Finlay, J. E. (2011). Height of Nations: A Socioeconomic Analysis of Cohort
Differences and Patterns among Women in 54 Low- to Middle-Income Countries. Public Library of
Science, 6 (4).
UNESCO (2015). Education for All 2015 National Review: Ghana:
http://unesdoc.unesco.org/images/0023/002314/231429e.pdf.
UN-Habitat (2011). Ghana Housing Profile: https://unhabitat.org/books/ghana-housing-profile/.
World Health Organization (2006). Fuel for life: Housing energy and health:
http://www.who.int/indoorair/publications/fuelforlife/en/.
http://sustainablefoodlab.org/wp-content/uploads/2015/12/Guidance.Farm-economics-metrics.Nov2016.pdf
Living Income Report for Rural Ghana with focus on Cocoa Growing Regions
© Living Income Community of Practice
64
World Health Organization (2015), Ghana: WHO statistical profile:
http://www.who.int/gho/countries/gha.pdf?ua=1.