Livia Chi - National Bureau of Economic Research first envisaged by Garber (1999, 2010). 2 See...
44
Livia Chi © 2014 by Barry Eichengreen, Arnaud J. Mehl, Livia Chi
-
Upload
duongthuan -
Category
Documents
-
view
218 -
download
0
Transcript of Livia Chi - National Bureau of Economic Research first envisaged by Garber (1999, 2010). 2 See...

Livia Chi
© 2014 by Barry Eichengreen, Arnaud J. Mehl, Livia Chi

Barry Eichengreen, Arnaud J. Mehl, Livia Chi
ABSTRACT
Livia Chi

2
1. Introduction
The European debt crisis has triggered impassioned debate over the heretofore
abstruse issue of “TARGET2 imbalances”. The controversy has sparked disagreement
in academic and policy circles alike. It is not too strong to say that it has fed doubts
about the very viability of Europe’s monetary union.
The imbalances in question emerge from the interaction of cross-border
payment transactions and central bank operations in the euro area’s real-time gross
settlement system, TARGET2.1 As the crisis intensified in late 2009, banks in the
countries of the euro area “periphery” experienced capital outflows, including to so-
called “core” euro area countries. Unable to finance those outflows on private
markets, they obtained it instead through the Eurosystem (Lane and Milesi-Ferretti,
2012).2 Their banks turned to euro area national central banks for funding against
collateral. Their national central banks thus accumulated TARGET2 liabilities, while
central banks in other euro area countries acquired corresponding TARGET2 claims.
There are two interpretations of this increase in TARGET2 balances. One is
that TARGET2 balances simply reflect the European Central Bank’s intermediating
role, are as secure as any domestic claim, and are integral to the smooth functioning
of a monetary union in which €1 deposited at a central bank in one euro area country
equals €1 deposited at a central bank in another euro area country (Cour-Thimann,
2013).3 The opposing view is that TARGET2 imbalances are bailouts of stressed euro
area banks and sovereigns, create the risk of taxpayer losses for the “core” countries,
and are indicative of convertibility risk within the euro area (see e.g. Cecchetti,
McKinley and McGuire, 2012; Sinn, 2012a, 2012b and 2012c; Sinn and
Wollmershäuser, 2012; Tornell, 2012). The collateral, in other words, is worth less
than meets the eye.4
1 TARGET2 stands for “Trans-European Automated Real-time Gross settlement Express Transfer system”. Euro area national central banks offer payment and settlement services in central bank money through TARGET2 to banks via the latter’s accounts at their respective national central banks (see ECB, 2011, for further details). TARGET2 has the advantage of offering a centrally-cleared trading platform for borrowing and lending in central bank liquidity, unlike euro area money markets which remain largely over-the-counter. The possibility that Target imbalances could widen seems to have been first envisaged by Garber (1999, 2010). 2 See Milesi-Ferretti and Tille (2011) and Lane (2013) for evidence that euro area money market significantly re-segmented along national borders in the wake of the crisis and contributed to the widening of TARGET2 balances. For the US, there is evidence that US Fed fund markets during the financial crisis were “stressed, but not frozen” (Afonso, Kovner and Schoar, 2011). 3 TARGET2 claims are akin to claims on domestic banks. They too arise from liquidity-provision operations, albeit conducted by the national central bank of another euro area country. 4 On the controversy, see inter alia Auer (2014), Bindseil and König (2011), Bindseil and Winkler, (2012), Bindseil, Cour-Thimann and König (2012), Buiter, Rahbari and Michels (2011), Cour-Thimann (2013), De Grauwe and Ji (2012), Mody and Bornhorst (2012), Pesenti (2012), Thimann (2013) and Whelan (2014). The risk exposure of the euro area national central banks derives from the conduct of monetary policy operations, not the corresponding TARGET2 balances. This risk is mitigated by collateral requirements. The residual risk is shared among the euro area national central banks in line with their share in the capital of the European Central Bank. This debate has not gone unnoticed in policy-making circles. The evolution of TARGET2 balances has become a key barometer of the intensity of the euro area’s debt crisis, for instance in multilateral surveillance by the International

3
Participants in this debate frequently invoke the United States as an inspiration
for possible remedies to the problems of Europe’s intra-country settlement system
(see e.g. Biljsma and Lukkezen, 2012; James, 2013; Koning, 2012; Schubert and
Weidensteiner, 2012; Sinn, 2012a and 2012c). US imbalances in high-powered
money flows between the 12 regional Federal Reserve districts are recorded in the
Interdistrict Settlement Account and netted out each year in the spring.5 Bookkeeping
adjustments are used to wipe clean the balance sheets of individual Reserve Banks of
the bulk of accumulated surpluses or deficits vis-à-vis other Federal Reserve districts.
This practice, which acknowledges the integrated nature of the Federal Reserve
System, is seen as a key explanation for why TARGET2 and ISA balances have
developed so differently since the onset of the global financial crisis.6 The clock is
virtually re-set each year in the US but not in Europe. Impressed by the contrast and
worried by the controversy surrounding the seemingly endless accumulation of inter-
country claims, observers have discussed the costs and benefits of importing this
mechanism into Europe.
Others (e.g. Sinn, 2011; Sinn and Wollmershäuser, 2012) have proposed
introducing quantity or price restrictions, such as outright caps or surcharges, to limit
the growth of TARGET2 balances. They too draw inspiration from US experience.
Prior to 1975, imbalances accumulated through interdistrict settlements were not
automatically eliminated at the conclusion of the annual settlement round. Instead,
settlements in gold were drawn from the reserve holdings of individual Reserve Banks
on a daily basis. Superficially at least, this would seem to be an example of the second
approach to reforming the TARGET2 system, where imbalances are capped at a
specified level (here zero) over a specified period of time (here a day). It would seem
to be an extreme version of this type of outright cap, zero balances day over day,
which would appear to imply a very dramatic adjustment burden on the borrowing
region – something that TARGET2 creditors would relish but TARGET2 debtors
would presumably find it very hard to stomach.
Given the difficulty of drastic adjustment by countries unable to obtain market
financing, how did individual Reserve Banks satisfy the budget constraints imposed
Monetary Fund (see e.g. IMF, 2012a, 2012b, 2013). At an ECB Press conference on 2 May 2013, for example, President Draghi indicated that “a decrease in TARGET2 balances is the best sign we have that there has been a gradual return of confidence”. 5 See also Bindseil and König (2011), Cour-Thimann (2013) and ECB (2013). Reserve Banks participate in the Fedwire Funds Service which enables participants – banks and certain other financial institutions – to make large-value, time-critical payments amongst themselves via their accounts with the Fed. The Interdistrict Settlement Account reflects the netting of cross-district transactions between regional Reserve Banks. This annual settlement is based on each regional Federal Reserve Bank’s average interdistrict balance during the preceding 12 months (April to March) –hence it does not necessarily bring balances back to zero. Settlement consists chiefly in adjusting the relative shares of the 12 regional Reserve Banks in the common pool of security holdings maintained in the System Open Market Account of the Federal Reserve System (see Board of Governors of the Federal Reserve System, 2010; Wolman, 2013). Regional Reserve Banks with a positive balance receive interest-bearing assets from those with negative balances. 6 As shown in Figures A and B of Annex I.
4
by capping daily interdistrict settlement at zero without imposing large money and
credit shocks on their local economies? The answer is that the practice of daily
settlement was more appearance than reality. In practice, liquidity problems and bank
runs in a Federal Reserve district prompted the extension of mutual assistance by
other Reserve Banks. Reserve Banks mutualised their individual gold reserves in
emergency situations, which resulted in large gold flows from districts with payment
surpluses to those with deficits – flows known as interdistrict accommodation
operations. These operations mainly took the form of rediscounts of discounted paper
between World War I and the Great Depression as well as of sales of participations in
open market operations, subsequently. They did not require any physical transfer of
gold, but only bookkeeping operations.7 Gold flows across districts in these
exceptional situations were very similar in spirit to the liquidity flows via TARGET2
from the euro area “core” to the euro area “periphery.”
By way of illustration, Figure 1 shows the large interdistrict accommodation
operations that took place during the severe slump of 1920-21, as reported by the
Federal Reserve Board in 1922. The stock of interdistrict borrowings and loans looks
strikingly similar to the familiar TARGET2 “trumpet.”8 In other words, risk sharing
via interdistrict accommodations was quite similar to that which takes place via
TARGET2.
The evolution of interregional gold reserve sharing mechanisms from the
creation of the Federal Reserve System in 1913 to the 1970s, when the modern
mechanism of annual settlement of payments was put in place, thus may provide
lessons for present-day Europe.9 In this paper we therefore use data on
accommodation operations by the 12 Federal Reserve districts between 1913 and
1960 (the last year for which such data are available, although the practice of daily
settlements continued as previously mentioned through 1975). These data span nearly
five decades, significantly longer than modern time series for either TARGET2 or
ISA balances.10
7 Note that the concepts of “mutual assistance”, “interdistrict accommodation operations”, “gold reserve sharing” and “gold reserve pooling” will be used interchangeably throughout the paper. 8 As shown in Annex I. 9 Annual settlements were introduced in the mid-1970s because gold reserve holdings were insufficiently elastic to keep up with the pace of deepening in the US financial system. It became ever more inconvenient to settle daily clearings among regional Reserve Banks with gold certificates. Growing volumes of clearings within the Interdistrict Settlement Account raised concerns that some regional Fed might not have enough gold certificates for settlement on a given day. Hence it became “increasingly difficult for regional Reserve Banks to earmark significant amounts of gold certificates as collateral for Federal Reserve notes” (FOMC, 1975, p. 40) in a context where adverse clearings could wipe out their holdings of gold certificates. The Federal Reserve Board agreed to discontinue the use of gold certificates as the medium for interdistrict settlements so as to “free the gold certificate holdings and make them fully available as collateral behind note liabilities” (ibid. pp. 40-41). It was also decided to introduce annual settlements instead, consisting of adjustments in regional Reserve Banks’ holdings of securities in the System Open Market Account, as mentioned above. Post-1975, there are data on interdistrict settlements, as shown in Figure B of Annex I, which are publicly available for the period 2003-2013; we are not aware of publicly-available data for earlier years. 10 Which start in 1999 and 2002, respectively.

5
We show that mutual assistance between regional Reserve Banks was
common in response to asymmetric shocks. But fortunes could change quickly, with
earlier emergency recipients of gold turning into providers. Imbalances did not grow
endlessly but narrowed once shocks subsided. Mutual assistance did not excite experts
or the American public, nor in most cases did they trigger insurmountable tensions
between regions. To the contrary, cooperation between Federal Reserve Banks was
essential to stability and smooth operation of the US monetary union.
There are parallels between the current situation and this earlier history,
although we do not wish to push them too far given the different institutional settings
and degrees of homogeneity between the US and euro area monetary unions.11
Most obviously, US regional payment imbalances were affected by shocks
arguably as severe as today’s global economic and financial crisis: the post-World
War I slump, the Great Depression and World War II. The regional impact of those
shocks was uneven. Moreover, the Federal Reserve System then was at a stage of
development roughly similar to the Eurosystem today. At the time of the first major
shocks that led to a surge in regional payment imbalances – 1920-21 and the Great
Depression – the monetary union was little more than ten years old, like the euro area
today. Hence this earlier era offers an opportunity to compare regional payment
imbalances in two monetary unions at similar stages of evolution.
Finally, the role of the gold standard in this earlier era will speak to those who
have drawn parallels between the euro area and the interwar period. Specifically they
have drawn parallels in terms of asymmetries between external surplus and deficit
economies and the role played by domestic prices and costs relative to exchange rates
in the adjustment of imbalances (see e.g. Eichengreen and Temin, 2010; Eichengreen,
2012; Bindseil and Winkler, 2013; Bordo and James, 2013; and O’Rourke and Taylor,
2013). Our focus on a five-decade-long period during which the US maintained gold
convertibility in one form or another, except for a brief interlude in 1933-1934, thus
offers an opportunity to revisit this debate.12
11 One difference e.g. is that TARGET2 balances can grow without any requirement of settlement at any point in time. Mutual assistance here is automatic and does not depend on the goodwill of some of the national central banks. Another difference is that fortunes have not changed as quickly as in the early decades of the US monetary union: large TARGET2 imbalances persisted for about five years in the euro area, before they started to decline. This is also why some critics see what they regard as “automatic mutual assistance” as potentially problematic in the euro area. 12 Bordo (2014) draws parallels between the recent evolution in TARGET2 balances and the functioning of the Bretton Woods system. Our paper also relates to the large literature that followed Friedman and Schwartz’s (1963) Monetary History (see e.g. Bordo and Rockoff, 2013, for an overview). It relates to the literature on the history of the Federal Reserve and its monetary policy (e.g. Meltzer, 2003, 2009a and 2009b; Hetzel, 2008). It relates to the literature on the microstructure of the US money markets, notably to one of its main insights, the so-called “large-small bank dichotomy” (see Goodhart, 1969; Allen and Saunders, 1986; Allen et al., 1989; Furfine, 1999; and Bech and Atalay, 2010) which has in turn inspired theoretical models of financial contagion (Allen and Gale, 2000; Freixas, Parigi and Rochet, 2000) where cross-regional liquidity differences play a key part. This literature finds that a large number of small deposit banks located in regions away from major financial centres are typically net lenders to banks in major US financial centres e.g. in New York, Chicago and San Francisco. Finally, the paper relates to the literature on currency unions, following Mundell (1961)

6
The remainder of the paper unfolds as follows. Section 2 reviews the
institutional framework for gold reserve sharing between regional Reserve Banks.
Section 3 describes the data and section 4 the evidence they provide. Section 5 draws
conclusions and policy implications.
2. Institutional Framework
The early Federal Reserve System was decentralized.13 Each Federal Reserve Bank
was “semi-autonomous”, in the term used at the time. Each conducted its own
monetary policy operations, had its own discount policy, and held its own gold
reserves.14 The ultimate guarantor of currency issued by the Federal Reserve System
was gold, into which currency notes were convertible at a fixed price. Each regional
Reserve Banks and not just the Federal Reserve System as a whole was required to
hold gold in sufficient quantity against its liabilities, as determined by law. The
Federal Reserve Act specified that “every Federal reserve bank shall maintain
reserves in gold or lawful money of not less than thirty-five per centum against its
deposits and reserves in gold of not less than forty per centum against its Federal
reserve notes in actual circulation.”15 The gold reserves of Reserve Banks consisted of
coin and bullion stored in their vaults but also of certificates, i.e. book credits in a
ledger account at the US Treasury.16
A Reserve Bank whose gold holdings fell short of these 35 and 40 per cent
minima would be unable to settle with other regional Reserve Banks. And if it could
no longer settle, commercial banks in its district could no longer maintain business
and McKinnon (1963)’s early studies, notably to the more recent literature on the normative and positive considerations concerning the attribution of policy prerogatives between a union and its member states (Alesina, Angeloni and Etro, 2005) and on cross-country insurance arrangements in a currency union (see e.g. Werning and Farhi, 2012). 13 In important respects it resembled the international gold standard when it was created in 1913 (James, 2013). 14
Note that the the Board had to give approval to discount rate changes, however. This compromise
was how President Wilson reconciled the preferences of bankers who wanted an independent central bank and the southern and western Democrats who demanded political control. The Board based its power to prevent Reserve Banks from announcing or changing discounting rates without its prior approval on Section 13 of the Federal Reserve Act that gave the Reserve Banks power to establish rates “subject to review and determination of the Reserve Board” (see Meltzer, 2003, p. 77). With the exception of New York, Reserve Banks arguably did not think of themselves as exercising the powers of a central bank in this earlier period. They certainly did not think of themselves as changing their liabilities to achieve macroeconomic objectives. Rather they thought of themselves as sitting on a given supply of money available in dealing with seasonal reserve demands and panics. We are grateful to Robert Hetzel for these observations. 15 Federal Reserve Act of 23 December 1913, section 16, p. 18. 16 Gold reserves served to back the deposits of the commercial banks of a particular Federal Reserve district, of the US Treasury, and of foreign governments and foreign banks. The latter was an item especially important for the New York Fed which held custody of most of the dollar reserves of foreign central banks. Gold reserves also backed Federal Reserve notes, i.e. paper currency in actual circulation.

7
relations with other districts. Cheques and payments from a district with inadequate
gold might then trade at a discount to par. A dollar from this district would be worth
less than a dollar from another district, violating the spirit of the clause in the Federal
Reserve Act requiring “par clearing” between Federal Reserve Banks.17 To prevent
this from happening, the Reserve Bank short of gold would then be forced to reduce
its discounts or other lending to member banks in its district, reducing its own
liabilities and restoring the specified minimum reserve ratio. Doing so might cause
obvious difficulties for member banks in the affected district, not to mention for their
customers.
What, then, obviated the need for disruptive adjustment or else violation of the
commitment to maintain clearing at par? The answer is mutual assistance between
Reserve Banks through reserve pooling. The strict decentralization foreseen in the
Federal Reserve Act, according to which each Reserve Bank was a distinct
bookkeeping entity required to maintain its own gold reserves, was in practice relaxed
through emergency procedures for sharing reserves in the event of need (McCalmont,
1963, p. 228). The ability to pool gold reserves was actually one of the main benefits
claimed for the new Federal Reserve when it was established.18 World War I provided
further impetus for the development of these practices. A Reserve Bank would
rediscount a bill on behalf of another Reserve Bank that had previously discounted the
bill in question.19 The Act of 1913 foresaw that such rediscounting might be
authorized and if necessary compelled by the Federal Reserve Board. It empowered
the Board “to permit, or, on the affirmative vote of at least five members of the
Reserve Board to require Federal Reserve Banks to rediscount the discounted paper of
other Federal Reserve banks at rates to be fixed by the Federal Reserve Board”
(Federal Reserve Act of 23 December 1913, section 11b, p. 12).20
Rediscount rates were not always higher than discount rates. In other words,
lending by Reserve Banks to their partners in the System did not always occur at
penalty rates. It was recommended in 1920 that: “The rate of such rediscounts should
be variable and fixed by the Board from time to time as the situation may appear to
require and without any special regard either for the profit or loss to the contracting
banks. In the present situation, we approve the action of the Board in fixing the rate of
such rediscounts at 7 per cent” (Board of Governors of the Federal Reserve System,
1921, p. 607). McCalmont indicates that the rate fixed by the Board likely created
losses for the Dallas and St Louis Reserve Banks (which charged their member banks
17 See Section 16(13) of the 1913 Federal Reserve Act: “Every Federal reserve bank shall receive on deposit at par from depository institutions or from Federal reserve banks checks and other items”. 18 We are grateful to Allan Meltzer for this observation. 19 Between World War I and the Great Depression, reserve pooling mainly took the form of rediscounts between regional Reserve Banks. However, regional Reserve Banks also purchased bankers’ acceptances from each other. 20 This provision remains law today. The original Federal Reserve Act also required an individual Reserve Bank to increase its discount rate if its gold cover was breached, but in no instances did the System required a Bank to increase its discount rate upon breach (we owe this point to Bob Hetzel).
8
only 6 percent on 60 to 90 day commercial paper) while other Reserve Banks broke
even (McCalmont, 1963, p. 33).21 This was mutual insurance by another name.
The mechanics worked as follows. A Reserve Bank rediscounting paper for
another made payment by wiring to the so-called “Gold Settlement Fund” (known
after 1935 as the “Interdistrict Settlement Fund”), which then transferred gold
certificates between accounts accordingly.22 The transaction lowered the reserve ratio
of the Reserve Bank rediscounting the paper, although the latter earned interest on the
collateral. It raised the reserve ratio of the Reserve Bank selling paper against gold,
allowing it to maintain its required minimum gold reserve ratio and bolstering
confidence in its district.23
Whether rediscounting should be compulsory was passionately debated by
Congress prior to the adoption of the Federal Reserve Act of 1913 (see Hackley,
1973). Some of these discussions were not unlike those concerning TARGET2
balances. A key concern was that compulsory rediscounting might encourage free-
riding (Eichengreen, 1992). If the gold reserves of a Reserve Bank were to decline
significantly, some critics complained, it could simply borrow from Reserve Banks
with sufficient reserves rather than curtailing discounts to local commercial banks
presumably engaged in dubious practices. Its incentive to adjust would be diminished,
while Reserve Banks compelled to extend accommodation would be saddled with
dubious collateral. The House of Representatives understood that compulsory
rediscounts had a redistributive aspect, at least in the short run, characterizing it as the
ability to “employ the resources of one portion of the country for the advantage of
other portions”.24 Concerns were voiced most forcefully in the Senate, however,
where one Senator argued that compulsory rediscounts would “accentuate the rivalry
21 In a similar vein, penalty rates were not necessarily foreseen for (re)allocations once they replaced rediscounting as the privileged means of extending interdistrict accommodation. For instance, as per the 1944 formula, sales of participations in Treasury bill purchases were made for a week’s duration at the discount rate of 3/8 of 1 percent per annum penalty rates, which was just the market rate (ibid, p. 100). 22 “Payment should be made by transfer through the Gold Settlement Fund in even thousands, off amounts to be adjusted by a credit to the account of the selling bank on the books of the purchasing bank. The selling bank should decrease the item “loans and discounts” and increase “Gold settlement fund”… The purchasing bank should increase the item “rediscounts for other Federal Reserve Banks” and should decrease “Gold Settlement Fund”. (unpublished Board memorandum X-185 updated, approximately 28 May 1917, quoted in McCalmont, 1963 pp. 241-242). To speed up the handling of re-rediscounting operations, the Federal Reserve Board introduced 27 code words for use in telegraphic communications (ibid). The Gold Settlement Fund account was held at the Treasury and administered by the Federal Reserve Board. At the end of the day, each regional Fed would send a cable to the Board of Governors to indicate the net amount due or owed to other districts. Upon completion of multilateral clearing, a regional Fed that owed another one had its gold account in the Gold Settlement Fund account reduced, while the receiving district had its account increased. 23 A Reserve Bank could also strengthen its reserve holdings by selling securities from its portfolio directly for gold, including bankers’ acceptances (especially up to the Great Depression) and government securities: “Other [than New York and Boston] Federal Reserve Banks have had, from time to time, surplus funds and with the approval of the Federal Reserve Board have purchased bankers’ acceptances from these eastern banks” (Federal Reserve Board, 1919, p. 7). 24 See Hackley (1973), p. 163.

9
between sections [i.e. Federal Reserve districts] for the accumulation of reserves” and
cause “unlimited irritation and friction”.25
In practice, Reserve Banks acquiesced to the recommendations of the Board
and requests for rediscounting from their partners in the system. Contemporaries
stressed that World War I had fostered solidarity among Federal Reserve Banks by
making “apparent to all the necessity of subordinating considerations purely of
sectional advantage” (Reed, 1922, p. 9). Such is the impact of a foreign war. As a
result “It was easy for the Board to insist, in the determination of the inter-district
shifting of funds, upon principles which ordinarily might have created some
objection” (ibid.). The Federal Reserve Board noted in 1920 that “there has […] been
such a spontaneous spirit of cooperation between the Federal Reserve Banks [during
the period of the war] that all transactions suggested by the Federal Reserve Board
have been made voluntarily, and in no case has the Board found it necessary to
exercise its statutory power to require such operations […] All payments have been
made […] through the gold settlement fund […] without involving any physical
transfer of gold (our italics added)” (Board of Governors of the Federal Reserve,
1920, pp. 5-6).
Only once, in fact, did the Board find it necessary to use its power of
compulsion, in the 1933 episode discussed below. That episode had serious
repercussions, prompting changes in the structure of the Federal Reserve System
which vested more power in the Board and reduced the decision-making autonomy of
individual Reserve Banks. A powerful Federal Open Market Committee (FOMC) was
first created by the Banking Act of 1933. Membership of that committee was then
revised under the Banking Act of 1935, as amended in 1942, which created the
present 12 member committee of five members of the Board of Governors and 7
Reserve Bank governors. Under the 1935 Act, Federal Reserve Banks were prohibited
from purchasing or selling securities except under instructions from this Committee.
The Federal Open Market Committee was further empowered to instruct Reserve
Banks to sell or transfer any securities held or purchased to a joint System account.26
An additional consequence of the Banking Act of 1935 was that the System
Open Market Account took center stage as the principal means of sharing gold
reserves.27 The System Account is the joint account through which open market
25 Senator Burton, 51 Congressional Record, 667, as quoted in Hackley (1973), p. 174. (Theodore Burton was a Republican from Ohio and former member of the National Monetary Commission). 26 Meltzer (2003), p. 501. Moreover, the experience of the Great Depression encouraged the Fed to increase its purchases of long-dated treasury obligations, in contrast with the previous practice, reducing the importance of discounting and rediscounting. Readers will recall that the previous practice was to acquire short-dated obligations, like bankers’ acceptances. As early as 1933, the Fed bought Treasury notes with up to five years maturity, selling short-term securities to lengthen the overall maturity of its portfolio (ibid., p. 436). During World War II, the Fed went as far as conducting open market operations with a view to capping the yield on long-term government bonds (ibid., p. 594). Arguably the Fed reverted to a “bills only” policy in the early 1950s (Fand and Scott, 1958) but abandoned it in the early 1960s. 27 This open market account had been created as early as 1922, however, largely at the initiative of Governor Strong (see e.g. McCalmont, 1922, p. 51).

10
operations are executed. It is managed by the New York Fed under direction by the
Federal Open Market Committee. Open market operations are thus a possible source
of payment imbalances across districts, despite the centralization of security
transactions in New York, given the fact that the geographical location of US banks’
headquarters differs. For instance, even if the New York Fed buys US Treasury bills
from a broker located in New York, the high powered money created may flow to an
account maintained at the Chicago Fed, if the bank of the seller of the bills in question
is one of its members.
Operations undertaken by the New York Fed on behalf of the Federal Reserve
System are also allocated among Reserve Banks on the basis of a formula. This
formula was originally intended to ensure that all Reserve Banks had sufficient
holdings of interest-bearing government securities and adequate earnings.28 But
another goal, which became increasingly important over time, was to even out reserve
ratios across Federal Reserve districts. To that end, the Federal Open Market
Committee determined that Federal Reserve Banks short of gold and liquidity could
be partly or fully exempted from participating in open market operations. To bolster
their reserve ratios, they could sell their participation in these operations to other
Reserve Banks against gold certificates. This was collateralized lending (loans of gold
certificates collateralized by treasury bonds) by another name. Reallocations were
given formal status by a Federal Open Market directive in May 1936, which was
followed a month later by the introduction of regular quarterly allocations
(McCalmont, 1963, p. 86).29 These reallocations became the basic mechanism for
reserve sharing between Reserve Banks in the subsequent three decades.
1936 saw the introduction of the formula used to undertake reallocations
within the System Open Market Account. That formula specifies a floor for the
reserve ratio of each Reserve Bank. An FOMC directive of 25 May 1936 “authorized
and directed [its] executive committee to make thereafter from time to time such
readjustments as may be necessary to maintain the distribution of government
securities among the Federal Reserve Banks in accordance with such formula [i.e. that
of February 1935]: provided that if at any time the reserve ratio of any Federal
Reserve Bank should fall below 50% or would be reduced below 50% by reason of
the operation of such formula, the executive committee shall make such readjustments
in the allotments as shall be necessary to raise the reserve ratio of such bank to 50%
by allocating the necessary amount of securities to the other Federal Reserve Banks in
accordance with the formula” (see McCalmont, 1963, p. 85).30
28 The formula was not carved in stone, however. It changed repeatedly over our sample period (in 1923, June 1924, May 1933, February 1935, June 1936, October 1944, January 1948 and September 1953). 29 Because some Fed officials perceived the regular quarterly reallocations as making the individual reserve ratios of individual Reserve Banks less informative, it was decided to discontinue their publication. They continued to be computed for internal purposes, however (McCalmont, 1963, pp. 88-92). 30 The FOMC subsequently lowered the 1936 50% floor to 45% in May 1944 and to 35% in 1945.

11
3. Data
McCalmont (1960, 1963) is our source of data on reserve sharing from 1913 through
1960. McCalmont compiled the available published material, including books and
studies by contemporaries and reports by the Federal Reserve Board and district
Reserve Banks. He had access to unpublished material from the archives of the
Federal Reserve Board, which expressed an interest in the “compilation, review, and
analysis of all the data in its possession”. The Board provided assistance, with its staff
going to “unusual lengths to seek out and make available […] technical material”.31
McCalmont’s investigations were complemented with interviews with Fed Reserve
officials from staff to Board members. The Board expressed satisfaction with the end
result, especially with “the meticulous way” in which information had been gathered.
The data indicate the extent of interdistrict accommodation operations – i.e.
gold provided and received by each of the Federal Reserve Banks through rediscounts
or sales of participations in open market operations – between 1913 and 1960 as well
as their reserve ratios under the counterfactual that no gold sharing took place
(McCalmont, 1963, p. 92 and pp. 133-135). The format of the data was not uniform.
Some items had been calculated and harmonized by the Federal Reserve System
itself.32 But other items required additional transformation, which McCalmont
undertook. Still other data available as time series were of varying frequency. Finally,
some data were snapshots of accommodation operations undertaken in a specific
crisis episode. In a few cases (e.g. for 1922, 1923, 1925, 1926), information was
available on the balance sheets of Reserve Banks providing accommodation but not of
those receiving it.
McCalmont was aware of the importance of distinguishing stocks from flows.
He noted that stocks are not equivalent to cumulated flows insofar as the maturities of
securities transacted by Reserve Banks varied, and securities acquired previously
could mature and roll off of the balance sheet. Stock data, he observed, were
preferable, although the material needed to construct them were not always available.
In the end, McCalmont was able to construct estimates of the relevant stocks except
for 1916-1918 and 1922-1926, when for reasons of data availability only estimates of
flows were possible.33
We used these data to construct time series of quarterly interdistrict
accommodation operations undertaken by the 12 Reserve Banks from 1913:Q4
through 1959:Q4. For the period after 1936, no further transformations were required.
Before 1936, format varied. While data for 1920-21 and March 1933, two episodes
31 See letter of M. Sherman, Secretary, Board of Governors of the Federal Reserve System, 29 March 1960, reported in the incipit of McCalmont (1963). 32 Examples include the data on rediscounts and reserve ratios available from 1916 to 1933 as well as those on reallocations and actual reserve ratios available from 1936 to 1960. 33 Detailed data are available on the stocks of gold reserves received or provided at the 70 regular reallocations that occurred between 1936 and 1960, in particular (McCalmont, 1963, pp. 166-171).
12
during which interdistrict accommodation operations reached exceptional levels, were
available in the appropriate format, data for other years required more extensive
transformations (see Annex III). Where possible, we constructed end-of-quarter
observations of stocks. We also cumulated monthly observations in each quarter to
obtain rough estimates of quarterly stocks, bearing in mind that these are imperfect.34
We assumed uniform distributions where information was missing. For instance,
when data were available for providers only, we assumed that the remaining districts
were recipients in identical amounts.35
4. Empirical Analysis
We use our data to shed light on four different aspects of mutual assistance between
Federal Reserve Banks which are still relevant to today’s discussions on TARGET2
imbalances, namely: the scale and determinants of mutual assistance between Federal
Reserve Banks; the evolution in the location of the “core” and “periphery” of the US
monetary union; the degree of persistence in regional imbalances; and the few
episodes when rising imbalances created tensions between Federal Reserve Banks.
We consider these four aspects in turn in what follows.
Scale and determinants of mutual assistance between Federal Reserve Banks
A first insight from the first 50 years of interdistrict settlement is that there was
extensive mutual assistance between Reserve Banks in response to liquidity crises and
bank runs. Extensive gold sharing to even out liquidity conditions across Federal
Reserve districts took place when those liquidity conditions differed significantly.
Figure 2 shows the evolution of outstanding interdistrict accommodation over
the period 1913-1960, scaled by GDP. Amounts are broken down by Federal Reserve
district and type (i.e. whether a district was a net provider or a recipient of gold).36
Figure 3 then shows the evolution of the total volume of accommodation operations
undertaken jointly by the 12 Federal Reserve Banks, again scaled by GDP.37
Accommodation peaked at more than 0.8% GDP in 1933 and again in 1946. This is
lower than the volume of TARGET2 balances (about 9% of euro area GDP), although
it is only somewhat less than ISA balances in 2011 (somewhat less than 2% of US
GDP – see Bijlsma and Lukkezen, 2012, and Figure 4). In part the lower level of
accommodation operations in the earlier period reflects the fact that the US banking
34 Since the residual maturities of the underlying securities could vary. Note that the assumption is that securities have a residual maturity of three months in the first month of a given quarter, against two months in the second month and one month in the last month. 35 McCalmont (1963, p. 169) warns that the data may not fully capture “extreme reserve deficiencies” which could have materialized within months of a corresponding quarter. Only data sampled at the infra-monthly frequency – which were not available – could have mitigated possible biases in this case. 36 Cumulated flows per quarter are shown for the period 1916-1918 and 1922-1926 as stock data were not available. 37 US GDP, to be clear, not district GDP.

13
sector was smaller as a share of the economy then than the US or European banking
sectors are of their respective economies now. Volumes are more closely comparable
across periods if one uses banking sector assets as the scaling factor. In this case
balances are almost 1% of US banking sector assets for interdistrict accommodation
in 1933, against roughly 2% of euro area and US banking sector assets for both
TARGET2 and ISA balances in 2011.
More often than not, these interdistrict accommodation operations were
associated with banking sector tensions. Table 1 reports estimates for selected periods
of the impact on interdistrict accommodation operations of all commercial bank
suspensions, using data from Flood (1998).38 These estimates control for the share of
the agricultural sector in district GDP (a metric of a district’s exposure to commodity
price shocks), net shipments of gold to the rest of the world (a metric of exposure to
external financial disturbances) and the interactions between bank suspensions and the
latter two variables.39 The estimates are obtained using a panel estimator that controls
for time and random district effects. The equation estimated on the full time period
yields a coefficient on bank suspensions that is negative, large and significant (see
column 1 of Table 1).40 They suggest that an additional 1,000 bank suspensions in a
district was associated with a transfer of gold reserves on the order of 0.4% of US
GDP in that district.
Figure 3 also highlights episodes when accommodation was exceptionally
large, defined as quarters in which total accommodation exceeded its sample mean by
one standard deviation pre-1936 and post-1936, respectively.41 Mutual assistance was
unusually large in three periods: after World War I (1920-21); during the Great
Depression (especially around March 1933); and after World War II. So measured
mutual assistance was exceptionally large in 19 quarters over our sample period, or
about 11% of the time. On average there was a surge in gold reserve sharing every 9
years.
38 Data on bank suspensions pertain to all commercial (including national) banks and were available at the US state-level. They were used to reconstruct aggregates at the Federal Reserve district-level, although it is to be noted that US state boundaries do not always overlap with those of Federal Reserve districts. 39 Data on gross value added in the agricultural sector are from the US Department of Agriculture, while those on state GDP are from the Bureau of Economic Analysis. Both pertain to 1965, i.e. the earlier year for which they were simultaneously available. The data on net shipments of gold to the rest of the world are from Jones and Obstfeld (1997). They are scaled by US GDP and available for the period 1913-1945. 40 The negative sign on the coefficient suggests that more bank suspensions in a district are associated with lower (or negative) accommodation. The coefficient remains of the same sign and of similar economic size if one controls for time effects, but it is no longer statistically significant, however (see column 2 of Table 1). 41 Dividing the sample in 1936 accounts for the replacement of rediscounting by (re)allocations as the principal mechanism for sharing gold reserves between Reserve Banks.

14
Interdistrict accommodation operations first ballooned during the 1920-21
slump that followed World War I.42 Several districts were hit by adverse commodity
price shocks, giving rise to financial distress and bank failures.43 The Atlanta, Dallas,
Richmond and St Louis districts were adversely affected by declines in the price of
cotton and tobacco, while the Chicago, Kansas City and Minneapolis districts were hit
by declines in the price of grains, wool and other agricultural products (see Hackley,
1973). All 12 regional Reserve Banks took part in these operations on one side or the
other (ten of them participated on both sides at different points in time). Gold reserves
were shared mainly by rediscounting bankers’ acceptances in the portfolios of hard-
pressed regional Reserve Banks. It was chiefly Reserve Banks from agricultural areas
in the interior of the country (including Kansas City, Dallas and St Louis) as well as
Chicago and Minneapolis that were borrowers, while Reserve Banks from coastal
areas (Boston, New York, Philadelphia and San Francisco) were lenders.
There is again evidence that interdistrict accommodation operations were
associated with banking sector tensions. The estimates obtained when the sample is
restricted to 1920-21 suggest that the impact of bank suspensions on accommodation
is negative, significant and larger than the estimate for the full sample. They suggest
that an additional 1,000 bank suspensions in a district was associated with a transfer
of gold reserves on the order of 1.6% of US GDP in that particular district (see
columns 3 and 4 of Table 1). Accommodation was also more pronounced in
agricultural areas. An increase of 10 percentage points of GDP in the share of the
agricultural sector in a district is found to be associated with a transfer of gold
reserves on the order of 0.2% of US GDP.
During the Great Depression, interdistrict accommodation operations were
larger still. While the gold reserves of the Federal Reserve System as a whole never
fell below the statutory minima, some individual Reserve Banks skated close to the
edge. Interdistrict accommodation operations occurred in mid-1931, by which time
commodity prices had fallen significantly. These involved mainly heavily agricultural
districts, where bank failures were widespread, such as Atlanta, Dallas, Kansas City
and Richmond, on the borrowing side. These operations consisted mainly of
reallocations of holdings of government securities (McCalmont, 1963, p. 72). Much
larger reallocation operations then took place in mid-1932. Significant
accommodation was extended to the New York bank, from virtually all the other
Reserve Banks (ibid., p. 74), presumably reflecting New York’s loss of gold to
foreigners.
Events in March 1933 were even more dramatic. Markets were demoralized
and gold hemorrhaged from the vaults of New York banks to an extent such that the
New York Fed’s reserve ratio declined to barely 25% in early March.44 This led
42 In the words of contemporaries, they then “assumed unprecedented proportions”; see Board of Governors of the Federal Reserve System (1922), p. 26. 43 On the link between agricultural prices and bank failures, see Alston, Grove and Wheelock (1994). 44 This episode is also recounted in Wigmore (1987).

15
Randolph Burgess, the New York Fed deputy governor in charge of securities
transactions, to contact the Chicago, Boston, Cleveland, St. Louis and Kansas City
reserve banks on March 3rd and request that they take government securities in
exchange for gold. The Minutes of the Board of Directors of the New York Fed for
March 7th describe how Burgess was not able to secure the desired cooperation
“largely due to the refusal of the Federal Reserve Bank of Chicago to purchase a
suggested $100,000,000 of Government securities from us.”45 With the New York
Fed unable to provide assistance to local banks, New York State Governor Herbert
Lehman was forced to declare, at the New York Fed’s urging, a bank holiday at 2:30
AM on the morning of Saturday, March 4th.
Burgess’ next step was to contact Eugene Meyer at the Board of Governors
later on March 4th in order to suggest “the possibility of the Federal Reserve Board
bringing pressure to bear on the Federal Reserve Bank of Chicago to buy Government
securities from this bank or of the Board’s ordering sufficient inter-district
rediscounting to rectify our reserve position.” Strikingly, Governor Meyer reported
back that the Board was not prepared to invoke its authority to require inter-district
rediscount “at that time.”46
This left the new president, Franklin Delano Roosevelt, no choice but to
invoke the Trading with the Enemy Act and suspend gold transactions on his first full
day in office, Sunday, March 5th. There then followed what was initially supposed to
be a four-day bank holiday.
Burgess later reported to his fellow directors that while he then took up the
issue again on Monday, March 6th, again the Board of Governors took no action.
Burgess then again telephoned Meyer to press on him the urgency of acting, and
Meyer suggested that the directors of the New York bank “formally request the
Federal Reserve Board to require other Federal reserve banks to rediscount the
discounted paper of this bank,” which it then did.47 With this political cover, on
March 7th the Board finally telegraphed the other reserve banks compelling them to
rediscount paper on behalf of the New York Fed for the first (and so far only) time in
the System’s history, in accordance with Section 11(b) of the Federal Reserve Act of
23 December 1913.48
Obviously, these interdistrict accommodation operations were associated with
exceptional banking sector tensions, as the Board noted: “Early in 1933 with the
recurrence of bank failures and deposit withdrawals the Federal Reserve System was
called upon to meet large demands for currency and gold […] The crisis of February
and March 1933 […] was not a currency crisis but a banking crisis, and was
45 Federal Reserve Bank of New York, Board of Directors’ Minutes, Vol. 33, March 7th, 1933, folio page 160. 46 Minutes, folio pp. 160-161. 47 Minutes, folio p. 161.48 This was also the first rediscounting operation since 1922, and the last one ever arranged (McCalmont, 1963, p. 76).
16
occasioned not by a shortage of currency but by loss of confidence in the solvency of
banks and by a depreciation in bank assets […] caused by the depression […] General
loss of confidence in the solvency of banks […] was accompanied by considerable but
less widespread loss of confidence in the paper currency itself” (Board of Federal
Governors, 1934, pp. 1 and 26).49 The impact of banking sector tensions changed
disproportionately when external financial disturbances occurred in this period, as
shown by the significant estimate of the interaction coefficient between bank
suspensions and net shipments of gold to the rest of the world when the sample is
restricted to 1931-35 (see column 5 of Table 1).50
Significant accommodation operations again took place after World War II.
Large government security purchases by the Fed during wartime had lowered the
System’s gold cover ratio toward its legal minimum. To ensure that no individual
Reserve Bank’s reserve ratio fell below the regulatory floor (45% since 1944, the
formula used to undertake reallocations within the System Open Market Account,
which had originally set that floor at 50%), the FOMC reallocated Treasury bills held
in the System Account.51 When this proved insufficient, Congress reduced gold
reserve requirements to 25%, while the FOMC reduced from 45% to 35% the floor at
which Federal Reserve Banks could cease to participate in open market purchases.
New York was again the largest recipient of gold reserves in mid-1946, but
Boston and Philadelphia also received significant amounts; all other districts were
gold providers. The New York Fed’s reserve ratio fell as foreign central banks and
governments began liquidating their dollar deposits, converting them into gold that
they were now in a position to repatriate (or to instruct the Fed to hold under
earmark). According to the Board of Governors, “At the end of the year foreign-
owned dollar deposits, earmarked gold, and securities held for all accounts, including
accounts maintained by foreign depositors with the Federal Reserve Bank of New
York acting as fiscal agent of the United States amounted to 5,330 million dollars, as
compared with 6,830 million dollars at the end of 1945” (Board of Governors of the
Federal Reserve System, 1946, p. 56). This was a very large fall in foreign deposits by
the standards of the time, implying a large fall in reserves and requiring large amounts
of interdistrict accommodation, insofar as deposits could be subsequently converted
into gold. Again, however, the direction of accommodation reversed after two years,
as this process of foreign repatriation subsided, with New York becoming a net
creditor and e.g. Atlanta, Boston, Cleveland, Kansas City and San Francisco taking its
place on the borrowing side.52
49 It has been observed that there are interesting parallels that can be drawn between this episode and the ECB’s decision to accommodate bank liquidity needs during the global financial crisis (see Cour-Thimann, 2013, p. 34). 50 The coefficient has the same sign and is even larger when one controls for time effects, but it is no longer statistically significant, however (see column 6 of Table 1). 51 Minutes of the FOMC, 4 May 1944 (quoted in Meltzer, 2003, pp. 605-606). The floor attached to the reallocation formula is described by McCalmont (1960), pp. 100 and 107. 52 The New York Fed was silent on the proximate cause of this reversal, simply noting that increases in its gold reserve holdings were “largely offset […] by substantial adverse balance in transactions [i.e. extension of accommodation to other districts] through the interdistrict settlement fund, through which
17
Evolution in the location of the “core” and “periphery” of the US monetary union
Thus, an important observation from the first 50 years of the Federal Reserve System
is that the pattern of regional imbalances was not carved in stone. Districts that at one
point in time were emergency recipients of gold could turn into providers. The
identity of the borrower depended on the nature of the shock, and the nature of the
shock differed over time, from commodity price shocks in 1920-21 and 1930-31 to
external financial disturbances in 1933 and 1946. It depended on whether gold
transfers occurred because of inter-state current account imbalances (i.e. reflecting
real goods transactions) or because of a capital flight. Hence, there was no well-
defined “core” or “periphery” of the Federal Reserve System in its first five decades.
This is illustrated in Figure 5, which maps the geographical distribution of
interdistrict accommodation operations in the second quarter of 1920, first quarter of
1933 and second quarter of 1946. Districts that were gold reserve providers are shown
in dark grey, districts that were gold reserve recipients in light grey, and districts that
did not actively participate in white.53 That fortunes could change is apparent.
Although the New York and Boston districts provided substantial amounts of gold to
hard-pressed districts in the second quarter of 1920, for example, this situation had
reversed by March 1933 when New York was an interdistrict borrower and five other
regional Reserve Banks, notably including Chicago, were called on to assist it.
Figure 6 shows the distribution by size of (GDP-scaled) interdistrict
accommodation operations undertaken by each of the 12 Federal Reserve Banks over
the period. The figure confirms that the same districts could be both providers and
recipients of gold at different points in time. Formal statistical tests suggest, however,
that the distribution is significantly skewed (see Table 2). The operations undertaken
by the New York and Boston districts show a significant negative skew. This means
that New York and Boston had a larger than average probability of being recipients of
accommodation. In contrast, the operations undertaken by the Atlanta, Chicago,
Minneapolis, Richmond and San Francisco districts display a significant positive
skew. These districts had a larger than average probability of being on the providing
side. These patterns are reminiscent of earlier studies of the geography of the US
money markets microstructure (Goodhart, 1969; Allen et al., 1989; Bech and Atalay,
2010) in which banks in regions remote from major financial centres were net lenders
to banks in New York during normal times but move to repatriate their previous loans
in exceptional periods. Where these studies of the period prior to the advent of the Fed
focus on correspondent relationships among commercial banks, our data for the early
Federal Reserve period document similar official flows, with the New York Fed often
borrowing from other Federal Reserve banks, including Chicago and San Francisco.
domestic flows between the several Federal Reserve Districts are finally cleared” (Federal Reserve Bank of New York, 1949, p. 52). 53 Note that the map is drawn on the basis of state boundaries, which do not always overlap with those of Federal Reserve districts.
18
Persistence in regional imbalances
A further observation from the first 50 years of the Federal Reserve System is that
regional payment imbalances did not grow endlessly but stabilized and reversed once
the initial liquidity shocks and bank runs subsided. In the five decades of our sample,
interdistrict accommodation declined to low levels following each local peak. It took
only a quarter of a calendar year for accommodation operations to revert to pre-crisis
levels following the 1920-21 and the 1933 episodes. The post-World War II episode
was more long-lasting in that it took 16 quarters for accommodation to revert to pre-
crisis levels.
Table 3 reports time series estimates obtained when the total volume of
accommodation is regressed on its lag and a constant. The table also reports panel
estimates (in columns (4) to (6)) obtained when the net accommodation received by
each of the 12 Federal Reserve districts is regressed on its lag, a constant and district
and time effects. The standard errors reported are robust to heteroskedasticity. These
estimates of the dynamics of interdistrict accommodation confirm that persistence was
not strong. For the full sample the coefficient on the lagged dependent variable is on
the order of 0.9, which points to a half-life of slightly more than five quarters. In other
words, only 50% of a typical shock to accommodation operations remained after 1.3
years. Restricting estimation to the period before 1936 (when rediscounting was the
principal way of conducting accommodation operations) points to even faster
adjustment, with a coefficient on the lagged dependent variable of less than 0.4, and a
half-life of less than a quarter.
That gold reserves were shared between regional Reserve Banks and that
interdistrict accommodation grew with need were precisely the conditions necessary
to overcome liquidity shocks. Contemporaries were aware that real adjustment might
be highly disruptive in their absence. Referring to the 1920 episode, the Board of
Governors noted that “The table of reserve ratios indicates clearly why interbank
accommodation was necessary in 1920 and what banks were in need of it, as well as
what banks were in a position to extend accommodation” (Board of Federal
Governors, 1922, p. 26). Contemporaries were also aware that accommodation
operations were crucial for avoiding widespread failures and the spread of bank
failures across US regions. For instance, the Governor of the Federal Reserve Bank of
Atlanta observed of the strains created by the post-World War I downturn that: “If this
bank [the Cleveland Fed] had failed to stand as a buffer between the business of this
section [the Atlanta Fed district] and disaster […] it would have permitted a situation
to develop which would have seriously affected all other sections of the country and
every other reserve bank. This district, if made bankrupt through the necessity of
immediate liquidation […] would react upon every section of the country […]. The
mere publication of our actual reserve ratio might possibly have the effect of causing
the failure of numerous banks, not only in this district, but in others as well, and bring

19
on a panic of great magnitude [italics added]” (unpublished letter to the Federal
Reserve Board, 9 December 1920; quoted in McCalmont, 1963, p. 26).54
The relief afforded by accommodation operations is evident from Figure 7,
which shows the evolution between mid-1936 and end-1959 of the reserve ratios of
the 12 Federal Reserve banks as well as of the corresponding adjusted ratios, i.e. the
ratios which would have prevailed without interdistrict accommodation. That these
two ratios could be very different in some instances – that some Reserve banks would
have had much lower gold coverage of their liabilities in the absence of interdistrict
accommodation – comes out clearly.
Episodes when rising imbalances created tensions between Federal Reserve Banks
This mutual assistance left the US public and even informed opinion largely
unmoved. It normally did little to inflame tensions between regions. Typically, gold
reserve sharing between Reserve Banks passed unnoticed by the public. McCalmont
(1963, p. 1) notes the “surprising contrast between the great worry over our national
loss of gold reserves [to foreign countries] and the complete absence of worry over
the possible loss of gold reserves by one Federal Reserve district to another… Why,”
he asked, “is there never any alarm over actual or feared deficiencies in the gold
reserves of individual Reserve Banks?”
There were at least three prominent exceptions, however. There was
opposition to rediscounting in the wake of the first such operation in December 1917,
when commercial banks in Chicago complained that the reserves they had provided to
the Chicago Fed were being “siphoned off” (in the words of McCalmont) by Reserve
Banks in Southern States in order to make loans to firms which would “otherwise
have borrowed money in Chicago” (see McCalmont, 1963, p. 23). World War I and
its demands helped overcome this dissatisfaction, however, as noted above. It brought
home to the boards of the individual Reserve Banks that they were in this foxhole
together. As Willis put it, “the determination of the United States to enter the war
brought [this] early period to a close.” (Willis, 1923, p. 22)
In addition, there were tensions among Reserve Banks in 1932, when the
executive committee of the Open Market Policy Conference finally began to expand
member bank reserves through open market operations. These arose because of New
York’s reluctance to undertake the bulk of the security purchases at a time when it
feared large gold losses to Europe without further support from e.g. Boston and
Chicago.55
54 Subsequent observers came to similar conclusions: “If there had been no reallocations or re-rediscounting, reserve-deficient Reserve Banks might have had to refrain from making advances and rediscount for member banks, which in turn might have been obliged to curtail their own extension of credit… borrowers who were thus denied local credit might have often been obliged to curtail their purchases or to sell off their assets” (McCalmont, 1963, p. 233). 55 As Governor Harrison put it “Given the comparative reserve positions of the two banks [i.e. New York and Chicago], it is difficult to see why we should pump funds into market which will then be

20
The third exception is March 1933, when commercial banks in Chicago
pressured the Federal Reserve Bank of Chicago not to assist the New York Fed –
which then haemorrhaged gold to foreigners – on concerns that doing so would
weaken their own position (Eichengreen, 1992).
One explanation for why gold reserve sharing attracted limited public attention
is the strong spirit of cooperation between the regional Reserve Banks. In this view,
the explanation of the “puzzling fact that the public is never aware of any worry by
any Federal Reserve district over the loss of gold reserves to any other district […]
lies, not in the fact that all parts of the US make use of a common monetary unit, but
rather in the cooperative relationships which the twelve legally separate Reserve
banks have established” (McCalmont, 1963, p. 231). A further explanation is that
cooperation was in the interest of all insofar as sharing gold reserves provided hard-
pressed districts with the leeway needed to smooth adjustment to payment
imbalances. Finally, that no district could foresee – under a veil of ignorance –
whether it would actually need insurance or not, worked to further bolster
cooperation.
A final insight from the experience of the first 50 years of the US Federal
Reserve System is that cooperation between Reserve Banks was essential to the
stability and cohesion of the US monetary union. No episode better epitomizes the
point than the banking panic of March 1933. Friedman and Schwartz note that “In the
final two months prior to the banking holiday [of 6-15 March 1933], there was
nothing that could be called a System policy. The System was demoralized. Each
[Federal Reserve] Bank was operating on its own. All participated in the general
atmosphere of panic […] The leadership which an independent central bank system
was supposed to give the market […] [was] conspicuous by [its] absence”.
The breakdown of cooperation among regional Reserve Banks “under the
pressure of the crisis” (Wigmore, 1987, p. 747) fuelled self-fulfilling runs on banks
and the dollar, which culminated with the bank holiday proclaimed by President
Roosevelt between 6 and 15 March. The US monetary union was virtually suspended
on those days, insofar as all payments and other activities of the banking system were
interrupted.
The paradox is that the gold reserves of the Federal Reserve System as a
whole, on the order of USD 3 billion, were more than sufficient to meet gold demands
and statutory requirement (see Figure 8). But gold losses were spread unevenly
among Reserve Banks. Pressure on New York was particularly intense, as it was the
first port of call for foreign investors, both private and official, seeking to repatriate
US gold. New York lost 61% (or USD 584 million) of its reserves between 1
siphoned off to Chicago” (Minutes, New York Directors, 23 June 1932, 2, as quoted in Meltzer, 2003, p. 367).

21
February and 4 March, whereas the System as a whole had lost only 18% (or USD
571 million).
Initially cooperation was smooth. In the final weeks of February, other
Reserve Banks had discounted USD 210 million of bills from the New York Fed and
helped it to replenish its gold reserves in still other ways (Brown, 1940, p. 1248). But
that cooperation was withdrawn on 3 March. The Chicago Fed refused to rediscount
an additional USD 100 million of government securities from the New York Fed. As
one contemporary later explained: “some of the member banks of Chicago threatened
to put all their deposits out of the Federal Reserve Bank the next morning […] They
did not want the gold transferred to the New York district”.56 The Chicago Fed had a
history of independence within the System. It had resisted the de facto leadership of
the New York Fed in the 1920s, and its governor had repeatedly sparred with the
influential governor of the New York Bank, Benjamin Strong, over Strong’s desire to
cut interest rates to help the United Kingdom first to return to and then stay on the
gold standard. The Chicago district also experienced exceptionally severe banking
problems in late 1932 and early 1933, notably the prominent difficulties of Charles
Dawes’ Central Republic Trust and Henry Ford’s Guardian Group of banks. It was
therefore exceptionally concerned to husband its gold reserves and not share them
with New York.
Only on 7 March did the Federal Reserve Board compel interdistrict
rediscounting by five other regional Reserve Banks. The New York Fed had been left
on its own for three days with only USD 381 million of gold reserves, barely half the
USD 600 million in foreign deposits in New York banks.57 Not surprisingly, the New
York Fed urged State Governor Herbert Lehman to declare a state bank holiday in
order to close down a system that would otherwise “run out of gold” (Wigmore, 1987,
p. 749). The suspension of interstate payments led to additional bank failures and
disrupted credit flows.58 It led to a generalized bank holiday in which the par clearing
of deposits between, and for that matter within, districts was disrupted for an extended
period. This indicates clearly that cooperation between regional Reserve Banks was
essential to the cohesion and stability of the US monetary union.
The upshot was the Federal Reserve Act of 1935, which gave the Board of
Governors in Washington D.C. full control of purchases and sales of securities of
regional Reserve Banks via the System account, which significantly facilitated
interdistrict accommodation.
56 W. Wyatt, Counsel to the Federal Reserve Board (Columbia University Library, Oral History Archives, Reminiscences of Walter Hyatt, pp. 3-4, quoted in Wigmore (1987), p. 787). 57 Including USD 240 million that the Bank of England was eager to convert into gold to reduce its exposure to the risk of a dollar devaluation (ibid.) 58 Friedman and Schwartz note that over 5,000 banks that were still operating when the bank holiday started did not reopen when it ended and, of these, more than 2,000 never did subsequently (Friedman and Schwartz, 1963, p. 330). See Bernanke (1983) for empirical evidence over the period January1919-December 1941 of the non-monetary effects of banking failures on the propagation of the Great Depression and, in particular, its detailed discussion of the consequences of the March 1933 episode.

22
5. Conclusion
We have sought to shed light on the history of mutual assistance between Reserve
Banks in the early years of the Federal Reserve System, a process through which the
area over which the dollar circulated became a full-fledged monetary union. Data on
interdistrict accommodation suggest that mutual assistance was common in response
to liquidity crises and bank runs, with regional Reserve Banks pooling their gold
reserves every nine years, on average, between 1913 and 1960. They show that
fortunes could change quickly, with Federal Reserve Banks taking turns as emergency
recipients or providers of gold. Payment imbalances never grew endlessly, instead
narrowing once liquidity shocks had subsided, with half of the effect of a typical
shock to interdistrict accommodation dissipating after about five quarters. Mutual
assistance triggered tensions between regional Reserve Banks in only one noteworthy
instance, namely immediately before the bank holiday proclaimed by President
Roosevelt in March 1933. As a counterexample, this suggests that cooperation
between regional Reserve Banks was essential to the cohesion and stability of the US
monetary union.
These findings speak, in an obvious sense, to current discussions of
TARGET2 balances in Europe. That mutual assistance between Reserve Banks was
common during liquidity crises and bank runs suggests that the increase in TARGET2
balances since the outbreak of the global economic and financial crisis is not
exceptional but, rather, a normal concomitant of the operation of a cohesive monetary
union. That fortunes could change quickly, with earlier gold recipients turning
subsequently into gold providers indicates that the notion of “core” or “periphery”
regions within a monetary union is not necessarily carved in stone. Countries that
accumulate TARGET2 credits in one period may find themselves to be TARGET2
debtors in another, if this history is a guide. The fact that imbalances tended to narrow
once liquidity shocks subsided is at variance with concerns expressed that TARGET2
imbalances could grow endlessly or to an extent such as to put the stability of
Economic and Monetary Union at risk. That mutual assistance left the US public
largely unmoved and hardly triggered tensions between US regions suggests that there
is no reason that a dispassionate debate in Europe on TARGET2 balances could not
be possible. And that cooperation between regional Reserve Banks was essential to
the cohesion of US monetary union and its stability indicates that maintaining such
cooperation spirit is essential in the euro area.

23
References
Afonso, G., A. Kovner and A. Schoar (2011), “Stressed, not Frozen: The Federal
Funds Market in the Financial Crisis”, Journal of Finance, 66(4), pp. 1109-1139.
Alesina, A., I. Angeloni and F. Etro (2005), “International Unions”, American
Economic Review, 95(3), pp. 602-615.
Allen, F. and D. Gale (2000), “Financial Contagion”, Journal of Political Economy,
108(1), pp. 1-33.
Alston, L., W. Grove and D. Wheelock (1994), “Why Do Banks Fail? Evidence from
the 1920s,” Explorations in Economic History, 31, pp. 409-431.
Auer, R. (2014), “What Drives Target2 Balances? Evidence from a Panel Data
Analysis”, Economic Policy, 29, pp. 139-197.
Bech, M. and E. Atalay (2010), “The topology of the federal funds market”, Physica
A: Statistical Mechanics and its Applications, 389(22), pp. 5223-5246.
Bernanke, B. (1983), “Nonmonetary Effects of the Financial Crisis in the Propagation
of the Great Depression”, American Economic Review, 73(3), pp. 257-276.
Biljsma, M. and J. Lukkezen (2012), “Why is There No Target2 Debate in the US?”
Bruegel, 3 April 2012.
Bindseil, U. and P. J. König (2011), “The Economics of Target2 Balances”, SFB 649
Discussion Paper, 2011-035, Humboldt University.
Bindseil, U. and A. Winkler (2012), “Dual Liquidity Crises under Alternative
Monetary Frameworks: a Financial Accounts Perspective”, ECB Working Paper,
No. 1478, October 2012, Frankfurt am Main.
Bindseil, U. and A. Winkler (2013), “Dual Liquidity Crises under the Gold Standard
and in a Monetary Union: a Financial Accounts Perspective”, mimeo, February
2013.
Bindseil, U., P. Cour-Thimann and P. König (2012), “Target2 and Cross-Border
Interbank Payments during the Financial Crisis”, CESifo Forum, 13, Special Issue
January 2012, pp. 83-92.
Board of Governors of the Federal Reserve System (1920), 6th Annual Report –
Covering Operations for the Year 1919, Washington DC,
http://fraser.stlouisfed.org/publication/?pid=117&tid=58.
Board of Governors of the Federal Reserve System (1921), 7th Annual Report –
Covering Operations for the Year 1920, Washington DC,
http://fraser.stlouisfed.org/docs/publications/arfr/1920s/arfr_1920.pdf.
Board of Governors of the Federal Reserve System (1922), Federal Reserve Bulletin,
January 1922, Washington D.C., http://fraser.stlouisfed.org/docs/publications/FRB
/1920s/frb_011922.pdf.
Board of Governors of the Federal Reserve System (1934), 20th
Annual Report –
Covering Operations for the Year 1933, Washington DC,
http://fraser.stlouisfed.org/docs/publications/arfr/1930s/arfr_1933.pdf.
24
Board of Governors of the Federal Reserve System (1946), 33rd
Annual Report –
Covering Operations for the Year 1946, Washington DC,
https://fraser.stlouisfed.org/docs/publications/arfr/1940s/arfr_1946.pdf.
Board of Governors of the Federal Reserve System (2012), Financial Accounting
Manual for Federal Reserve Banks, Revision Set 53, December 2012, Washington
D.C.
Bordo, M. (2014), “TARGET balances, Bretton Woods, and the Great Depression”,
Vox, 21 March 2014.
Bordo, M. and H. James (2013), “The European Crisis in the Context of the History
of Previous Financial Crises”, NBER Working Paper, No. 19112, June 2013.
Bordo, M. and H. Rockoff (2013), “Not Just the Great Contraction: Friedman and
Schwartz’s A Monetary History of the United States: 1867 to 1960”, American
Economic Review, Papers and Proceedings, 103(3), pp. 61-65.
Brown, W. (1940), The International Gold Standard Reinterpreted: 1914-1934, New
York: NBER.
Buiter, W., R. Rahbari and J. Michels (2011), “The Implications of Intra-Euro Area
Imbalances in Credit Flows”, CEPR Policy Insight, No. 57, August 2011.
Cechetti, S., R. McCauley and P. McGuire (2012), “Interpreting TARGET2
balances”, BIS Working Paper, No. 393, December 2012.
Cour-Thimann, P. (2013), “Target Balances and the Crisis in the Euro Area”, CESifo
Forum, Special Issue, vol. 14, April 2013.
De Grauwe, P. and Y. Ji (2012), “How Germany Can Avoid Wealth Losses if the
Eurozone Breaks up: Limit Conversion to German Residents”, Vox, 18 September
2012.
Eichengreen, B. (1992), Golden Fetters, The Gold Standard and the Great
Depression: 1919-1939, Oxford: Oxford University Press.
Eichengreen, B. (2012), “Is Europe on a Cross of Gold?” Project Syndicate, 11 May
2012.
Eichengreen, B. and P. Temin, (2010), “Fetters of Gold and Paper”, Oxford Review of
Economic Policy, 26(3), pp. 370-384.
European Central Bank (2011), “TARGET2 Balances of National Central Banks in
the Euro Area”, Monthly Bulletin, October 2011, Frankfurt: European Central
Bank, pp. 35-40.
European Central Bank (2013), “TARGET2 Balances and Monetary Policy
Operations”, Monthly Bulletin, April 2013, Frankfurt: European Central Bank, pp.
103-114.
Fand, D. and I. O. Scott (1958), “The Federal Reserve System's ‘Bills Only’ Policy: A
Suggested Interpretation”, Journal of Business, 31(1), pp. 12-18.
Federal Open Market Committee (1975), “Memo of Discussion, meeting 14-
15/04/75,”
http://www.federalreserve.gov/monetarypolicy/files/fomcmod19750415.pdf.
25
Federal Reserve Bank of Boston (1926), 11th
Annual Report of the Federal Reserve
Bank of Boston for the year ended 31 December 1925, Boston,
http://fraser.stlouisfed.org/docs/historical/frbbos/1925_frb_boston.pdf.
Federal Reserve Bank of New York (1947), 32nd
Annual Report of the Federal
Reserve Bank of New York for the year ended 31 December 1946, New York,
https://fraser.stlouisfed.org/docs/historical/frbny/1946_frb_newyork.pdf.
Federal Reserve Bank of New York (1949), 34th Annual Report of the Federal
Reserve Bank of New York for the year ended 31 December 1948, New York,
http://fraser.stlouisfed.org/docs/historical/frbny/1948_frb_newyork.pdf.
Flood, M. (1998), United States Historical Data on bank market structure, ICPSR
version. Montreal, Quebec: Mark D. Flood, Concordia University [producer],
1998. Ann Arbor, MI: Inter-university Consortium for Political and Social
Research [distributor], 1998. doi:10.3886/ICPSR02393.v1.
Freixas, X., B. Parigi and J. C. Rochet (2000), “Systemic Risk, Interbank Relations,
and Liquidity Provision by the Central Bank”, Journal of Money, Credit and
Banking, 32(3), pp. 611-638.
Friedman, M. and A. J. Schwartz (1963), A Monetary History of the United States,
1867-1960, NBER, Studies in Business Cycles, Vol. 12, Princeton: Princeton
University Press.
Furfine, C. (1999), “The Microstructure of the Federal Funds Market”, Financial
Markets, Institutions & Instruments, 8(5), pp. 24-44.
Garber, P. (1999), “The Target Mechanism: Will it Propagate or Stifle a Stage III
Crisis?” Carnegie-Rochester Conference Series on Public Policy, 51(1), pp. 195-
220.
Garber, P. (2010), “The Mechanics of Intra Euro Capital Flight”, Deutsche Bank,
Economics Special Report, 10, December 2010.
Goodhart, C. (1969), The New York Money Market and the Finance of Trade, 1990-
1913, Cambridge, Mass.: Harvard University Press.
Hackley, H. (1973), Lending Functions of the Federal Reserve Banks – A History,
Board of Governors of the Federal Reserve System, Washington DC.
Hetzel, R. (2008), The Monetary Policy of the Federal Reserve, Cambridge:
Cambridge University Press.
IMF (2012a), “New Setbacks, Further Policy Action Needed”, World Economic
Outlook, July 2012 Update, Washington D.C.
IMF (2012b), Global Financial Stability Report, October 2012, Washington D.C.
IMF (2013), G20 Note on Global Prospects and Policy Changes, 15-16 February
2013, Washington D.C.
James, F. (1938), The Growth of Chicago Banks, New York: Harper & Brothers.
James, H. (2013), “Designing a Federal Bank”, Vox, 18 February 2013.
Jones, M. and M. Obstfeld (1997), “Saving, investment and gold: a reassessment of
historical current account data”, NBER Working Paper, No. 6103.

26
Kennedy, S. (1973), The Banking Crisis of 1933, Lexington: University Press of
Kentucky.
Koning, J. P. (2012), “The Idiot's Guide to the Federal Reserve Interdistrict
Settlement Account”, 5 February 2012, http://jpkoning.blogspot.ca/2012/02/idiots-
guide-to-federal-reserve.html
Lane, P. (2013), “Capital Flows in the Euro Area”, Economic Papers, No. 497, April
2013.
Lane, P. and G. Milesi-Ferretti (2012), “External Adjustment and the Global Crisis”,
Journal of International Economics, 88(2), pp. 252-265.
McCalmont, D. (1960), Redistribution of gold reserves among Federal Reserve
banks, PhD Dissertation, Johns Hopkins University.
McCalmont, D. (1963), The sharing of gold reserves among Federal Reserve banks,
Columbus, Ohio State University.
Meltzer, A. (2003), A History of the Federal Reserve, Volume 1: 1913-1951,
Chicago: Chicago University Press.
Meltzer, A. (2009a), A History of the Federal Reserve, Volume 2 – Book 1: 1951-
1969, Chicago: Chicago University Press.
Meltzer, A. (2009b), A History of the Federal Reserve, Volume 2 – Book 2: 1970-
1985, Chicago: Chicago University Press.
Meltzer, A. (2013), “What’s Wrong with the Fed: What Would Restore
Independence?” Cato Journal, 33(3), pp. 401-416.
Milesi-Ferretti, G. M. and C. Tille (2011), “The Great Retrenchment: International
Capital Flows during the Global Financial Crisis”, Economic Policy, 26(66), pp.
285-342.
McKinnon, R. (1963), “Optimum Currency Areas”, American Economic Review,
53(4), pp. 717-725.
Mitchener, K. and G. Richardson (2013), “Shadowy Banks and Financial Contagion
during the Great Depression: A Retrospective on Friedman and Schwartz”,
American Economic Review, Papers and Proceedings, 103(3), pp. 73-78.
Mody, A. and F. Bornhorst (2012), “Target Imbalances: Financing the Capital
Account Reversal in Europe”, Vox, 7 March 2012.
Mundell, R. (1961), “A Theory of Optimum Currency Areas”, American Economic
Review, 51(4), pp. 657-665.
Nadler, M. and J. Bogen (1933), The Banking Crisis: the End of an Epoch, New
York: Dodd, Mead & Co.
Oates, W. (1972), Fiscal Federalism, New York: Harcourt Brace Jovanovich.
O’Rourke, K. and A. Taylor (2013), “Cross of Euros”, Journal of Economic
Perspectives, 27(3), pp. 167-192.
Paris, J. (1938), Monetary Policies of the United States, 1932-1938, Columbia
University Press.
27
Pesenti, P. (2012), “Discussion of Tornell, ECB-Fed-New York Fed Global Research
Forum on International Macroeconomics, 17-18 December 2012,” Frankfurt am
Main.
Reed, H. (1922), The Development of Federal Reserve Policy, Houghton Mifflin
Company, Boston, New York, http://archive.org/details/developmentoffed01reed.
Schubert, M. and B. Weidensteiner (2012), “Can the US Provide an Example of How
to Limit Target2 Balances?” Economic Insight, Economic Research,
Commerzbank.
Sinn, H. W. (2011), “The ECB’s Secret Bailout Strategy”, Project Syndicate, 29 April
2011.
Sinn, H. W. (2012a), “Fed vs. ECB: How Target Debts Can Be Repaid”, Vox, 10
March 2012.
Sinn, H. W. (2012b), “Target Losses in Case of a Euro Break-up”, CESifo Working
Paper, No. 3968, October 2012.
Sinn, H. W. (2012c), Die Target Falle, Munich: Hanser.
Sinn, H. W. and T. Wollmershäuser (2012), “Target Loans, Current Account Balances
and Capital Flows: the ECB’s Rescue Facility”, International Tax and Public
Finance, 19(4), pp. 468-508
Temin, P. and B. Wigmore (1990), “The End of One Big Deflation”, Explorations in
Economic History, 27(4), pp. 483-502.
Thimann, C. (2013), “A Single European Supervisory System Will Fill Information
Gap”, Financial Times, 10 January 2013.
Tornell, A. (2012), “The Eurozone: the Sudden-Stop that Wasn’t and Target2
Imbalances”, mimeo, UCLA, November 2012.
Tornell, A. and F. Westermann (2012), “The Tragedy of the Commons at the
European Central Bank and the Next Rescue”, Vox, 22 June 2012.
Werning, I. and E. Farhi (2012), “Fiscal Unions”, NBER Working Paper, No. 18280.
Whelan, K. (2014), “TARGET2 and Central Bank Balance Sheets”, Economic Policy,
29, pp. 79-137.
Wigmore, B. (1987), “Was the Bank Holiday of 1933 Caused by a Run on the
Dollar?” Journal of Economic History, 47(3), pp. 739-755.
Wolman, A. (2013), “Federal Interdistrict Settlement”, Economic Quarterly, Federal
Reserve Bank of Richmond, 99(2), pp. 117-141.
Willis, H. (1923), The Federal Reserve System, Blackstone Legal Training Lecture,
http://www.archive.org/stream/federalreservesy00williala#page/22/mode/2up.

28
Figure 1: Interdistrict accommodation operations in 1920-1921
Note: The figure shows the evolution of the outstanding amount (in USD million) of the interdistrict accommodation operations undertaken by each of the 12 Federal Reserve districts between 1920 and 1920, as published in 1922 by the Federal Reserve Board (see Board of Governors of the Federal Reserve System, 1922, p. 28). Negative figures indicate districts that are net recipients of gold; positive figures indicate districts that are net providers of gold.

29
Figure 2: Interdistrict accommodation operations – 1913-1960
(Bre
akd
ow
n b
y dis
tric
t)
-1-.50.51Accommodation (% US GDP)
192
0
193
0
194
0
195
0
196
0
Atla
nta
Bo
sto
n
Chic
ag
oC
leve
land
Dalla
sK
ansa
s C
ity
Min
ne
ap
olis
New
Yo
rk
Ph
ilad
elp
hia
Ric
hm
ond
Sa
n F
rancis
co
St L
ou
is
No
te:
Th
e fi
gure
sh
ow
s th
e ev
olu
tio
n o
f th
e o
uts
tandin
g a
mo
unt
(sca
led
by
US
GD
P)
of
inte
rdis
tric
t ac
com
mo
dat
ion o
per
atio
ns
und
erta
ken
ov
er t
he
per
iod
19
13Q
4-1
95
9Q
4.
Am
ou
nts
are
bro
ken
do
wn
by
Fed
eral
Res
erv
e dis
tric
t an
d t
yp
e (i
.e.
wh
eth
er a
dis
tric
t w
as a
net
rec
ipie
nt
(neg
ativ
e fi
gu
res)
or
net
pro
vid
er (
po
siti
ve
figu
res)
of
gold
).
Cu
mu
late
d f
low
s p
er q
uar
ter
are
sho
wn
fo
r th
e p
erio
d 1
91
6-1
91
8 a
nd
19
22
-19
26 a
s st
ock
dat
a w
ere
no
t av
aila
ble
.

30
Figure 3: Episodes of exceptional interdistrict accommodation
Po
st W
orld
War
I slu
mp
Gre
at D
ep
ressio
nW
orld
War
II d
isru
ptio
ns
0.2.4.6.8% of US GDP
192
01
93
01
94
01
95
01
96
0
To
tal in
terd
istr
ict acco
mm
od
atio
nT
hre
sh
old
pre
-19
36
Th
resh
old
po
st-
193
6
No
te:
Th
e fi
gure
sh
ow
s th
e ev
olu
tio
n o
f th
e to
tal
vo
lum
e (s
cale
d b
y U
S G
DP
) o
f ac
com
mo
dat
ion
oper
atio
ns
join
tly u
nd
erta
ken
by t
he
12
Fed
eral
Res
erv
e dis
tric
ts a
long
wit
h t
he
stat
isti
cal
thre
shold
s u
sed
to
id
enti
fy e
pis
od
es o
f ac
com
mo
dat
ion
of
exce
pti
on
al m
agn
itude.
Th
e la
tter
are
def
ined
as
qu
arte
rs i
n w
hic
h t
ota
l ac
com
mo
dat
ion
exce
eded
its
sam
ple
mea
n b
y o
ne
stan
dar
d d
evia
tio
n p
re-1
93
6 a
nd
po
st-1
93
6,
resp
ecti
vel
y (
trun
cati
ng
th
e sa
mp
le i
s m
ean
t to
acc
oun
t fo
r th
e d
ispla
cem
ent
of
redis
counti
ng
b
y (
re)a
llo
cati
on
s as
th
e p
rem
ier
mea
ns
of
shar
ing
gold
res
erv
es b
etw
een
reg
ion
al R
eser
ve
Ban
ks
in 1
936
).
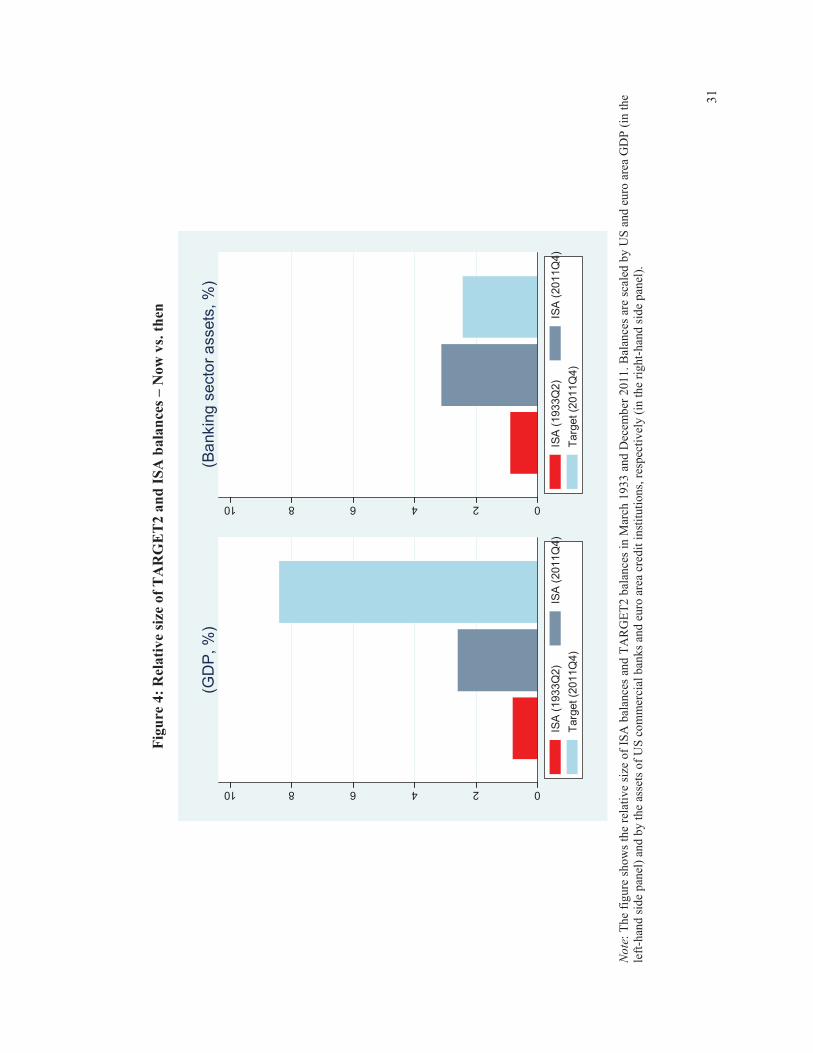
31
Figure 4: Relative size of TARGET2 and ISA balances – Now vs. then
0246810
(GD
P, %
)
ISA
(1933Q
2)
ISA
(2011Q
4)
Targ
et (2
011Q
4)
0246810
(Ba
nkin
g s
ecto
r a
ssets
, %
)
ISA
(1933Q
2)
ISA
(2011Q
4)
Targ
et (2
011Q
4)
No
te:
Th
e fi
gure
sh
ow
s th
e re
lati
ve
size
of
ISA
bal
ance
s an
d T
AR
GE
T2 b
alan
ces
in M
arch
193
3 a
nd
Dec
emb
er 2
011
. B
alan
ces
are
scal
ed b
y U
S a
nd e
uro
are
a G
DP
(in
th
e le
ft-h
and
sid
e p
anel
) an
d b
y t
he
asse
ts o
f U
S c
om
mer
cial
ban
ks
and
eu
ro a
rea
cred
it i
nst
ituti
on
s, r
espec
tiv
ely
(in
th
e ri
ght-
han
d s
ide
pan
el).

32
Figure 5: Geography of interdistrict accommodation operations
– “Core” vs. “Periphery”
Note: The figure depicts the geographical distribution across Federal Reserve districts of interdistrict accommodation operations undertaken in the second quarter of 1920, first quarter of 1933 and second quarter of 1946. Each shade corresponds to a specific position (dark grey = districts that were gold reserve providers; light grey = districts that were gold reserve recipients; white = no active participation). Note that the map is drawn on the basis of state boundaries, which do not systematically overlap with those of Federal Reserve districts.

33
Figure 6: Histogram of interdistrict accommodation operations
(Bre
akd
ow
n b
y d
istr
ict)
0.2.4.6 0.2.4.6 0.2.4.6
-1-.
50
.5-1
-.5
0.5
-1-.
50
.5-1
-.5
0.5
Atla
nta
Bo
sto
nC
hic
ag
oC
leve
land
Da
lla
sK
ansa
s C
ity
Min
ne
apo
lis
New
Yo
rk
Ph
ila
de
lph
iaR
ichm
ond
San
Fra
ncis
co
St L
ou
is
Fraction
Inte
rdis
tric
t a
ccom
mo
da
tion
ope
ratio
ns (
% o
f U
S G
DP
)G
rap
hs b
y d
istr
ict
No
te:
Th
e fi
gure
sh
ow
s th
e d
istr
ibu
tio
n b
y s
ize
of
the
(US
GD
P-s
cale
d)
inte
rdis
tric
t ac
com
mo
dat
ion
op
erat
ion
s u
nd
erta
ken
by e
ach
of
the
12
F
eder
al R
eser
ve
dis
tric
ts d
uri
ng
th
e fu
ll s
amp
le p
erio
d (
191
3Q
1-1
959
Q4
). N
egat
ive
figu
res
ind
icat
e d
istr
icts
th
at a
re n
et r
ecip
ients
of
gold
; po
siti
ve
fig
ure
s in
dic
ate
dis
tric
ts t
hat
are
net
pro
vid
ers
of
gold
.

34
Figure 7: Extent of the relief afforded by interdistrict accommodation operations
(Bre
akd
ow
n b
y dis
tric
t of
gold
res
erve
rati
os,
%)
20406080100 20406080100 20406080100
19
40
19
50
19
60
19
40
19
50
19
60
19
40
19
50
19
60
19
40
19
50
19
60
Atla
nta
Bosto
nC
hic
ag
oC
leve
lan
d
Dalla
sK
an
sa
s C
ity
Min
nea
polis
New
York
Ph
ilad
elp
hia
Ric
hm
ond
Sa
n F
rancis
co
St L
ouis
Actu
al
Ad
juste
d
Gra
phs b
y d
istr
ict
No
te:
Th
e fi
gure
sh
ow
s th
e ev
olu
tio
n b
etw
een
1936
:Q2
and
195
9:Q
4 o
f th
e ac
tual
go
ld r
eser
ve
rati
os
of
the
12
Fed
eral
Res
erv
e b
ank
s as
wel
l as
of
the
corr
esp
ond
ing
ad
just
ed ra
tio
s, i.
e. th
e ra
tio
s w
hic
h w
ould
h
ave
pre
vai
led
h
ad th
ere
bee
n n
o in
terd
istr
ict
acco
mm
od
atio
n o
per
atio
ns
(as
calc
ula
ted
an
d r
epo
rted
in
McC
alm
on
t, 1
96
3).

35
Figure 8: Interdistrict cooperation breakdown – February-March 1933
(Go
ld r
eser
ves,
US
D m
illi
on)
12
34
02505007501000Federal Reserve Bank of New York
01/0
2/3
315/0
2/3
328/0
2/3
315/0
3/3
331/0
3/3
3
0100020003000Federal Reserve System
01/0
2/3
315/0
2/3
328/0
2/3
315/0
3/3
331/0
3/3
3
No
te:
Au
thors
’ co
mp
ilat
ion
bas
ed o
n P
aris
(19
38
), F
ried
man
and
Sch
war
tz (
1963
), M
cCal
mo
nt
(196
3),
Wig
mo
re (
198
7),
Eic
hen
gre
en (
19
92)
and
Mel
tzer
(2
003
).T
he
figure
sho
ws
the
evo
luti
on
of
the
go
ld r
eser
ves
hel
d b
y t
he
Fed
eral
Res
erv
e B
ank
of
New
Yo
rk a
nd
th
e F
eder
al R
eser
ve
syst
em b
etw
een
1
Feb
ruar
y a
nd
31
Mar
ch 1
93
3 (
mis
sin
g o
bse
rvat
ions
are
lin
earl
y i
nte
rpo
late
d)
alo
ng
wit
h f
ou
r sp
ecif
ic e
ven
ts:
(1)
the
refu
sal
on 3
Mar
ch b
y t
he
Ch
icag
o F
ed
to r
edis
coun
t se
curi
ties
fro
m t
he
New
Yo
rk F
ed (
wh
ose
res
erv
e ra
tio
sto
od
th
en a
t 25
.5%
); (
2)
the
pro
clam
atio
n b
y P
resi
den
t R
oo
sev
elt
of
a n
atio
n-w
ide
ban
k h
oli
day
on
th
e ev
enin
g o
f 5 M
arch
(b
ank
s pro
hib
ited
fro
m p
ayin
g o
ut
go
ld;
expo
rt e
mb
argo
on g
old
) an
d t
he
susp
ensi
on
of
inte
rban
k p
aym
ents
; (3
) th
e d
ecis
ion
on
7 M
arch
by
th
e F
eder
al R
eser
ve
Bo
ard
to
co
mp
el F
eder
al R
eser
ve
Ban
ks
to r
edis
cou
nt
on
beh
alf
of
the
New
Yo
rk F
ed;
(4)
the
end
of
the
nat
ion-w
ide
ban
k h
oli
day
on
15
Mar
ch.
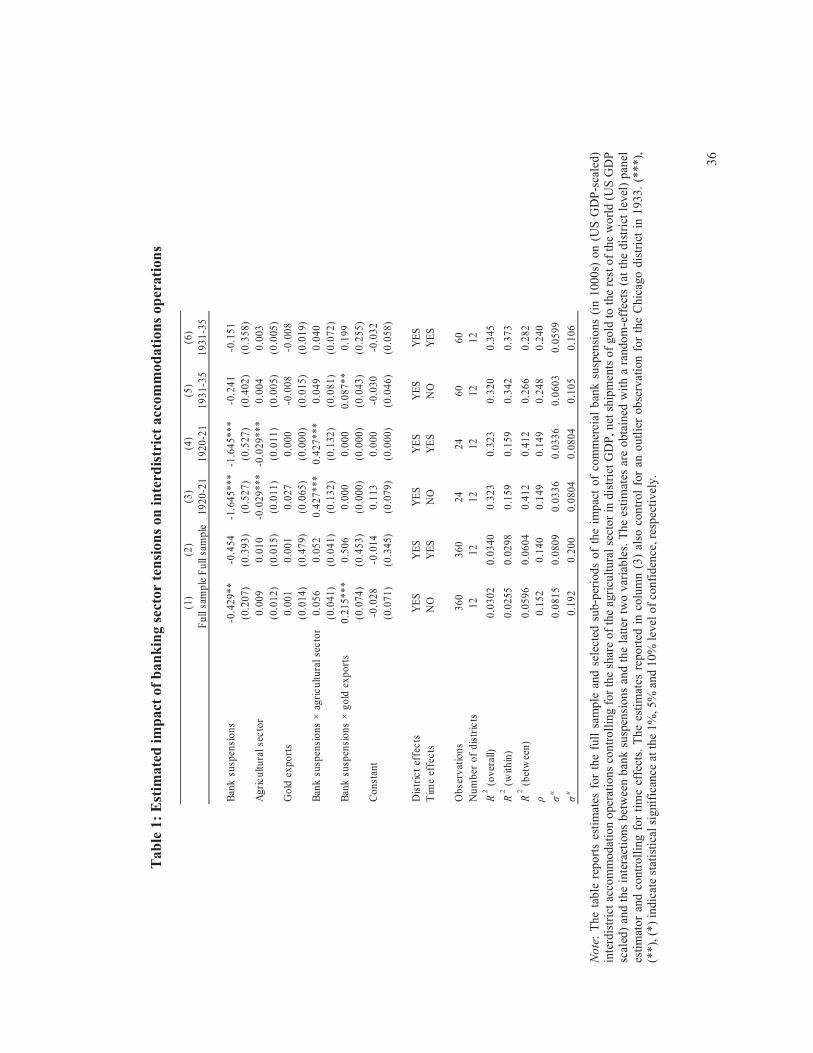
36
Table 1: Estimated impact of banking sector tensions on interdistrict accommodations operations
(1)
(2)
(3)
(4)
(5)
(6)
Fu
ll sa
mp
leF
ull
sam
ple
19
20
-21
19
20
-21
19
31
-35
19
31
-35
Ban
k s
usp
ensi
on
s-0
.42
9*
*-0
.45
4-1
.64
5*
**
-1.6
45
**
*-0
.24
1-0
.15
1
(0.2
07
)(0
.39
3)
(0.5
27
)(0
.52
7)
(0.4
02
)(0
.35
8)
Ag
ric
ult
ura
l se
cto
r0
.00
90
.01
0-0
.02
9*
**
-0.0
29
**
*0
.00
40
.00
3
(0.0
12
)(0
.01
5)
(0.0
11
)(0
.01
1)
(0.0
05
)(0
.00
5)
Go
ld e
xp
ort
s0
.00
10
.00
10
.02
70
.00
0-0
.00
8-0
.00
8
(0.0
14
)(0
.47
9)
(0.0
65
)(0
.00
0)
(0.0
15
)(0
.01
9)
Ban
k s
usp
ensi
on
s ×
ag
ric
ult
ura
l se
cto
r0
.05
60
.05
20
.42
7*
**
0.4
27
**
*0
.04
90
.04
0
(0.0
41
)(0
.04
1)
(0.1
32
)(0
.13
2)
(0.0
81
)(0
.07
2)
Ban
k s
usp
ensi
on
s ×
go
ld e
xp
ort
s0
.21
5*
**
0.5
06
0.0
00
0.0
00
0.0
87
**
0.1
99
(0.0
74
)(0
.45
3)
(0.0
00
)(0
.00
0)
(0.0
43
)(0
.25
5)
Co
nst
ant
-0.0
28
-0.0
14
0.1
13
0.0
00
-0.0
30
-0.0
32
(0.0
71
)(0
.34
5)
(0.0
79
)(0
.00
0)
(0.0
46
)(0
.05
8)
Dis
tric
t ef
fec
tsY
ES
YE
SY
ES
YE
SY
ES
YE
S
Tim
e ef
fec
tsN
O
YE
SN
OY
ES
NO
YE
S
Ob
serv
atio
ns
36
03
60
24
24
60
60
Nu
mb
er o
f d
istr
icts
12
12
12
12
12
12
R2 (
ov
eral
l)0
.03
02
0.0
34
00
.32
30
.32
30
.32
00
.34
5
R2 (
wit
hin
)0
.02
55
0.0
29
80
.15
90
.15
90
.34
20
.37
3
R2 (
bet
wee
n)
0.0
59
60
.06
04
0.4
12
0.4
12
0.2
66
0.2
82
0.1
52
0.1
40
0.1
49
0.1
49
0.2
48
0.2
40
0.0
81
50
.08
09
0.0
33
60
.03
36
0.0
60
30
.05
99
u0
.19
20
.20
00
.08
04
0.0
80
40
.10
50
.10
6
No
te:
Th
e ta
ble
rep
ort
s es
tim
ates
fo
r th
e fu
ll s
amp
le a
nd
sel
ecte
d s
ub
-per
iod
s of
the
imp
act
of
com
mer
cial
ban
k s
usp
ensi
on
s (i
n 1
000s)
on (
US
GD
P-s
cale
d)
inte
rdis
tric
t ac
com
mo
dat
ion
op
erat
ion
s co
ntr
oll
ing f
or
the
shar
e of
the
agri
cult
ura
l se
ctor
in d
istr
ict
GD
P,
net
ship
men
ts o
f gold
to
the
rest
of
the
wo
rld
(U
S G
DP
sc
aled
) an
d t
he
inte
ract
ion
s bet
wee
n b
ank
su
spen
sions
and t
he
latt
er t
wo
var
iab
les.
Th
e es
tim
ates
are
ob
tain
ed w
ith
a r
ando
m-e
ffec
ts (
at t
he
dis
tric
t le
vel
) p
anel
es
tim
ato
r an
d c
ontr
oll
ing
fo
r ti
me
effe
cts.
Th
e es
tim
ates
rep
ort
ed i
n c
olu
mn (
3)
also
contr
ol
for
an o
utl
ier
ob
serv
atio
n f
or
the
Chic
ago
dis
tric
t in
193
3.
(**
*),
(*
*),
(*
) in
dic
ate
stat
isti
cal
sig
nif
ican
ce a
t th
e 1
%, 5
% a
nd 1
0%
lev
el o
f co
nfi
den
ce, re
spec
tiv
ely
.

37
Table 2: Interdistrict accommodation operations – Selected descriptive statistics
Federal Reserve
district
Mean Median Standard
deviation
Skewness Kurtos is
Atlanta 0.008 0.000 0.040 1.458 *** 6.038 ***
Boston -0.030 -0.005 0.058 -0.524 *** 2.233 ***
Chicago 0.127 0.015 0.168 0.441 ** 1.545 ***
Cleveland -0.021 -0.002 0.064 -0.032 2.511
Dallas 0.000 0.000 0.024 -0.261 5.370 ***
Kansas City -0.010 -0.002 0.027 -0.030 2.592
Minneapolis -0.010 -0.002 0.025 0.354 * 6.055 ***
New York -0.035 0.000 0.230 -1.811 *** 6.480 ***
Philadelphia -0.003 0.000 0.035 0.197 2.535
Richmond 0.014 0.008 0.040 1.547 *** 5.722 ***
San Francisco 0.030 0.010 0.061 1.551 *** 6.347 ***
St Louis -0.003 0.000 0.032 -0.079 2.655
Note: The table reports selected descriptive statistics on the outstanding amounts (scaled by US GDP) of interdistrict accommodation operations undertaken by each of the 12 Federal Reserve districts over the period 1913-1959. (***), (**), (*) indicate statistical significance at the 1%, 5% and 10% level of confidence, respectively.
Table 3: Estimates of persistence effects in the dynamics
of interdistrict accommodation operations
(1) (2) (3) (4) (5) (6)
All sample Pre-1936 Post-1936 All sample Pre-1936 Post-1936
Lagged accommodation 0.878*** 0.150 0.930*** 0.879*** 0.390*** 0.884***
(0.052) (0.135) (0.032) (0.020) (0.088) (0.019)
Constant 0.032** 0.062*** 0.031** 0.000 0.000 0.001
(0.013) (0.017) (0.012) (0.003) (0.005) (0.002)
Observations 175 79 96 1,680 552 1,128
Log likelihood 127.7 55.40 112.8 2909 1241 1825
Number of dis tricts 12 12 12
R2 (overall) 0.770 0.022 0.891 0.808 0.204 0.832
R2 (within) 0.772 0.151 0.782
R2 (between) 1.000 0.997 1.000
0.0172 0.0504 0.0269
0.00576 0.00601 0.00812u
0.0435 0.0261 0.0488
Time series estimates Panel estimates
Note: The table reports estimates of persistence effects in the dynamics of interdistrict accommodation operations. Columns (1) to (3) provide times series estimates obtained when the total volume of accommodation (shown in Figure 2) is regressed on its lag and a constant. Columns (4) to (6) provide panel estimates obtained when the net accommodation received by each of the 12 Federal Reserve districts is regressed on its lag, a constant as well as fixed and time effects. The estimates are obtained using the full sample period (i.e. 1913Q1-1959Q4). The standard errors reported are robust to heteroskedasticity. (***), (**), (*) indicate statistical significance at the 1%, 5% and 10% level of confidence, respectively.

38
Annex I: Regional payment imbalances in the global economic and financial
crisis – Euro area vs. US
Figure A: Target balances: 1999-2013
(€ billions)
1,200
800
400
0
400
800
1,200
1999 2001 2003 2005 2007 2009 2011 2013
Spain
Slovenia
Portugal
Netherlands
Luxembourg
Italy
Ireland
Greece
Germany
France
Finland
Belgium
Sources: Euro area national central banks and Haver Analytics.
Figure B: ISA balances: 2003-2013
($ billions)
300
200
100
0
100
200
300
400
2002 2003 2004 2005 2006 2007 2008 2009 2010 2011 2012 2013
Atlanta
Boston
Cleveland
Chicago
Dallas
Kansas City
Minneapolis
New York
Philadelphia
Richmond
San Francisco
St Louis
Sources: Economic Research, Federal Reserve Bank of St Louis (http://research.stlouisfed.org/fred2).
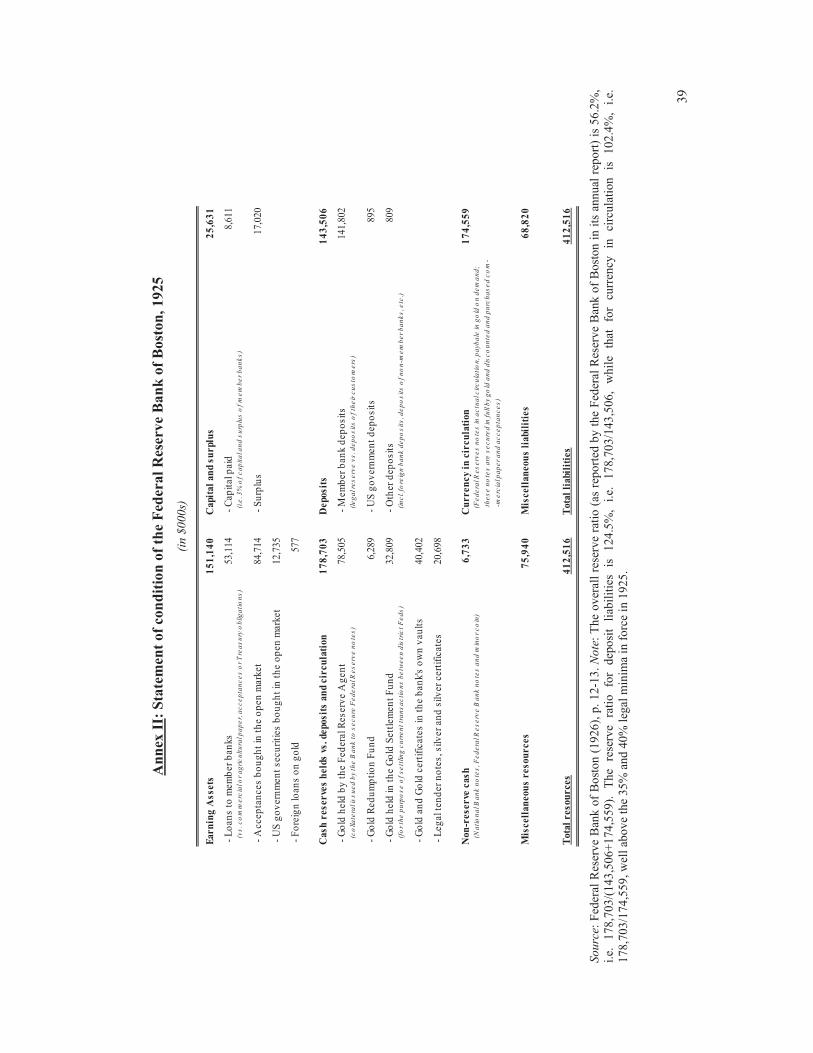
39
Annex II: Statement of condition of the Federal Reserve Bank of Boston, 1925
(in
$0
00
s)
Earning Assets
151,140
Capital and surplus
25,631
- L
oan
s to
mem
ber
ban
ks
53,1
14 -
Cap
ital
pai
d8,
611
(
vs
. co
mm
erc
ial o
r a
gri
cu
ltu
ral p
ap
er,
ac
ce
pta
nc
es
or
Tre
as
ury
ob
liga
tio
ns
)
(i.e
. 3%
of
ca
pit
al a
nd
su
rplu
s o
f m
em
be
r b
an
ks
)
- A
ccep
tan
ces
bo
ug
ht
in t
he
op
en m
arke
t84
,714
- S
urp
lus
17,
020
- U
S g
ov
ern
men
t se
cu
riti
es b
ou
gh
t in
th
e o
pe
n m
arke
t12
,735
- F
ore
ign
loan
s o
n g
old
577
Cash reserves helds vs. deposits and circulation
178,703
Deposits
143,506
- G
old
hel
d b
y t
he
Fe
der
al R
eser
ve
Ag
en
t78
,505
- M
emb
er b
ank
dep
osi
ts14
1,80
2
(c
olla
tera
l is
su
ed
by
the
Ba
nk
to
se
cu
re F
ed
era
l Re
se
rve
no
tes
)
(le
ga
l re
se
rve
vs
. de
po
sit
s o
f th
eir
cu
sto
me
rs)
- G
old
Red
um
pti
on
Fu
nd
6,
289
- U
S g
ov
ern
men
t d
epo
sits
895
- G
old
hel
d in
th
e G
old
Set
tlem
ent
Fu
nd
32,8
09 -
Oth
er d
epo
sits
809
(
for
the
pu
rpo
se
of
se
ttlin
g c
urr
en
t tr
an
sa
cti
on
s b
etw
ee
n d
istr
ict
Fe
ds
)
(in
cl.
fore
ign
ba
nk
de
po
sit
s, d
ep
os
its
of
no
n-m
em
be
r b
an
ks
, etc
.)
- G
old
an
d G
old
cer
tifi
cat
es in
th
e b
an
k's
ow
n v
ault
s40
,402
- L
egal
ten
der
no
tes, s
ilver
an
d s
ilver
cer
tifi
cate
s20
,698
Non-reserve cash
6,733
Currency in circulation
174,559
(
Na
tio
na
l Ba
nk
no
tes
, Fe
de
ral R
es
erv
e B
an
k n
ote
s a
nd
min
or
co
in)
(
Fe
de
ral R
es
erv
es
no
tes
in a
ctu
al c
irc
ula
tio
n, p
ayb
ale
in g
old
on
de
ma
nd
;
t
he
se
no
tes
are
se
cu
red
in f
ull
by
go
ld a
nd
dis
co
un
ted
an
d p
urc
ha
se
d c
om
-
-
me
rcia
l pa
pe
r a
nd
ac
ce
pta
nc
es
)
Miscellaneous resources
75,940
Miscellaneous liabilities
68,820
Total resources
412,516
Total liabilities
412,516
Sou
rce:
Fed
eral
Res
erv
e B
ank
of
Bo
sto
n (
19
26
), p
. 1
2-1
3.
Note
: T
he
ov
eral
l re
serv
e ra
tio
(as
rep
ort
ed b
y t
he
Fed
eral
Res
erv
e B
ank
of
Bost
on
in
its
an
nu
al r
epo
rt)
is 5
6.2
%,
i.e.
1
78
,703/(
143
,50
6+
17
4,5
59
).
Th
e re
serv
e ra
tio
fo
r d
epo
sit
liab
ilit
ies
is
124
.5%
, i.
e.
17
8,7
03/1
43
,506
, w
hil
e th
at
for
curr
ency
in
ci
rcu
lati
on
is
102
.4%
, i.
e.
178
,70
3/1
74
,55
9, w
ell
abo
ve
the
35
% a
nd
40
% l
egal
min
ima
in f
orc
e in
192
5.

40
Annex III: Data sources and transformations
This annex describes the data available from McCalmont (1963) along with the assumptions
and transformations needed to obtain quarterly amounts outstanding of interdistrict
accommodation operations undertaken by the 12 Federal Reserve Banks between 1913:Q4
and 1959:Q4.
1916: McCalmont reports detailed data on monthly participation by Federal Reserve Banks in
open-market purchases of acceptances made by the Boston and New York Federal Reserve
Banks but without specifying whether these data were stocks or flows. To err on the cautious
side, we assumed that these were flow data and cumulated monthly participations within each
quarter to obtain estimates of the corresponding stocks (as noted before, these are imperfect
estimates given that the residual maturities of the underlying securities could vary).59 In so
doing, we further assumed that gold provided to the Federal Reserve Banks of New York and
Boston originated uniformly from other regional Reserve Banks.
1917: As in 1916, McCalmont provides detailed data on monthly participations by Federal
Reserve Banks in open market purchases of acceptances made by the Boston and New York
Reserve Banks, as well as data on re-rediscounts and purchases of acceptances for that year.
To the first category of data, we apply the same transformation as in 1916. For the second
category, we assume a residual security maturity of three months (in line with McCalmont’s
observation that this was the typical maturity of bankers’ acceptances at the time) and
estimated quarterly amounts outstanding by dividing by four the (posited) annual stock of re-
discounts and purchases of acceptances.
1918: More complete data are available, including records of daily and monthly flows,
together with the identity of the Federal Reserve Banks involved in these transactions. To
transform flow data into stocks, we cumulated monthly flows within each quarter to obtain
rough estimates of the corresponding stocks (subject to the caveat noted before).
1919: Outstanding accommodation operations provided and received by each Federal
Reserve Bank are available as stocks at a monthly frequency. We took March, June,
September and December observations as our estimates of quarterly amounts outstanding of
interdistrict accommodation operations.
1920-1921: McCalmont (1963, p. 149) indicates that “the published information is in most
respects so satisfactory and complete that we need only reproduce it here exactly as it
appeared in the Federal Reserve Bulletin vol. 8, Jan. 1922, pp. 27-31”. The reported
outstanding amounts are monthly. We therefore took March, June, September and December
observations as our estimates of quarterly amounts outstanding of interdistrict
accommodation operations.
59 Note that the implicit assumption made is that securities have a residual maturity of three months in the first month of a given quarter, against two months in the second month and one month in the last month.
41
1922-1923: The volume of interdistrict accommodation in these years appears to have been
smaller than in 1920-1921. The Board appears to have compiled or preserved less
information as a result. Flow data are available only on an annual basis and only for
accommodation providers. We divided these annual flow data by four to obtain a rough
estimate of quarterly data. Federal Reserve districts unidentified as accommodation providers
were considered as recipient of accommodation, again assuming a uniform distribution.
1924-1926: Based on the information in McCalmont (Table 4, p. 164) on providers and
recipients of accommodation, we assumed that throughout 1924 the Cleveland, Minneapolis,
Kansas and Dallas districts were providers of gold and other districts were recipients. There
was limited information with which to identify providers of gold for 1925 and 1926. As for
1922-23, Federal Reserve districts not identified as accommodation providers were classified
as recipient of accommodation, again assuming a uniform distribution.
1927-1930: McCalmont notes that there were no-rediscounts in this period. Whether any
accommodation by means of interbank purchases of acceptances or government securities
occurred is not known (McCalmont, 1963, p. 1965).
1931-1935: Snapshots of stock data on interdistrict accommodation operations as of selected
months (e.g. November 1931) or date (e.g. 7 March 1933) appear in Board letters and
memoranda. We assigned these amounts to the quarter to which they refer. There is no record
of accommodations between November 1931 and April 1932 (McCalmont concludes that
“very likely they were none”).
1936-1959: Quarterly stock data on (re)allocations are readily available from the Board and
require no additional transformation. The data reported by McCalmont between 1944 and
1959 may slightly underestimate or overestimate actual interdistrict operations, since the sum
of all the providers’ and recipients’ positions do not net out (accounting for roughly 10-25%
of their cumulated amount in absolute terms).
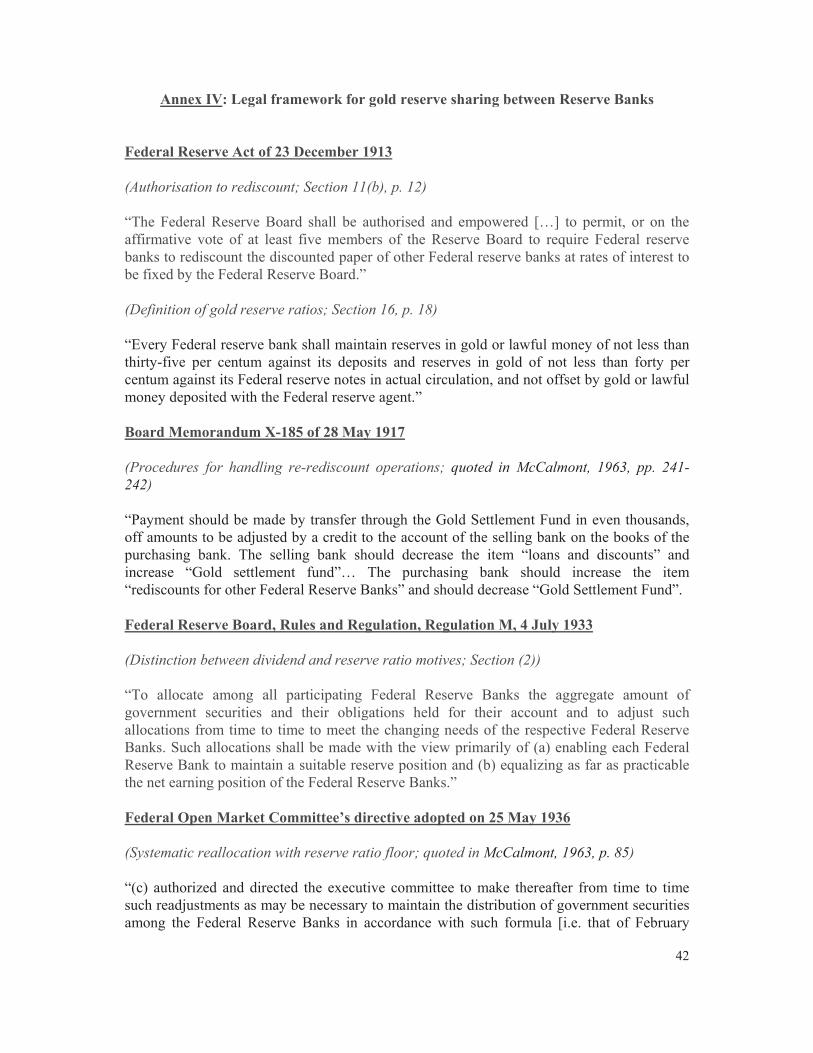
42
Annex IV: Legal framework for gold reserve sharing between Reserve Banks
Federal Reserve Act of 23 December 1913
(Authorisation to rediscount; Section 11(b), p. 12)
“The Federal Reserve Board shall be authorised and empowered […] to permit, or on the
affirmative vote of at least five members of the Reserve Board to require Federal reserve
banks to rediscount the discounted paper of other Federal reserve banks at rates of interest to be fixed by the Federal Reserve Board.”
(Definition of gold reserve ratios; Section 16, p. 18)
“Every Federal reserve bank shall maintain reserves in gold or lawful money of not less than thirty-five per centum against its deposits and reserves in gold of not less than forty per centum against its Federal reserve notes in actual circulation, and not offset by gold or lawful
money deposited with the Federal reserve agent.”
Board Memorandum X-185 of 28 May 1917
(Procedures for handling re-rediscount operations; quoted in McCalmont, 1963, pp. 241-
242)
“Payment should be made by transfer through the Gold Settlement Fund in even thousands, off amounts to be adjusted by a credit to the account of the selling bank on the books of the
purchasing bank. The selling bank should decrease the item “loans and discounts” and increase “Gold settlement fund”… The purchasing bank should increase the item “rediscounts for other Federal Reserve Banks” and should decrease “Gold Settlement Fund”.
Federal Reserve Board, Rules and Regulation, Regulation M, 4 July 1933
(Distinction between dividend and reserve ratio motives; Section (2))
“To allocate among all participating Federal Reserve Banks the aggregate amount of
government securities and their obligations held for their account and to adjust such allocations from time to time to meet the changing needs of the respective Federal Reserve Banks. Such allocations shall be made with the view primarily of (a) enabling each Federal
Reserve Bank to maintain a suitable reserve position and (b) equalizing as far as practicable the net earning position of the Federal Reserve Banks.”
Federal Open Market Committee’s directive adopted on 25 May 1936
(Systematic reallocation with reserve ratio floor; quoted in McCalmont, 1963, p. 85)
“(c) authorized and directed the executive committee to make thereafter from time to time such readjustments as may be necessary to maintain the distribution of government securities
among the Federal Reserve Banks in accordance with such formula [i.e. that of February

43
1935]: provided that if at any time the reserve ratio of any Federal Reserve Bank should fall below 50% or would be reduced below 50% by reason of the operation of such formula, the
executive committee shall make such readjustments in the allotments as shall be necessary to raise the reserve ratio of such bank to 50% by allocating the necessary amount of securities to
the other Federal Reserve Banks in accordance with the formula”.
Minutes of the Federal Open Market Committee meeting on 14-15 April 1975
(Switch to annual settlement of interdistrict payment imbalances, p. 41)
“It was recommended that the clearings be effected through the use of inter-office accounts
among the Federal Reserve Banks that would be settled once each year by increasing or decreasing each Bank's holdings of securities. That approach would obviate the need for monthly reallocations of the System Open Market Account to equalize gold-to-note liability
ratios. The new procedure would take effect at the beginning of May, a convenient starting point since the end of April marked a coincidence of a month end and an end-of-week statement date.”