110513 tarminal · Title: 110513_tarminal Created Date: 5/13/2011 3:11:42 PM

8/13/2019 LiveNationEntertainmentInc-10Q-110513 (3).pdf
http://slidepdf.com/reader/full/livenationentertainmentinc-10q-110513-3pdf 1/69
UNITED STATES
SECURITIES AND EXCHANGE COMMISSIONWashington, D.C. 20549
____________________________________
Form 10-Q ____________________________________
x QUARTERLY REPORT PURSUANT TO SECTION 13 OR 15(d) OF THE SECURITIES EXCHANGE
ACT OF 1934
For the quarterly period ended September 30, 2013,
or
¨ TRANSITION REPORT PURSUANT TO SECTION 13 OR 15(d) OF THE SECURITIES EXCHANGE
ACT OF 1934
For the transition period from to
Commission File Number 001-32601
____________________________________
LIVE NATION ENTERTAINMENT, INC.(Exact name of registrant as specified in its charter)
____________________________________
Delaware 20-3247759
(State of Incorporation) (I.R.S. Employer Identification No.)
9348 Civic Center Drive
Beverly Hills, CA 90210(Address of principal executive offices, including zip code)
(310) 867-7000(Registrant’s telephone number, including area code)
____________________________________
Indicate by check mark whether the registrant (1) has filed all reports required to be filed by Section 13 or 15(d) of the Securities Exchange Act of 1934
during the preceding 12 months (or for such shorter period that the registrant was required to file such reports), and (2) has been subject to such filing
requirements for the past 90 days. x Yes ¨ No
Indicate by check mark whether the registrant has submitted electronically and posted on its corporate Web site, if any, every Interactive Data File
required to be submitted and posted pursuant to Rule 405 of Regulation S-T (§232.405 of this chapter) during the preceding 12 months (or for such shorter
period that the registrant was required to submit and post such files). Yes x No ¨
Indicate by check mark whether the registrant is a large accelerated filer, an accelerated filer, a non-accelerated filer, or a smaller reporting company. See
the definitions of “large accelerated filer,” “accelerated filer” and “smaller reporting company” in Rule 12b-2 of the Exchange Act.
Large accelerated filer x Accelerated filer ¨
Non-accelerated filer ¨ (Do not check if a smaller reporting company) Smaller reporting company ¨
Indicate by check mark whether the registrant is a shell company (as defined in Rule 12b-2 of the Exchange Act). ¨ Yes x No
On October 31, 2013, there were 199,291,639 outstanding shares of the registrant’s common stock, $0.01 par value per share, including 2,214,424
shares of unvested restricted stock awards and excluding 408,024 shares held in treasury.
8/13/2019 LiveNationEntertainmentInc-10Q-110513 (3).pdf
http://slidepdf.com/reader/full/livenationentertainmentinc-10q-110513-3pdf 2/69
Table of Contents
LIVE NATION ENTERTAINMENT, INC.
INDEX TO FORM 10-Q
Page
PART I—FINANCIAL INFORMATION
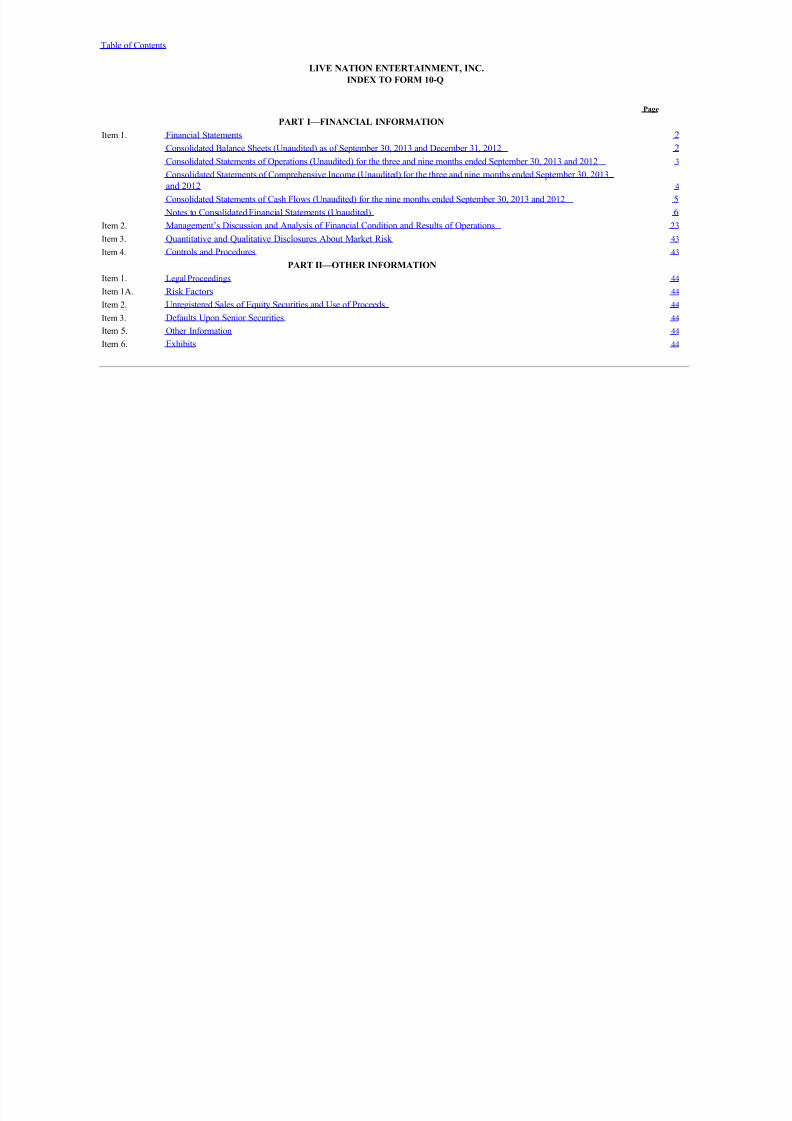
Item 1. Financial Statements 2
Consolidated Balance Sheets (Unaudited) as of September 30, 2013 and December 31, 2012 2
Consolidated Statements of Operations (Unaudited) for the three and nine months ended September 30, 2013 and 2012 3
Consolidated Statements of Comprehensive Income (Unaudited) for the three and nine months ended September 30, 2013
and 2012 4
Consolidated Statements of Cash Flows (Unaudited) for the nine months ended September 30, 2013 and 2012 5
Notes to Consolidated Financial Statements (Unaudited) 6
Item 2. Management’s Discussion and Analysis of Financial Condition and Results of Operations 23
Item 3. Quantitative and Qualitative Disclosures About Market Risk 43
Item 4. Controls and Procedures 43
PART II—OTHER INFORMATION
Item 1. Legal Proceedings 44
Item 1A. Risk Factors 44
Item 2. Unregistered Sales of Equity Securities and Use of Proceeds 44
Item 3. Defaults Upon Senior Securities 44
Item 5. Other Information 44Item 6. Exhibits 44

8/13/2019 LiveNationEntertainmentInc-10Q-110513 (3).pdf
http://slidepdf.com/reader/full/livenationentertainmentinc-10q-110513-3pdf 3/69
Table of Contents
LIVE NATION ENTERTAINMENT, INC.
GLOSSARY OF KEY TERMS
AOCI Accumulated other comprehensive income (loss)
AOI Adjusted operating income (loss)
Clear Channel Clear Channel Communications, Inc.
Company Live Nation Entertainment, Inc. and subsidiaries
FASB Financial Accounting Standards BoardGAAP United States Generally Accepted Accounting Principles
Live Nation Live Nation Entertainment, Inc., formerly known as Live Nation, Inc., and subsidiaries
Merger Merger between Live Nation, Inc. and Ticketmaster Entertainment, Inc. announced in February
2009 and consummated in January 2010
MSG The Madison Square Garden Company
SEC United States Securities and Exchange Commission
Separation The contribution and transfer by Clear Channel of substantially all of its entertainment assets
and liabilities to Live Nation
Ticketmaster For periods prior to May 6, 2010, Ticketmaster means Ticketmaster Entertainment LLC and its
predecessor companies (including without limitation Ticketmaster Entertainment, Inc.); for
periods on and after May 6, 2010, Ticketmaster means the Ticketmaster ticketing business of
the Company
TicketsNow TNow Entertainment Group, Inc.Trust Note A note issued as part of a prior acquisition to the family trust of a former executive, of which the
former executive is a co-Trustee. This note had been issued in exchange for shares of
Ticketmaster’s series A convertible redeemable preferred stock held by this trust.
1

8/13/2019 LiveNationEntertainmentInc-10Q-110513 (3).pdf
http://slidepdf.com/reader/full/livenationentertainmentinc-10q-110513-3pdf 4/69
Table of Contents
PART I—FINANCIAL INFORMATION
Item 1. Financial Statements
LIVE NATION ENTERTAINMENT, INC.
CONSOLIDATED BALANCE SHEETS
(UNAUDITED)
September 30,
2013 December 31,
2012
(in thousands)ASSETS
Current assets
Cash and cash equivalents $ 1,302,578 $ 1,001,055
Accounts receivable, less allowance of $17,240 and $19,794, respectively 578,426 415,790
Prepaid expenses 435,769 359,936
Other current assets 47,777 36,031
Total current assets 2,364,550 1,812,812
Property, plant and equipment
Land, buildings and improvements 812,685 852,175
Computer equipment and capitalized software 386,825 338,919
Furniture and other equipment 205,267 200,743
Construction in progress 59,305 56,822
1,464,082 1,448,659Less accumulated depreciation 767,079 726,873
697,003 721,786
Intangible assets
Definite-lived intangible assets, net 644,410 724,463
Indefinite-lived intangible assets 376,440 377,463
Goodwill 1,397,471 1,357,827
Investments in nonconsolidated affiliates 40,128 46,160
Other long-term assets 255,558 250,295
Total assets $ 5,775,560 $ 5,290,806
LIABILITIES AND EQUITY
Current liabilities
Accounts payable, client accounts $ 659,803 $ 557,953Accounts payable 113,385 102,718
Accrued expenses 784,761 626,723
Deferred revenue 395,763 402,002
Current portion of long-term debt 263,689 62,050
Other current liabilities 16,350 16,726
Total current liabilities 2,233,751 1,768,172
Long-term debt, net 1,540,763 1,677,955
Long-term deferred income taxes 189,496 199,596
Other long-term liabilities 92,288 94,409
Commitments and contingent liabilities
Redeemable noncontrolling interests 66,680 42,100
Stockholders’ equity
Common stock 1,973 1,877Additional paid-in capital 2,375,613 2,272,882
Accumulated deficit (869,753) (908,418)
Cost of shares held in treasury (6,865) —
Accumulated other comprehensive loss (11,261) (10,923)
Total Live Nation Entertainment, Inc. stockholders’ equity 1,489,707 1,355,418
Noncontrolling interests 162,875 153,156
Total equity 1,652,582 1,508,574
Total liabilities and equity $ 5,775,560 $ 5,290,806
See Notes to Consolidated Financial Statements

8/13/2019 LiveNationEntertainmentInc-10Q-110513 (3).pdf
http://slidepdf.com/reader/full/livenationentertainmentinc-10q-110513-3pdf 5/69
2

8/13/2019 LiveNationEntertainmentInc-10Q-110513 (3).pdf
http://slidepdf.com/reader/full/livenationentertainmentinc-10q-110513-3pdf 6/69
Table of Contents
LIVE NATION ENTERTAINMENT, INC.
CONSOLIDATED STATEMENTS OF OPERATIONS
(UNAUDITED)
Three Months Ended
September 30, Nine Months Ended
September 30,
2013 2012 2013 2012
(in thousands except share and per share data)
Revenue $ 2,262,236 $ 1,963,146 $ 4,865,447 $ 4,381,820Operating expenses:
Direct operating expenses 1,698,731 1,457,423 3,485,583 3,103,006
Selling, general and administrative expenses 325,005 283,846 900,246 832,924
Depreciation and amortization 92,729 84,684 257,582 258,656
Gain on disposal of operating assets (9,060) (60) (42,856) (255)
Corporate expenses 26,442 30,842 6 8,909 81,474
Acquisition transaction expenses 2,352 1 ,896 5,329 1,335
Operating income 126,037 104,515 190,654 104,680
Interest expense 29,393 35,535 87,585 94,733
Loss (gain) on extinguishment of debt 36,269 (460) 36,269 (460)
Interest income (1,547) (994) (4,205) (2,825)
Equity in losses (earnings) of nonconsolidated affiliates 2,363 (3,117) (2,848) (8,799)
Other expense (income), net (5,269) (6,575) 2,237 (2,933)
Income before income taxes 64,828 80,126 71,616 24,964
Income tax expense 14,410 11,950 26,370 21,456
Net income 50,418 68,176 45,246 3,508
Net income attributable to noncontrolling interests 6,644 10,228 6 ,581 7,018
Net income (loss) attributable to common stockholders of Live
Nation Entertainment, Inc. $ 43,774 $ 57,948 $ 38,665 $ (3,510)
Basic and diluted net income (loss) per common share attributable
to common stockholders of Live Nation Entertainment, Inc. $ 0.22 $ 0.31 $ 0.20 $ (0.02)
Weighted average common shares outstanding:
Basic 196,396,704 187,153,788 192,792,286 186,857,527
Diluted 202,109,783 189,754,343 197,266,289 186,857,527
See Notes to Consolidated Financial Statements
3

8/13/2019 LiveNationEntertainmentInc-10Q-110513 (3).pdf
http://slidepdf.com/reader/full/livenationentertainmentinc-10q-110513-3pdf 7/69
Table of Contents
LIVE NATION ENTERTAINMENT, INC.
CONSOLIDATED STATEMENTS OF COMPREHENSIVE INCOME
(UNAUDITED)
Three Months Ended
September 30, Nine Months Ended
September 30,
2013 2012 2013 2012
(in thousands)
Net income $ 50,418 $ 68,176 $ 45,246 $ 3,508Other comprehensive income (loss), net of tax:
Unrealized gain (loss) on cash flow hedges (22) (68) 3 (156)
Realized loss on cash flow hedges 19 — 476 —
Change in funded status of defined benefit pension plan — (202) — (202)
Foreign currency translation adjustments 40,701 29,161 (817) 20,296
Comprehensive income 91,116 97,067 44,908 23,446
Comprehensive income attributable to noncontrolling interests 6,644 10,228 6 ,581 7,018
Comprehensive income attributable to common stockholders of Live Nation
Entertainment, Inc. $ 84,472 $ 86,839 $ 38,327 $ 16,428
See Notes to Consolidated Financial Statements
4

8/13/2019 LiveNationEntertainmentInc-10Q-110513 (3).pdf
http://slidepdf.com/reader/full/livenationentertainmentinc-10q-110513-3pdf 8/69
Table of Contents
LIVE NATION ENTERTAINMENT, INC.
CONSOLIDATED STATEMENTS OF CASH FLOWS
(UNAUDITED)
Nine Months Ended
September 30,
2013 2012
(in thousands)CASH FLOWS FROM OPERATING ACTIVITIES
Net income $ 45,246 $ 3,508
Reconciling items:
Depreciation 90,443 90,789
Amortization 167,139 167,867
Deferred income tax benefit (8,230) (11,183)
Amortization of debt issuance costs and discount/premium, net 15,409 11,415
Loss (gain) on extinguishment of debt 36,269 (460)
Non-cash compensation expense 23,224 27,595
Gain on disposal of operating assets (42,856) (255)
Equity in earnings of nonconsolidated affiliates (2,848) (8,799)
Other, net 576 (364)
Changes in operating assets and liabilities, net of effects of acquisitions and dispositions: Increase in accounts receivable (129,361) (186,313)
Increase in prepaid expenses (50,432) (159,473)
Increase in other assets (94,512) (37,712)
Increase in accounts payable, accrued expenses and other liabilities 260,254 138,270
Increase (decrease) in deferred revenue (45,783) 54,154
Net cash provided by operating activities 264,538 89,039
CASH FLOWS FROM INVESTING ACTIVITIES
Distributions from nonconsolidated affiliates 13,104 6,744
Investments made in nonconsolidated affiliates (7,505) (3,212)
Purchases of property, plant and equipment (103,577) (92,372)
Proceeds from disposal of operating assets, net of cash divested 83,086 7,788
Cash paid for acquisitions, net of cash acquired (26,418) (71,256)
Purchases of intangible assets (17) (14,553)
Other, net (1,163) (943)
Net cash used in investing activities (42,490) (167,804)
CASH FLOWS FROM FINANCING ACTIVITIES
Proceeds from long-term debt, net of debt issuance costs 870,324 481,286
Payments on long-term debt (854,277) (457,487)
Contributions from noncontrolling interests 267 130
Distributions to noncontrolling interests (12,382) (9,202)
Purchases and sales of noncontrolling interests, net (75) (259)
Proceeds from exercise of stock options 80,593 926
Payments for deferred and contingent consideration (750) (10,585)
Net cash provided by financing activities 83,700 4,809
Effect of exchange rate changes on cash and cash equivalents (4,225) 13,374
Net increase (decrease) in cash and cash equivalents 301,523 (60,582)
Cash and cash equivalents at beginning of period 1,001,055 844,253
Cash and cash equivalents at end of period $ 1,302,578 $ 783,671
See Notes to Consolidated Financial Statements
5

8/13/2019 LiveNationEntertainmentInc-10Q-110513 (3).pdf
http://slidepdf.com/reader/full/livenationentertainmentinc-10q-110513-3pdf 9/69
Table of Contents
LIVE NATION ENTERTAINMENT, INC.
NOTES TO CONSOLIDATED FINANCIAL STATEMENTS
(UNAUDITED)
NOTE 1—BASIS OF PRESENTATION
Preparation of Interim Financial Statements
The accompanying unaudited consolidated financial statements have been prepared in accordance with GAAP for interim financial information and the
instructions to Form 10-Q and Article 10 of Regulation S-X of the SEC. Accordingly, they do not include all of the information and footnotes required by
GAAP for complete financial statements. In the opinion of management, they include all normal and recurring accruals and adjustments necessary to presentfairly the results of the interim periods shown.
The financial statements contained herein should be read in conjunction with the consolidated financial statements and notes thereto included in the
Company’s 2012 Annual Report on Form 10-K filed with the SEC on February 26, 2013.
Seasonality
Due to the seasonal nature of shows at outdoor amphitheaters and festivals, which primarily occur May through September, the Company experiences
higher revenue for the Concerts and Sponsorship & Advertising segments during the second and third quarters. The Artist Nation segment’s revenue is
impacted, to a large degree, by the touring schedules of artists it represents and generally, the Company experiences higher revenue in this segment during the
second and third quarters as the period from May through September tends to be a popular time for touring events. The Ticketing segment’s sales are impacted
by fluctuations in the availability of events for sale to the public, which vary depending upon scheduling by its clients. The Company’s seasonality also
results in higher balances in cash and cash equivalents, accounts receivable, prepaid expenses, accrued expenses and deferred revenue at different times in the
year. Therefore, the results to date are not necessarily indicative of the results expected for the full year.
Cash and Cash EquivalentsIncluded in the September 30, 2013 and December 31, 2012 cash and cash equivalents balance is $509.5 million and $441.6 million, respectively, of
client cash which represents the face value of tickets sold on behalf of clients and the clients’ share of convenience and order processing charges.
Acquisitions
During the first nine months of 2013, the Company completed its acquisition of a controlling interest in a festival promoter and certain other smaller
acquisitions. These acquisitions were accounted for as business combinations under the acquisition method of accounting and were not significant on an
individual basis or in the aggregate.
Recently Adopted Pronouncements
In February 2013, the FASB issued guidance which requires companies to disclose additional information about reclassifications out of AOCI,
including changes in AOCI balances by component and significant items reclassified out of AOCI. The new disclosure requirements are applied prospectively
and are effective for interim and annual periods beginning after December 15, 2012. The Company adopted this guidance on January 1, 2013.
In July 2013, the FASB issued guidance that requires a liability related to an unrecognized tax benefit to be offset against a deferred tax asset for a net
operating loss carryforward, a similar tax loss or a tax credit carryforward if certain criteria are met. The guidance is effective for interim and annual periods beginning after December 15, 2013 and are applied prospectively to unrecognized tax benefits that exist at the effective date. Early adoption and retrospective
application of the new guidance are permitted. This guidance is consistent with the Company’s present practice and will not have a material impact on its
financial position.
NOTE 2—LONG-LIVED ASSETS
Property, Plant and Equipment
In the fourth quarter of 2012, an amphitheater in New York that is operated by the Company sustained substantial damage during Hurricane Sandy.
During 2013, the Company received insurance recoveries and recorded a gain of $2.0 million and $14.6 million for the three and nine months ended
September 30, 2013, respectively, as a component of gain on disposal of operating assets in the Concerts segment representing the proceeds received in excess
of the carrying value of the assets.
6

8/13/2019 LiveNationEntertainmentInc-10Q-110513 (3).pdf
http://slidepdf.com/reader/full/livenationentertainmentinc-10q-110513-3pdf 10/69
Table of Contents
Definite-lived Intangible Assets
The Company has definite-lived intangible assets which are amortized over the shorter of either the lives of the respective agreements or the period of time
the assets are expected to contribute to the Company’s future cash flows. The amortization is recognized on either a straight-line or expected cash flows basis.
The following table presents the changes in the gross carrying amount and accumulated amortization of definite-lived intangible assets for the nine
months ended September 30, 2013:
Revenue-
generating
contracts
Client /
vendor
relationships Non-compete
agreements
Venue
management
and
leaseholds Technology
Trademarks
and
naming
rights Other Total
(in thousands)
Balance as of December 31, 2012:
Gross carrying
amount $ 515,071 $ 261,655 $ 168,418 $ 118,259 $ 101,424 $ 18,423 $ 6,452 $ 1,189,702
Accumulated
amortization (197,549) (39,807) (111,369) (51,891) (53,295) (6,678) (4,650) (465,239)
Net 317,522 221,848 57,049 66,368 48,129 11,745 1,802 724,463
Gross carrying amount:
Acquisitions
—current year 22,573 4,820 — — 2,806 21,200 — 51,399
Acquisitions— prior
year (1,028) (2,833) — — — — — (3,861)Dispositions — (1,354) — — — — — (1,354)
Foreign exchange (43) (4,805) 33 (251) 453 125 (34) (4,522)
Other (1) (15,419) (1,771) (18,157) (25,000) — 405 (3,031) (62,973)
Net change 6,083 (5,943) (18,124) (25,251) 3 ,259 21,730 (3,065) (21,311)
Accumulated amortization:
Amortization (36,018) (34,088) (16,745) (16,310) (17,687) (3,247) (356) (124,451)
Dispositions — 61 — — — — — 61
Foreign exchange 260 776 (30) 165 (355) (103) 31 744
Other (1) 15,419 1,771 18,908 25,000 — 775 3,031 64,904
Net change (20,339) (31,480) 2,133 8,855 (18,042) (2,575) 2,706 (58,742)
Balance as of September 30, 2013:
Gross carrying
amount 521,154 255,712 150,294 93,008 104,683 40,153 3,387 1,168,391Accumulated
amortization (217,888) (71,287) (109,236) (43,036) (71,337) (9,253) (1,944) (523,981)
Net $ 303,266 $ 184,425 $ 41,058 $ 49,972 $ 33,346 $ 30,900 $ 1,443 $ 644,410
_________ (1) Other includes a reclassification from indefinite-lived intangible assets due to a change in the asset’s estimated useful life and netdowns of fully
amortized or impaired assets.
Included in the current year acquisitions amount above of $51.4 million are trademarks and naming rights and revenue-generating contracts primarily
associated with the May 2013 acquisition of a controlling interest in a festival promoter.
7

8/13/2019 LiveNationEntertainmentInc-10Q-110513 (3).pdf
http://slidepdf.com/reader/full/livenationentertainmentinc-10q-110513-3pdf 11/69
Table of Contents
The 2013 additions to definite-lived intangible assets from acquisitions have weighted-average lives as follows:
Weighted-
Average
Life (years)
Revenue-generating contracts 7
Client/vendor relationships 8
Technology 3
Trademarks and naming rights 10
All categories 8
The Company tests for possible impairment of definite-lived intangible assets whenever events or circumstances change, such as a significant reduction
in operating cash flow or a change in the manner in which the asset is intended to be used, which may indicate that the carrying amount of the asset may not
be recoverable. During the nine months ended September 30, 2012, the Company reviewed the carrying value of certain definite-lived intangible assets that
management determined had an indicator that future operating cash flows may not support their carrying value, and it was determined that those assets were
impaired since the estimated undiscounted operating cash flows associated with those assets were less than their carrying value. For the nine months ended
September 30, 2012, the Company recorded impairment charges related to definite-lived intangible assets of $13.8 million as a component of depreciation and
amortization. The impairment charges primarily related to intangible assets for revenue-generating contracts and client/vendor relationships in the Concerts
segment. See Note 5 —Fair Value Measurements for further discussion of the inputs used to determine the fair value. There were no significant impairment
charges recorded during the nine months ended September 30, 2013.
Amortization of definite-lived intangible assets for the three months ended September 30, 2013 and 2012 was $42.9 million and $40.8 million,
respectively, and for the nine months ended September 30, 2013 and 2012 was $124.5 million and $136.4 million, respectively. The decrease in amortizationfor the nine months ended September 30, 2013 is primarily driven by the impairment charge recorded in the first nine months of 2012 discussed above. In
addition, the Company recorded impairment charges related to client/vendor relationship intangible assets in the Artist Nation segment in December 2012
which have contributed to the decrease in amortization. For the three and nine months ended September 30, 2013, the Company recorded $3.8 million and$9.0 million, respectively, for acceleration of amortization primarily related to changes in estimates of certain venue management and leasehold intangible
assets in the Concerts segment due to the reduction in the lease term of a music theater.
Amortization related to nonrecoupable ticketing contract advances for the three months ended September 30, 2013 and 2012 was $18.8 million and$12.8 million, respectively, and for the nine months ended September 30, 2013 and 2012 was $42.7 million and $31.5 million, respectively.
As acquisitions and dispositions occur in the future and the valuations of intangible assets for recent acquisitions are completed, amortization may vary.
Therefore, the expense to date is not necessarily indicative of the expense expected for the full year.
8

8/13/2019 LiveNationEntertainmentInc-10Q-110513 (3).pdf
http://slidepdf.com/reader/full/livenationentertainmentinc-10q-110513-3pdf 12/69
Table of Contents
Goodwill
The following table presents the changes in the carrying amount of goodwill in each of the Company’s reportable segments for the nine months ended
September 30, 2013:
Concerts Ticketing Artist
Nation Sponsorship
& Advertising Other Total
(in thousands)
Balance as of December 31, 2012:
Goodwill $ 468,891 $ 637,642 $ 266,820 $ 254,376 $ 13,037 $ 1,640,766Accumulated impairment losses (269,902) — — — (13,037) (282,939)
Net 198,989 637,642 266,820 254,376 — 1,357,827
Acquisitions—current year 28,356 — — 8,993 — 37,349
Acquisitions—prior year (2,811) — 9,328 — — 6,517
Dispositions (3,691) — (251) — — (3,942)
Foreign exchange (3,031) 1,613 (122) 1,260 — (280)
Balance as of September 30, 2013:
Goodwill 487,714 639 ,255 275,775 264,629 13,037 1,680,410
Accumulated impairment losses (269,902) — — — (13,037) (282,939)
Net $ 217,812 $ 639,255 $ 275,775 $ 264,629 $ — $ 1,397,471
Included in the current year acquisitions amount above of $37.3 million is goodwill primarily associated with the May 2013 acquisition of a controlling
interest in a festival promoter.
The Company is in the process of finalizing its acquisition accounting for recent acquisitions which could result in a change to the associated purchase
price allocations, including goodwill and its allocation between segments.
Long-lived Asset Disposals
In May 2013, the Company completed the sale of a theatrical theater in New York. During the third quarter of 2013, a contingent liability related to the
sale was resolved resulting in an additional $7.0 million of gain on disposal of operating assets. In January 2012, the Company completed the sale of an
amphitheater in Ohio.
The table below summarizes the asset and liability values at the time of sale for significant disposals and the resulting gain or loss recorded.
Divested Asset Segment
Gain on
Disposal of Operating
Assets Current
Assets Noncurrent
Assets Current
Liabilities Noncurrent
Liabilities
(in thousands)
2013 Divestiture
New York theatrical theater Concerts $ (28,880) $ — $ 35,785 $ — $ 3,636
2012 Divestiture
Ohio amphitheater Concerts $ (444) $ — $ 5,400 $ 444 $ —
Certain agreements relating to disposals of businesses provide for future contingent consideration to be paid to the Company based on the financial
performance of the businesses sold. The Company will record additional amounts related to such contingent consideration, with a corresponding adjustment to
gain on disposal of operating assets, if and when it is determinable that the applicable financial performance targets will be met. The aggregate of these
contingent considerations, if all existing performance targets are met, would not significantly impact the results of operations of the Company. The last
contingency period for which the Company has outstanding contingent consideration is for the period ending December 2013.
9
8/13/2019 LiveNationEntertainmentInc-10Q-110513 (3).pdf
http://slidepdf.com/reader/full/livenationentertainmentinc-10q-110513-3pdf 13/69
Table of Contents
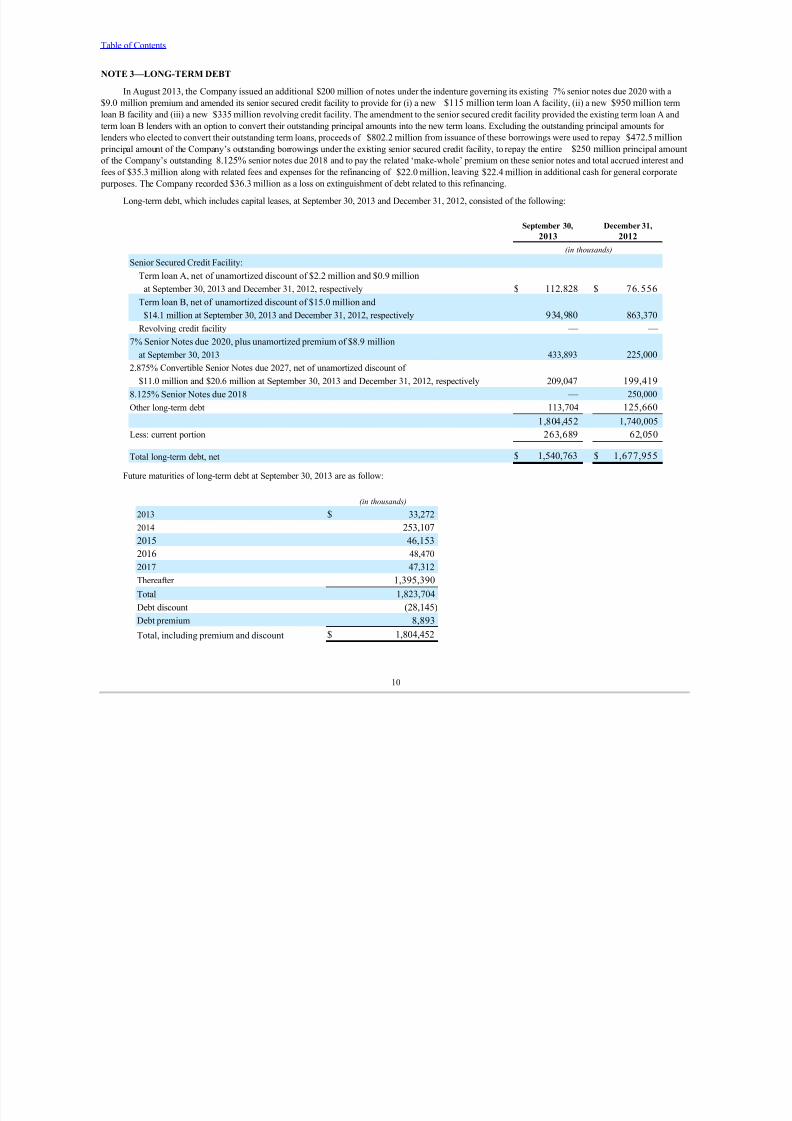
NOTE 3—LONG-TERM DEBT
In August 2013, the Company issued an additional $200 million of notes under the indenture governing its existing 7% senior notes due 2020 with a
$9.0 million premium and amended its senior secured credit facility to provide for (i) a new $115 million term loan A facility, (ii) a new $950 million term
loan B facility and (iii) a new $335 million revolving credit facility. The amendment to the senior secured credit facility provided the existing term loan A and
term loan B lenders with an option to convert their outstanding principal amounts into the new term loans. Excluding the outstanding principal amounts for
lenders who elected to convert their outstanding term loans, proceeds of $802.2 million from issuance of these borrowings were used to repay $472.5 million
principal amount of the Company’s outstanding borrowings under the existing senior secured credit facility, to repay the entire $250 million principal amount
of the Company’s outstanding 8.125% senior notes due 2018 and to pay the related ‘make-whole’ premium on these senior notes and total accrued interest and
fees of $35.3 million along with related fees and expenses for the refinancing of $22.0 million, leaving $22.4 million in additional cash for general corporate
purposes. The Company recorded $36.3 million as a loss on extinguishment of debt related to this refinancing.
Long-term debt, which includes capital leases, at September 30, 2013 and December 31, 2012, consisted of the following:
September 30,
2013 December 31,
2012
(in thousands)
Senior Secured Credit Facility:
Term loan A, net of unamortized discount of $2.2 million and $0.9 million
at September 30, 2013 and December 31, 2012, respectively $ 112,828 $ 76,556
Term loan B, net of unamortized discount of $15.0 million and
$14.1 million at September 30, 2013 and December 31, 2012, respectively 934,980 863,370
Revolving credit facility — —
7% Senior Notes due 2020, plus unamortized premium of $8.9 million
at September 30, 2013 433,893 225,000
2.875% Convertible Senior Notes due 2027, net of unamortized discount of
$11.0 million and $20.6 million at September 30, 2013 and December 31, 2012, respectively 209,047 199,419
8.125% Senior Notes due 2018 — 250,000
Other long-term debt 113,704 125,660
1,804,452 1,740,005
Less: current portion 263,689 62,050
Total long-term debt, net $ 1,540,763 $ 1,677,955
Future maturities of long-term debt at September 30, 2013 are as follow:
(in thousands)
2013 $ 33,272
2014 253,107
2015 46,153
2016 48,470
2017 47,312
Thereafter 1,395,390
Total 1,823,704
Debt discount (28,145)
Debt premium 8,893
Total, including premium and discount $ 1,804,452
10
8/13/2019 LiveNationEntertainmentInc-10Q-110513 (3).pdf
http://slidepdf.com/reader/full/livenationentertainmentinc-10q-110513-3pdf 14/69
Table of Contents
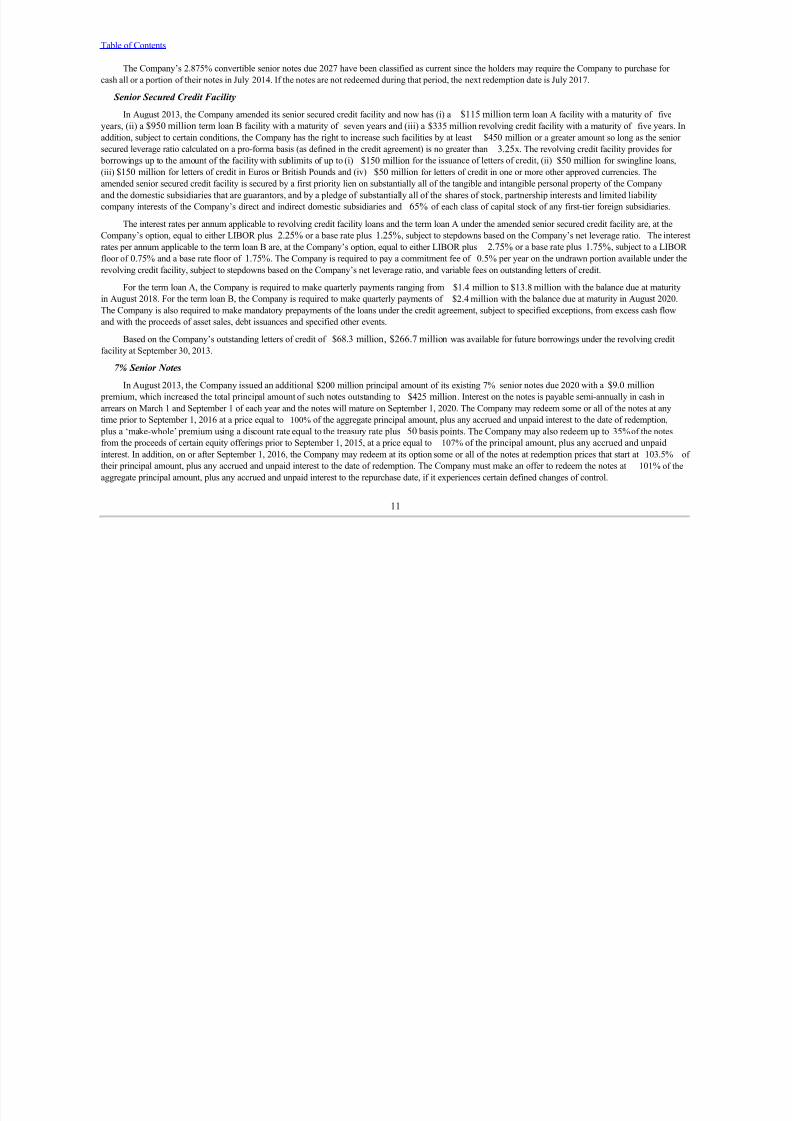
The Company’s 2.875% convertible senior notes due 2027 have been classified as current since the holders may require the Company to purchase for
cash all or a portion of their notes in July 2014. If the notes are not redeemed during that period, the next redemption date is July 2017.
Senior Secured Credit Facility
In August 2013, the Company amended its senior secured credit facility and now has (i) a $115 million term loan A facility with a maturity of five
years, (ii) a $950 million term loan B facility with a maturity of seven years and (iii) a $335 million revolving credit facility with a maturity of five years. In
addition, subject to certain conditions, the Company has the right to increase such facilities by at least $450 million or a greater amount so long as the senior
secured leverage ratio calculated on a pro-forma basis (as defined in the credit agreement) is no greater than 3.25x. The revolving credit facility provides for
borrowings up to the amount of the facility with sublimits of up to (i) $150 million for the issuance of letters of credit, (ii) $50 million for swingline loans,
(iii) $150 million for letters of credit in Euros or British Pounds and (iv) $50 million for letters of credit in one or more other approved currencies. The
amended senior secured credit facility is secured by a first priority lien on substantially all of the tangible and intangible personal property of the Company
and the domestic subsidiaries that are guarantors, and by a pledge of substantially all of the shares of stock, partnership interests and limited liability
company interests of the Company’s direct and indirect domestic subsidiaries and 65% of each class of capital stock of any first-tier foreign subsidiaries.
The interest rates per annum applicable to revolving credit facility loans and the term loan A under the amended senior secured credit facility are, at the
Company’s option, equal to either LIBOR plus 2.25% or a base rate plus 1.25%, subject to stepdowns based on the Company’s net leverage ratio. The interest
rates per annum applicable to the term loan B are, at the Company’s option, equal to either LIBOR plus 2.75% or a base rate plus 1.75%, subject to a LIBOR
floor of 0.75% and a base rate floor of 1.75%. The Company is required to pay a commitment fee of 0.5% per year on the undrawn portion available under the
revolving credit facility, subject to stepdowns based on the Company’s net leverage ratio, and variable fees on outstanding letters of credit.
For the term loan A, the Company is required to make quarterly payments ranging from $1.4 million to $13.8 million with the balance due at maturity
in August 2018. For the term loan B, the Company is required to make quarterly payments of $2.4 million with the balance due at maturity in August 2020.
The Company is also required to make mandatory prepayments of the loans under the credit agreement, subject to specified exceptions, from excess cash flow
and with the proceeds of asset sales, debt issuances and specified other events.
Based on the Company’s outstanding letters of credit of $68.3 million, $266.7 million was available for future borrowings under the revolving credit
facility at September 30, 2013.
7% Senior Notes
In August 2013, the Company issued an additional $200 million principal amount of its existing 7% senior notes due 2020 with a $9.0 million
premium, which increased the total principal amount of such notes outstanding to $425 million. Interest on the notes is payable semi-annually in cash in
arrears on March 1 and September 1 of each year and the notes will mature on September 1, 2020. The Company may redeem some or all of the notes at any
time prior to September 1, 2016 at a price equal to 100% of the aggregate principal amount, plus any accrued and unpaid interest to the date of redemption,
plus a ‘make-whole’ premium using a discount rate equal to the treasury rate plus 50 basis points. The Company may also redeem up to 35% of the notes
from the proceeds of certain equity offerings prior to September 1, 2015, at a price equal to 107% of the principal amount, plus any accrued and unpaid
interest. In addition, on or after September 1, 2016, the Company may redeem at its option some or all of the notes at redemption prices that start at 103.5% of
their principal amount, plus any accrued and unpaid interest to the date of redemption. The Company must make an offer to redeem the notes at 101% of the
aggregate principal amount, plus any accrued and unpaid interest to the repurchase date, if it experiences certain defined changes of control.
11

8/13/2019 LiveNationEntertainmentInc-10Q-110513 (3).pdf
http://slidepdf.com/reader/full/livenationentertainmentinc-10q-110513-3pdf 15/69
Table of Contents
Debt Covenants
The Company’s amended senior secured credit facility contains a number of covenants and restrictions that, among other things, require the Company
to satisfy certain financial covenants and restrict the Company’s and its subsidiaries’ ability to incur additional debt, make certain investments and
acquisitions, repurchase its stock and prepay certain indebtedness, create liens, enter into agreements with affiliates, modify the nature of its business, enter
into sale-leaseback transactions, transfer and sell material assets and merge or consolidate, and pay dividends and make distributions (with the exception of
subsidiary dividends or distributions to the parent company or other subsidiaries on at least a pro-rata basis with any noncontrolling interest partners). Non-
compliance with one or more of the covenants and restrictions could result in the full or partial principal balance of the credit facility becoming immediately
due and payable. The amended senior secured credit facility agreement has a covenant, measured quarterly, that requires the Company to maintain a
maximum ratio of consolidated total funded debt to consolidated EBITDA (both as defined in the credit agreement) of 5.25x over the trailing four consecutivequarters through September 30, 2014. The consolidated total leverage ratio will reduce to 5.0x on December 31, 2014, 4.75x on December 31, 2015 and 4.50x
on December 31, 2016.
The indenture governing the 7% senior notes contains covenants that limit, among other things, the Company’s ability and the ability of its restricted
subsidiaries to incur certain additional indebtedness and issue preferred stock, make certain distributions, investments and other restricted payments, sell
certain assets, agree to any restrictions on the ability of restricted subsidiaries to make payments to the Company, merge, consolidate or sell all of the
Company’s assets, create certain liens, and engage in transactions with affiliates on terms that are not arms-length. Certain covenants, including those
pertaining to incurrence of indebtedness, restricted payments, asset sales, mergers and transactions with affiliates will be suspended during any period in
which the notes are rated investment grade by both rating agencies and no default or event of default under the indenture has occurred and is continuing. The
7% senior notes contain two incurrence-based financial covenants, as defined, requiring a minimum fixed charge coverage ratio of 2.0x and a maximum
secured indebtedness leverage ratio of 3.25x.
As of September 30, 2013, the Company believes it was in compliance with all of its debt covenants. The Company expects to remain in compliance
with all of these covenants throughout 2013.
NOTE 4—DERIVATIVE INSTRUMENTS
The Company primarily uses forward currency contracts and options to reduce its exposure to foreign currency risk associated with short-term artist fee
commitments. The Company may also enter into forward currency contracts to minimize the risks and/or costs associated with changes in foreign currency
rates on forecasted operating income. At September 30, 2013 and December 31, 2012 , the Company had forward currency contracts and options outstanding
with notional amounts of $48.6 million and $100.0 million, respectively. These instruments have not been designated as hedging instruments and any change
in fair value is reported in earnings during the period of the change. The Company’s foreign currency derivative activity, including the related fair values, are
not material to any period presented.
Additionally, the Company has entered into certain interest rate swaps and cap agreements to limit its exposure to variable interest rates, related to
portions of the Company’s outstanding debt, some of which have been designated as cash flow hedges. At September 30, 2013, the Company had interest rate
swaps outstanding with notional amounts of $48.5 million. At December 31, 2012 , the Company had interest rate swaps and cap agreements outstanding
with notional amounts of $133.8 million. The Company’s interest rate swaps and cap activity, including the related fair values, are not material to any period
presented. As of September 30, 2013 and December 31, 2012, there was no ineffective portion or amount excluded from effectiveness testing for derivatives
designated as cash flow hedging instruments.
The Company’s 2.875% convertible senior notes include certain provisions which are bifurcated from the notes and accounted for as derivative
instruments. As of September 30, 2013 and December 31, 2012, the fair value of these provisions were considered to be de minimis.
The Company does not enter into derivative instruments for speculative or trading purposes and does not anticipate any significant recognition of
derivative activity through the income statement in the future related to the instruments currently held. See Note 5 —Fair Value Measurements for further
discussion and disclosure of the fair values for the Company’s derivative instruments.
12

8/13/2019 LiveNationEntertainmentInc-10Q-110513 (3).pdf
http://slidepdf.com/reader/full/livenationentertainmentinc-10q-110513-3pdf 16/69
Table of Contents
NOTE 5 —FAIR VALUE MEASUREMENTS
The Company currently has various financial instruments carried at fair value, such as marketable securities and derivatives, and contingent
consideration, but does not currently have nonfinancial assets and nonfinancial liabilities that are required to be measured at fair value on a recurring basis.
The Company’s financial assets and liabilities are measured using inputs from all levels of the fair value hierarchy as defined in the FASB guidance for fair
values. For this categorization, only inputs that are significant to the fair value are considered. The three levels are defined as follows:
Level 1—Inputs are unadjusted quoted prices in active markets for identical assets or liabilities that can be accessed at the measurement date.
Level 2—Inputs include quoted prices for similar assets and liabilities in active markets, quoted prices for identical or similar assets or liabilities in
markets that are not active, inputs other than quoted prices that are observable for the asset or liability (i.e., interest rates, yield curves, etc.) and inputs that
are derived principally from or corroborated by observable market data by correlation or other means (i.e., market corroborated inputs).
Level 3—Unobservable inputs that reflect assumptions about what market participants would use in pricing the asset or liability. These inputs would
be based on the best information available, including the Company’s own data.
In accordance with the fair value hierarchy described above, the following table shows the fair value of the Company’s financial assets and liabilities
that are required to be measured at fair value on a recurring basis, which are classified on the balance sheets as cash and cash equivalents, other current
assets, other long-term assets, other current liabilities and other long-term liabilities:
Fair Value Measurements
at September 30, 2013 Fair Value Measurements
at December 31, 2012
Level 1 Level 2 Level 3 Total Level 1 Level 2 Level 3 Total
(in thousands) (in thousands)
Assets:
Cash equivalents $ 76,606 $ — $ — $ 76,606 $ 61,996 $ — $ — $ 61,996
Forward currency
contracts — 251 — 251 — 81 — 81
Stock options — — 19 19 — — 204 204
Total $ 76,606 $ 251 $ 19 $ 76,876 $ 61,996 $ 81 $ 204 $ 62,281
Liabilities:
Interest rate swaps $ — $ 1,823 $ — $ 1,823 $ — $ 2,811 $ — $ 2,811
Forward currency
contracts — 439 — 439 — 625 — 625
Put option — — 555 555 — — — —
Contingent consideration — — 7,384 7,384 — — 6,718 6,718
Total $ — $ 2,262 $ 7,939 $ 10,201 $ — $ 3,436 $ 6,718 $ 10,154
Cash equivalents consist of money market funds. Fair values for cash equivalents are based on quoted prices in an active market. Fair values for forward currency contracts are based on observable market transactions of spot and forward rates. Fair values for the interest rate swaps and the interest rate
cap are based on inputs corroborated by observable market data with similar tenors. The fair value of the interest rate cap, which expired on June 30, 2013,
was de minimis at December 31, 2012.
The Company has certain contingent consideration obligations related to acquisitions which are measured at fair value using Level 3 inputs. The
amounts due to the sellers are based on the achievement of agreed-upon financial performance metrics by the acquired companies where the contingent
obligation is either earned or not earned. The Company records the liability at the time of the acquisition based on management’s best estimates of the future
results of the acquired companies compared to the agreed-upon metrics. Subsequent to the date of acquisition, the Company updates the original valuation to
reflect current projections of future results of the acquired companies and the passage of time. Accretion of, and changes in the valuations of, contingent
consideration are reported in acquisition transaction expenses. See Note 6 —Commitments and Contingent Liabilities for additional information related to the
contingent payments.
The Company has stock options in a publicly-traded company which are measured at fair value using Level 3 inputs. The stock options were received
as consideration in connection with a licensing agreement entered into by a subsidiary of the Company and became fully-vested in the second quarter of 2011.
The Company has recorded an asset for these options which
13

8/13/2019 LiveNationEntertainmentInc-10Q-110513 (3).pdf
http://slidepdf.com/reader/full/livenationentertainmentinc-10q-110513-3pdf 17/69
Table of Contents
is valued using the Black-Scholes option pricing model. The Company recorded revenue based on the valuation of the options as of the measurement date,
which was the vesting date. The changes in the valuation after the measurement date are recorded in other expense (income), net.
A third-party has a put option to sell its noncontrolling interest to the Company in the second quarter of 2014 that was entered into as a separate
transaction and therefore is carried at fair value using Level 3 inputs. The Company has recorded a current liability for this put option which is valued using
the Black-Scholes option pricing model. Changes in the fair value are recorded in acquisition transaction expenses.
During the first nine months of 2012, the Company recorded impairment charges related to definite-lived intangible assets of $13.8 million, as acomponent of depreciation and amortization. The impairment charges primarily related to intangible assets for revenue-generating contracts and client/vendor
relationships in the Concerts segment. It was determined that these assets were impaired since the estimated undiscounted cash flows associated with these
assets were less than their carrying value. These cash flows were calculated using operating cash flows which were discounted to approximate fair value. The
operating cash flows for these non-recurring fair value measurements are considered Level 3 inputs. There were no significant impairments related to definite-
lived intangible assets recorded for the nine months ended September 30, 2013.
Due to their short maturity, the carrying amounts of accounts receivable, accounts payable and accrued expenses approximated their fair values at
September 30, 2013 and December 31, 2012.
The Company’s outstanding debt held by third-party financial institutions is carried at cost, adjusted for premiums or discounts. The Company’s debt
is not publicly-traded and the carrying amounts typically approximate fair value for the Company’s debt that accrues interest at a variable rate, which are
considered to be Level 2 inputs. The estimated fair values of the 7% senior notes and the 2.875% convertible senior notes were $443.1 million and $225.2million, respectively, at September 30, 2013. The estimated fair values of the 7% senior notes, the 8.125% senior notes and the 2.875% convertible senior
notes were $236.3 million, $273.4 million and $219.4 million, respectively, at December 31, 2012 . The estimated fair value of the Company’s third-party
fixed-rate debt is based on quoted market prices in active markets for the same or similar debt, which are considered to be Level 2 inputs. The Company has
fixed rate debt held by noncontrolling interest partners with a face value of $24.8 million and $24.5 million at September 30, 2013 and December 31, 2012,respectively. The Company is unable to determine the fair value of this debt.
NOTE 6 —COMMITMENTS AND CONTINGENT LIABILITIES
Certain agreements relating to acquisitions that occurred prior to the adoption in January 2009 of the new FASB guidance for business combinations
provide for purchase price adjustments and other future contingent payments based on the financial performance of the acquired companies. The Company
will accrue additional amounts related to such contingent payments, which were part of the business combinations, with a corresponding adjustment to
goodwill, if and when it is determinable that the applicable financial performance targets will be met. The aggregate of these contingent payments, if all
performance targets are met, would not significantly impact the financial position of the Company. The last contingency period for which the Company has an
outstanding contingent payment is for the period ending December 2017 .
The Company also has certain contingent obligations related to acquisitions made after the adoption in January 2009 of the FASB guidance for business
combinations. In accordance with the current guidance, contingent consideration associated with business combinations must be recorded at its fair value at
the time of the acquisition and reflected at current fair value for each subsequent reporting period thereafter until settled. The Company records these fair value
changes in its statements of operations as acquisition transaction expenses. The contingent consideration is generally subject to payout following the
achievement of future performance targets and a portion is expected to be payable in the next twelve months. As of September 30, 2013, the Company has
accrued $2.0 million in other current liabilities and $5.4 million in other long-term liabilities and, as of December 31, 2012 , the Company had accrued $2.5
million in other current liabilities and $4.2 million in other long-term liabilities, representing the fair value of these estimated payments. The last contingency
period for which the Company has an outstanding contingent payment is for the period ending December 2017. See Note 5 —Fair Value Measurements for
further discussion related to the valuation of these contingent payments.
Ticketing Fees Consumer Class Action Litigation
In October 2003, a putative representative action was filed in the Superior Court of California challenging Ticketmaster’s charges to online customers for
shipping fees and alleging that its failure to disclose on its website that the charges contain a profit component is unlawful. The complaint asserted a claim for
violation of California’s Unfair Competition Law (“UCL”) and sought restitution or disgorgement of the difference between (i) the total shipping fees charged
by Ticketmaster in connection with online ticket sales during the applicable period, and (ii) the amount that Ticketmaster actually paid to the shipper for
delivery of those tickets. In August 2005, the plaintiffs filed a first amended complaint, then pleading the case as a putative class action and adding the claim
that Ticketmaster’s website disclosures in respect of its ticket order processing fees constitute false advertising in violation of California’s False Advertising
Law. On this new claim, the amended complaint seeks
14

8/13/2019 LiveNationEntertainmentInc-10Q-110513 (3).pdf
http://slidepdf.com/reader/full/livenationentertainmentinc-10q-110513-3pdf 18/69
Table of Contents
restitution or disgorgement of the entire amount of order processing fees charged by Ticketmaster during the applicable period. In April 2009, the Court granted
the plaintiffs’ motion for leave to file a second amended complaint adding new claims that (a) Ticketmaster’s order processing fees are unconscionable under
the UCL, and (b) Ticketmaster’s alleged business practices further violate the California Consumer Legal Remedies Act. Plaintiffs later filed a third amended
complaint, to which Ticketmaster filed a demurrer in July 2009. The Court overruled Ticketmaster’s demurrer in October 2009.
The plaintiffs filed a class certification motion in August 2009, which Ticketmaster opposed. In February 2010, the Court granted certification of a
class on the first and second causes of action, which allege that Ticketmaster misrepresents/omits the fact of a profit component in Ticketmaster’s shipping
and order processing fees. The class would consist of California consumers who purchased tickets through Ticketmaster’s website from 1999 to present.
The Court denied certification of a class on the third and fourth causes of action, which allege that Ticketmaster’s shipping and order processing fees are
unconscionably high. In March 2010, Ticketmaster filed a Petition for Writ of Mandate with the California Court of Appeal, and plaintiffs also filed a motionfor reconsideration of the Superior Court’s class certification order. In April 2010, the Superior Court denied plaintiffs’ Motion for Reconsideration of the
Court’s class certification order, and the Court of Appeal denied Ticketmaster’s Petition for Writ of Mandate. In June 2010, the Court of Appeal granted the
plaintiffs’ Petition for Writ of Mandate and ordered the Superior Court to vacate its February 2010 order denying plaintiffs’ motion to certify a national class
and enter a new order granting plaintiffs’ motion to certify a nationwide class on the first and second claims. In September 2010, Ticketmaster filed its Motion
for Summary Judgment on all causes of action in the Superior Court, and that same month plaintiffs filed their Motion for Summary Adjudication of various
affirmative defenses asserted by Ticketmaster. In November 2010, Ticketmaster filed its Motion to Decertify Class.
In December 2010, the parties entered into a binding agreement providing for the settlement of the litigation and the resolution of all claims therein. In
September 2011, the Court declined to approve the settlement in its then-current form. Litigation continued, and in September 2011, the Court granted in part
and denied in part Ticketmaster’s Motion for Summary Judgment. The parties reached a new settlement in September 2011, which was approved
preliminarily, but in September 2012 the Court declined to grant final approval. The parties have agreed in principal on the terms of a revised settlement and
intend to present those terms to the court for preliminary approval upon execution of a long-form settlement agreement. Ticketmaster and its parent, Live
Nation, have not acknowledged any violations of law or liability in connection with the matter.
As of September 30, 2013, the Company has accrued $35.4 million, its best estimate of the probable costs associated with the settlement referred to
above. This liability includes an estimated redemption rate. Any difference between the Company’s estimated redemption rate and the actual redemption rate it
experiences will impact the final settlement amount; however, the Company does not expect this difference to be material.
Canadian Consumer Class Action Litigation Relating to TicketsNow
In February 2009, four putative consumer class action complaints were filed in various provinces of Canada against TicketsNow, Ticketmaster,
Ticketmaster Canada Ltd. and Premium Inventory, Inc. All of the cases allege essentially the same set of facts and causes of action. Each plaintiff purports to
represent a class consisting of all persons who purchased a ticket from Ticketmaster, Ticketmaster Canada Ltd. or TicketsNow from February 2007 to
present and alleges that Ticketmaster conspired to divert a large number of tickets for resale through the TicketsNow website at prices higher than face value.
The plaintiffs characterize these actions as being in violation of Ontario’s Ticket Speculation Act, the Amusement Act of Manitoba, the Amusement Act of
Alberta or the Quebec Consumer Protection Act. The Ontario case contains the additional allegation that Ticketmaster’s service fees violate anti-scalping laws.
Each lawsuit seeks compensatory and punitive damages on behalf of the class.
In February 2012, the parties entered into a settlement agreement that resolved all of the resale market claims. The court approval process for the
settlement has been completed, with final approvals given in all provinces. The settlement was paid in January 2013, the full amount of which was funded by
an escrow established in connection with Ticketmaster’s 2008 acquisition of TicketsNow.
While it is reasonably possible that a loss related to the primary market claims of this matter could be incurred by the Company in a future period, the
Company does not believe that a loss is probable of occurring at this time. Considerable uncertainty remains regarding the validity of the claims and damages
asserted against the Company. As a result, the Company is currently unable to estimate the possible loss or range of loss for the primary market claims of this
matter. The Company intends to continue to vigorously defend the remaining primary market claim in the Ontario case.
15

8/13/2019 LiveNationEntertainmentInc-10Q-110513 (3).pdf
http://slidepdf.com/reader/full/livenationentertainmentinc-10q-110513-3pdf 19/69
Table of Contents
Other Litigation
From time to time, the Company is involved in other legal proceedings arising in the ordinary course of its business, including proceedings and claims
based upon violations of antitrust laws and intellectual property rights, and tortious interference, which could cause the Company to incur significant
expenses. The Company has also been the subject of personal injury and wrongful death claims relating to accidents at its venues in connection with its
operations. As required, the Company has accrued its estimate of the probable settlement or other losses for the resolution of any outstanding claims. These
estimates have been developed in consultation with counsel and are based upon an analysis of potential results, including, in some cases, estimated
redemption rates for the settlement offered, assuming a combination of li tigation and settlement strategies. It is possible, however, that future results of
operations for any particular period could be materially affected by changes in the Company’s assumptions or the effectiveness of its strategies related to these
proceedings. In addition, under the Company’s agreements with Clear Channel, it has assumed and will indemnify Clear Channel for liabilities associatedwith matters prior to its Separation that are related to its business for which they are a party in the defense.
NOTE 7—CERTAIN RELATIONSHIPS AND RELATED-PARTY TRANSACTIONS
Transactions Involving Directors
The following table sets forth revenue earned and expenses incurred from the transactions noted below:
Three Months Ended
September 30, Nine Months Ended
September 30,
2013 2012 2013 2012
(in thousands)
Director related-party revenue $ — $ 3,189 $ 2,475 $ 11,359
Director related-party expenses $ 1,030 $ 4,250 $ 4,556 $ 13,853
Relationship with Clear Channel
For purposes of governing certain of the ongoing relationships between Clear Channel and Live Nation at and after the Separation, Clear Channel and
Live Nation entered into a tax matters agreement, among other agreements.
The Company has a non-employee director who was also a director and executive officer of Clear Channel until July 2013. This director receives
directors’ fees, stock options and restricted stock awards on the same basis as other non-employee members of the Company’s board of directors. From time
to time, the Company purchases advertising from Clear Channel and its subsidiaries in the ordinary course of business on an arms-length basis. The
Company also has various lease and licensing agreements with Clear Channel for office space. These transactions are included in the table above through July
2013.
Transactions with MSG
The Company had a non-employee director until February 2013 who is also a director and executive officer of MSG and Cablevision Systems
Corporation. This director received directors’ fees, stock options and restricted stock awards on the same basis as other non-employee members of the
Company’s board of directors. From time to time, the Company promotes events at venues owned and/or operated by MSG and pays rental fees and co-
promote fees to MSG and its subsidiaries. In addition, the Company provides ticketing services for venues and sports franchises owned and/or operated byMSG and pays royalty fees to MSG and its subsidiaries. The Company also receives transaction fees from MSG and its subsidiaries for tickets MSG sells
using the Company’s ticketing software. Finally, the Company purchases advertising from Cablevision Systems Corporation and its subsidiaries from time
to time. All of these transactions are entered into in the ordinary course of business on an arms-length basis and are included in the table above through
February 2013.
Transactions Involving Executives
ATC Aviation, Inc. (“ATC”), which was owned by the Company’s former Executive Chairman and Chairman of its board of directors until his
resignation on December 31, 2012, owned an aircraft. The Company was charged market rates for the use of the aircraft when used by the former executive or
other executives on Company business, a portion of which was paid to ATC. These arrangements are no longer in effect following the executive’s departure
from the Company. For the three and nine months ended September 30, 2012, the Company made payments totaling $0.1 million and $1.2 million,respectively.
As of September 30, 2012, the former executive noted above had a minority ownership interest in an entity that subleases office space from the
Company. Rent charged by the Company totaled $0.2 million and $0.5 million, respectively, for the three and nine months ended September 30, 2012.
16

8/13/2019 LiveNationEntertainmentInc-10Q-110513 (3).pdf
http://slidepdf.com/reader/full/livenationentertainmentinc-10q-110513-3pdf 20/69
Table of Contents
Trust Note
For the three and nine months ended September 30, 2012, the Company recorded $1.6 million and $4.8 million, respectively, of acquisition expenses
related to the Trust Note as a component of corporate expenses. The Trust Note was paid in full in December 2012 in connection with the resignation of the
executive affiliated with the trust that held the Trust Note.
Other Related Parties
The Company conducts certain transactions in the ordinary course of business with companies that are owned, in part or in total, by various members
of management of the Company’s subsidiaries or companies over which it has significant influence. These transactions primarily relate to venue rentals,
concession services, equipment rentals, ticketing, marketing and other services. As of September 30, 2013 and December 31, 2012, the Company has areceivable balance of $11.4 million and $12.2 million, respectively, from certain of these companies.
The following table sets forth expenses incurred and revenue earned from these companies for services rendered or provided in relation to these business
ventures. None of these transactions were with directors or executive officers of the Company.
Three Months Ended
September 30, Nine Months Ended
September 30,
2013 2012 2013 2012
(in thousands)
Other related-parties revenue $ 3,538 $ 2,146 $ 5,688 $ 4,461
Other related-parties expenses $ 8,721 $ 10,216 $ 15,735 $ 14,249
NOTE 8—INCOME TAXES
The Company calculates interim effective tax rates in accordance with the FASB guidance for income taxes and applies the estimated annual effective taxrate to year-to-date pretax income (loss) at the end of each interim period to compute a year-to-date tax expense (or benefit). This guidance requires departure
from effective tax rate computations when losses incurred within tax jurisdictions cannot be carried back and future profits associated with operations in those
tax jurisdictions cannot be assured beyond any reasonable doubt. Accordingly, the Company has calculated and applied an expected annual effective tax rate
of approximately 20% for 2013 (as compared to 19% in the prior year), excluding significant, unusual or extraordinary items, for ordinary income associated
with operations for which the Company currently expects to have annual taxable income, which are principally outside of the United States. The Company
has not recorded tax benefits associated with losses from operations for which future taxable income cannot be reasonably assured. As required by this
guidance, the Company also includes tax effects of significant, unusual or extraordinary items in income tax expense in the interim period in which they occur.
Net income tax expense is $26.4 million for the nine months ended September 30, 2013. The components of tax expense that contributed to the net
income tax expense for the nine months ended September 30, 2013 primarily consist of income tax expense of $24.4 million based on the expected annual rate
pertaining to ordinary income for the nine month period and state and local taxes of $2.3 million.
Historically, the Company has reinvested all foreign earnings in its continuing foreign operations. The Company currently believes all undistributed
foreign earnings that are not currently subject to United States federal income tax will be indefinitely reinvested in its foreign operations.
The tax years 2005 through 2012 remain open to examination by the major tax jurisdictions to which the Company is subject.
17

8/13/2019 LiveNationEntertainmentInc-10Q-110513 (3).pdf
http://slidepdf.com/reader/full/livenationentertainmentinc-10q-110513-3pdf 21/69
Table of Contents
NOTE 9—EQUITY
The following table shows the reconciliation of the carrying amount of stockholders’ equity attributable to Live Nation Entertainment, Inc., equity
attributable to noncontrolling interests, total equity and also redeemable noncontrolling interests:
Live Nation
Entertainment, Inc.
Stockholders’ Equity Noncontrolling
Interests Total
Equity
Redeemable
Noncontrolling
Interests
(in thousands) (in thousands)
Balances at December 31, 2012 $ 1,355,418 $ 153,156 $ 1,508,574 $ 42,100
Non-cash and stock-based compensation 23,224 — 23,224 —
Common stock issued under stock plans, net of shares
withheld for employee taxes (6,580) — (6,580) —
Exercise of stock options and warrants 87,458 — 87,458 —
Purchase of common stock (6,865) — (6,865) —
Acquisitions — 9,941 9,941 29,742
Acquisitions of noncontrolling interests (851) 767 (84) —
Sales of noncontrolling interests — (399) (399) —
Redeemable noncontrolling interests fair value adjustments (424) — (424) 424
Noncontrolling interests contributions — 267 267 —
Cash distributions — (12,312) (12,312) (70)
Other — (648) (648) 6
Comprehensive income (loss):
Net income (loss) 38,665 12,103 50,768 (5,522)
Unrealized gain on cash flow hedges 3 — 3 —
Realized loss on cash flow hedges 476 — 476 —
Foreign currency translation adjustments (817) — (817) —
Balances at September 30, 2013 $ 1,489,707 $ 162,875 $ 1,652,582 $ 66,680
Common Stock
During the first nine months of 2013, the Company issued 9.7 million shares of common stock primarily in connection with stock option exercises.
The above shares include 0.5 million shares of common stock that were issued in connection with the exercise of warrants to purchase the Company’s
common stock. The transactions were cashless net exercises resulting in the Company repurchasing 0.4 million of the shares issued which have been recorded
in treasury stock at a value of $6.9 million.
Noncontrolling Interests
Common securities held by the noncontrolling interests that do not include put arrangements exercisable outside of the control of the Company are
recorded in equity, separate from the Company’s stockholders’ equity.
The purchase or sale of additional ownership in an already controlled subsidiary is recorded as an equity transaction with no gain or loss recognized in
consolidated net income or comprehensive income. There were no significant acquisitions or sales of noncontrolling interests during the first nine months of
2013 or 2012.
Redeemable Noncontrolling Interests
The Company is subject to put arrangements arising from business combinations where the holders of the noncontrolling interests can require the
Company to repurchase their shares at specified dates in the future or within specified periods in the future. Certain of these puts can be exercised earlier upon
the occurrence of triggering events as specified in the agreements. The exercise dates for these puts range from December 2013 to December 2018. The
redemption amounts for these puts are either at a fixed amount, at fair value at the time of exercise or a variable amount based on a formula linked to earnings.
In accordance with the FASB guidance for business combinations, the redeemable noncontrolling interests are recorded at their fair value at acquisition date.
As these put arrangements are not currently redeemable, for increases in the estimated redemption
18

8/13/2019 LiveNationEntertainmentInc-10Q-110513 (3).pdf
http://slidepdf.com/reader/full/livenationentertainmentinc-10q-110513-3pdf 22/69
Table of Contents
value, or reductions in the estimated redemption value to the extent increases had been recognized previously, the Company accretes changes in the redemption
value over the period from the date of issuance to the earliest redemption date of the individual puts, with the offset recorded to additional paid-in capital.
Accounting guidance prohibits the recognition of reductions in value below the initial issuance date value. Changes in estimated redemption values that are
based on a formula linked to future earnings are computed using projected cash flows each reporting period which take into account the current expectations
regarding profitability and the timing of revenue-generating events. For redemption amounts that are fixed dollar amounts, if the initial fair value is the
redemption amount, there are no changes recorded until the puts are exercised or expire. The amounts for these put arrangements are reflected in the Company’s
balance sheets as redeemable noncontrolling interests outside of permanent equity. The increase during the current year is principally related to puts associated
with the 2013 acquisitions.
Accumulated Other Comprehensive Income (Loss)
The following table presents changes in the components of AOCI, net of taxes, for the nine months ended September 30, 2013:
Gains and Losses On
Cash Flow Hedges Defined Benefit Pension
Items Foreign Currency Items Total
(in thousands)
Balance at December 31, 2012 $ (595) $ (611) $ (9,717) $ (10,923)
Other comprehensive income (loss) before reclassifications 3 — (817) (814)
Amount reclassified from AOCI 476 — — 476
Net other comprehensive income (loss) 479 — (817) (338)
Balance at September 30, 2013 $ (116) $ (611) $ (10,534) $ (11,261)
The realized loss on cash flow hedges reclassified from AOCI consists of one interest rate swap agreement.
Earnings per Share
The following table sets forth the computation of basic and diluted net income (loss) per common share:
Three Months Ended
September 30, Nine Months Ended
September 30,
2013 2012 2013 2012
(in thousands, except for per share data)
Net income (loss) attributable to common stockholders of Live
Nation Entertainment, Inc.—basic and diluted $ 43,774 $ 57,948 $ 38,665 $ (3,510)
Weighted average common shares—basic 196,397 187,154 192,792 186,858
Effect of dilutive securities:
Stock options, restricted stock and warrants 5,713 2,600 4,474 —
2.875% convertible senior notes — — — — Weighted average common shares—diluted 202,110 189,754 197,266 186,858
Basic and diluted net income (loss) per common share $ 0.22 $ 0.31 $ 0.20 $ (0.02)
19

8/13/2019 LiveNationEntertainmentInc-10Q-110513 (3).pdf
http://slidepdf.com/reader/full/livenationentertainmentinc-10q-110513-3pdf 23/69
Table of Contents
The calculation of diluted net income per common share includes the effects of the assumed exercise of any outstanding stock options and warrants, the
assumed vesting of shares of restricted stock awards and units and the assumed conversion of the 2.875% convertible senior notes where dilutive. The
following table shows securities excluded from the calculation of diluted net income per common share because such securities are anti-dilutive:
Three Months Ended
September 30, Nine Months Ended
September 30,
2013 2012 2013 2012
(in thousands)
Options to purchase shares of common stock 3,703 16,890 6,386 22,213Restricted stock awards and units—unvested 765 2,308 786 4,061
Warrants — 500 — 500
Conversion shares related to 2.875% convertible senior notes 8,105 8,105 8,105 8,105
Number of anti-dilutive potentially issuable shares excluded from
diluted common shares outstanding 12,573 27,803 15,277 34,879
NOTE 10—STOCK-BASED COMPENSATION
The following is a summary of stock-based compensation expense recorded by the Company during the respective periods:
Three Months Ended
September 30, Nine Months Ended
September 30,
2013 2012 2013 2012
(in thousands)
Selling, general and administrative expenses $ 4,915 $ 3,771 $ 11,166 $ 10,414
Corporate expenses 4,190 5,906 12,058 17,181
Total $ 9,105 $ 9,677 $ 23,224 $ 27,595
As of September 30, 2013, there was $40.7 million of total unrecognized compensation cost related to stock-based compensation arrangements for stock
options and restricted stock awards. This cost is expected to be recognized over a weighted-average period of 2.7 years.
NOTE 11—SEGMENT DATA
The Company’s reportable segments are Concerts, Ticketing, Artist Nation and Sponsorship & Advertising. The Concerts segment involves the
promotion of live music events globally in the Company’s owned and/or operated venues and in rented third-party venues, the production of music festivals
and the operation and management of music venues and is the aggregation of the Company’s North American Concerts and International Concerts operating
segments. The Ticketing segment involves the management of the Company’s global ticketing operations including providing ticketing software and services
to clients and online access for customers relating to ticket and event information and is responsible for the Company’s primary websites,
www.livenation.com and www.ticketmaster.com. The Ticketing segment is the aggregation of the Company’s North American Ticketing and International
Ticketing operating segments. The Artist Nation segment provides management services to artists and other services including merchandise and is theaggregation of the Company’s Artist Management and Artist Services operating segments. The Sponsorship & Advertising segment manages the development
of strategic sponsorship programs in addition to the sale of international, national and local sponsorships and placement of advertising including signage,
promotional programs and banner ads in the Company’s owned and/or operated venues and on its primary websites.
Revenue and expenses earned and charged between segments are eliminated in consolidation. Corporate expenses and all line items below operating
income are managed on a total company basis. The Company’s capital expenditures includes accruals but excludes expenditures funded by outside parties
such as landlords or replacements funded by insurance companies.
The Company manages its working capital on a consolidated basis. Accordingly, segment assets are not reported to, or used by, the Company’s
management to allocate resources to or assess performance of the segments, and therefore, total segment assets have not been presented.
20

8/13/2019 LiveNationEntertainmentInc-10Q-110513 (3).pdf
http://slidepdf.com/reader/full/livenationentertainmentinc-10q-110513-3pdf 24/69
Table of Contents
The following table presents the results of operations for the Company’s reportable segments for the three and nine months ending September 30, 2013
and 2012:
Concerts Ticketing Artist
Nation Sponsorship
& Advertising Other Corporate Eliminations Consolidated
(in thousands)
Three Months Ended September 30, 2013
Revenue $ 1,726,986 $ 356,809 $ 111,060 $ 110,217 $ 793 $ — $ (43,629) $ 2,262,236
Direct operating
expenses 1,487,856 166,509 69,231 15,112 3,109 — (43,086) 1,698,731
Selling, general and
administrative
expenses 170,005 112,940 29,348 11,979 733 — — 325,005
Depreciation and
amortization 32,821 49,150 10,736 (56) 11 610 (543) 92,729
Loss (gain) on
disposal of operating
assets (9,035) (27) 2 — — — — (9,060)
Corporate expenses — — — — — 26,442 — 26,442
Acquisition
transaction expenses 745 221 (57) — — 1,443 — 2,352
Operating income
(loss) $ 44,594 $ 28,016 $ 1,800 $ 83,182 $ (3,060) $ (28,495) $ — $ 126,037Intersegment revenue $ 36,535 $ 861 $ 6,233 $ — $ — $ — $ (43,629) $ —
Three Months Ended September 30, 2012
Revenue $ 1,429,912 $ 345,980 $ 127,924 $ 95,805 $ 1,147 $ — $ (37,622) $ 1,963,146
Direct operating
expenses 1,235,786 16 1, 566 85,097 11,102 994 — (37,122) 1,457,423
Selling, general and
administrative
expenses 146,528 104,098 22,146 10,760 314 — — 283,846
Depreciation and
amortization 27,508 43,315 13,203 320 49 789 (500) 84,684
Loss (gain) on
disposal of operating
assets (8) 10 — — (62) — — (60)
Corporate expenses — — — — — 30,842 — 30,842
Acquisition
transaction expenses 1,032 381 — — — 483 — 1,896
Operating income
(loss) $ 19,066 $ 36,610 $ 7,478 $ 73,623 $ (148) $ (32,114) $ — $ 104,515
Intersegment revenue $ 33,510 $ (521) $ 4,633 $ — $ — $ — $ (37,622) $ —
Nine Months Ended September 30, 2013
Revenue $ 3,433,527 $ 1,019,771 $ 261,070 $ 221,604 $ 2,377 $ — $ (72,902) $ 4,865,447
Direct operating
expenses 2,870,584 481,592 169,563 35,287 (62) — (71,381) 3,485,583
Selling, general and
administrative
expenses 466,840 326,799 71,862 32,626 2 ,119 — — 900,246
Depreciation andamortization 9 6, 591 128,648 30,906 682 1 96 2,080 (1,521) 257,582
21

8/13/2019 LiveNationEntertainmentInc-10Q-110513 (3).pdf
http://slidepdf.com/reader/full/livenationentertainmentinc-10q-110513-3pdf 25/69
Table of Contents
Loss (gain) on
disposal of operating
assets (43,497) (47) 681 — 7 — — (42,856)
Corporate expenses — — — — — 68,909 — 68,909
Acquisition
transaction expenses 1,292 245 88 — — 3,704 — 5,329
Operating income
(loss) $ 41,717
$ 82,534
$ (12,030)
$ 153,009
$ 117
$ (74,693)
$ —
$ 190,654
Intersegment revenue $ 63,502 $ 1,842 $ 7,558 $ — $ — $ — $ (72,902) $ —
Capital expenditures $ 16,708 $ 62,145 $ 483 $ 653 $ — $ 94 $ — $ 80,083
Nine Months Ended September 30, 2012
Revenue $ 2,954,635 $ 1,001,463 $ 298,570 $ 193,211 $ 2,345 $ — $ (68,404) $ 4,381,820
Direct operating
expenses 2,475,222 467,808 199,106 27,160 571 — (66,861) 3,103,006
Selling, general and
administrative
expenses 423,213 312,099 67,540 28,741 1,331 — — 832,924
Depreciation and
amortization 100,004 121,284 36,271 341 72 2,227 (1,543) 258,656
Loss (gain) on
disposal of operating
assets (477) (145) — — 367 — — (255)
Corporate expenses — — — — — 81,474 — 81,474
Acquisition
transaction expenses (373) 46 401 — — 1,261 — 1,335
Operating income
(loss) $ (42,954) $ 100,371 $ (4,748) $ 136,969 $ 4 $ (84,962) $ — $ 104,680
Intersegment revenue $ 58,548 $ 2,175 $ 7,681 $ — $ — $ — $ (68,404) $ —
Capital expenditures $ 17,385 $ 65,253 $ 476 $ 3,979 $ 3 $ 1,114 $ — $ 88,210
22
8/13/2019 LiveNationEntertainmentInc-10Q-110513 (3).pdf
http://slidepdf.com/reader/full/livenationentertainmentinc-10q-110513-3pdf 26/69
Table of Contents
Item 2. Management’s Discussion and Analysis of Financial Condition and Results of Operations
“Live Nation” (which may be referred to as the “Company,” “we,” “us” or “our”) means Live Nation Entertainment, Inc. and its subsidiaries,
or one of our segments or subsidiaries, as the context requires. You should read the following discussion of our financial condition and results of
operations together with the unaudited consolidated financial statements and notes to the financial statements included elsewhere in this quarterly
report.
Special Note About Forward-Looking Statements
Certain statements contained in this quarterly report (or otherwise made by us or on our behalf from time to time in other reports, filings with the SEC,
news releases, conferences, internet postings or otherwise) that are not statements of historical fact constitute “forward-looking statements” within the meaning
of Section 27A of the Securities Act of 1933, as amended, and Section 21E of the Exchange Act of 1934, as amended, notwithstanding that such statements
are not specifically identified. Forward-looking statements include, but are not limited to, statements about our financial position, business strategy,
competitive position, potential growth opportunities, potential operating performance improvements, the effects of competition, the effects of future legislation
or regulations and plans and objectives of our management for future operations. We have based our forward-looking statements on our beliefs and
assumptions based on information available to us at the time the statements are made. Use of the words “may,” “should,” “continue,” “plan,” “potential,”
“anticipate,” “believe,” “estimate,” “expect,” “intend,” “outlook,” “could,” “target,” “project,” “seek,” “predict,” or variations of such words and similar
expressions are intended to identify forward-looking statements but are not the exclusive means of identifying such statements.
Forward-looking statements are not guarantees of future performance and are subject to risks and uncertainties that could cause actual results to differ
materially from those in such statements. Factors that could cause actual results to differ from those discussed in the forward-looking statements include, but
are not limited to, those set forth below under Part II Item 1A.—Risk Factors, in Part I Item IA.—Risk Factors of our 2012 Annual Report on Form 10-K, as
well as other factors described herein or in our annual, quarterly and other reports we file with the SEC (collectively, “cautionary statements”). Based upon
changing conditions, should any one or more of these risks or uncertainties materialize, or should any underlying assumptions prove incorrect, actual results
may vary materially from those described in any forward-looking statements. All subsequent written and oral forward-looking statements attributable to us or
persons acting on our behalf are expressly qualified in their entirety by the applicable cautionary statements. We do not intend to update these forward-lookingstatements, except as required by applicable law.
Executive Overview
In the third quarter of 2013, our revenue increased 15% compared to last year driven by an increase in our Concerts segment’s event activity as well as
higher sales in our Sponsorship & Advertising segment. Our Ticketing segment revenue was also up for the third quarter driven by strong primary ticket
sales in North America for concerts and sporting events as well as higher revenue from our resale business, even without the revenue associated with the 2012
Olympics. Our strategy remains focused on leveraging our leadership position in the live entertainment industry to reach fans through the live concert
experience in order to sell more tickets and grow our sponsorship and advertising revenue, while continuing to optimize our cost structure. We believe that as
the leading, global live event and ticketing company we are well-positioned to serve artists, teams, fans and venues.
Our Concerts segment delivered a 21% increase in revenue for the third quarter as compared to last year through increased event attendance and higher
results due to acquisitions. Our attendance was up 27% globally driven by the higher amphitheater activity, more events in newer markets like Australia, as
well as the growth in our festival and arena businesses in both North America and Europe. Our overall Concerts operating results increased for the quarter due
to improved profitability from this higher activity across the portfolio. In addition, our Concerts operating results were impacted positively by $9.1 million in
gains recognized on the disposal of operating assets. These gains include the resolution of a $7.0 million contingent liability related to the May 2013 sale of atheatrical theater in New York and a gain of $2.0 million in connection with additional insurance recovery for storm damage to an amphitheater in New York.
We will continue to look for expansion opportunities, both domestically and internationally, as well as better ways to market our events in order to continue to
expand our reach and sell more tickets.
Our Ticketing segment revenue for the third quarter increased 3% compared to last year due to higher ticket sales for concert and sporting events in the
United States as well as an increase in our resale business. Overall, the number of tickets sold during the third quarter increased 4% due largely to higher sales
in our domestic ticketing group. Tickets sold through our mobile applications in the third quarter more than doubled as compared to last year and we are
implementing new features this year that we expect to further expand mobile ticket transactions. In the third quarter, over 11% of our North American tickets
were sold via mobile devices. Ticketing operating results in the third quarter were driven by strong domestic ticket sales including those for our owned and/or
operated venues, as well as increased activity in our resale business. As in prior periods of 2013, we have incurred higher costs year-over-year from
investments in our technology platforms. We will continue to invest in a variety of initiatives aimed at improving the ticket buying process and overall fan and
venue client experience.
23

8/13/2019 LiveNationEntertainmentInc-10Q-110513 (3).pdf
http://slidepdf.com/reader/full/livenationentertainmentinc-10q-110513-3pdf 27/69
Table of Contents
Our Artist Nation segment revenue decreased 13% for the third quarter as compared to last year primarily due to the decision in July of this year by the
Concerts segment to expand their platinum ticketing business and no longer outsource VIP ticket sales to Artist Nation. This decline was partially offset by
higher tour merchandise sales driven by the timing of artist tours. Higher compensation expenses partially offset by lower amortization led to a year-over-year
reduction in operating results for the segment. Our Artist Nation segment is focused on serving our existing artists as well as developing new relationships with
top artists and extending the various services we provide.
Our Sponsorship & Advertising segment’s third quarter revenue increased 15% over the prior year driven by higher sponsorship revenue generated from
festivals and custom events as well as higher online advertising revenue. Overall operating income improved 13% in the third quarter driven by the higher
sales. An increase in custom events in North America, which have higher direct costs, as well as higher fixed costs for Sponsorship & Advertising led to the
reduction in operating margins. Our extensive on-site and online reach, global venue distribution network, artist relationships and ticketing operations are thekey to securing long-term sponsorship agreements with major brands and we continue to expand these assets while extending further into new markets
internationally.
Overall, our net income for the third quarter was impacted by a loss on extinguishment of debt of $36.3 million due to the pay down of our 8.125%
senior notes through the issuance of additional notes under our existing 7% senior notes and the refinancing of and amendment to our senior secured credit
facility. Partially offsetting the loss on extinguishment of debt was a reduction of interest expense for the quarter resulting from the redemptions of our 10.75%
senior notes in 2012 and our 8.125% senior notes in 2013 through the issuance of 7% senior notes in both years.
We continue to be optimistic about the long-term potential of our company and are focused on the key elements of our business model - expand our
concert platform to sell more tickets, drive conversion of ticket sales through social and mobile channels, grow our sponsorship and online revenue and sell
more tickets for our Ticketmaster clients while driving reductions in the ticketing cost structure.
Our History
We were incorporated in Delaware on August 2, 2005 in preparation for the contribution and transfer by Clear Channel of substantially all of its
entertainment assets and liabilities. We completed the Separation on December 21, 2005, and became a publicly traded company on the New York Stock
Exchange trading under the symbol “LYV.”
On January 25, 2010, we merged with Ticketmaster. Effective on the date of the Merger, Ticketmaster became a wholly-owned subsidiary of Live
Nation and Live Nation, Inc. changed its name to Live Nation Entertainment, Inc.
Segment Overview
Our reportable segments are Concerts, Ticketing, Artist Nation and Sponsorship & Advertising.
Concerts
Our Concerts segment principally involves the global promotion of live music events in our owned and/or operated venues and in rented third-party
venues, the operation and management of music venues and the production of music festivals across the world. While our Concerts segment operates year-
round, we experience higher revenue during the second and third quarters due to the seasonal nature of shows at our outdoor amphitheaters and festivals,
which primarily occur May through September. Revenue and related costs for events are generally deferred and recognized when the event occurs. All
advertising costs for shows are expensed at the end of the year for any future events.
To judge the health of our Concerts segment, we primarily monitor the number of confirmed events in our network of owned and/or operated and third- party venues, talent fees, average paid attendance and advance ticket sales. In addition, at our owned and/or operated venues, we monitor attendance, ancillary
revenue per fan and premium ticket sales. For business that is conducted in foreign markets, we also compare the operating results from our foreign operations
to prior periods on a constant currency basis.
Ticketing
The Ticketing segment is primarily an agency business that sells tickets for events on behalf of our clients and retains a convenience charge and order
processing fee for our services. We sell tickets through websites, telephone, mobile apps and ticket outlets. Our ticketing sales are impacted by fluctuations in
the availability of events for sale to the public, which may vary depending upon scheduling by our clients. Our Ticketing segment also manages our online
activities including enhancements to our websites and bundling product offerings. Through our websites, we sell tickets to our own events as well as tickets
for our ticketing clients and provide event information. Revenue related to ticketing service charges for our events where we control ticketing is deferred and
recognized as the event occurs.
To judge the health of our Ticketing segment, we primarily review the gross transaction value and the number of tickets sold through our ticketing
operations, average convenience charges and order processing fees, the number of clients renewed or
24

8/13/2019 LiveNationEntertainmentInc-10Q-110513 (3).pdf
http://slidepdf.com/reader/full/livenationentertainmentinc-10q-110513-3pdf 28/69
Table of Contents
added and the average royalty rate paid to clients who use our ticketing services. In addition, we review the number of visits to our websites, the overall
number of customers in our database, the number of tickets sold via mobile apps and the revenue related to the sale of other products on our websites. For
business that is conducted in foreign markets, we also compare the operating results from our foreign operations to prior periods on a constant currency basis.
Artist Nation
The Artist Nation segment primarily provides management services to music artists in exchange for a commission on the earnings of these artists. Our
Artist Nation segment also sells merchandise associated with music artists at live performances, to retailers and directly to consumers via the internet and
provides other services to artists. Revenue earned from our Artist Nation segment is impacted to a large degree by the touring schedules of the artists we
represent and generally, we experience higher revenue during the second and third quarters as the period from May through September tends to be a popular
time for touring events.
To judge the health of our Artist Nation segment, we primarily review the annual commissions earned for each artist represented and the percentage of
top artists on tour or with planned album releases as these activities tend to drive higher revenue. For business that is conducted in foreign markets, we also
compare the operating results from our foreign operations to prior periods on a constant currency basis.
Sponsorship & Advertising
Our Sponsorship & Advertising segment employs a sales force that creates and maintains relationships with sponsors, through a combination of
strategic, international, national and local opportunities that allow businesses to reach customers through our concert, venue, artist relationship and ticketing
assets, including advertising on our websites. We work with our corporate clients to help create marketing programs that drive their business goals and
connects their brands directly with fans and artists. We also develop, book and produce custom events or programs for our client’s specific brands which are
typically experienced exclusively by the client’s consumers. These custom events can involve live music events with talent and media, using both online and
traditional outlets. We typically experience higher revenue in the second and third quarters as a large portion of sponsorships are typically associated with our
outdoor venues and festivals which are primarily used in or occur during May through September.
To judge the health of our Sponsorship & Advertising segment, we primarily review the average revenue per sponsor, the total revenue generated throughsponsorship arrangements, the percentage of expected revenue under contract and the online revenue received from sponsors advertising on our websites. For
business that is conducted in foreign markets, we also compare the operating results from our foreign operations to prior periods on a constant currency basis.
25

8/13/2019 LiveNationEntertainmentInc-10Q-110513 (3).pdf
http://slidepdf.com/reader/full/livenationentertainmentinc-10q-110513-3pdf 29/69
Table of Contents
Consolidated Results of Operations
Three Months Ended
September 30, %
Change
Nine Months Ended
September 30, %
Change2013 2012 2013 2012
(in thousands) (in thousands)
Revenue $ 2,262,236 $ 1,963,146 15% $ 4,865,447 $ 4,381,820 11%
Operating expenses: Direct operating expenses 1,698,731 1,457,423 17% 3 ,485,583 3,103,006 12%
Selling, general and administrative
expenses 325,005 283,846 15% 900,246 832,924 8%
Depreciation and amortization 92,729 84,684 10% 257,582 258,656 —%
Gain on disposal of operating assets (9,060) (60) * (42,856) (255) *
Corporate expenses 26,442 30,842 (14)% 68,909 81,474 (15)%
Acquisition transaction expenses 2,352 1,896 * 5,329 1,335 *
Operating income 126,037 104,515 21% 190,654 104,680 82%
Operating margin 5. 6% 5.3% 3.9% 2.4%
Interest expense 29,393 35,535 87,585 94,733
Loss (gain) on extinguishment of debt 36,269 (460) 36,269 (460)
Interest income (1,547) (994) (4,205) (2,825)
Equity in losses (earnings) of nonconsolidated affiliates 2,363 (3,117) (2,848) (8,799)
Other expense (income), net (5,269) (6,575) 2,237 (2,933)
Income before income taxes 64,828 80,126 71,616 24,964
Income tax expense 14,410 11,950 26,370 21,456
Net income 50,418 68,176 45,246 3,508
Net income attributable to noncontrolling
interests 6,644 10,228 6,581 7,018
Net income (loss) attributable to common
stockholders of Live Nation Entertainment,
Inc. $ 43,774 $ 57,948 $ 38,665 $ (3,510)
_________
* Percentages are not meaningful.
26

8/13/2019 LiveNationEntertainmentInc-10Q-110513 (3).pdf
http://slidepdf.com/reader/full/livenationentertainmentinc-10q-110513-3pdf 30/69
Table of Contents
Key Operating Metrics
Three Months Ended
September 30, Nine Months Ended
September 30,
2013 2012 2013 2012
Concerts (1)
Total estimated events:
North America 3,858 3,938 11,181 11 ,126
International 1,210 1,227 4,674 4,536
Total estimated events 5,068 5 ,1 65 15 ,8 55 1 5, 662
Total estimated attendance (rounded):
North America 14,826,000 11,636,000 29,292,000 25,278,000
International 6,348,000 5,080,000 15,419,000 12,808,000
Total estimated attendance 21,174,000 16,716,000 44,711,000 38,086,000
Ancillary net revenue per attendee (2):
North America amphitheaters $ 18.26 $ 18.54
International festivals $ 17.81 $ 15.71
Ticketing (3)
Number of tickets sold (in thousands):
Concerts 20,526 19,421 56,724 54,832
Sports 7,447 6,709 24,067 23,249Arts and theater 4,239 4,493 12,465 13,683
Family 3,803 3,676 11,637 11,277
Other (4) 1 ,579 1,771 4,717 5,221
37,594 36,070 109,610 108,262
Gross transaction value of tickets sold (in thousands) $ 2,231,826 $ 2,092,102 $ 6,740,055 $ 6,503,452
Number of customers in database (2) (rounded) 126,893,000 116,391,000
Sponsorship & Advertising
Sponsorship revenue (in thousands) $ 90,081 $ 81,199 $ 172,656 $ 155,139
Online advertising revenue (in thousands) $ 20,136 $ 14,606 $ 48,948 $ 38,072
_________
(1) Events generally represent a single performance by an artist. Attendance generally represents the number of fans who were present at an event. Festivals
are counted as one event in the quarter in which the festival begins but attendance is based on the days the fan was present at the festival and thus can bereported in multiple quarters. Events and attendance metrics are estimated each quarter.
(2) Amounts are reported as of the latest period shown.
(3) The number and gross transaction value of tickets sold includes primary tickets only and excludes tickets sold for the 2012 Olympics. These metrics
include tickets sold during the period regardless of event timing except for our promoted events in our owned and/or operated venues and in certain
European territories where these tickets are reported as the events occur. The total number of tickets sold excludes approximately 24 million and 26
million tickets sold for the three months ended September 30, 2013 and 2012, respectively, and excludes approximately 77 million and 84 million tickets
sold for the nine months ended September 30, 2013 and 2012, respectively, through our venue clients’ box offices for which we do not receive a fee.
(4) Other category includes tickets for comedy shows, facility tours, donations, lectures, seminars and cinemas.
27

8/13/2019 LiveNationEntertainmentInc-10Q-110513 (3).pdf
http://slidepdf.com/reader/full/livenationentertainmentinc-10q-110513-3pdf 31/69
Table of Contents
Revenue
Our revenue increased $299.1 million, or 15%, during the three months ended September 30, 2013 as compared to the same period of the prior year.
The overall increase in revenue was primarily due to an increase in our Concerts segment of $297.1 million. Excluding the decrease of approximately $4.2
million related to the impact of changes in foreign exchange rates, revenue increased $303.3 million, or 15%.
Our revenue increased $483.6 million, or 11%, during the nine months ended September 30, 2013 as compared to the same period of the prior year. The
overall increase in revenue was primarily due to an increase in our Concerts segment of $478.9 million. Excluding the decrease of approximately $1.8 million
related to the impact of changes in foreign exchange rates, revenue increased $485.4 million, or 11%.
More detailed explanations of these changes are included in the applicable segment discussions below.
Direct operating expenses
Our direct operating expenses increased $241.3 million, or 17%, during the three months ended September 30, 2013 as compared to the same period of
the prior year. The overall increase in direct operating expenses was primarily due to an increase in our Concerts segment of $252.1 million. Excluding the
decrease of approximately $3.7 million related to the impact of changes in foreign exchange rates, direct operating expenses increased $245.0 million, or 17%.
Our direct operating expenses increased $382.6 million, or 12%, during the nine months ended September 30, 2013 as compared to the same period of
the prior year. The overall increase in direct operating expenses was primarily due to an increase in our Concerts segment of $395.4 million. Excluding the
decrease of approximately $0.9 million related to the impact of changes in foreign exchange rates, direct operating expenses increased $383.5 million, or 12%.
Direct operating expenses include artist fees, event production costs, ticketing client royalties, show-related marketing and advertising expenses, along
with other costs.
More detailed explanations of these changes are included in the applicable segment discussions below.
Selling, general and administrative expenses
Our selling, general and administrative expenses increased $41.2 million, or 15%, during the three months ended September 30, 2013 as compared to
the same period of the prior year. The overall increase in selling, general and administrative expenses was primarily due to increases in our Concerts, Ticketing
and Artist Nation segments of $23.5 million, $8.8 million and $7.2 million, respectively. The impact of changes in foreign exchange rates was de minimis.
Our selling, general and administrative expenses increased $67.3 million, or 8%, during the nine months ended September 30, 2013 as compared to the
same period of the prior year. The overall increase in selling, general and administrative expenses was primarily due to increases in our Concerts and Ticketing
segments of $43.6 million and $14.7 million, respectively. Excluding the decrease of approximately $0.8 million related to the impact of changes in foreign
exchange rates, selling, general and administrative expenses increased $68.1 million, or 8%.
More detailed explanations of these changes are included in the applicable segment discussions below.
Depreciation and amortization
Depreciation and amortization increased $8.0 million, or 10%, during the three months ended September 30, 2013 as compared to the same period of the
prior year. The overall increase in depreciation and amortization was primarily due to increases in our Concerts and Ticketing segments of $5.3 million and
$5.8 million, respectively. Excluding the decrease of approximately $0.2 million related to the impact of changes in foreign exchange rates, depreciation and
amortization increased $8.2 million, or 10%.
More detailed explanations of these changes are included in the applicable segment discussions below.
Gain on disposal of operating assets
Gain on disposal of operating assets for the three months ended September 30, 2013 was $9.1 million consisting primarily of the resolution during this
quarter of a $7.0 million contingent liability related to the May 2013 sale of a theatrical theater in New York in our Concerts segment. In addition, we
recognized a gain of $2.0 million in connection with additional insurance recovery for storm damage to an amphitheater located in New York in our Concerts
segment.
Gain on disposal of operating assets for the nine months ended September 30, 2013 was $42.9 million consisting primarily of a $28.9 million gain
recognized from the May 2013 sale of a theatrical theater in New York in our Concerts segment. In addition, we recognized a gain of $14.6 million in
connection with insurance recoveries for storm damage sustained to an amphitheater located in New York in our Concerts segment.
28
8/13/2019 LiveNationEntertainmentInc-10Q-110513 (3).pdf
http://slidepdf.com/reader/full/livenationentertainmentinc-10q-110513-3pdf 32/69
Table of Contents
Corporate expenses
Corporate expenses decreased $4.4 million, or 14%, during the three months ended September 30, 2013 as compared to the same period of the prior year
primarily from a reduction in stock-based compensation and Trust Note expense due to the resignation of an executive who was also Chairman of our board of
directors, on December 31, 2012.
Corporate expenses decreased $12.6 million, or 15%, during the nine months ended September 30, 2013 as compared to the same period of the prior
year primarily from a reduction in stock-based compensation and Trust Note expense due to the resignation of the executive noted above and also lower legal
expenses due to a matter settled in 2012.
Acquisition transaction expenses
Acquisition transaction expenses were $2.4 million and $1.9 million for the three months ended September 30, 2013 and 2012, respectively, consisting
primarily of costs associated with current year acquisitions and ongoing litigation relating to the Merger.
Acquisition transaction expenses for the nine months ended September 30, 2013 were $5.3 million consisting primarily of costs associated with current
year acquisitions and ongoing litigation relating to the Merger. Acquisition transaction expenses for the nine months ended September 30, 2012 were $1.3million consisting primarily of costs associated with current year acquisitions, ongoing litigation costs relating to the Merger and changes in the fair value of
acquisition-related contingent consideration.
Interest expense
Interest expense decreased $6.1 million, or 17%, during the three months ended September 30, 2013 as compared to the same period of the prior year
primarily due to the interest cost reduction realized from the August 2012 redemption of the 10.75% senior notes and from the August 2013 redemption of the
8.125% senior notes partially offset by the interest costs from the 7% senior notes issued in August 2012 and 2013.
Interest expense decreased $7.1 million, or 8%, during the nine months ended September 30, 2013 as compared to the same period of the prior year
primarily due to the net interest cost reduction realized from the August 2012 redemption of the 10.75% senior notes offset by the issuance of the original $225million principal amount of the 7% senior notes.
Our debt balances and weighted-average cost of debt, excluding unamortized debt discounts of $28.1 million and including debt premium of $8.9million, were $1.83 billion and 4.3%, respectively, at September 30, 2013.
Loss (gain) on extinguishment of debt
We recorded a loss on extinguishment of debt of $36.3 million for the three and nine months ended September 30, 2013 in connection with the
refinancing of the term loans under our senior secured credit facility and the redemption of our 8.125% senior notes in August 2013. These obligations were
paid with proceeds from incremental term loans under our amended senior secured credit facility and additional 7% senior notes.
Equity in losses (earnings) of nonconsolidated affiliates
Equity in losses (earnings) of nonconsolidated affiliates decreased to a loss of $2.4 million for the three months ended September 30, 2013 as compared
to earnings of $3.1 million for the three months ended September 30, 2012. The decrease is primarily due to the impairment of an investment in the Concerts
segment and lower earnings from investments in the Artist Nation segment during the third quarter of 2013.
Equity in earnings of nonconsolidated affiliates decreased $6.0 million during the nine months ended September 30, 2013 as compared to the same
period of the prior year primarily due to the impairment of an investment in the Concerts segment and lower earnings from investments in the Artist Nation
segment during 2013.
Other expense (income), net
Other expense (income), net was $(5.3) million and $2.2 million for the three and nine months ended September 30, 2013, respectively, and includes the
impact of changes in foreign exchange rates of $(4.4) million and $3.4 million, respectively.
Other expense (income), net was $(6.6) million and $(2.9) million for the three and nine months ended September 30, 2012, respectively, and includes
the impact of changes in foreign exchange rates of $(5.9) million and $(2.9) million, respectively.
29

8/13/2019 LiveNationEntertainmentInc-10Q-110513 (3).pdf
http://slidepdf.com/reader/full/livenationentertainmentinc-10q-110513-3pdf 33/69
Table of Contents
Income taxes
Net income tax expense for the nine months ended September 30, 2013 and 2012 was $26.4 million and $21.5 million, respectively, and consists
primarily of income tax attributable to taxable income of our foreign locations. The increase in income taxes is primarily driven by an increase in the taxable
earnings of our taxable foreign locations.
Concerts Results of Operations
Our Concerts segment operating results were, and discussions of significant variances are, as follows:
Three Months Ended
September 30, %
Change Nine Months Ended
September 30, %
Change
2013 2012 2013 2012
(in thousands) (in thousands)
Revenue $ 1,726,986 $ 1,429,912 21% $ 3,433,527 $ 2,954,635 16%
Direct operating expenses 1,487,856 1,235,786 20% 2,870,584 2,475,222 16%
Selling, general and administrative
expenses 170,005 146,528 16% 466,840 423,213 10%
Depreciation and amortization 32,821 27,508 19% 96,591 100,004 (3)%
Gain on disposal of operating assets (9,035) (8) * (43,497) (477) *
Acquisition transaction expenses 745 1,032 * 1,292 (373) *
Operating income (loss) $ 44,594 $ 19,066 * $ 41,717 $ (42,954) *
Operating margin 2.6% 1.3% 1.2% (1.5)%
Adjusted operating income ** $ 70,736 $ 49,133 44% $ 100,182 $ 60,390 66%
_______
* Percentages are not meaningful.
** AOI is defined and reconciled to operating income (loss) below.
Three Months
Concerts revenue increased $297.1 million, or 21%, during the three months ended September 30, 2013 as compared to the same period of the prior year
partially due to incremental revenue of $44.4 million resulting from various acquisitions primarily of festival promoters. In addition, revenue increased from
more shows and higher per show attendance at international arenas, North America amphitheaters and third-party stadiums and increased festival activity due
to the timing of events and growth in existing festivals partially offset by the timing of global touring activity.
Concerts direct operating expenses increased $252.1 million, or 20%, during the three months ended September 30, 2013 as compared to the same
period of the prior year partially due to incremental direct operating expenses of $46.8 million resulting from the acquisitions noted above. In addition, we
incurred higher expenses associated with the increased number of shows and higher festival activity discussed above partially offset by lower costs associatedwith the timing of global touring activity.
Concerts selling, general and administrative expenses increased $23.5 million, or 16%, during the three months ended September 30, 2013 as compared
to the same period of the prior year partially due to incremental expenses of $3.2 million associated with the acquisitions noted above and increases in
compensation costs related to improved performance and the timing of festivals . These increases were partially offset by a decrease in rent expense due to
recognition of an incentive payment for early termination of a music theater lease.
Concerts depreciation and amortization increased $5.3 million, or 19%, during the three months ended September 30, 2013 as compared to the same
period of the prior year partially due to the acceleration of amortization in 2013 resulting from a change in the estimated life of certain venue management and
leasehold intangibles.
Concerts gain on disposal of operating assets of $9.0 million for the three months ended September 30, 2013 is primarily due to the resolution of a $7.0million contingent liability related to the sale of a theatrical theater in New York and proceeds received in connection with an insurance recovery for storm
damage during Hurricane Sandy to an amphitheater in New York in October 2012.
30

8/13/2019 LiveNationEntertainmentInc-10Q-110513 (3).pdf
http://slidepdf.com/reader/full/livenationentertainmentinc-10q-110513-3pdf 34/69
Table of Contents
The improved operating income for Concerts for the three months ended September 30, 2013 was primarily driven by improved show results and higher
average attendance at our events and increased festival activity partially offset by increased compensation costs.
Nine Months
Concerts revenue increased $478.9 million, or 16%, during the nine months ended September 30, 2013 as compared to the same period of the prior year
partially due to incremental revenue of $126.3 million from various acquisitions primarily of festival promoters during the previous twelve months. In
addition, revenue increased from more shows and higher paid attendance in North America amphitheaters and third-party stadiums along with international
stadiums and arenas. These increases were partially offset by fewer North America arena shows and the mix and timing of global touring activity.
Concerts direct operating expenses increased $395.4 million, or 16%, during the nine months ended September 30, 2013 as compared to the same periodof the prior year partially due to incremental direct operating expenses of $129.6 million from the acquisitions noted above and higher expenses associated
with the increased show activity discussed above. These increases were partially offset by the mix and timing of global touring activity.
Concerts selling, general and administrative expenses increased $43.6 million, or 10%, during the nine months ended September 30, 2013 as compared
to the same period of the prior year primarily due to higher compensation costs associated with improved performance and annual increases. In addition,
incremental selling, general and administrative expenses of $6.7 million from the acquisitions noted above contributed to the increase.
Concerts depreciation and amortization decreased $3.4 million, or 3%, during the nine months ended September 30, 2013 as compared to the same
period of the prior year primarily due to $13.8 million of impairment charges recorded in the second quarter of 2012 primarily related to revenue-generating
and client/vendor relationship intangibles. There were no significant impairments during 2013. These decreases were partially offset by $6.6 million of
accelerated amortization recorded in 2013 resulting from a change in the estimated life of certain venue management and leasehold intangible assets and
incremental depreciation and amortization of $4.2 million from the acquisitions noted above.
Concerts gain on disposal of operating assets of $43.5 million for the nine months ended September 30, 2013 is primarily due to a $28.9 million gain
on sale of a theatrical theater in New York and a $14.6 million insurance recovery for storm damage during Hurricane Sandy to an amphitheater in New York
in October 2012.
The increased operating income for Concerts for the nine months ended September 30, 2013 was primarily driven by more shows and higher paid
attendance discussed above, improved results from our global touring activity resulting from lower production costs and the gain on disposal of operating
assets. These increases were partially offset by higher compensation costs.
Ticketing Results of Operations
Our Ticketing segment operating results were, and discussions of significant variances are, as follows:
Three Months Ended
September 30, %
Change Nine Months Ended
September 30, %
Change
2013 2012 2013 2012
(in thousands) (in thousands)
Revenue $ 356,809 $ 345,980 3% $ 1,019,771 $ 1,001,463 2%
Direct operating expenses 166,509 161,566 3% 481,592 467,808 3%Selling, general and administrative expenses 112,940 104,098 8% 326,799 312,099 5%
Depreciation and amortization 49,150 43,315 13% 128,648 121,284 6%
(Gain) loss on disposal of operating assets (27) 10 * (47) (145) *
Acquisition transaction expenses 221 381 * 245 46 *
Operating income $ 28,016 $ 36,610 (23)% $ 82,534 $ 100,371 (18)%
Operating margin 7.9% 10.6% 8.1% 10.0%
Adjusted operating income ** $ 80,282 $ 82,081 (2)% $ 217,440 $ 226,017 (4)%
_______
* Percentages are not meaningful.
31

8/13/2019 LiveNationEntertainmentInc-10Q-110513 (3).pdf
http://slidepdf.com/reader/full/livenationentertainmentinc-10q-110513-3pdf 35/69
Table of Contents
** AOI is defined and reconciled to operating income (loss) below.
Three Months
Ticketing revenue increased $10.8 million, or 3%, during the three months ended September 30, 2013 as compared to the same period of the prior year
primarily due to higher domestic primary and resale ticket volumes partially offset by a reduction in fees associated with the 2012 Olympics.
Ticketing direct operating expenses increased $4.9 million, or 3%, during the three months ended September 30, 2013 as compared to the same period of
the prior year primarily due to higher costs associated with increased ticket volumes discussed above partially offset by a reduction in expenses associated
with the 2012 Olympics.Ticketing selling, general and administrative expenses increased $8.8 million, or 8%, during the three months ended September 30, 2013 as compared to
the same period of prior year primarily due to increased compensation costs driven by the re-platforming of our ticketing systems and increased costs
associated with resale activity.
Ticketing depreciation and amortization increased $5.8 million, or 13%, during the three months ended September 30, 2013 as compared to the same
period of the prior year primarily due to higher amortization related to non-recoupable contract advances.
Ticketing operating income decreased for the three months ended September 30, 2013 primarily due to increased compensation costs associated with the
re-platforming of our ticketing systems, increased costs associated with resale activity, the reduction associated with the 2012 Olympics and higher
amortization of non-recoupable contract advances, partially offset by increased domestic primary and resale ticket volume.
Nine Months
Ticketing revenue increased $18.3 million, or 2%, during the nine months ended September 30, 2013 as compared to the same period of the prior year
partially due to strong primary ticket sales globally and increased domestic resale ticket volume. These increases were partially offset by a reduction in fees
associated with the 2012 Olympics.Ticketing direct operating expenses increased $13.8 million, or 3%, during the nine months ended September 30, 2013 as compared to the same period
of the prior year primarily due to costs related to the higher ticket volumes discussed above. These increases were partially offset by a reduction in expenses
associated with the 2012 Olympics and a change in fee structure on certain domestic primary ticket arrangements.
Ticketing selling, general and administrative expenses increased $14.7 million, or 5%, during the nine months ended September 30, 2013 as compared
to the same period of the prior year primarily due to increased compensation costs driven by annual salary increases and the re-platforming of our ticketing
systems along with increased costs associated with higher resale activity. These increases were partially offset by a reduction in expenses associated with the
2012 Olympics.
Ticketing depreciation and amortization increased $7.4 million, or 6%, during the nine months ended September 30, 2013 as compared to the same
period of the prior year primarily due to higher amortization related to non-recoupable contract advances.
Ticketing operating income decreased for the nine months ended September 30, 2013 primarily due to increased compensation expenses associated with
the re-platforming of our ticketing systems, increased costs associated with resale activity, the reduction associated with the 2012 Olympics and higher
amortization of non-recoupable contract advances partially offset by increases in primary and resale ticket volumes.
32

8/13/2019 LiveNationEntertainmentInc-10Q-110513 (3).pdf
http://slidepdf.com/reader/full/livenationentertainmentinc-10q-110513-3pdf 36/69
Table of Contents
Artist Nation Results of Operations
Our Artist Nation segment operating results were, and discussions of significant variances are, as follows:
Three Months Ended
September 30, %
Change Nine Months Ended
September 30, %
Change
2013 2012 2013 2012
(in thousands) (in thousands)
Revenue $ 111,060 $ 127,924 (13)% $ 261,070 $ 298,570 (13)%
Direct operating expenses 69,231 85,097 (19)% 169,563 199,106 (15)%
Selling, general and administrative expenses 29,348 22,146 33% 71,862 67,540 6%
Depreciation and amortization 10,736 13,203 (19)% 30,906 36,271 (15)%
Loss on disposal of operating assets 2 — * 681 — *
Acquisition transaction expenses (57) — * 88 401 *
Operating income (loss) $ 1,800 $ 7,478 (76)% $ (12,030) $ (4,748) *
Operating margin 1.6% 5.8% (4.6)% (1.6)%
Adjusted operating income ** $ 12,655 $ 21,034 (40)% $ 20,110 $ 32,957 (39)%
_______
* Percentages are not meaningful.
** AOI is defined and reconciled to operating income (loss) below.
Three Months
Artist Nation revenue decreased $16.9 million, or 13%, during the three months ended September 30, 2013 as compared to the same period of the prior
year primarily from the decision in July of this year by the Concerts segment to expand their platinum ticketing business and no longer outsource VIP ticket
sales to Artist Nation partially offset by higher tour merchandise sales driven by the timing of artist tours.
Artist Nation direct operating expenses decreased $15.9 million, or 19%, during the three months ended September 30, 2013 as compared to the same
period of the prior year primarily due to a reduction in costs associated with the VIP ticket sales discussed above. This decrease was partially offset by higher
costs from the increase in tour merchandise sales discussed above.
Artist Nation selling, general and administrative expenses increased $7.2 million, or 33%, during the three months ended September 30, 2013 ascompared to the same period of the prior year primarily due to higher compensation expenses in the management business based upon certain tour results.
Artist Nation depreciation and amortization decreased $2.5 million, or 19%, during the three months ended September 30, 2013 as compared to the
same period of the prior year primarily due to decreased amortization related to client/vendor relationship intangibles in the management business that were
impaired in the fourth quarter of 2012.
The decrease in operating income for Artist Nation for the three months ended September 30, 2013 was primarily driven by higher compensation
expenses partially offset by lower amortization.
Nine Months
Artist Nation revenue decreased $37.5 million, or 13%, during the nine months ended September 30, 2013 as compared to the same period of the prior
year primarily from the decision in July of this year by the Concerts segment to expand their platinum ticketing business and no longer outsource VIP ticket
sales to Artist Nation along with a reduction in management revenue associated with the departure of certain artist managers. These decreases were partially
offset by incremental revenue of $4.0 million resulting primarily from the July 2012 acquisition of a production services company.
Artist Nation direct operating expenses decreased $29.5 million, or 15%, during the nine months ended September 30, 2013 as compared to the same
period of the prior year primarily due to a reduction in costs associated with the VIP ticket sales discussed above.
Artist Nation selling, general and administrative expenses increased $4.3 million, or 6%, during the nine months ended September 30, 2013 ascompared to the same period of the prior year partially due to incremental expenses of $2.6 million associated with the acquisitions noted above and increased
compensation expenses in the management business based upon
33
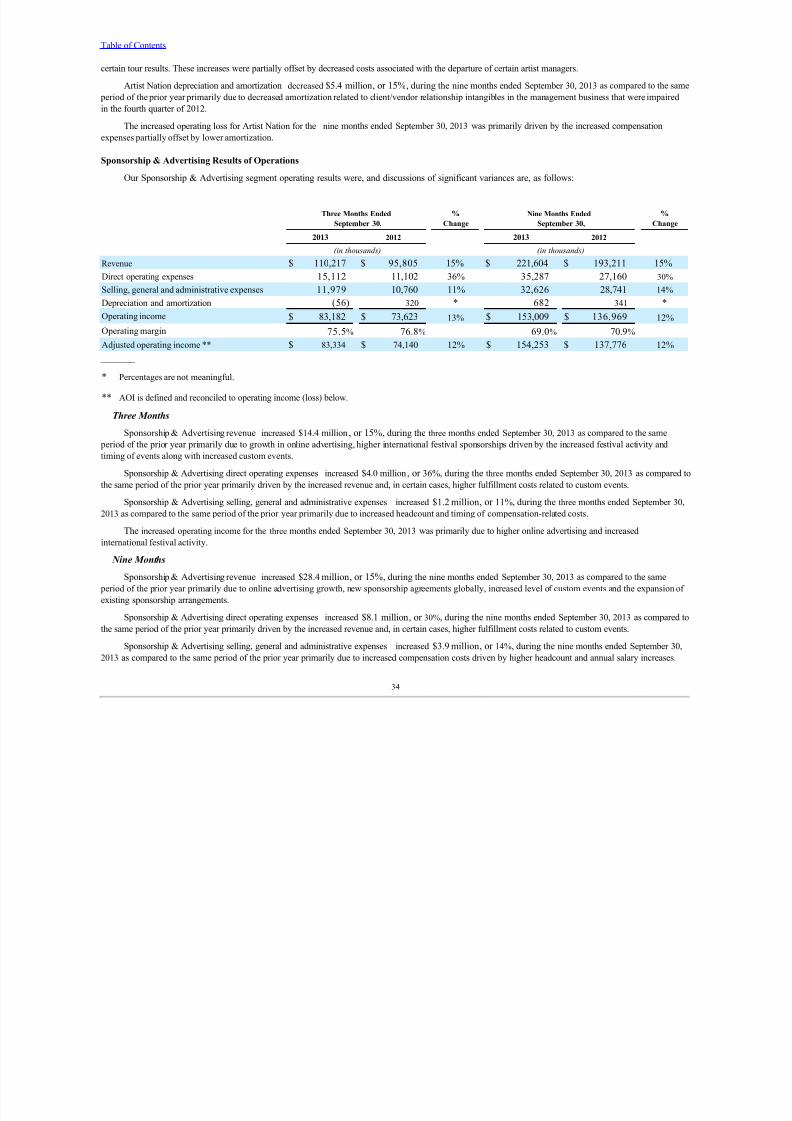
8/13/2019 LiveNationEntertainmentInc-10Q-110513 (3).pdf
http://slidepdf.com/reader/full/livenationentertainmentinc-10q-110513-3pdf 37/69
Table of Contents
certain tour results. These increases were partially offset by decreased costs associated with the departure of certain artist managers.
Artist Nation depreciation and amortization decreased $5.4 million, or 15%, during the nine months ended September 30, 2013 as compared to the same
period of the prior year primarily due to decreased amortization related to client/vendor relationship intangibles in the management business that were impaired
in the fourth quarter of 2012.
The increased operating loss for Artist Nation for the nine months ended September 30, 2013 was primarily driven by the increased compensation
expenses partially offset by lower amortization.
Sponsorship & Advertising Results of Operations
Our Sponsorship & Advertising segment operating results were, and discussions of significant variances are, as follows:
Three Months Ended
September 30, %
Change Nine Months Ended
September 30, %
Change
2013 2012 2013 2012
(in thousands) (in thousands)
Revenue $ 110,217 $ 95,805 15% $ 221,604 $ 193,211 15%
Direct operating expenses 15,112 11,102 36% 35,287 27,160 30%
Selling, general and administrative expenses 11,979 10,760 11% 32,626 28,741 14%
Depreciation and amortization (56) 320 * 682 341 *
Operating income $ 83,182 $ 73,623 13% $ 153,009 $ 136,969 12%
Operating margin 75.5% 76.8% 69.0% 70.9% Adjusted operating income ** $ 83,334 $ 74,140 12% $ 154,253 $ 137,776 12%
_______
* Percentages are not meaningful.
** AOI is defined and reconciled to operating income (loss) below.
Three Months
Sponsorship & Advertising revenue increased $14.4 million, or 15%, during the three months ended September 30, 2013 as compared to the same
period of the prior year primarily due to growth in online advertising, higher international festival sponsorships driven by the increased festival activity and
timing of events along with increased custom events.
Sponsorship & Advertising direct operating expenses increased $4.0 million, or 36%, during the three months ended September 30, 2013 as compared to
the same period of the prior year primarily driven by the increased revenue and, in certain cases, higher fulfillment costs related to custom events.
Sponsorship & Advertising selling, general and administrative expenses increased $1.2 million, or 11%, during the three months ended September 30,2013 as compared to the same period of the prior year primarily due to increased headcount and timing of compensation-related costs.
The increased operating income for the three months ended September 30, 2013 was primarily due to higher online advertising and increased
international festival activity.
Nine Months
Sponsorship & Advertising revenue increased $28.4 million, or 15%, during the nine months ended September 30, 2013 as compared to the same
period of the prior year primarily due to online advertising growth, new sponsorship agreements globally, increased level of custom events and the expansion of
existing sponsorship arrangements.
Sponsorship & Advertising direct operating expenses increased $8.1 million, or 30%, during the nine months ended September 30, 2013 as compared to
the same period of the prior year primarily driven by the increased revenue and, in certain cases, higher fulfillment costs related to custom events.
Sponsorship & Advertising selling, general and administrative expenses increased $3.9 million, or 14%, during the nine months ended September 30,
2013 as compared to the same period of the prior year primarily due to increased compensation costs driven by higher headcount and annual salary increases.
34

8/13/2019 LiveNationEntertainmentInc-10Q-110513 (3).pdf
http://slidepdf.com/reader/full/livenationentertainmentinc-10q-110513-3pdf 38/69
Table of Contents
The increased operating income for the nine months ended September 30, 2013 was primarily due to higher online advertising and new sponsorship
agreements globally partially offset by higher fulfillment costs for certain custom events and increased compensation costs.
Reconciliation of Segment Adjusted Operating Income (Loss)
AOI is a non-GAAP financial measure that we define as operating income (loss) before acquisition expenses (including transaction costs, changes in the
fair value of accrued acquisition-related contingent consideration arrangements, payments under the Trust Note and acquisition-related severance),
depreciation and amortization (including goodwill impairment), loss (gain) on disposal of operating assets and non-cash and certain stock-based compensation
expense (including expense associated with grants of certain stock-based awards which were classified as liabilities) . We use AOI to evaluate the performance
of our operating segments. We believe that information about AOI assists investors by allowing them to evaluate changes in the operating results of our portfolioof businesses separate from non-operational factors that affect net income, thus providing insights into both operations and the other factors that affect reported
results. AOI is not calculated or presented in accordance with GAAP. A limitation of the use of AOI as a performance measure is that it does not reflect the
periodic costs of certain amortizing assets used in generating revenue in our business. Accordingly, AOI should be considered in addition to, and not as a
substitute for, operating income (loss), net income (loss), and other measures of financial performance reported in accordance with GAAP. Furthermore, this
measure may vary among other companies; thus, AOI as presented herein may not be comparable to similarly titled measures of other companies.
35

8/13/2019 LiveNationEntertainmentInc-10Q-110513 (3).pdf
http://slidepdf.com/reader/full/livenationentertainmentinc-10q-110513-3pdf 39/69
Table of Contents
The following table sets forth the reconciliation of adjusted operating income (loss) to operating income (loss):
Adjusted
operating
income
(loss)
Non-cash
and stock-
based
compensation
expense
Loss (gain)
on disposal of
operating
assets
Depreciation
and
amortization Acquisition
expenses
Operating
income
(loss)
(in thousands)
Three Months Ended September 30, 2013
Concerts $ 70,736 $ 1,611 $ (9,035) $ 32,821 $ 745 $ 44,594
Ticketing 80,282 2,922 (27) 49,150 221 28,016
Artist Nation 12,655 174 2 10,736 (57) 1,800
Sponsorship & Advertising 83,334 208 — (56) — 83,182
Other and Eliminations (3,592) — — (532) — (3,060)
Corporate (22,252) 4,190 — 610 1,443 (28,495)
Total $ 221,163 $ 9,105 $ (9,060) $ 92,729 $ 2,352 $ 126,037
Three Months Ended September 30, 2012
Concerts $ 49,133 $ 1,535 $ (8) $ 27,508 $ 1,032 $ 19,066
Ticketing 82,081 1, 686 10 43,315 460 36,610
Artist Nation 21,034 353 — 13,203 — 7,478
Sponsorship & Advertising 74,140 197 — 320 — 73,623
Other and Eliminations (661) — (62) (451) — (148)Corporate (23,334) 5,906 — 789 2,085 (32,114)
Total $ 202,393 $ 9,677 $ (60) $ 84,684 $ 3,577 $ 104,515
Nine Months Ended September 30, 2013
Concerts $ 100,182 $ 4,079 $ (43,497) $ 96,591 $ 1,292 $ 41,717
Ticketing 217,440 6,060 (47) 128,648 245 82,534
Artist Nation 20,110 465 681 30,906 88 (12,030)
Sponsorship & Advertising 154,253 562 — 682 — 153,009
Other and Eliminations (1,201) — 7 (1,325) — 117
Corporate (56,851) 12,058 — 2,080 3,704 (74,693)
Total $ 433,933 $ 23,224 $ (42,856) $ 257,582 $ 5,329 $ 190,654
Nine Months Ended September 30, 2012
Concerts $ 60,390 $ 4,190 $ (477) $ 100,004 $ (373) $ (42,954)
Ticketing 226,017 4,725 (145) 121,284 (218) 100,371
Artist Nation 32,957 1,033 — 36,271 401 (4,748)
Sponsorship & Advertising 137,776 466 — 341 — 136,969
Other and Eliminations (1,100) — 367 (1,471) — 4
Corporate (59,487) 17,181 — 2,227 6,067 (84,962)
Total $ 396,553 $ 27,595 $ (255) $ 258,656 $ 5,877 $ 104,680
36

8/13/2019 LiveNationEntertainmentInc-10Q-110513 (3).pdf
http://slidepdf.com/reader/full/livenationentertainmentinc-10q-110513-3pdf 40/69
Table of Contents
Liquidity and Capital Resources
Our working capital requirements and capital for our general corporate purposes, including acquisitions and capital expenditures, are funded from
operations or from borrowings under our senior secured credit facility described below. Our cash is centrally managed on a worldwide basis. Our primary
short-term liquidity needs are to fund general working capital requirements, capital expenditures and debt service requirements while our long-term liquidity
needs are primarily related to acquisitions and debt repayment. Our primary sources of funds for our short-term liquidity needs will be cash flows from
operations and borrowings under our senior secured credit facility, while our long-term sources of funds will be from cash flows from operations, long-term
bank borrowings and other debt or equity financings. We may from time to time engage in open market purchases of our outstanding debt securities or redeem
or otherwise repay such debt.
Our balance sheet reflects cash and cash equivalents of $1.3 billion at September 30, 2013 and $1.0 billion at December 31, 2012 . Included in the
September 30, 2013 and December 31, 2012 cash and cash equivalents balance is $509.5 million and $441.6 million, respectively, of cash received that
includes the face value of tickets sold on behalf of clients and the clients’ share of convenience and order processing charges, or client cash. We generally do
not utilize client cash for our own financing or investing activities as the amounts are payable to clients on a regular basis. Our foreign subsidiaries held
approximately $471.8 million in cash and cash equivalents, excluding client cash, at September 30, 2013. We do not intend to repatriate these funds, but
would need to accrue and pay United States federal and state income taxes on any future repatriations, net of applicable foreign tax credits. We may from time
to time enter into borrowings under our revolving credit facility. If the original maturity of these borrowings is ninety days or less, we present the borrowings
and subsequent repayments on a net basis in the statement of cash flows to better represent our financing activities. Our balance sheet reflects current and long-
term debt of $1.8 billion at September 30, 2013 and $1.7 billion at December 31, 2012. Our weighted-average cost of debt, excluding the debt discounts and
including the debt premium on our term loans and notes, was 4.3% at September 30, 2013.
Our cash and cash equivalents are held in accounts managed by third-party financial institutions and consist of cash in our operating accounts and
invested cash. Cash held in interest-bearing operating accounts in many cases exceeds the Federal Deposit Insurance Corporation insurance limits. The
invested cash is in interest-bearing funds consisting primarily of bank deposits and money market funds. While we monitor cash and cash equivalent
balances in our operating accounts on a regular basis and adjust the balances as appropriate, these balances could be impacted if the underlying financial
institutions fail. To date, we have experienced no loss or lack of access to our cash and cash equivalents; however, we can provide no assurances that access
to our cash and cash equivalents will not be impacted by adverse conditions in the financial markets.
For our Concerts segment, we generally receive cash related to ticket revenue at our owned and/or operated venues in advance of the event, which is
recorded in deferred revenue until the event occurs. With the exception of some upfront costs and artist deposits, which are recorded in prepaid expenses until
the event occurs, we pay the majority of event-related expenses at or after the event.
We view our available cash as cash and cash equivalents, less ticketing-related client cash, less event-related deferred revenue, less accrued expenses due
to artists and cash collected on behalf of others for ticket sales, plus event-related prepaids. This is essentially our cash available to, among other things, repay
debt balances, make acquisitions and finance capital expenditures.
Our intra-year cash fluctuations are impacted by the seasonality of our various businesses. Examples of seasonal effects include our Concerts and Artist
Nation segments, which report the majority of their revenue in the second and third quarters. Cash inflows and outflows depend on the timing of event-related
payments but the majority of the inflows generally occur prior to the event. See “—Seasonality” below. We believe that we have sufficient financial flexibility to
fund these fluctuations and to access the global capital markets on satisfactory terms and in adequate amounts, although there can be no assurance that this
will be the case, and capital could be less accessible and/or more costly given current economic conditions. We expect cash flows from operations and
borrowings under our senior secured credit facility, along with other financing alternatives, to satisfy working capital requirements, capital expenditures and
debt service requirements for at least the succeeding year.
We may need to incur additional debt or issue equity to make other strategic acquisitions or investments. There can be no assurance that such financing
will be available to us on acceptable terms or at all. We may make significant acquisitions in the near term, subject to limitations imposed by our financing
agreements and market conditions.
The lenders under our revolving loans and counterparties to our interest rate hedge agreements consist of banks and other third-party financial
institutions. While we currently have no indications or expectations that such lenders and counterparties will be unable to fund their commitments as required,
we can provide no assurances that future funding availability will not be impacted by adverse conditions in the financial markets. Should an individual
lender default on its obligations, the remaining lenders would not be required to fund the shortfall, resulting in a reduction in the total amount available to us
for future borrowings, but would remain obligated to fund their own commitments. Should any counterparty to our interest rate hedge agreements default on its
obligations, we could experience higher interest rate volatility during the period of any such default.
37

8/13/2019 LiveNationEntertainmentInc-10Q-110513 (3).pdf
http://slidepdf.com/reader/full/livenationentertainmentinc-10q-110513-3pdf 41/69
Table of Contents
Sources of Cash
Senior Secured Credit Facility
In August 2013, we amended our existing senior secured credit facility. The amended senior secured credit facility provides for (i) a $115 million term
loan A, (ii) a $950 million term loan B and (iii) a $335 million revolving credit facility. The amendment to the senior secured credit facility provided the
existing term loan A and term loan B lenders with an option to convert their outstanding principal amounts into the new term loans. In addition, subject to
certain conditions, we have the right to increase such facilities by at least $450 million or a greater amount so long as the senior secured leverage ratio
calculated on a pro-forma basis (as defined in the credit agreement) is no greater than 3.25x. The revolving credit facility provides for borrowings up to the
amount of the facility with sublimits of up to (i) $150 million to be available for the issuance of letters of credit, (ii) $50 million to be available for swingline
loans and (iii) $150 million to be available for borrowings in Euros or British Pounds and (iv) $50 million to be available for borrowings in one or more other
approved currencies. The amended senior secured credit facility is secured by a first priority lien on substantially all of our tangible and intangible personal
property and the domestic subsidiaries that are guarantors, and by a pledge of substantially all of the shares of stock, partnership interests and limited
liability company interests of our direct and indirect domestic subsidiaries and 65% of each class of capital stock of any first-tier foreign subsidiaries.
The interest rates per annum applicable to revolving credit facility loans and term loan A under the amended senior secured credit facility are, at our
option, equal to either LIBOR plus 2.25% or a base rate plus 1.25%, subject to stepdowns based on our net leverage ratio. The interest rates per annum
applicable to term loan B are, at our option, equal to either LIBOR plus 2.75% or a base rate plus 1.75%, subject to a LIBOR floor of 0.75% and a base rate
floor of 1.75%. We are required to pay a commitment fee of 0.5% per year on the undrawn portion available under the revolving credit facility, subject to
stepdowns based on our net leverage ratio, and variable fees on outstanding letters of credit.
For the term loan A, we are required to make quarterly payments ranging from $1.4 million to $13.8 million with the balance due at maturity in August
2018. For the term loan B, we are required to make quarterly payments of $2.4 million with the balance due at maturity in August 2020. The revolving credit
facility matures in August 2018. We are also required to make mandatory prepayments of the loans under the credit agreement, subject to specified exceptions,
from excess cash flow, and with the proceeds of asset sales, debt issuances and specified other events.
During the nine months ended September 30, 2013, we made principal payments totaling $483.2 million primarily due to lenders electing not to convert
their outstanding term loans in connection with the August 2013 amendment. At September 30, 2013, the outstanding balances on the amended term loans, net
of discounts, were $1.0 billion. There were no borrowings under the revolving credit facility as of September 30, 2013. Based on our letters of credit of $68.3million, $266.7 million was available for future borrowings.
7% Senior Notes
In August 2013, we issued an additional $200 million principal amount of notes under the indenture governing our existing 7% senior notes due 2020
with a $9.0 million premium, which increased the total principal amount of such notes outstanding to $425 million. Interest on the notes is payable semi-
annually in cash in arrears on March 1 and September 1 of each year, beginning on March 1, 2013, and the notes will mature on September 1, 2020. We may
redeem some or all of the notes at any time prior to September 1, 2016 at a price equal to 100% of the aggregate principal amount, plus any accrued and
unpaid interest to the date of redemption, plus a ‘make-whole’ premium using a discount rate equal to the treasury rate plus 50 basis points. We may also
redeem up to 35% of the notes from the proceeds of certain equity offering prior to September 1, 2015, at a price equal to 107% of the principal amount, plus
any accrued and unpaid interest. In addition, on or after September 1, 2016, we may redeem at its option some or all of the notes at redemption prices that
start at 103.5% of their principal amount, plus any accrued and unpaid interest to the date of redemption. We must make an offer to redeem the notes at 101%
of the aggregate principal amount, plus any accrued and unpaid interest to the repurchase date, if it experiences certain defined changes of control.
Proceeds from the issuance of the additional 7% senior notes and refinancing of our senior secured credit facility, excluding the outstanding principal
amounts for lenders who elected to convert their outstanding term loans, of $802.2 million were used to repay $472.5 million principal amount of our
outstanding borrowings under our existing senior secured credit facility, to repay all of our outstanding 8.125% senior notes due 2018 with a principal amount
of $250 million and to pay the related ‘make-whole’ premium on these senior notes and total accrued interest and fees of $35.3 million along with related fees
and expenses for the refinancing of $22.0 million, leaving $22.4 million in additional cash for general corporate purposes. We recorded $36.3 million as a loss
on extinguishment of debt related to this refinancing.
Debt Covenants
Our senior secured credit facility contains a number of covenants and restrictions that, among other things, requires us to satisfy certain financial
covenants and restricts our and our subsidiaries’ ability to incur additional debt, make certain
38

8/13/2019 LiveNationEntertainmentInc-10Q-110513 (3).pdf
http://slidepdf.com/reader/full/livenationentertainmentinc-10q-110513-3pdf 42/69
Table of Contents
investments and acquisitions, repurchase our stock and prepay certain indebtedness, create liens, enter into agreements with affiliates, modify the nature of
our business, enter into sale-leaseback transactions, transfer and sell material assets, merge or consolidate, and pay dividends and make distributions (with
the exception of subsidiary dividends or distributions to the parent company or other subsidiaries on at least a pro-rata basis with any noncontrolling interest
partners). Non-compliance with one or more of the covenants and restrictions could result in the full or partial principal balance of the credit facility becoming
immediately due and payable. The amended senior secured credit facility agreement has a covenant, measured quarterly, that relates to total leverage. The
consolidated total leverage covenant requires us to maintain a ratio of consolidated total funded debt to consolidated EBITDA (both as defined in the amended
credit agreement) of 5.25x over the trailing four consecutive quarters through September 30, 2014. The consolidated total leverage ratio will reduce to 5.0x on
December 31, 2014, 4.75x on December 31, 2015 and 4.50x on December 31, 2016.
The indenture governing our 7% senior notes contains covenants that limit, among other things, our ability and the ability of our restricted subsidiariesto incur certain additional indebtedness and issue preferred stock, make certain distributions, investments and other restricted payments, sell certain assets,
agree to any restrictions on the ability of restricted subsidiaries to make payments to us, merge, consolidate or sell all of our assets, create certain liens, and
engage in transactions with affiliates on terms that are not arms-length. Certain covenants, including those pertaining to incurrence of indebtedness, restricted
payments, asset sales, mergers and transactions with affiliates will be suspended during any period in which the notes are rated investment grade by both
rating agencies and no default or event of default under the indenture has occurred and is continuing. The 7% senior notes contain two incurrence-based
financial covenants, as defined, requiring a minimum fixed charge coverage ratio of 2.0x and a maximum secured indebtedness leverage ratio of 3.25x.
Some of our other subsidiary indebtedness includes restrictions on entering into various transactions, such as acquisitions and disposals, and prohibits
payment of ordinary dividends. They also have financial covenants including minimum consolidated EBITDA to consolidated net interest payable, minimum
consolidated cash flow to consolidated debt service and maximum consolidated debt to consolidated EBITDA, all as defined in the applicable debt agreements.
As of September 30, 2013, we believe we were in compliance with all of our debt covenants. We expect to remain in compliance with all of our debt
covenants throughout 2013.
Disposals of Assets
During the nine months ended September 30, 2013, we received $83.1 million of proceeds primarily related to the sale of a theatrical theater in New York
and insurance recoveries for storm damage sustained to an amphitheater located in New York. During the nine months ended September 30, 2012, we received
$7.8 million of proceeds primarily related to the sale of an amphitheater in Ohio. These proceeds are presented net of any cash included in the businesses sold.
Stock Option Exercises
During the nine months ended September 30, 2013, we received $80.6 million of proceeds from the exercise of stock options. There were no significant
stock option exercises for the nine months ended September 30, 2012.
Uses of Cash
Acquisitions
When we make acquisitions, the acquired entity may have cash on its balance sheet at the time of acquisition. All amounts discussed in this section are
presented net of any cash acquired. During the nine months ended September 30, 2013, we used $26.4 million of cash primarily for the acquisition in our
Concerts segment of a controlling interest in a festival promoter in May 2013. During the nine months ended September 30, 2012, we used $71.3 million of
cash primarily for acquisitions in our Concerts segment of Michael Coppel Ventures Pty Ltd in April 2012, Cream Holdings Limited in May 2012 and HARD
Events LLC in June 2012.
Intangibles
During the nine months ended September 30, 2012, we used $14.6 million of cash primarily related to the acquisition of the rights to a festival in
Europe. There were no significant purchases during the nine months ended September 30, 2013.
Deferred and Contingent Consideration
During the nine months ended September 30, 2012, we used $10.6 million of cash to settle deferred and contingent consideration liabilities for certain
past acquisitions. There were no significant payments during the nine months ended September 30, 2013.
39

8/13/2019 LiveNationEntertainmentInc-10Q-110513 (3).pdf
http://slidepdf.com/reader/full/livenationentertainmentinc-10q-110513-3pdf 43/69
Table of Contents
Capital Expenditures
Venue and ticketing operations are capital intensive businesses, requiring continual investment in our existing venues and ticketing systems in order to
address fan and artist expectations, technological industry advances and various federal, state and/or local regulations.
We categorize capital outlays between maintenance capital expenditures and revenue generating capital expenditures. Maintenance capital expenditures are
associated with the renewal and improvement of existing venues and technology systems, web development and administrative offices. Revenue generating
capital expenditures generally relate to the construction of new venues, major renovations to existing buildings or buildings that are being added to our venue
network, the development of new online or ticketing tools and technology enhancements. Revenue generating capital expenditures can also include smaller
projects whose purpose is to increase revenue and/or improve operating income. Capital expenditures typically increase during periods when venues are not in
operation since that is the time that such improvements can be completed.
Our capital expenditures, including accruals but excluding expenditures funded by outside parties such as landlords or replacements funded by
insurance companies, consisted of the following:
Nine Months Ended
September 30,
2013 2012
(in thousands)
Maintenance capital expenditures $ 38,489 $ 42,175
Revenue generating capital expenditures 41,594 46,035
Total capital expenditures $ 80,083 $ 88,210
Revenue generating capital expenditures during the first nine months of 2013 decreased from the same period of the prior year primarily due to the timing
of expenditures related to the re-platforming of our ticketing system, the launch of our resale ticketing product and purchases of technology and venue-relatedequipment. Excluded from revenue generating capital expenditures in 2013 is the use of $19.1 million of insurance proceeds to restore an amphitheater in New
York that sustained storm damage.
We currently expect capital expenditures to be approximately $120 million for the full year 2013.
Cash Flows
Nine Months Ended
September 30,
2013 2012
(in thousands)
Cash provided by (used in):
Operating activities $ 264,538 $ 89,039
Investing activities $ (42,490) $ (167,804)
Financing activities $ 83,700 $ 4,809
Operating Activities
Cash provided by operating activities was $264.5 million for the nine months ended September 30, 2013, compared to $89.0 million for the nine
months ended September 30, 2012. The $175.5 million increase in cash provided by operating activities resulted primarily from an increase in the cash-
related portion of net income and net changes in the event-related operating accounts which are dependent on the timing of ticket sales along with the size and
number of events for upcoming periods. During the first nine months of 2013, we collected more accounts receivable, had lower payments of prepaid event-
related expenses and accrued event-related expenses, partially offset by lower cash received for future events which decreased deferred revenue and higher long-
term artist-related payments as compared to the same period in the prior year.
Investing Activities
Cash used in investing activities was $42.5 million for the nine months ended September 30, 2013, compared to $167.8 million for the nine months
ended September 30, 2012. The $125.3 million decrease in cash used in investing activities is primarily due to higher proceeds received from the disposal of
operating assets and lower payments for acquisitions and purchases of intangible assets partially offset by purchases of property, plant and equipment as
compared to the same period in the prior year. See “—Sources of Cash” and “—Uses of Cash ” above for further discussion.
40

8/13/2019 LiveNationEntertainmentInc-10Q-110513 (3).pdf
http://slidepdf.com/reader/full/livenationentertainmentinc-10q-110513-3pdf 44/69
Table of Contents
Financing Activities
Cash provided by financing activities was $83.7 million for the nine months ended September 30, 2013, compared to $4.8 million for the nine months
ended September 30, 2012. The $78.9 million increase in cash provided by financing activities is primarily a result of higher proceeds from the exercise of
stock options in 2013 as compared to the same period in the prior year. In addition, during 2013, we paid down the outstanding 8.125% senior notes and
refinanced the existing senior secured credit facility through the issuance of additional notes under our existing 7% senior notes and amendment of our senior
secured credit facility. During 2012, we paid down our 10.75% senior notes through the issuance of the original $225 principal amount of our 7% senior
notes and increased term loan borrowings under our senior secured credit facility.
Seasonality
Our Concerts, Artist Nation and Sponsorship & Advertising segments typically experience higher operating income in the second and third quarters as
our outdoor venues and festivals are primarily used in or occur during May through September, and our artist touring activity is higher. In addition, the
timing of the on-sale of tickets and the tours of top-grossing acts can impact comparability of quarterly results year over year, although annual results may not
be impacted. Our Ticketing segment sales are impacted by fluctuations in the availability of events for sale to the public, which vary depending upon
scheduling by our clients.
Cash flows from our Concerts segment typically have a slightly different seasonality as payments are often made for artist performance fees and
production costs in advance of the date the related event tickets go on sale. These artist fees and production costs are expensed when the event occurs. Once
tickets for an event go on sale, we generally begin to receive payments from ticket sales at our owned and/or operated venues in advance of when the event
occurs. We record these ticket sales as revenue when the event occurs.
Market Risk
We are exposed to market risks arising from changes in market rates and prices, including movements in foreign currency exchange rates and interest
rates.
Foreign Currency Risk
We have operations in countries throughout the world. The financial results of our foreign operations are measured in their local currencies. As a result,
our financial results could be affected by factors such as changes in foreign currency exchange rates or weak economic conditions in the foreign markets in
which we have operations. Currently, we do not operate in any hyper-inflationary countries. Our foreign operations reported operating income of $110.7
million for the nine months ended September 30, 2013. We estimate that a 10% change in the value of the United States dollar relative to foreign currencies
would change our operating income for the nine months ended September 30, 2013 by $11.1 million. As of September 30, 2013, our primary foreign exchange
exposure included the Euro, British Pound, Australian Dollar and Canadian Dollar . This analysis does not consider the implication such currency
fluctuations could have on the overall economic conditions of the United States or other foreign countries in which we operate or on the results of operations of
our foreign entities.
We primarily use forward currency contracts in addition to options to reduce our exposure to foreign currency risk associated with short-term artist fee
commitments. We also may enter into forward currency contracts to minimize the risks and/or costs associated with changes in foreign currency rates on
forecasted operating income. At September 30, 2013, we had forward currency contracts and options outstanding with a notional amount of $48.6 million.
Interest Rate Risk
Our market risk is also affected by changes in interest rates. We had $1.8 billion of total debt, net of unamortized discounts and premiums,
outstanding as of September 30, 2013. Of the total amount, taking into consideration existing interest rate hedges, we had $738.7 million of fixed-rate debt and
$1.1 billion of floating-rate debt.
Based on the amount of our floating-rate debt as of September 30, 2013, each 25 basis point increase or decrease in interest rates would increase or
decrease our annual interest expense and cash outlay by approximately $2.7 million when the floor rate is not applicable. This potential increase or decrease is
based on the simplified assumption that the level of floating-rate debt remains constant with an immediate across-the-board increase or decrease as of
September 30, 2013 with no subsequent change in rates for the remainder of the period.
At September 30, 2013, we have an interest rate swap agreement that is designated as a cash flow hedge for accounting purposes. The interest rate swap
had a notional amount of $11.7 million at September 30, 2013, to effectively convert a portion of our floating-rate debt to a fixed-rate basis and expires in May
2015. The fair value of this agreement at September 30, 2013 was a liability of $0.1 million. This agreement was put into place to reduce the variability of the
cash flows from the interest payments related to certain financing.
41
8/13/2019 LiveNationEntertainmentInc-10Q-110513 (3).pdf
http://slidepdf.com/reader/full/livenationentertainmentinc-10q-110513-3pdf 45/69
Table of Contents
Through a subsidiary of Academy Music Holdings Limited Group, we have two interest rate swap agreements with a $30.6 million aggregate notional
amount at September 30, 2013, that effectively convert a portion of our floating-rate debt to a fixed-rate basis. Both agreements expire in December 2015. Also,
in connection with the financing of the redevelopment of the O 2 Dublin, we have an interest rate swap agreement with a notional amount of $6.2 million at
September 30, 2013, that expires in December 2013, effectively converting a portion of our floating-rate debt to a fixed-rate basis. These interest rate swap
agreements have not been designated as hedging instruments. Therefore, any change in fair value is recorded in earnings during the period of the change.
We currently have 2.875% convertible senior notes due 2027 with a principal amount of $220 million. Beginning with the period commencing on
July 20, 2014 and ending on January 14, 2015, and for each of the interest periods commencing thereafter, we will pay contingent interest on the notes if the
average trading price of the notes during the five consecutive trading days ending on the second trading day immediately preceding the first day of the
applicable interest period equals or exceeds 120% of the principal amount of the notes. The contingent interest payable per note will equal 0.25% per year of theaverage trading price of such note during the applicable five trading-day reference period, payable in arrears.
Ratio of Earnings to Fixed Charges
The ratio of earnings to fixed charges is as follows:
Nine Months Ended
September 30, Year Ended December 31,
2013 2012 2012 2011 2010 2009
1.54 1.12 * * * *
* For the years ended December 31, 2012, 2011, 2010 and 2009, fixed charges exceeded earnings from continuing operations before income taxes and fixed
charges by $142.1 million, $104.4 million, $193.6 million and $116.5 million, respectively.
The ratio of earnings to fixed charges was computed on a total company basis. Earnings represent income from continuing operations before income
taxes less equity in undistributed net income (loss) of nonconsolidated affiliates plus fixed charges. Fixed charges represent interest, amortization of debtdiscount, premium and expense and the estimated interest portion of rental charges. Rental charges exclude variable rent expense for events in third-party
venues.
Recent Accounting Pronouncements
Recently Adopted Pronouncements
In February 2013, the FASB issued guidance which requires companies to disclose additional information about reclassifications out of AOCI,
including changes in AOCI balances by component and significant items reclassified out of AOCI. The new disclosure requirements are applied prospectively
and are effective for interim and annual periods beginning after December 15, 2012. We adopted this guidance on January 1, 2013.
In July 2013, the FASB issued guidance that requires a liability related to an unrecognized tax benefit to be offset against a deferred tax asset for a net
operating loss carryforward, a similar tax loss or a tax credit carryforward if certain criteria are met. The guidance is effective for interim and annual periods
beginning after December 15, 2013 and are applied prospectively to unrecognized tax benefits that exist at the effective date. Early adoption and retrospective
application of the new guidance are permitted. This guidance is consistent with our present practice and will not have a material impact on our financial
position.
Critical Accounting Policies and Estimates
The preparation of our financial statements in conformity with GAAP requires management to make estimates, judgments and assumptions that affect
the reported amounts of assets and liabilities, disclosure of contingent assets and liabilities at the date of the financial statements and the reported amount of
revenue and expenses during the reporting period. On an ongoing basis, we evaluate our estimates that are based on historical experience and on various other
assumptions that are believed to be reasonable under the circumstances. The result of these evaluations forms the basis for making judgments about the
carrying values of assets and liabilities and the reported amount of revenue and expenses that are not readily apparent from other sources. Because future
events and their effects cannot be determined with certainty, actual results could differ from our assumptions and estimates, and such difference could be
material.
Management believes that the accounting estimates involved in business combinations, impairment of long-lived assets and goodwill, revenue
recognition, litigation accruals, stock-based compensation and income taxes are the most critical to aid in fully understanding and evaluating our reported
financial results, and they require management’s most difficult, subjective or complex judgments, resulting from the need to make estimates about the effect of
matters that are inherently uncertain. These critical accounting estimates, the judgments and assumptions and the effect if actual results differ from these
assumptions are
42

8/13/2019 LiveNationEntertainmentInc-10Q-110513 (3).pdf
http://slidepdf.com/reader/full/livenationentertainmentinc-10q-110513-3pdf 46/69
Table of Contents
described in Part II, Item 7. Management’s Discussion and Analysis of Financial Condition and Results of Operations of our Annual Report on Form 10-K
filed with the SEC on February 26, 2013.
There have been no changes to our critical accounting policies during the nine months ended September 30, 2013.
Item 3. Quantitative and Qualitative Disclosures About Market Risk
Required information is within Item 2. Management’s Discussion and Analysis of Financial Condition and Results of Operations—Market Risk.
Item 4. Controls and Procedures
Evaluation of Disclosure Controls and Procedures
We have established disclosure controls and procedures to ensure that material information relating to our company, including our consolidated
subsidiaries, is made known to the officers who certify our financial reports and to other members of senior management and our board of directors.
Based on their evaluation as of September 30, 2013, our Chief Executive Officer and Chief Financial Officer have concluded that our disclosure controls
and procedures (as defined in Rules 13a-15(e) and 15d-15(e) under the Securities Exchange Act of 1934, as amended) are effective to ensure that (1) the
information required to be disclosed by us in the reports that we file or submit under the Securities Exchange Act of 1934, as amended, is recorded, processed,
summarized and reported within the time periods specified in SEC rules and forms, and (2) the information we are required to disclose in such reports is
accumulated and communicated to management, including our Chief Executive Officer and Chief Financial Officer, as appropriate to allow timely decisions
regarding required disclosure.
Our management, including our Chief Executive Officer and Chief Financial Officer, does not expect that our disclosure controls and procedures or
internal controls will prevent all possible errors and fraud. Our disclosure controls and procedures are, however, designed to provide reasonable assurance of
achieving their objectives, and our Chief Executive Officer and Chief Financial Officer have concluded that our financial controls and procedures are effectiveat that reasonable assurance level.
Changes in Internal Control Over Financial Reporting
There has been no change in our internal control over financial reporting during the period covered by this report that has materially affected, or is
reasonably likely to materially affect, our internal control over financial reporting.
43

8/13/2019 LiveNationEntertainmentInc-10Q-110513 (3).pdf
http://slidepdf.com/reader/full/livenationentertainmentinc-10q-110513-3pdf 47/69
Table of Contents
PART II—OTHER INFORMATION
Item 1. Legal Proceedings
Information regarding our legal proceedings can be found in Part I Financial Information — Item 1. Financial Statements — Note 6 — Commitments and
Contingent Liabilities
Item 1A. Risk Factors
While we attempt to identify, manage and mitigate risks and uncertainties associated with our business to the extent practical under the circumstances,
some level of risk and uncertainty will always be present. Part 1, Item 1A of our 2012 Annual Report on Form 10-K filed with the SEC on February 26,2013, describes some of the risks and uncertainties associated with our business which have the potential to materially affect our business, financial condition
or results of operations. We do not believe that there have been any material changes to the risk factors previously disclosed in our 2012 Annual Report on
Form 10-K.
Item 2. Unregistered Sales of Equity Securities and Use of Proceeds
On July 31, 2013, August 2, 2013 and August 9, 2013, the holders of warrants to purchase an aggregate of 500,000 shares of common stock exercised
such warrants in a cashless net exercise transaction, as permitted by the terms of such warrants, which resulted in the issuance to holders of an aggregate of
91,976 shares of common stock after shares were withheld to cover the exercise price. As a result, there were no net proceeds to the Company. The holders
were the members of Marcy Media LLC, which originally received the warrants in connection with the formation of a joint venture with the Company. The
common stock was issued in reliance upon the exemptions from registration provided by Section 4(a)(2) of the Securities Act and Rule 506 of Regulation D,
based on representations from the holders of the warrants to support our reasonable belief that such exemptions were available.
Item 3. Defaults Upon Senior Securities
None.
Item 5. Other Information
None.
Item 6. Exhibits
The information in the Exhibit Index of this Quarterly Report on Form 10-Q is incorporated into this Item 6 by reference.
44

8/13/2019 LiveNationEntertainmentInc-10Q-110513 (3).pdf
http://slidepdf.com/reader/full/livenationentertainmentinc-10q-110513-3pdf 48/69
Table of Contents
SIGNATURES
Pursuant to the requirements of the Securities Exchange Act of 1934, the registrant has duly caused this report to be signed on its behalf by the
undersigned, thereunto duly authorized, on November 5, 2013.
LIVE NATION ENTERTAINMENT, INC.
By: /s/ Brian Capo
Brian Capo
Chief Accounting Officer (Duly Authorized Officer)
45

8/13/2019 LiveNationEntertainmentInc-10Q-110513 (3).pdf
http://slidepdf.com/reader/full/livenationentertainmentinc-10q-110513-3pdf 49/69
Table of Contents
EXHIBIT INDEX
Exhibit Description
Incorporated by Reference Filed
Here
with
Exhibit
No. Form File No. Exhibit No. Filing Date
2.1
Agreement and Plan of Merger, dated February
10, 2009, between Ticketmaster Entertainment,
Inc. and Live Nation, Inc.
8-K
001-32601
2.1
2/13/2009
10.1
Amendment No. 2 to the credit agreement, dated
as of August 16, 2013, entered into by andamong Live Nation Entertainment, Inc., the
Guarantors identified therein, JPMorgan Chase
Bank, N.A., as administrative agent and
collateral agent for the Lenders, JPMorgan
Chase Bank, N.A., Toronto Branch, asCanadian agent and J.P. Morgan Europe
Limited, as London agent
X
10.2
Second Supplemental Indenture, entered into as
of August 13, 2013, among Live Nation
Entertainment, Inc., the Guarantors party
thereto and The Bank of New York Mellon
Trust Company, N.A., as trustee
8-K
001-32601
10.1
8/16/2013
10.3
Separation Agreement, entered into as of August
31, 2013, by and between Live NationWorldwide, Inc. and Nathan Hubbard
8-K
001-32601
10.2
8/16/2013
31.1 Certification of Chief Executive Officer. X
31.2 Certification of Chief Financial Officer. X
32.1
Section 1350 Certification of Chief Executive
Officer. X
32.2
Section 1350 Certification of Chief Financial
Officer. X
101.INS XBRL Instance Document X
101.SCH XBRL Taxonomy Schema Document X
101.CAL
XBRL Taxonomy Calculation Linkbase
Document X
101.DEF
XBRL Taxonomy Definition Linkbase
Document
X
101.LAB XBRL Taxonomy Label Linkbase Document X
101.PRE
XBRL Taxonomy Presentation Linkbase
Document X
46

8/13/2019 LiveNationEntertainmentInc-10Q-110513 (3).pdf
http://slidepdf.com/reader/full/livenationentertainmentinc-10q-110513-3pdf 50/69
Exhibit 10.1
AMENDMENT No. 2, dated as of August 16, 2013 (this “Amendment”), to that certain credit agreement among
LIVE NATION ENTERTAINMENT, INC., a Delaware corporation (the “Parent Borrower ”), the “Guarantors” identified in such
Credit Agreement, the lenders party thereto, JPMORGAN CHASE BANK, N.A., as Administrative Agent and Collateral Agent,
JPMORGAN CHASE BANK, N.A., TORONTO BRANCH, as Canadian Agent and J.P. MORGAN EUROPE LIMITED, as London
Agent (as such credit agreement is amended, restated, modified and supplemented from time to time, the “ Credit Agreement”);
capitalized terms used and not otherwise defined herein shall have the meanings assigned to such terms in the Credit Agreement.
WHEREAS, the Borrower desires to amend the Credit Agreement on the terms set forth herein (the “ Amended
Credit Agreement”);
WHEREAS, Section 11.01 of the Credit Agreement provides that the Credit Parties and the Required Lenders may
amend the Credit Agreement and the other Credit Documents for certain purposes;
WHEREAS, the Borrower has requested (a) new Dollar Revolving Commitments (as defined in Exhibit A hereto) in
the amount of $135,000,000 which shall replace (in an increased amount) the existing Dollar Revolving Commitments under the Credit
Agreement, (b) new Limited Currency Revolving Commitments (as defined in Exhibit A hereto) in the amount of $150,000,000 which
shall replace the existing Limited Currency Revolving Commitments under the Credit Agreement, (c) new Multicurrency Revolving
Commitments (as defined in Exhibit A hereto) in the amount of $50,000,000 which shall replace the existing Multicurrency Revolving
Commitments under the Credit Agreement, (d) new Term A-1 Loans (as defined in Exhibit A hereto) in an aggregate principal amount
of $115,000,000 to refinance (in an increased amount) Term A Loans under the Credit Agreement and (e) new Term B-1 Loans (as
defined in Exhibit A hereto) in an aggregate principal amount of $950,000,000 to refinance Term B Loans under the Credit Agreement;
WHEREAS, each Lender with Term B Loans that has executed this Amendment in its capacity as a Term B Lender
and checked the box “Term B Lender Conversion Option” has agreed to have its outstanding Term B Loans converted to Term B-1
Loans on the Amendment No. 2 Effective Date;
WHEREAS, each Lender with Term B Loans that has executed this Amendment in its capacity as a Term B Lender
and checked the box “Term B Lender Non-Conversion Option” has agreed to consent to the Amendment but has not agreed to have its
outstanding Term B Loans converted to Term B-1 Loans on the Amendment No. 2 Effective Date (and such Term B Loans shall be
repaid in cash upon the Amendment No. 2 Effective Date);
WHEREAS, each Lender with Term A Loans and/or Revolving Commitments that has executed this Amendment in
its capacity as a Term A Lender and/or Revolving Lender, respectively shall consent to this Amendment;

8/13/2019 LiveNationEntertainmentInc-10Q-110513 (3).pdf
http://slidepdf.com/reader/full/livenationentertainmentinc-10q-110513-3pdf 51/69
WHEREAS, a Person that was not a Lender under the Credit Agreement prior to giving ef f ect to Amendment No. 2
shall become a Lender thereunder by signing this Amendment and not checking any boxes on such Person’s signature page hereto;
WHEREAS, the Persons identified on Schedule I hereto have severally agreed to provide (i) Dollar Revolving
Commitments, (ii) Limited Currency Revolving Commitments, (c) Multicurrency Revolving Commitments, (d) Term A-1 Loans and
(e) Additional Ter m B-1 Commitments (as defined in Exhibit A hereto), in the respective amounts set forth opposite such Persons’
names on Schedule I hereto under the captions “Dollar Revolving Committed Amount”, “Limited Currency Revolving Committed
Amount”, “Multicurrency Revolving Committed Amount”, “Term A-1 Loan Committed Amount” and “Additional Term B-1
Committed Amount” respectively; and
WHEREAS, JPMorgan Chase Bank, N.A. is executing this agreement in respect of its commitment to provide the
Additional Term B-1 Commitment under this Amendment No. 2 (in such capacity, the “Additional Term B-1 Lender ”).
NOW, THEREFORE, in consideration of the premises contained herein and for other good and valuable consideration,
the receipt and sufficiency of which are hereby acknowledged, the parties hereto, intending to be legally bound hereby, agree as follows:
Section I. Amendment. The Credit Agreement is, effective as of the Amendment No. 2 Effective Date(as defined below), hereby amended to delete the stricken text (indicated textually in the same manner as the following example:stricken text) and to add the double-underlined text (indicated textually in the same manner as the following example: double-underlined text) as set forth in the pages of the Credit Agreement attached as Exhibit A hereto (which, for clarity, reflects theamendments made pursuant to Amendment No. 1).
All of the Exhibits to the Credit Agreement are replaced by the Exhibits attached as Exhibit B hereto (including the amendment
and restatement of the U.S. Security Agreement and the U.S. Pledge Agreement). To the extent any such Exhibit is to be executed by
the Administrative Agent or Collateral Agent the Lenders hereby authorize the Administrative Agent or Collateral Agent, as the case
may be, to execute such agreement or other document. For the avoidance of doubt, the U.S. Security Agreement and the U.S. Pledge
Agreement shall be amended and restated and re-executed on the Amendment No. 2 Effective Date and the Lenders hereby authorize
and instruct the Collateral Agent to enter into such amended and restated agreements.
Each Schedule to the Credit Agreement other than Schedule 2.01 is replaced by the Schedules attached as Exhibit C hereto.
Section 2. Effectiveness. Section 1 of this Amendment shall become effective on the date that the conditions in
Section 5.01 and 5.02 of the Amended Credit Agreement are satisfied (the “ Amendment No. 2 Effective Date”) at which time the
Credit Agreement in effect prior to date hereof shall be replaced in its entirety by the Credit Agreement attached hereto as Exhibit A .

8/13/2019 LiveNationEntertainmentInc-10Q-110513 (3).pdf
http://slidepdf.com/reader/full/livenationentertainmentinc-10q-110513-3pdf 52/69
Section 3. Counterparts; Integration; Effectiveness . This Amendment may be executed in counterparts (and by
different parties hereto in different counterparts), each of which shall constitute an original, but all of which when taken together shall
constitute a single contract. This Amendment constitutes the entire contract among the parties relating to the subject matter hereof and
supersedes any and all previous agreements and understandings, oral or written, relating to the subject matter hereof. Except as provided
in Section 5.01 of the Credit Agreement, this Amendment shall become effective when it shall have been executed by the
Administrative Agent and when the Administrative Agent shall have received counterparts hereof that, when taken together, bear the
signatures of each of the other parties hereto. Delivery of an executed counterpart of a signature page of this Amendment by telecopy or
other electronic imaging means shall be as effective as delivery of a manually executed counterpart of this Amendment.
Section 4. Applicable Law. THIS AMENDMENT SHALL BE GOVERNED BY, AND CONSTRUED IN
ACCORDANCE WITH, THE LAW OF THE STATE OF NEW YORK.
Section 5. Headings. Section headings herein are included for convenience of reference only and shall not affect the
interpretation of this Amendment.
Section 6. Effect of Amendment . Except as expressly set forth herein, (i) this Amendment shall not by implication or
otherwise limit, impair, constitute a waiver of or otherwise affect the rights and remedies of the Lenders, the Administrative Agent or
any other Agent, in each case under the Credit Agreement or any other Credit Document, and (ii) shall not alter, modify, amend or in
any way affect any of the terms, conditions, obligations, covenants or agreements contained in the Credit Agreement or any other
provision of either such agreement or any other Credit Document. Each and every term, condition, obligation, covenant and agreement
contained in the Credit Agreement, after giving effect to this Amendment, or any other Credit Document is hereby ratified and re-affirmed in all respects and shall continue in full force and effect. Each Credit Party reaffirms its obligations under the Credit
Documents to which it is party and the validity of the Liens granted by it pursuant to the Collateral Documents. This Amendment shall
constitute a Credit Document for purposes of the Credit Agreement and from and after the Amendment No. 2 Effective Date, all
references to the Credit Agreement in any Credit Document and all references in the Credit Agreement to “this Agreement”,
“hereunder”, “hereof” or words of like import referring to the Credit Agreement, shall, unless expressly provided otherwise, refer to
the Credit Agreement as amended by this Amendment. Each of the Credit Parties hereby (i) consents to this Amendment, (ii) confirms
that all obligations of such Credit Party under the Credit Documents to which such Credit Party is a party shall continue to apply to the
Credit Agreement as amended hereby and (iii) agrees that all security interests granted by it pursuant to any Credit Document shall
secure the Credit Agreement as amended by this Amendment.
Section 7. SUBMISSION TO JURISDICTION; WAIVER OF VENUE; SERVICE OF PROCESS .
EACH PARTY HERETO IRREVOCABLY AND UNCONDITIONALLY SUBMITS, FOR ITSELF AND ITS PROPERTY, TO
THE

8/13/2019 LiveNationEntertainmentInc-10Q-110513 (3).pdf
http://slidepdf.com/reader/full/livenationentertainmentinc-10q-110513-3pdf 53/69
NONEXCLUSIVE JURISDICTION OF THE COURTS OF THE STATE OF NEW YORK SITTING IN THE BOROUGH OF
MANHATTAN AND OF THE UNITED STATES DISTRICT COURT FOR THE SOUTHERN DISTRICT OF SUCH STATEAND ANY APPELLATE COURT FROM ANY THEREOF, IN ANY ACTION OR PROCEEDING ARISING OUT OF OR RELATING TO THIS AMENDMENT OR ANY OTHER CREDIT DOCUMENT, OR FOR RECOGNITION OR
ENFORCEMENT OF ANY JUDGMENT, AND EACH OF THE PARTIES HERETO IRREVOCABLY AND
UNCONDITIONALLY AGREES THAT ALL CLAIMS IN RESPECT OF ANY SUCH ACTION OR PROCEEDING MAY BE
HEARD AND DETERMINED IN SUCH NEW YORK STATE COURT OR, TO THE FULLEST EXTENT PERMITTED BY
APPLICABLE LAW, IN SUCH FEDERAL COURT.EACH OF THE PARTIES HERETO AGREES THAT A FINALJUDGMENT IN ANY SUCH ACTION OR PROCEEDING SHALL BE CONCLUSIVE AND MAY BE ENFORCED IN OTHER
JURISDICTIONS BY SUIT ON THE JUDGMENT OR IN ANY OTHER MANNER PROVIDED BY LAW. NOTHING IN THIS
AMENDMENT OR IN ANY OTHER CREDIT DOCUMENT SHALL AFFECT ANY RIGHT THAT ANY PARTY HERETO
MAY OTHERWISE HAVE TO BRING ANY ACTION OR PROCEEDING RELATING TO THIS AMENDMENT OR ANYOTHER CREDIT DOCUMENT AGAINST ANY OTHER PARTY HERETO OR ITS PROPERTIES IN THE COURTS OF ANY
JURISDICTION.
EACH PARTY HERETO IRREVOCABLY AND UNCONDITIONALLY WAIVES, TO THE FULLESTEXTENT PERMITTED BY APPLICABLE LAW, ANY OBJECTION THAT IT MAY NOW OR HEREAFTER HAVE TO THE
LAYING OF VENUE OF ANY ACTION OR PROCEEDING ARISING OUT OF OR RELATING TO THIS AMENDMENT OR
ANY OTHER CREDIT DOCUMENT IN ANY COURT REFERRED TO IN THE PRIOR PARAGRAPH OF THIS SECTION.EACH OF THE PARTIES HERETO HEREBY IRREVOCABLY WAIVES, TO THE FULLEST EXTENT PERMITTED BY
APPLICABLE LAW, THE DEFENSE OF AN INCONVENIENT FORUM TO THE MAINTENANCE OF SUCH ACTION OR PROCEEDING IN ANY SUCH COURT.
EACH PARTY HERETO IRREVOCABLY CONSENTS TO SERVICE OF PROCESS IN THE MANNER
PROVIDED FOR NOTICES IN SECTION 11.02 OF THE CREDIT AGREEMENT. NOTHING IN THIS AMENDMENT WILL
AFFECT THE RIGHT OF ANY PARTY HERETO TO SERVE PROCESS IN ANY OTHER MANNER PERMITTED BY
APPLICABLE LAW.
Section 8. WAIVER OF JURY TRIAL. EACH PARTY HERETO HEREBY IRREVOCABLY WAIVES, TO
THE FULLEST EXTENT PERMITTED BY APPLICABLE LAW, ANY RIGHT IT MAY HAVE TO A TRIAL BY JURY IN ANY
LEGAL PROCEEDING DIRECTLY OR INDIRECTLY ARISING OUT OF OR RELATING TO THIS AMENDMENT OR ANY
OTHER CREDIT DOCUMENT OR THE TRANSACTIONS CONTEMPLATED HEREBY OR THEREBY (WHETHER
BASED ON CONTRACT, TORT OR ANY OTHER THEORY). EACH PARTY HERETO (A) CERTIFIES THAT NO
REPRESENTATIVE, AGENT OR ATTORNEY OF ANY OTHER PERSON HAS REPRESENTED, EXPRESSLY OR OTHERWISE, THAT SUCH OTHER PERSON WOULD NOT, IN THE EVENT OF LITIGATION, SEEK TO ENFORCE THEFOREGOING WAIVER

8/13/2019 LiveNationEntertainmentInc-10Q-110513 (3).pdf
http://slidepdf.com/reader/full/livenationentertainmentinc-10q-110513-3pdf 54/69
AND (B) ACKNOWLEDGES THAT IT AND THE OTHER PARTIES HERETO HAVE BEEN INDUCED TO ENTER INTOTHIS AMENDMENT AND THE OTHER CREDIT DOCUMENTS BY, AMONG OTHER THINGS, THE MUTUAL WAIVERS
AND CERTIFICATIONS IN THIS SECTION.
[The remainder of this page is intentionally left blank]

8/13/2019 LiveNationEntertainmentInc-10Q-110513 (3).pdf
http://slidepdf.com/reader/full/livenationentertainmentinc-10q-110513-3pdf 55/69
IN WITNESS WHEREOF, the parties hereto have caused this Amendment to be duly executed by their respective
authorized officers as of the day and year first above written.
PARENT BORROWER:
LIVE NATION ENTERTAINMENT, INC.
By: /s/ Michael Rowles Name: Michael Rowles
Title: Executive Vice President
General Counsel and Secretary

8/13/2019 LiveNationEntertainmentInc-10Q-110513 (3).pdf
http://slidepdf.com/reader/full/livenationentertainmentinc-10q-110513-3pdf 56/69
DOMESTIC GUARANTORS:
CONNECTICUT PERFORMING ARTS PARTNERS
By: NOC, INC.,
a general partner
By: /s/ Kathy Willard Name: Kathy Willard
Title: Executive Vice President, Chief
Financial Officer and Assistant
Secretary
By: CONNECTICUT AMPHITHEATER
DEVELOPMENT CORPORATION,
a general partner
By: /s/ Kathy Willard
Name: Kathy Willard
Title: Executive Vice President, Chief
Financial Officer and Assistant
Secretary

8/13/2019 LiveNationEntertainmentInc-10Q-110513 (3).pdf
http://slidepdf.com/reader/full/livenationentertainmentinc-10q-110513-3pdf 57/69
BILL GRAHAM ENTERPRISES, INC.CELLAR DOOR VENUES, INC.
COBB’S COMEDY INC.
CONNECTICUT AMPHITHEATER DEVELOPMENT CORPORATION
CONNECTICUT PERFORMING ARTS, INC.
EVENING STAR PRODUCTIONS, INC.
EVENT MERCHANDISING INC.FILLMORE THEATRICAL SERVICES
FLMG HOLDINGS CORP.HARD EVENTS LLC
IAC PARTNER MARKETING, INC.LIVE NATION LGTOURS (USA), LLC
LIVE NATION MARKETING, INC.
LIVE NATION MTOURS (USA), INC.LIVE NATION TOURING (USA), INC.
LIVE NATION USHTOURS (USA), LLCLIVE NATION UTOURS (USA), INC.LIVE NATION WORLDWIDE, INC.
MICROFLEX 2001 LLC
NEW YORK THEATER, LLC
NOC, INC.
SHORELINE AMPHITHEATRE, LTD.
THE V.I.P. TOUR COMPANY
TICKETMASTER ADVANCE TICKETS, L.L.C.
TICKETMASTER CHINA VENTURES, L.L.C.TICKETMASTER EDCS LLC
TICKETMASTER L.L.C.TICKETMASTER MULTIMEDIA HOLDINGS LLC
TICKETMASTER NEW VENTURES HOLDINGS, INC.TICKETMASTER-INDIANA, L.L.C.TICKETWEB, LLC
TM VISTA INC.
TNA TOUR II (USA) INC.
By: /s/ Kathy Willard Name: Kathy Willard
Title: Executive Vice President, Chief Financial Officer and Assistant Secretary

8/13/2019 LiveNationEntertainmentInc-10Q-110513 (3).pdf
http://slidepdf.com/reader/full/livenationentertainmentinc-10q-110513-3pdf 58/69
HOB BOARDWALK, INC.
HOB CHICAGO, INC.
HOB ENTERTAINMENT, LLC
HOB PUNCH LINE S.F. CORP.
HOUSE OF BLUES ANAHEIM RESTAURANT CORP.HOUSE OF BLUES CLEVELAND, LLC
HOUSE OF BLUES CONCERTS, INC.
HOUSE OF BLUES DALLAS RESTAURANT CORP.HOUSE OF BLUES HOUSTON RESTAURANT CORP.HOUSE OF BLUES LAS VEGAS RESTAURANT CORP.HOUSE OF BLUES LOS ANGELES RESTAURANT CORP.
HOUSE OF BLUES MYRTLE BEACH RESTAURANT CORP.
HOUSE OF BLUES NEW ORLEANS RESTAURANT CORP.HOUSE OF BLUES ORLANDO RESTAURANT CORP.HOUSE OF BLUES RESTAURANT HOLDING CORP.
HOUSE OF BLUES SAN DIEGO RESTAURANT CORP.LIVE NATION CHICAGO, INC.
LIVE NATION CONCERTS, INC.
LIVE NATION MID-ATLANTIC, INC.
By: /s/ Michael Rowles
Name: Michael Rowles
Title: President
CAREER ARTIST MANAGEMENT LLCFRONT LINE MANAGEMENT GROUP, INC.
ILA MANAGEMENT, INC.
LIVE NATION MERCHANDISE, INC.
LIVE NATION TICKETING, LLC
LIVE NATION VENTURES, INC.MORRIS ARTISTS MANAGEMENT LLC
SPALDING ENTERTAINMENT, LLCVECTOR MANAGEMENT LLC
VECTOR WEST, LLCVIP NATION, INC.
By: /s/ Michael Rowles
Name: Michael Rowles
Title: Executive Vice President, General Counsel and Secretary

8/13/2019 LiveNationEntertainmentInc-10Q-110513 (3).pdf
http://slidepdf.com/reader/full/livenationentertainmentinc-10q-110513-3pdf 59/69
LIVE NATION - HAYMON VENTURES, LLCLIVE NATION BOGART, LLC
LIVE NATION STUDIOS, LLCLN ACQUISITION HOLDCO LLC
MICHIGAN LICENSES, LLC
MUSICTODAY, LLC
WILTERN RENAISSANCE LLC
By: LIVE NATION WORLDWIDE, INC.,its sole member
By: /s/ Kathy Willard
Name: Kathy Willard
Title: Executive Vice President, Chief Financial Officer and Assistant Secretary
EVENTINVENTORY.COM, INC.
NETTICKETS.COM, INC.
OPENSEATS, INC.PREMIUM INVENTORY, INC.
SHOW ME TICKETS, LLC
TICKETSNOW.COM, INC.TNOW ENTERTAINMENT GROUP, INC.
By: /s/ Kathy Willard
Name: Kathy Willard
Title: Executive Vice President and Assistant Secretary
HOB MARINA CITY, INC.
HOUSE OF BLUES SAN DIEGO, LLC
By: /s/ Kathy Willard
Name: Kathy Willard
Title: Executive Vice President and Chief Accounting Officer

8/13/2019 LiveNationEntertainmentInc-10Q-110513 (3).pdf
http://slidepdf.com/reader/full/livenationentertainmentinc-10q-110513-3pdf 60/69
JPMORGAN CHASE BANK, N.A.,
as Administrative Agent, Collateral Agent, L/C Issuer, Swingline Lender and a Lender
By: /s/ John Kowalczuk
Name: John G. Kowalczuk
Title: Executive Director

8/13/2019 LiveNationEntertainmentInc-10Q-110513 (3).pdf
http://slidepdf.com/reader/full/livenationentertainmentinc-10q-110513-3pdf 61/69
The undersigned evidences its consent to the amendments reflected in this Amendment.
JPMORGAN CHASE BANK, N.A.
By: /s/ John Kowalczuk Name: John G. Kowalczuk
Title: Executive Director
TERM B LENDER CONVERSION OPTION :
X The above Lender is a Term B Lender and, in such capacity, agrees to convert all of its Term B Loans into Term B-1 Loans.
TERM B LENDER NON-CONVERSION OPTION :
___The above Lender is a Term B Lender and, in such capacity, will not convert all of its Term B Loans into Term B-1 Loans.
TERM A LENDERS AND REVOLVING LENDERS :
X The above Lender is a Term A Lender and/or Revolving Lender.

8/13/2019 LiveNationEntertainmentInc-10Q-110513 (3).pdf
http://slidepdf.com/reader/full/livenationentertainmentinc-10q-110513-3pdf 62/69
Schedule I
Dollar Revolving Commitments
Dollar Revolving Lender
Dollar Revolving
Committed Amount
Dollar Revolving
Commitment
Percentage
JPMorgan Chase Bank, N.A. $11,722,222.22 8.68312757%
Bank of America, N.A. $13,500,000.00 10.00000000%
Goldman Sachs Lending Partners LLC $13,500,000.00 10.00000000%
HSBC Bank USA, National Association $13,500,000.00 10.00000000%
Morgan Stanley Bank, N.A. $13,500,000.00 10.00000000%
The Royal Bank of Scotland plc $18,500,000.00 13.70370370%
The Bank of Nova Scotia $13,500,000.00 10.00000000%
Wells Fargo Bank, National Association $13,500,000.00 10.00000000%
Union Bank, N.A. $9,000,000.00 6.66666667%
SunTrust Bank $10,277,777.78 7.61316873%
U.S. Bank National Association $4,500,000.00 3.33333333%
Total $135,000,000.00 100.00000000%
Limited Currency Revolving Commitments
Limited Currency Revolving Lender
Limited Currency
Revolving
Committed Amount
Limited Currency
Revolving
Commitment
Percentage
JPMorgan Chase Bank, N.A. $21,666,666.67 14.44444444%
Bank of America, N.A. $15,000,000.00 10.00000000%
Goldman Sachs Lending Partners LLC $15,000,000.00 10.00000000%
HSBC Bank USA, National Association $15,000,000.00 10.00000000%
Morgan Stanley Bank, N.A. $15,000,000.00 10.00000000%
The Royal Bank of Scotland plc $15,000,000.00 10.00000000%
The Bank of Nova Scotia $15,000,000.00 10.00000000%
Wells Fargo Bank, National Association $15,000,000.00 10.00000000%
Union Bank, N.A. $10,000,000.00 6.66666667%
SunTrust Bank $8,333,333.33 5.55555556%
U.S. Bank National Association $5,000,000.00 3.33333333%
Total $150,000,000.00 100.00000000%

8/13/2019 LiveNationEntertainmentInc-10Q-110513 (3).pdf
http://slidepdf.com/reader/full/livenationentertainmentinc-10q-110513-3pdf 63/69
Multicurrency Revolving Commitments
Multicurrency Revolving Lenders
Multicurrency
Revolving
Committed Amount
Multicurrency
Revolving
Commitment
Percentage
JPMorgan Chase Bank, N.A. $15,000,000.00 30.00000000%
Bank of America, N.A. $5,000,000.00 10.00000000%
Goldman Sachs Lending Partners LLC $5,000,000.00 10.00000000%
HSBC Bank USA, National Association $5,000,000.00 10.00000000%
Morgan Stanley Bank, N.A. $5,000,000.00 10.00000000%
The Bank of Nova Scotia $5,000,000.00 10.00000000%
Wells Fargo Bank, National Association $5,000,000.00 10.00000000%
Union Bank, N.A. $3,333,333.33 6.66666667%
U.S. Bank National Association $1,666,666.67 3.33333333%
Total $50,000,000.00 100.00000000%
Term A-1 Loan Commitments
Term A-1 Lenders
Term A-1 Loan
Committed Amount
JPMorgan Chase Bank, N.A. $16,611,111.11
Bank of America, N.A. $11,500,000.00
Goldman Sachs Lending Partners LLC $11,500,000.00
HSBC Bank USA, National Association $11,500,000.00
Morgan Stanley Bank, N.A. $11,500,000.00
The Royal Bank of Scotland plc $11,500,000.00
The Bank of Nova Scotia $11,500,000.00Wells Fargo Bank, National Association $11,500,000.00
Union Bank, N.A. $7,666,666.67
SunTrust Bank $6,388,888.89
U.S. Bank National Association $3,833,333.33
Total $115,000,000.00

8/13/2019 LiveNationEntertainmentInc-10Q-110513 (3).pdf
http://slidepdf.com/reader/full/livenationentertainmentinc-10q-110513-3pdf 64/69
Additional Term B-1 Loan Commitments
Additional Term B-1 Lender
Additional Term B-1 Loan
Committed Amount
JPMorgan Chase Bank, N.A. $ 490,495,365.53
Total $ 490,495,365.53

8/13/2019 LiveNationEntertainmentInc-10Q-110513 (3).pdf
http://slidepdf.com/reader/full/livenationentertainmentinc-10q-110513-3pdf 65/69
Exhibit 31.1
CERTIFICATION OF CHIEF EXECUTIVE OFFICER
CERTIFICATION
I, Michael Rapino, certify that:
1. I have reviewed this Quarterly Report on Form 10-Q of Live Nation Entertainment, Inc.;
2. Based on my knowledge, this report does not contain any untrue statement of a material fact or omit to state a material fact necessary to make the statementsmade, in light of the circumstances under which such statements were made, not misleading with respect to the period covered by this report;
3. Based on my knowledge, the financial statements, and other financial information included in this report, fairly present in all material respects the financial
condition, results of operations and cash flows of the registrant as of, and for, the periods presented in this report;
4. The registrant’s other certifying officer(s) and I are responsible for establishing and maintaining disclosure controls and procedures (as defined in Exchange
Act Rules 13a-15(e) and 15d-15(e)) and internal control over financial reporting (as defined in Exchange Act Rules 13a-15(f) and 15d-15(f)) for the registrant
and have:
a) designed such disclosure controls and procedures, or caused such disclosure controls and procedures to be designed under our supervision, to ensure
that material information relating to the registrant, including its consolidated subsidiaries, is made known to us by others within those entities, particularly
during the period in which this report is being prepared;
b) designed such internal control over financial reporting, or caused such internal control over financial reporting to be designed under our supervision,
to provide reasonable assurance regarding the reliability of financial reporting and the preparation of financial statements for external purposes in accordance
with generally accepted accounting principles;
c) evaluated the effectiveness of the registrant’s disclosure controls and procedures and presented in this report our conclusions about the effectiveness of
the disclosure controls and procedures, as of the end of the period covered by this report based on such evaluation; and
d) disclosed in this report any change in the registrant’s internal control over financial reporting that occurred during the registrant’s most recent fiscal
quarter (the registrant’s fourth fiscal quarter in the case of an annual report) that has materially affected, or is reasonably likely to materially affect, the
registrant’s internal control over financial reporting; and
5. The registrant’s other certifying officer(s) and I have disclosed, based on our most recent evaluation of internal control over financial reporting, to the
registrant’s auditors and the audit committee of the registrant’s board of directors (or persons performing the equivalent functions):
a) all significant deficiencies and material weaknesses in the design or operation of internal control over financial reporting which are reasonably likely
to adversely affect the registrant’s ability to record, process, summarize and report financial information; and
b) any fraud, whether or not material, that involves management or other employees who have a significant role in the registrant’s internal control over
financial reporting.
Date: November 5, 2013
By: /s/: Michael Rapino
Michael Rapino
President and Chief Executive Officer

8/13/2019 LiveNationEntertainmentInc-10Q-110513 (3).pdf
http://slidepdf.com/reader/full/livenationentertainmentinc-10q-110513-3pdf 66/69
Exhibit 31.2
CERTIFICATION OF CHIEF FINANCIAL OFFICER
CERTIFICATION
I, Kathy Willard, certify that:
1. I have reviewed this Quarterly Report on Form 10-Q of Live Nation Entertainment, Inc.;
2. Based on my knowledge, this report does not contain any untrue statement of a material fact or omit to state a material fact necessary to make the statementsmade, in light of the circumstances under which such statements were made, not misleading with respect to the period covered by this report;
3. Based on my knowledge, the financial statements, and other financial information included in this report, fairly present in all material respects the financial
condition, results of operations and cash flows of the registrant as of, and for, the periods presented in this report;
4. The registrant’s other certifying officer(s) and I are responsible for establishing and maintaining disclosure controls and procedures (as defined in Exchange
Act Rules 13a-15(e) and 15d-15(e)) and internal control over financial reporting (as defined in Exchange Act Rules 13a-15(f) and 15d-15(f)) for the registrant
and have:
a) designed such disclosure controls and procedures, or caused such disclosure controls and procedures to be designed under our supervision, to ensure
that material information relating to the registrant, including its consolidated subsidiaries, is made known to us by others within those entities, particularly
during the period in which this report is being prepared;
b) designed such internal control over financial reporting, or caused such internal control over financial reporting to be designed under our supervision,
to provide reasonable assurance regarding the reliability of financial reporting and the preparation of financial statements for external purposes in accordance
with generally accepted accounting principles;
c) evaluated the effectiveness of the registrant’s disclosure controls and procedures and presented in this report our conclusions about the effectiveness of
the disclosure controls and procedures, as of the end of the period covered by this report based on such evaluation; and
d) disclosed in this report any change in the registrant’s internal control over financial reporting that occurred during the registrant’s most recent fiscal
quarter (the registrant’s fourth fiscal quarter in the case of an annual report) that has materially affected, or is reasonably likely to materially affect, the
registrant’s internal control over financial reporting; and
5. The registrant’s other certifying officer(s) and I have disclosed, based on our most recent evaluation of internal control over financial reporting, to the
registrant’s auditors and the audit committee of the registrant’s board of directors (or persons performing the equivalent functions):
a) all significant deficiencies and material weaknesses in the design or operation of internal control over financial reporting which are reasonably likely
to adversely affect the registrant’s ability to record, process, summarize and report financial information; and
b) any fraud, whether or not material, that involves management or other employees who have a significant role in the registrant’s internal control over
financial reporting.
Date: November 5, 2013
By: /s/ Kathy Willard
Kathy Willard
Chief Financial Officer

8/13/2019 LiveNationEntertainmentInc-10Q-110513 (3).pdf
http://slidepdf.com/reader/full/livenationentertainmentinc-10q-110513-3pdf 67/69
Exhibit 32.1
SECTION 1350 CERTIFICATION OF CHIEF EXECUTIVE OFFICER
In connection with this Quarterly Report of Live Nation Entertainment, Inc. (the “Company”) on Form 10-Q for the quarter ended September 30, 2013
as filed with the Securities and Exchange Commission on the date hereof (the “Report”), I, Michael Rapino, President and Chief Executive Officer of the
Company, certify, pursuant to 18 U.S.C. Section 1350, as adopted pursuant to Section 906 of the Sarbanes-Oxley Act of 2002, that:
1. The report fully complies with the requirements of Section 13(a) or 15(d) of the Securities Exchange Act of 1934; and
2. The information contained in the report fairly presents, in all material respects, the financial condition and results of operations of the Company.
Date: November 5, 2013
By: /s/ Michael Rapino
Michael Rapino
President and Chief Executive Officer
A signed original of this written statement required by Section 906 has been provided to the Company and will be retained by the Company and furnished to
the Securities and Exchange Commission or its staff upon request.

8/13/2019 LiveNationEntertainmentInc-10Q-110513 (3).pdf
http://slidepdf.com/reader/full/livenationentertainmentinc-10q-110513-3pdf 68/69
Exhibit 32.2
SECTION 1350 CERTIFICATION OF CHIEF FINANCIAL OFFICER
In connection with this Quarterly Report of Live Nation Entertainment, Inc. (the “Company”) on Form 10-Q for the quarter ended September 30, 2013
as filed with the Securities and Exchange Commission on the date hereof (the “Report”), I, Kathy Willard, Chief Financial Officer of the Company, certify,
pursuant to 18 U.S.C. Section 1350, as adopted pursuant to Section 906 of the Sarbanes-Oxley Act of 2002, that:
1. The report fully complies with the requirements of Section 13(a) or 15(d) of the Securities Exchange Act of 1934; and
2. The information contained in the report fairly presents, in all material respects, the financial condition and results of operations of the Company.
Date: November 5, 2013
By: /s/ Kathy Willard
Kathy Willard
Chief Financial Officer
A signed original of this written statement required by Section 906 has been provided to the Company and will be retained by the Company and furnished to
the Securities and Exchange Commission or its staff upon request.

8/13/2019 LiveNationEntertainmentInc-10Q-110513 (3).pdf
http://slidepdf.com/reader/full/livenationentertainmentinc-10q-110513-3pdf 69/69


