Livelihood assets and socio-economic characteristics of ...
14
Corresponding author: Vincent Ezikornwor Weli Department of Geography and Environmental Management, University of Port Harcourt, Port Harcourt, Nigeria. Copyright © 2021 Author(s) retain the copyright of this article. This article is published under the terms of the Creative Commons Attribution Liscense 4.0. Livelihood assets and socio-economic characteristics of communities to flood hazards in Central Niger Delta, Nigeria Fidelis Onyekweli Agwumafa, Vincent Ezikornwor Weli * and Sunday Olatunde Eludoyin Department of Geography and Environmental Management, University of Port Harcourt, Port Harcourt, Nigeria. World Journal of Advanced Research and Reviews, 2021, 11(03), 009–022 Publication history: Received on 21 July 2021; revised on 29 August 2021; accepted on 31 August 2021 Article DOI: https://doi.org/10.30574/wjarr.2021.11.3.0408 Abstract The study examined the livelihood assets and socio-economic characteristics of communities to flood hazards In Niger Delta, Nigeria. The population of the study consists of communities impacted by flood within the Niger Delta States. Purposive and random sampling methods were adopted in selecting the sample size of the respondents for this study as three of those most vulnerable Local Government Areas are selected. A self-designed instruments titled “Livelihood Assets and Socio-economic Characteristics of Communities” were used for data collection. Face and content validities of the instruments were ensured. Its instrument consists of 10-item while grand mean statistics was used to test the null hypotheses at 0.05 level of significance. The study found among others that considering the various factors that may have contributed to flooding residents’ strategy to mitigate and survive its effects are imminent. Actions to control and/or cope with the factors that are mainly responsible for flooding in the study area are more than necessary in order to save human lives and forestall loss of properties to flood ravage. Based on the findings, the study recommended that massive campaign against improper dumping of refuse and public awareness of flood risks should be highlighted; creation of awareness among people living in disaster-prone areas of the risk they face and how best to respond when it occurs can be done to enhance local people’s confidence and empower them to act when faced with danger and there should be policies that target the marginalized in society, such as women, children, elderly, or the poor otherwise these groups will remain most vulnerable. Keywords: Livelihood; Socio-economic; Flood hazards; Central Niger Delta; Nigeria 1. Introduction Flood is considered to be one of the most devastating and frequently occurring natural hazards in the world. Impacts of flood disaster on the society and its effect on sustainable development are overwhelming in recent years. The increasing climate change, accompanied with excessive rainfalls and its devastating consequences remain indelible in the lives of many people and the environment [1]. Over the years and in almost every part of the world, excessive rainfall due to climate change have resulted in flooding, which has claimed lives and properties. These unpalatable experiences have placed many countries, on hold in their struggle for development. As the world’s population increase at an alarming rate with increase in infrastructural development on the rise, more lives and properties are becoming vulnerable to the risk of flood hazards whenever extreme events occur [2], [3]. The devastating effects are recorded in terms of mortality and economic risk by both national and international agencies. Although research claims that the mortality rate is reducing globally due to the established early warning systems in some countries (mostly the developed), but in some localities, especially in the developing and under developed countries, those living in the coastal areas, increasing deaths are witnessed because of their level of exposures and vulnerability.
Transcript of Livelihood assets and socio-economic characteristics of ...

Corresponding author: Vincent Ezikornwor Weli Department of Geography and Environmental Management, University of Port Harcourt, Port Harcourt, Nigeria.
Copyright © 2021 Author(s) retain the copyright of this article. This article is published under the terms of the Creative Commons Attribution Liscense 4.0.
Livelihood assets and socio-economic characteristics of communities to flood hazards in Central Niger Delta, Nigeria
Fidelis Onyekweli Agwumafa, Vincent Ezikornwor Weli * and Sunday Olatunde Eludoyin
Department of Geography and Environmental Management, University of Port Harcourt, Port Harcourt, Nigeria.
World Journal of Advanced Research and Reviews, 2021, 11(03), 009–022
Publication history: Received on 21 July 2021; revised on 29 August 2021; accepted on 31 August 2021
Article DOI: https://doi.org/10.30574/wjarr.2021.11.3.0408
Abstract
The study examined the livelihood assets and socio-economic characteristics of communities to flood hazards In Niger Delta, Nigeria. The population of the study consists of communities impacted by flood within the Niger Delta States. Purposive and random sampling methods were adopted in selecting the sample size of the respondents for this study as three of those most vulnerable Local Government Areas are selected. A self-designed instruments titled “Livelihood Assets and Socio-economic Characteristics of Communities” were used for data collection. Face and content validities of the instruments were ensured. Its instrument consists of 10-item while grand mean statistics was used to test the null hypotheses at 0.05 level of significance. The study found among others that considering the various factors that may have contributed to flooding residents’ strategy to mitigate and survive its effects are imminent. Actions to control and/or cope with the factors that are mainly responsible for flooding in the study area are more than necessary in order to save human lives and forestall loss of properties to flood ravage. Based on the findings, the study recommended that massive campaign against improper dumping of refuse and public awareness of flood risks should be highlighted; creation of awareness among people living in disaster-prone areas of the risk they face and how best to respond when it occurs can be done to enhance local people’s confidence and empower them to act when faced with danger and there should be policies that target the marginalized in society, such as women, children, elderly, or the poor otherwise these groups will remain most vulnerable.
Keywords: Livelihood; Socio-economic; Flood hazards; Central Niger Delta; Nigeria
1. Introduction
Flood is considered to be one of the most devastating and frequently occurring natural hazards in the world. Impacts of flood disaster on the society and its effect on sustainable development are overwhelming in recent years. The increasing climate change, accompanied with excessive rainfalls and its devastating consequences remain indelible in the lives of many people and the environment [1]. Over the years and in almost every part of the world, excessive rainfall due to climate change have resulted in flooding, which has claimed lives and properties. These unpalatable experiences have placed many countries, on hold in their struggle for development. As the world’s population increase at an alarming rate with increase in infrastructural development on the rise, more lives and properties are becoming vulnerable to the risk of flood hazards whenever extreme events occur [2], [3]. The devastating effects are recorded in terms of mortality and economic risk by both national and international agencies. Although research claims that the mortality rate is reducing globally due to the established early warning systems in some countries (mostly the developed), but in some localities, especially in the developing and under developed countries, those living in the coastal areas, increasing deaths are witnessed because of their level of exposures and vulnerability.

World Journal of Advanced Research and Reviews, 2021, 11(03), 009–022
10
The severity with which flood disasters occur is on the increase in many regions of the world. Nigeria is no exception as in 2012, it experienced an unprecedented flood disaster that affected half of the 36 states including Rivers State, with 21 million people displaced; 597,476 houses destroyed or damaged; over 363 people killed and an estimated loss of USD 19.6 billion [4]
It has also been predicted that 70% of Nigeria's 36 states are at risk from flooding in 2013 [1]. Consequently, there has been an increase in recognition by both governments and multilateral agencies of the need to mainstream flood risk reduction into development plans. Nigeria’s (2003) agenda 21 document spelt out objectives to combat floods which include providing a master plan for flood control and relief measures for victims; mitigate floods through the relevant land use laws and edicts; improve institutional capacity for flood prediction and public awareness programmes and minimize the impact of floods through the provision and maintenance of appropriate infrastructure.
However, governments in Nigeria have consistently failed to systematically treat risk reduction from floods as an integrated, cross-sectoral objective. Instead, they have dealt with flood risk primarily within the very narrow framework of flood control, improved preparedness, relief and rehabilitation and preparedness capabilities and expose support to affected groups, consequently, flood hazards continue to cause great damage to infrastructure and loss of life. Furthermore, although international databases on disasters such as the database of the Centre for Research on Epidemiology of Disasters (CRED), exist, their application for vulnerability measurement is limited by the fact that the data does not give sufficient information to assess the various vulnerabilities at different spatial levels and units and also the fact that reported damages predominantly focus on direct costs and losses, often excluding indirect losses such as the long-term socio-economic impacts of a disaster [5]. Additionally, the different definitions of the categories used in these statistics, such as "affected" or "injury" are a complication when trying to make comparisons and analysis [6]. Moreover, although government disaster managers are generally aware of the propensity of many flood disaster scenarios in Rivers state and indeed Nigeria, the fact that their occurrence and consequences are often sudden, random and not well predicted creates difficulty in getting the appropriate response. This makes analysis of the vulnerability at local level necessary in order to identify weak points needing special attention during disaster situations.
Accordingly, livelihood resilience as the building block of this study is conceptualized as “the capacity of all people across generations to sustain and improve their livelihood opportunities and well-being despite environmental, economic, social, and political disturbances” [7]. Livelihood assets refer to the resource base of people. Assets are often represented as a pentagon in the Sustainable Livelihoods Framework, consisting of the following five categories: natural resources (also called ‘natural capital’), physical reproducible goods (‘physical capital’), monetary resources (‘financial capital’), manpower with different skills (‘human capital’), social networks of various kinds (‘social capital’) [8]. These various categories cover the following types of issues and details according [9], [10] and [11].
1.1. Human capital
Labour capacity, health and nutritional status, employable skills and knowledge; education; employable skills; and local employment opportunities.
1.2. Natural capital
Access to land, water, wildlife, flora, forest; access to common property resources (e.g. rangelands, places of worships, water reservoirs/ponds); access to agricultural inputs (e.g. seed, fertilizers, insecticides); access to irrigation infrastructure; livestock holding; and crops (staples, cash, vegetables, fruits).
1.3. Social capital
Refers to those stocks of social trust/status, social organizations; norms and networks that people and links with family and friends; and confidence.
1.4. Physical capital
Houses, vehicles, equipment/ mechanical infrastructure, livestock; water supply; housing; communications, roads, bridges and access to markets
1.4.1. Financial capital
Wages; individual or communal savings, gold/jewellery, access to regular income, net access to credit, insurance, and indebtedness
World Journal of Advanced Research and Reviews, 2021, 11(03), 009–022
11
A close examination of the global disaster databases from EM-DAT for the last three decades (1982-2012) revealed that climatic events (flood, storms, extreme temperature and droughts) accounts for about 69% of total economic losses globally with flood events causing 25% of all the total losses [12]. United Nation reports a 35% increase in flood economic risks, driven by the increasing people’s exposure and economic assets experienced in the last decades [12]. In Nigeria, flood accounts for the highest occurring natural hazards, with great consequences on the life and property [13]. Despite the almost yearly occurrence of flood hazards and the huge risks associated with them, it appears not much works have been done presently on livelihood, resilience and capacity assessment of communities. The present study examined the livelihood assets and socio-economic communities to flood hazards in Niger Delta regions, Nigeria.
2. Material and methods
The study made use of both primary and secondary sources of data. The primary data sources consist of field data collection and questionnaire administration, which was used to collect the required information from the respondents while the secondary data sources were books, both published and unpublished materials.
2.1. Research Methodology
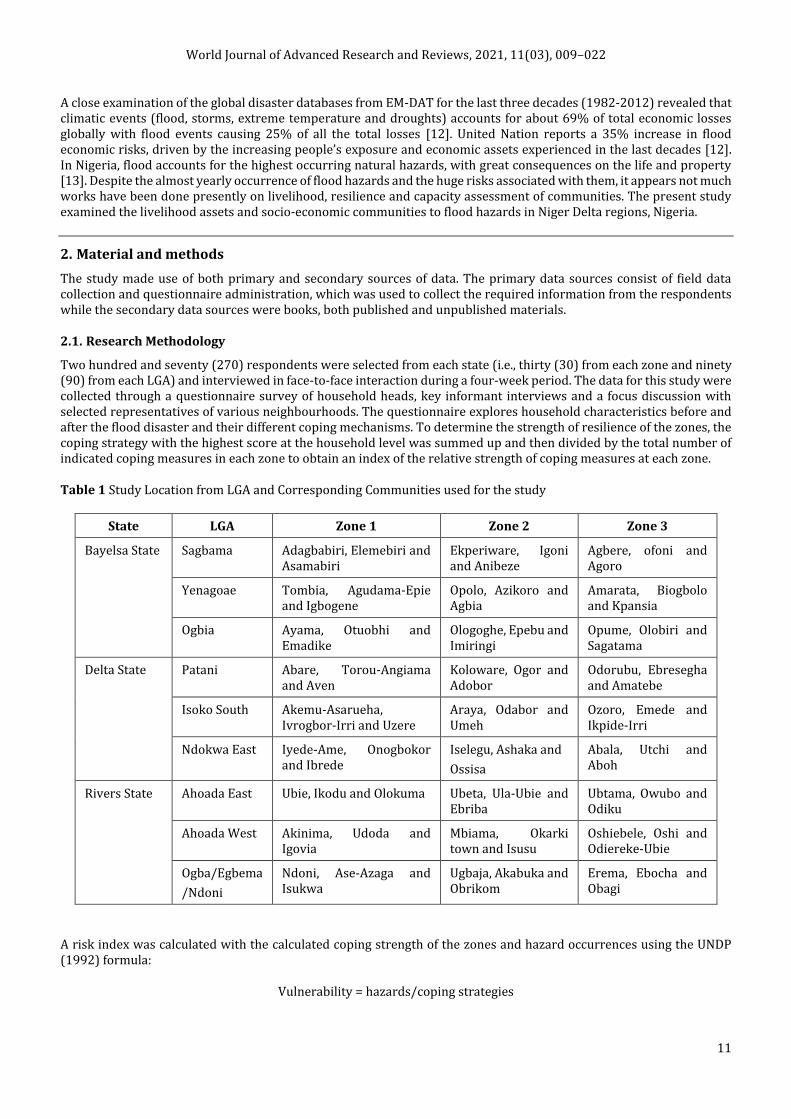
Two hundred and seventy (270) respondents were selected from each state (i.e., thirty (30) from each zone and ninety (90) from each LGA) and interviewed in face-to-face interaction during a four-week period. The data for this study were collected through a questionnaire survey of household heads, key informant interviews and a focus discussion with selected representatives of various neighbourhoods. The questionnaire explores household characteristics before and after the flood disaster and their different coping mechanisms. To determine the strength of resilience of the zones, the coping strategy with the highest score at the household level was summed up and then divided by the total number of indicated coping measures in each zone to obtain an index of the relative strength of coping measures at each zone.
Table 1 Study Location from LGA and Corresponding Communities used for the study
State LGA Zone 1 Zone 2 Zone 3
Bayelsa State Sagbama Adagbabiri, Elemebiri and Asamabiri
Ekperiware, Igoni and Anibeze
Agbere, ofoni and Agoro
Yenagoae Tombia, Agudama-Epie and Igbogene
Opolo, Azikoro and Agbia
Amarata, Biogbolo and Kpansia
Ogbia Ayama, Otuobhi and Emadike
Ologoghe, Epebu and Imiringi
Opume, Olobiri and Sagatama
Delta State Patani Abare, Torou-Angiama and Aven
Koloware, Ogor and Adobor
Odorubu, Ebresegha and Amatebe
Isoko South Akemu-Asarueha, Ivrogbor-Irri and Uzere
Araya, Odabor and Umeh
Ozoro, Emede and Ikpide-Irri
Ndokwa East Iyede-Ame, Onogbokor and Ibrede
Iselegu, Ashaka and
Ossisa
Abala, Utchi and Aboh
Rivers State
Ahoada East Ubie, Ikodu and Olokuma Ubeta, Ula-Ubie and Ebriba
Ubtama, Owubo and Odiku
Ahoada West Akinima, Udoda and Igovia
Mbiama, Okarki town and Isusu
Oshiebele, Oshi and Odiereke-Ubie
Ogba/Egbema
/Ndoni
Ndoni, Ase-Azaga and Isukwa
Ugbaja, Akabuka and Obrikom
Erema, Ebocha and Obagi
A risk index was calculated with the calculated coping strength of the zones and hazard occurrences using the UNDP (1992) formula:
Vulnerability = hazards/coping strategies
World Journal of Advanced Research and Reviews, 2021, 11(03), 009–022
12
Summation of weighted value (SWV) = Ranked rated value
Causes of flood index (CFI), Effectiveness of flood index (EFI) and severity of the effect of flood disaster index (SFI). To calculate the causes of flood index (CFI, EFI and SFI) we divided the Summation of weighted value (SWV) by the sum total.
3. Results and Findings
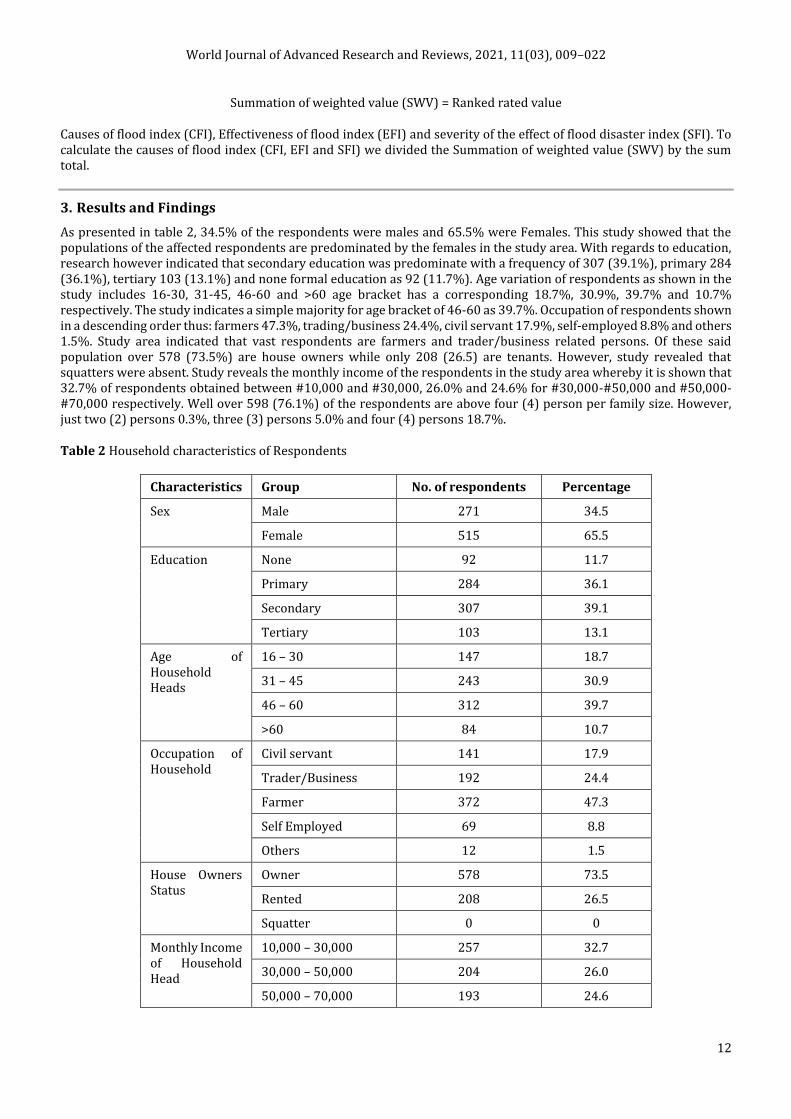
As presented in table 2, 34.5% of the respondents were males and 65.5% were Females. This study showed that the populations of the affected respondents are predominated by the females in the study area. With regards to education, research however indicated that secondary education was predominate with a frequency of 307 (39.1%), primary 284 (36.1%), tertiary 103 (13.1%) and none formal education as 92 (11.7%). Age variation of respondents as shown in the study includes 16-30, 31-45, 46-60 and >60 age bracket has a corresponding 18.7%, 30.9%, 39.7% and 10.7% respectively. The study indicates a simple majority for age bracket of 46-60 as 39.7%. Occupation of respondents shown in a descending order thus: farmers 47.3%, trading/business 24.4%, civil servant 17.9%, self-employed 8.8% and others 1.5%. Study area indicated that vast respondents are farmers and trader/business related persons. Of these said population over 578 (73.5%) are house owners while only 208 (26.5) are tenants. However, study revealed that squatters were absent. Study reveals the monthly income of the respondents in the study area whereby it is shown that 32.7% of respondents obtained between #10,000 and #30,000, 26.0% and 24.6% for #30,000-#50,000 and #50,000-#70,000 respectively. Well over 598 (76.1%) of the respondents are above four (4) person per family size. However, just two (2) persons 0.3%, three (3) persons 5.0% and four (4) persons 18.7%.
Table 2 Household characteristics of Respondents
Characteristics Group No. of respondents Percentage
Sex Male 271 34.5
Female 515 65.5
Education None 92 11.7
Primary 284 36.1
Secondary 307 39.1
Tertiary 103 13.1
Age of Household Heads
16 – 30 147 18.7
31 – 45 243 30.9
46 – 60 312 39.7
>60 84 10.7
Occupation of Household
Civil servant 141 17.9
Trader/Business 192 24.4
Farmer 372 47.3
Self Employed 69 8.8
Others 12 1.5
House Owners Status
Owner 578 73.5
Rented 208 26.5
Squatter 0 0
Monthly Income of Household Head
10,000 – 30,000 257 32.7
30,000 – 50,000 204 26.0
50,000 – 70,000 193 24.6
World Journal of Advanced Research and Reviews, 2021, 11(03), 009–022
13
>70,000 132 16.8
Family size Only 2 Persons 2 0.3
3 Persons 39 5.0
4 Persons 147 18.7
>4 598 76.1
Total
3.1. Identification of the Population of the Vulnerable Groups with respect to Socio-economic Characteristics
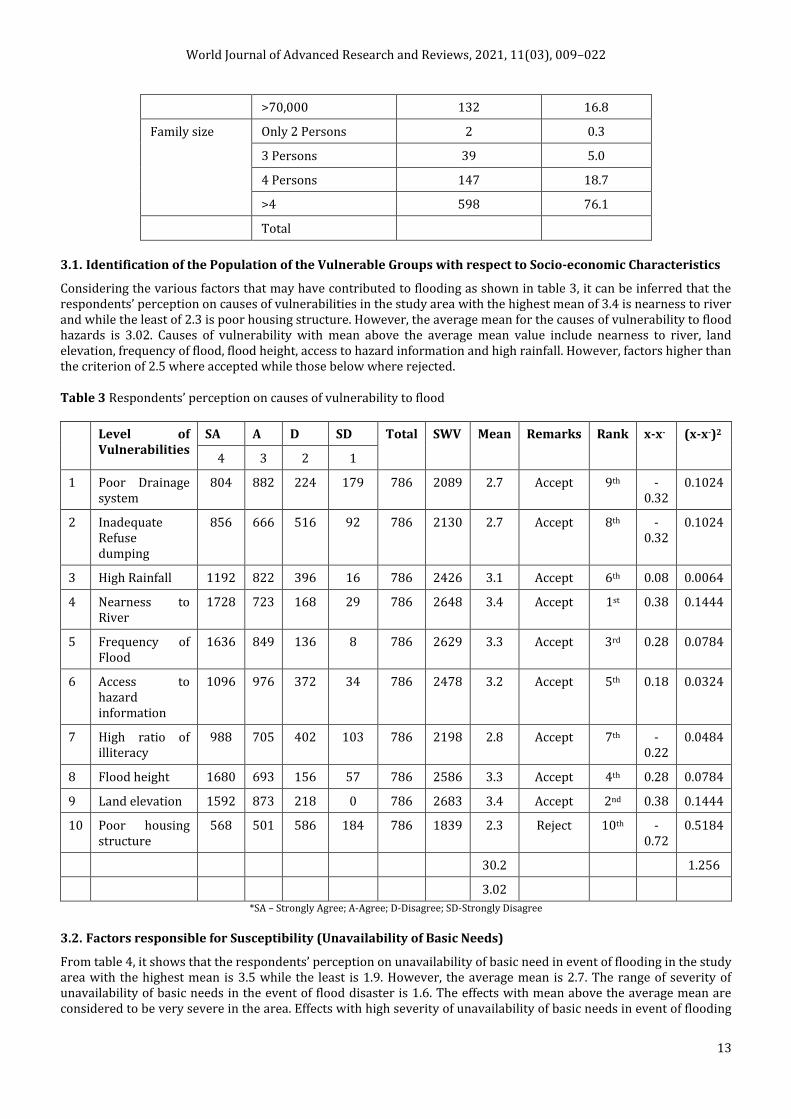
Considering the various factors that may have contributed to flooding as shown in table 3, it can be inferred that the respondents’ perception on causes of vulnerabilities in the study area with the highest mean of 3.4 is nearness to river and while the least of 2.3 is poor housing structure. However, the average mean for the causes of vulnerability to flood hazards is 3.02. Causes of vulnerability with mean above the average mean value include nearness to river, land elevation, frequency of flood, flood height, access to hazard information and high rainfall. However, factors higher than the criterion of 2.5 where accepted while those below where rejected.
Table 3 Respondents’ perception on causes of vulnerability to flood
Level of Vulnerabilities
SA A D SD Total SWV Mean Remarks Rank x-x- (x-x-)2
4 3 2 1
1 Poor Drainage system
804 882 224 179 786 2089 2.7 Accept 9th -0.32
0.1024
2 Inadequate Refuse dumping
856 666 516 92 786 2130 2.7 Accept 8th -0.32
0.1024
3 High Rainfall 1192 822 396 16 786 2426 3.1 Accept 6th 0.08 0.0064
4 Nearness to River
1728 723 168 29 786 2648 3.4 Accept 1st 0.38 0.1444
5 Frequency of Flood
1636 849 136 8 786 2629 3.3 Accept 3rd 0.28 0.0784
6 Access to hazard information
1096 976 372 34 786 2478 3.2 Accept 5th 0.18 0.0324
7 High ratio of illiteracy
988 705 402 103 786 2198 2.8 Accept 7th -0.22
0.0484
8 Flood height 1680 693 156 57 786 2586 3.3 Accept 4th 0.28 0.0784
9 Land elevation 1592 873 218 0 786 2683 3.4 Accept 2nd 0.38 0.1444
10 Poor housing structure
568 501 586 184 786 1839 2.3 Reject 10th -0.72
0.5184
30.2 1.256
3.02
*SA – Strongly Agree; A-Agree; D-Disagree; SD-Strongly Disagree
3.2. Factors responsible for Susceptibility (Unavailability of Basic Needs)
From table 4, it shows that the respondents’ perception on unavailability of basic need in event of flooding in the study area with the highest mean is 3.5 while the least is 1.9. However, the average mean is 2.7. The range of severity of unavailability of basic needs in the event of flood disaster is 1.6. The effects with mean above the average mean are considered to be very severe in the area. Effects with high severity of unavailability of basic needs in event of flooding

World Journal of Advanced Research and Reviews, 2021, 11(03), 009–022
14
are water supply, electricity, food shortage, lack of planting materials as a result of inundation of flood and absence of storage facilities with 3.5, 3.3, 3.1, 3.0 and 2.8 respectively. However, effects higher than the criterion of 2.5 where accepted and ranked accordingly while those below where rejected.
Table 4 Factors responsible for Susceptibility (Unavailability of Basic Needs)
Unavailability of Basic Needs
SA A D SD Total SWV Mean Remarks Rank x-x- (x-x-)2
4 3 2 1
1 Water Supply 1608 1116 16 4 786 2744 3.5 Accepted 1st 0.84 0.7056
2 Electricity 1568 804 220 16 786 2608 3.3 Accepted 2nd 0.64 0.4096
3 Tarred Road 268 327 624 298 786 1517 1.9 Rejected 10th -0.76
0.5776
4 Health Facilities 264 594 562 241 786 1661 2.1 Rejected 9th -0.56
0.3136
5 Mobility 376 567 566 220 786 1729 2.2 Rejected 7th -0.46
0.2116
6 Food shortage 1236 846 284 53 786 2419 3.1 Accepted 3rd 0.44 0.1936
7 Poor accommodation
792 552 372 218 786 1934 2.5 Accepted 6th -0.16
0.0256
8 Absence of storage facilities
1096 630 370 117 786 2213 2.8 Accepted 5th 0.14 0.0196
9 Inadequate communication gadgets to facilitate information
568 396 458 283 786 1705 2.2 Rejected 8th -0.46
0.2116
10 Lack of planting materials as a result of inundation of flood
1188 795 278 85 786 2346 3.0 Accepted 4th 0.34 0.1156
Total 26.6 2.784
2.66
3.3. Examining the Types of Livelihood Assets of the Residents in the Study Area
Study shows a wide variation in the respondent’s perception on the types of livelihood assets of the respondents.
Respondents’ perception on types of livelihood assets of the residents engulfed by flood as shown in table 5 in the study area has a highest mean of 3.4 is Household income while the least mean of 2.8 is quality of agricultural tools. The average mean is 3.1. However, the range of severity of flood hazard on the livelihood assets of resident is 0.6. The effects with mean above the average mean are considered to be very severe in the area. Effects with high severity of flood hazard on types livelihood assets are household income, water resources, number of workforce (human capital) and number of livestock. However, criterion mean of 2.5 was used to either accept or reject items as well as the ranking.

World Journal of Advanced Research and Reviews, 2021, 11(03), 009–022
15
Table 5 Respondents’ perception on types of Livelihood Assets of the Residents
Type of Livelihood
Assets
SA A D SD Total
SWV Mean Remarks Rank x-x- (x-x-)2
4 3 2 1
1 Cultivated Land Area
1224 753 336 61 786 2374 3.0 Accepted 6th -0.04 0.0016
2 Quality of Cultivated Land
1068 867 344 58 786 2337 3.0 Accepted 8th -0.04 0.0016
3 Quality of Agricultural Tools
1028 822 258 126 786 2234 2.8 Accepted 10th -0.24 0.0576
4 Number of Livestock
1236 882 204 81 786 2403 3.1 Accepted 4th 0.06 0.0036
5 Number of Workforce
(Human Capital)
1324 657 396 38 786 2415 3.1 Accepted 3rd 0.06 0.0036
6 Agricultural Technical Capacity
of Labourers
964 1176 188 59 786 2387 3.0 Accepted 5th -0.04 0.0016
7 Degree of Neighbourhood Communications
1152 807 232 113 786 2304 2.9 Accepted 9th -0.14 0.0196
8 Household income
1648 852 136 22 786 2658 3.4 Accepted 1st 0.36 0.1296
9 Water resources
1288 804 264 64 786 2420 3.1 Accepted 2nd 0.06 0.0036
10
Housing characteristics
1316 696 238 106 786 2356 3.0 Accepted 7th -0.04 0.0016
Total 30.4 0.224
3.04
3.4. Identification of the Resilience Level of the Different Communities
Considering the various level of resilience to flood hazard as shown in table 6, it can be inferred that the respondents’ perception on flood resilience in the study area with the highest mean of 3.3 is my household can find a safe place to evacuate to if there is an extreme flood event in the future and while the least of 1.8 is I have insured my farm and properties in the case of flood outbreak. However, factors higher than the criterion mean of 2.5 were ranked and categorised as either accepted or rejected.

World Journal of Advanced Research and Reviews, 2021, 11(03), 009–022
16
Table 6 Residents’ agreement on Resilience level to flooding in the area
S/N Identification of Resilience Level to Flooding
SA A D SD Total SWV Mean Remarks Rank x-x- (x-x-)2
4 3 2 1
1 I can replace my home quickly when it is affected by flood
1088 678 368 104 786 2238 2.8 Accepted 3rd 0.35 0.1225
2 I have insured my farm and properties in the case of flood outbreak
128 168 768 314 786 1378 1.8 Rejected 10th -0.65 0.4225
3 My household can find a safe place to evacuate to if there is an extreme flood event in the future
1504 882 138 47 786 2571 3.3 Accepted 1st 0.85 0.7225
4 I have learnt skill(s) to help me cope with event of flood
1152 921 196 93 786 2362 3.0 Accepted 2nd 0.55 0.3025
5 I have constructed barriers (levees, beams, floodwalls) to stop floodwater from entering your home.
468 327 374 373 786 1542 2.0 Rejected 9th -0.45 0.2025
6 I have sealed my walls in basements with waterproofing compounds to avoid seepage.
376 693 618 152 786 1839 2.3 Rejected 5th -0.15 0.0225
7 I listen to the radio and television for information on flooding risk.
492 456 470 276 786 1694 2.2 Rejected 7th -0.25 0.0625
8 I avoid building in a floodplain
836 852 512 37 786 2237 2.8 Accepted 4th 0.35 0.1225
9 I have an emergency plan and practice survival skills, like first aid and how to disinfect water.
388 456 542 266 786 1652 2.1 Rejected 8th -0.35 0.1225
10 I turn off utilities at the main switches or valves and also disconnect electrical appliances in the event of flooding.
516 282 728 199 786 1725 2.2 Rejected 6th -0.25 0.0625
Total 24.5 2.165
2.45
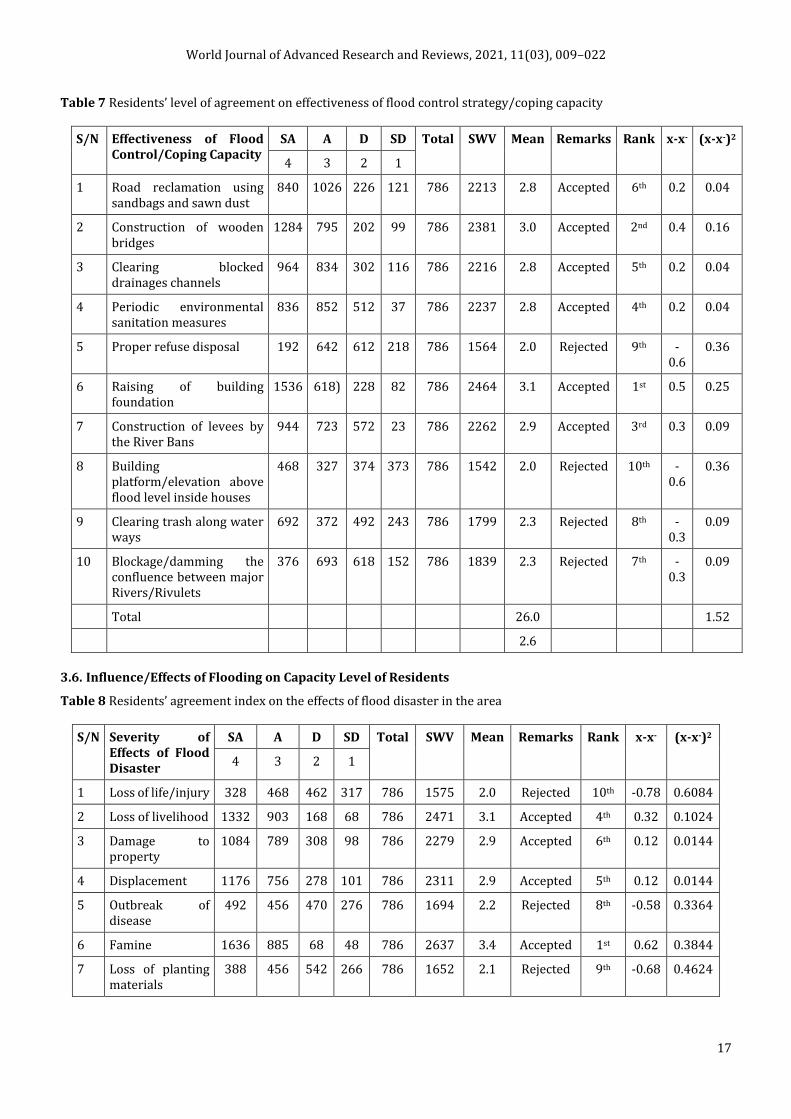
3.5. Coping Capacity of the Residents to Flooding
From table 7, the highest mean is 3.1 while the least is 2.0. However, the average mean is 2.9. The range of effectiveness of flood control strategy in the event of flood disaster is 1.1. The control measure with high deviation above the mean include; raising of building foundation (3.1), construction of wooden bridges (3.0) and construction of levees by the River bans (2.9). These factors are considered to be effective in the study area in the control of flooding.
World Journal of Advanced Research and Reviews, 2021, 11(03), 009–022
17
Table 7 Residents’ level of agreement on effectiveness of flood control strategy/coping capacity
S/N Effectiveness of Flood Control/Coping Capacity
SA A D SD Total SWV Mean Remarks Rank x-x- (x-x-)2
4 3 2 1
1 Road reclamation using sandbags and sawn dust
840 1026 226 121 786 2213 2.8 Accepted 6th 0.2 0.04
2 Construction of wooden bridges
1284 795 202 99 786 2381 3.0 Accepted 2nd 0.4 0.16
3 Clearing blocked drainages channels
964 834 302 116 786 2216 2.8 Accepted 5th 0.2 0.04
4 Periodic environmental sanitation measures
836 852 512 37 786 2237 2.8 Accepted 4th 0.2 0.04
5 Proper refuse disposal 192 642 612 218 786 1564 2.0 Rejected 9th -0.6
0.36
6 Raising of building foundation
1536 618) 228 82 786 2464 3.1 Accepted 1st 0.5 0.25
7 Construction of levees by the River Bans
944 723 572 23 786 2262 2.9 Accepted 3rd 0.3 0.09
8 Building platform/elevation above flood level inside houses
468 327 374 373 786 1542 2.0 Rejected 10th -0.6
0.36
9 Clearing trash along water ways
692 372 492 243 786 1799 2.3 Rejected 8th -0.3
0.09
10 Blockage/damming the confluence between major Rivers/Rivulets
376 693 618 152 786 1839 2.3 Rejected 7th -0.3
0.09
Total 26.0 1.52
2.6
3.6. Influence/Effects of Flooding on Capacity Level of Residents
Table 8 Residents’ agreement index on the effects of flood disaster in the area
S/N Severity of Effects of Flood Disaster
SA A D SD Total SWV Mean Remarks Rank x-x- (x-x-)2
4 3 2 1
1 Loss of life/injury 328 468 462 317 786 1575 2.0 Rejected 10th -0.78 0.6084
2 Loss of livelihood 1332 903 168 68 786 2471 3.1 Accepted 4th 0.32 0.1024
3 Damage to property
1084 789 308 98 786 2279 2.9 Accepted 6th 0.12 0.0144
4 Displacement 1176 756 278 101 786 2311 2.9 Accepted 5th 0.12 0.0144
5 Outbreak of disease
492 456 470 276 786 1694 2.2 Rejected 8th -0.58 0.3364
6 Famine 1636 885 68 48 786 2637 3.4 Accepted 1st 0.62 0.3844
7 Loss of planting materials
388 456 542 266 786 1652 2.1 Rejected 9th -0.68 0.4624

World Journal of Advanced Research and Reviews, 2021, 11(03), 009–022
18
8 Inflation of farm produce
1492 840 164 51 786 2547 3.2 Accepted 2nd 0.42 0.1764
9 Damage to farm land
1084 645 298 151 786 2178 2.8 Accepted 7th 0.02 0.0004
10 Food loss 1572 663 202 71 786 2508 3.2 Accepted 3rd 0.42 0.1764
Total 27.8 2.276
2.78
From table 8, its evident that residents’ agreement index on the effects of flood disaster in the study area with the highest mean is 3.4, while the least is 2.0. the average mean is 2.7. the range of the severity of the flood disaster variable is 1.4. The control measure with high deviation above the mean include; famine (3.4), inflation of farm produce (3.2), food loss (3.2), loss of livelihood (3.1), displacement (2.9), damage to property (2.9) and damage to farm land (2.8). The effects with mean above the average mean value are considered to be very severe in the area.
3.7. Organizational Support to Flood Hazards
Several agencies and NGOs are in charge of different forms of support in event of emergencies. From table 9, it can be inferred that in the study area the highest mean is 2.2, while the least is 1.9. The average mean is 2.05. the range of the effectiveness of organizational support to flood disaster variable is 0.3. Study shows that none of the parameter is above criterion mean hence where all rejected.
Table 9 Respondent’s perception on organizational support
S/N Respondent’s perception on organizational
support
SA A D SD Total SWV Mean Remarks Rank x-x- (x-x-)2
4 3 2 1
1 Emergency shelter
600 318) 578 241 786 1737 2.2 Rejected 2nd 0.14 0.0196
2 Public awareness program
279 345 614 271 786 1509 1.9 Rejected 9th -0.16 0.0256
3 Emergency management plan
328 384 584 284 786 1580 2.0 Rejected 6th -0.06 0.0036
4 Early warning system
472 426 550 251 786 1699 2.2 Rejected 4th 0.14 0.0196
5 Flood insurance 368 453 578 254 786 1653 2.1 Rejected 5th 0.04 0.0016
6 Institutional capacity
216 336 682 279 786 1513 1.9 Rejected 8th -0.16 0.0256
7 Search, rescue and evacuation plan
624 417 454 264 786 1759 2.2 Rejected 1st 0.14 0.0196
8 Development control
996 1041 258 61 786 1456 1.9 Rejected 10th -0.16 0.0256
9 Routine training 136 582 570 273 786 1561 2.0 Rejected 7th -0.06 0.0036
10 Financial support 516 282 728 199 786 1725 2.2 Rejected 3rd 0.14 0.0196
Total 20.6 0.164
2.06
World Journal of Advanced Research and Reviews, 2021, 11(03), 009–022
19
4. Discussion of Findings
The study revealed that 34.5% of the respondents are males while 65.5% are females as shown in table 2. Study showed clearly that females were predominant across the study area. Women are particularly vulnerable to natural disasters compared to men because of their involvement in household tasks, such as collecting water and fuel wood, cooking, managing food, and providing child care. In all of these activities, women are at closest contact with the environment [14], [15]. They may also become victims of violence and face additional problems because of long-existing gender disparities [16]. This study agrees with [17] posited that women tend to recover more slowly than men from natural disasters and play a key role in the work of recovery after flood events. As primary care-givers women are more likely than men to have responsibility for dependants in the event of a flood and conversely are also more likely to be the sole adult householder. The gender division of labor critically determines women’ s economic opportunities, constraints, incentives, and capacity and women’s position in different sectors [18]. Low level of education is one of the main factors that deter women from equal participation in socioeconomic activities with their male counterparts. Poor parents consider any expenses for educating a girl unproductive as she leaves their family after marriage [19]. According [20], the literacy rate is 62 percent for males and 53 percent for females. In 2011, the rate of labor force participation was 84.3 percent for males and 57.2 percent for females [21] and the unemployment ratio of females to males is 7.4:4.2 [22]. Women’s participation in economic activities remains unvalued at the national level because of the patriarchal structure, tradition, and norms. For example, more than three quarters of employed women of 15 years and above are found to be unpaid family laborers as opposed to less than one tenth who are self-employed and a few percentage contract workers [23]. Study also revealed that nearly all communities ravaged by flood has a high proximity to water body, low elevation, regular flood return period with a gig flood height ratio, lacks flood hazard information, high rainfall, high ratio of illiteracy, inadequate refuge dumping, poor drainage system to mention but a few. Absence of basic needs in the face of flood hazards such as water supply, electricity, food shortage, lack of planting materials as a result of inundation of flood, absence of storage facilities and poor accommodation has worsened the deployable pitiful situation. The study revealed that the assets of the respondents in the study area varied across several areas from Household Income (3.4), Water Resources (3.1), Number of Workforce (3.1), Number of Livestock (3.1), Agricultural Technical Capacity of Labourers (3.0), Cultivated Land Area (3.0), Housing Characteristics (3.0), Quality of Cultivated Land (3.0), Degree of Neighbourhood Communication (2.9) and Quality of Agricultural Tools (2.8). All the livelihood assets of the respondents were accepted as all its mean are above grand mean value. [24] stated that in Southern Nepal, flooding leads to large scale disruption of social and economic lives. The rivers bring large sediments whose deposition on agricultural lands harms productivity. The poor mostly live in these floodplains (vulnerable zones) because they have no opportunity to live in less hazardous areas. In Nepal, every year floods cause death, cultivated fields and irrigation, bridges and after rural infrastructure. He argues that policy makers, donors and relief and development agencies treat flood disaster as isolated events that break the continuity of the normal way of life. Most interventions to mitigate disasters are adhoc responses made under the assumption that an emergency support in the form of relief will help overcome the situation of hardship. Such support aims at restoring the situation to what it was before the disaster. Even when a flood disaster affects the same community every year, government, donors and non-governmental organizations respond by providing the same relief and rehabilitation measures each time. This approach does not consider the situation of a society during normal times between the occurrences of two hazard events. There are various measures that have been employed in the control of flood in the area. Among these measures include raising of building foundation, construction of wooden bridges, construction of levees by the river bans, periodic environmental sanitation measures among others. But the constant experience of flood in the study area has been very enormous in the recent time as if no action has been taken in the community. The effectiveness of the of flood control within the study area is explained using Likert’s scale. From table 7, the highest mean is 3.1 while the least is 2.0. However, the average mean is 2.9. The range of effectiveness of flood control strategy in the event of flood disaster is 1.1. The control measure with high deviation above the mean include; raising of building foundation (3.1), construction of wooden bridges (3.0) and construction of levees by the River bans (2.9). These factors are considered to be effective in the study area in the control of flooding. However, effects higher than the criterion of 2.5 where accepted and ranked accordingly while those below where rejected. [25] states that flood disaster has different impact on individuals, households and communities. People cope in different ways. Those who have the capacity after being hit by a disaster emerge faster while those without such capacity sink deeper into the spiral of impoverishment. Coping strategies include actions such as migration from floods affected areas, flood forecasting, flood insurance of animals and crops, food stockpiling, providing emergency health services and building flood shelters. They have, however, not been woven systematically into the approach to achieve security from flooding. If the approaches build on coping strategies and seek to identify new ones, they could address the social impacts of flood problems affectively at a lower social, economic and environmental cost than approaches that attempt to manage or control the resource base itself [24]. [25] give vivid view on how structural and non-structural measures could curb the menace of floods. The structural measures such as check dams, levees, flood walls and adequate drainage systems will help control periodic inundation in the areas that are liable to flooding in the following ways: The construction of structures for irrigation and the use of excess run-off water for inter-basin transfer as an alternative to

World Journal of Advanced Research and Reviews, 2021, 11(03), 009–022
20
absorb excess water from the Cameroons; Check dams will reduce peak flows; Levees and flood walls confines flow within predetermined channels; Adequate drainage systems will reduce peak flow stages of flood and divert excessive flow; In communities where the rate of flow of storm water is high, embankments should be constructed to breakdown storm water so as not to result into floods [26]. From the Table 8, it can be inferred that the severity of the effects of flood disaster in the study area with the highest mean is 3.4, while the least is 2.0. The average mean is 2.7. The range of severity of the effects of flood disaster index (SFI) variables is 1.4. The effects with mean above the average mean value are considered to be very severe in the area while those below the average mean are considered no so severe in the area. Effects with high severity of flooding index (EFI) are famine, inflation of farm produce, food loss, loss of livelihood, displacement, damage to property and damage to farm land with 3.4, 3.2, 3.2, 3.1, 2.9, 2.9 and 2.8. respectively. The least mean of the effects of flood is 2.0 which stands for loss of lives/injury in the study area. Though, loss of lives as effects of flood has the least mean of severity statistically from the perceptions of the respondents, but is the greatest loss as it is the only effect of flood that is irreplaceable.
A study by [27] suggest that floods are the most taxing of water related natural disasters to humans, material assets as well as to cultural and ecological resources affecting people and their livelihoods and claiming thousands of lives annually worldwide. According to the Australian experience, the emotional behaviour of many flood victims was shocking. The emotional cost of flooding was long lived. Follow-up studies found that about one-quarter still had not recovered from the emotional trauma of the event. Factors that contributed to the non-recovery included the severity of the flooding, the degree of the resulting financial hardship, age and socio-economic status. Elderly people on low incomes whose houses were deeply flooded were the most ill- affected [28].
NGOs are organizations that are non-profit making, voluntary and independent of government, engaged in activities concerning various societal and developmental issues. The role of the NGO's during a disaster is to have quick response and to try and save as many lives as it can with the given resources. NGO's have a faster response to situations because it does not need to clear paperwork. Study on the different NGOs in charge of different supports in event of emergencies as shown in the study area varied a crossed the across. The highest mean is 2.2 while the least is 1.9. Study reveals that mean of all the items are below the grand mean hence all the items were rejected. NGO is a legally constituted, voluntary association of individuals or groups that is neither a government agency nor profit enterprise. It is a private organisation that pursues activities to relieve suffering, promote the interests of the poor, protect the environment, provide basic social services, and/or understand community development [29]. Based on the findings of this study, it revealed that though NGOs may be aware and knowledgeable about flooding and have include it in their program and as such yet to reach their clients /beneficiaries with information related to it. The NGOs are acts as facilitators to emergencies and serves as succour to the plight of the vulnerable.
5. Conclusion
Farming is a significant part of the study area as over 48.9% of the respondents depends on farming as its livelihood assets. Most of the villagers are directly and indirectly dependent on the agricultural lands and cultivate for their livelihood. Nonetheless, the preeminent role of agriculture in reducing vulnerability to floods has not shifted significantly. Daily survival of these people is highly dependent on agricultural lands and other informal sources of livelihoods. Therefore, impact of disaster is not only dependent on access to sources of livelihoods but also on the level of dependency on these sources of livelihoods. Obviously, this destruction had negative effects on the livelihoods of the people with grave implication on their financial and health status. However, the people are not deterred as majority of those interviewed declined to vacate/relocate from the area after the 2012 flood disaster despite the high vulnerability of the area to floods. However, the understanding of the vulnerability of the area to flooding was instrumental in the peoples’ choice to live with the floods, and by extension the need to grow resilience. Respondents’ agreement on resilience level to flooding in the study area include: my household can find a safe place to evacuate to if there is an extreme flood event in the future, I have learnt skill(s) to help me cope with event of flood, I can replace my home quickly when it is affected by flood and I have insured my farm and properties in the case of flood outbreak. This resilience of the people its firm on her belief that their tradition forbids them from relocating from the area, hence flood warning issued by government for relocation prior to flooding may not be heeded by the people.
The study also revealed that the following measures were considered effective in control, management and coping capacity of flood: raising of building foundation, construction of wooden bridges, periodic environmental sanitation measures, road reclamation using sandbags and sawn dust, clearing blocked drainages channels and proper refuse disposals. Study also revealed that members of the communities have tried their best in controlling or avoiding flood occurrences through various community projects like drainage and clearing of water ways in the community. However, major projects like dredging of river, construction of drainages and bridges where necessary and proper adherence to planning regulations are expected from government for implementation. However, residents’ agreement on the severity

World Journal of Advanced Research and Reviews, 2021, 11(03), 009–022
21
of effects of flood disaster in the study area include loss of livelihood, displacement, damage to property, outbreak of disease and loss of life/injury. The study recommended that creation of awareness among people living in disaster-prone areas of the risk they face and how best to respond when it occurs can be done to enhance local people’s confidence and empower them to act when faced with danger; there should be policies that target the marginalized in society, such as women, children, elderly, or the poor otherwise these groups will remain most vulnerable; the people must be empowered to improve on their level of resilience to flooding, respond effectively and contribute to the development of their own communities on a sustained basis; and successful flood risk management should therefore be dependent upon the active support of all on whom the effects of flooding may impact, those directly at risk, the civil authorities and the wider community.
Compliance with ethical standards
Acknowledgments
We acknowledge the support of the community chiefs for given us access to their various communities during data gathering. We also acknowledge the support and cooperation of our respondents.
Disclosure of conflict of interest
There is not conflict of interest among the authors in this paper.
Statement of informed consent
Informed consent was obtained from all individual participants included in this study.
References
[1] Nigeria Meteorological Agency (NIMET) 2013 Rainfall Prediction, Daily Trust, March 11th, 2013
[2] Herath S, Y Wang. Incorporating wind damage in potential flood loss estimation. Global Environmental Research. 2009.
[3] Dutta D, W Wright, K Nakayama, Y Sugawara. Design of synthetic impact response functions for flood vulnerability assessment under climate change conditions: Case studies in two selected coastal zones in Australia and Japan. Natural Hazards Rev. 2013; 14: 52-65
[4] NEMA (Nigerian Emergency Manageent Agency). Report on flood disasters in Nigeria. Abuja: Government Press. 2013.
[5] Benson C. Macro-economic Concepts of Vulnerability: Dynamics, Complexity and Public Policy, in G. Bankoff, G. Frerks and D. Hilhorst, eds, Mapping Vulnerability: Disasters, Development and People, London: Earthscan. 2004.
[6] Wisner BP, Blaikie T, Cannon D. At Risk: Natural Hazards. People's Vulnerability, and Disasters, 2nd edn, London: Routledge. 2004
[7] Tanner T, D Lewis, D Wrathall, R Bronen, N Cradock-Henry, S Huq, MA Rahman. Livelihood Resilience in the Face of Climate Change. Nature Climate Change. 2015; 5(1).
[8] FAO. UN joint programmes. Integrating gender issues in food security, agriculture and rural development. 2010
[9] FAO, ILO. The Livelihood Assessment Tool-Kit, 2009
[10] FAO. FAO in emergencies, 2009
[11] Aderogba KA. Qualitative studies of recent floods and sustainable growth and development of cities and towns in Nigeria. Int. J. Basic Applied Sci. 2012; 1: 200-216.
[12] UN-ISDR – International Strategy for Disaster Reduction: Hyogo Framework for Action 2005–2015: Building the Resilience of Nations and Communities to Disasters, World Conference on Disaster Reduction, 18–22 January 2005, Kobe, Hyogo, Japan, 2005.
[13] Nigeria Meteorological Agency NIMET (2013) 2013 Rainfall Prediction, Daily Trust, March 11th 2013

World Journal of Advanced Research and Reviews, 2021, 11(03), 009–022
22
[14] Mysiak, J., Testella, F., Bonaiuto, M., Carrus, G., De Dominicis, S., Ganucci Cancellieri, U., Firus, K., and Grifoni, P.: Flood risk management in Italy: challenges and opportunities for the implementation of the EU Floods Directive (2007/60/EC), Nat. Hazards Earth Syst. Sci., 13, 2883–2890,2013. doi:10.5194/nhess-132883-2013, 2013
[15] World Bank. Natural Disasters: Eluding Nature’s Wrath, mimeo. 2004.
[16] Nasiri H,Yusof M. J. M. and Ali T. A. M (2016) An overview to flood vulnerability assessment methods, Sustain. Water Resour. Manag. 2016. DOI 10.1007/s40899-016-0051-x
[17] Nkeki, F.N., P.J. Henah and V.N. Ojeh. Geospatial techniques for the assessment and analysis of flood risk along the Niger-Benue Basin in Nigeria. J. Geographic Inform. Syst., 5: 123-135. 2013. DOI: 10.4236/jgis.2013.5. 2013
[18] Ajibade, I., G. McBean and R. Bezner-Kerr. Urban flooding in Lagos, Nigeria: Patterns of vulnerability and resilience among women. Global Environ. Change, 23: 1714-1725. 2013. DOI: 10.1016/j.gloenvcha.2013.08.009
[19] Barredo JI, Demicheli L. “Urban Sustainability in Developing Countries’ Megacities: Modelling and Predicting Future Urban growth in Lagos”. Cities 20(5): 297-310.2003
[20] Amadi L. Climate change, peasantry and rural food production decline in the Niger Delta Region: A case of the 2012 flood disaster. Journal of Agricultural and Crop Research Vol. 1(6), pp. 94-103, December 2013 ISSN: 2384-731X Research Paper
[21] Alkire, S., & Maria, E. S. Acute Multidimensional Poverty: A New Index for Developing Countries, vol. 138, UNDP Human Development Research Paper, New York, USA, 2010. UNDP.
[22] Gardner, J. A. and Dekens, J.: Mountain hazards and the resilience of social-ecological systems: lessons learned in India and Canada, Nat. Hazards, 41, 317–336, 2007.
[23] Hannan, C. Mainstreaming Gender Perspectives in Environmental Management and Mitigation of Natural Disasters. Presented at the Roundtable Panel and Discussion organized by The United Nations Division for the Advancement of Women and The NGO Committee on the Status of Women in preparation for the 46th Session of the Commission on the Status of Women On Disproportionate Impact of Natural Disasters on Women 17 January 2002
[24] ICSU (International Council for Science). A Science Plan for Integrated Research on Disaster Risk: Addressing the Challenge of Natural and Human-Induced Environmental Hazards. Paris, France: ICSU. 66 p. 2008.
[25] Ikusemoran, M., D. Anthony and U.M. Maryah. GIS based assessment of flood risk and vulnerability of communities in the Benue floodplains, Adamawa State, Nigeria. J. Geography Geol., 5: 148-160. 2013. DOI: 10.5539/jgg.v5n4p148
[26] IPCC (Intergovernmental Panel on Climate Change). Climate Change Impacts, Adaptation and Vulnerability, Contribution of Working Group II to the Fourth Assessment Report of the Intergovernmental Panel on Climate Change Assessment Report, Summary for Policymakers, 2007. Available at http://www.ipcc.ch/pdf/assessment- report/ar4/wg2/ar4-wg2- spm.pdf
[27] Meyer, V., Kuhlicke, C., Luther, J., Fuchs, S., Priest, S., Dorner, W., Serrhini, K., Pardoe, J., McCarthy, S., Seidel, J., Palka, G., Unnerstall, H., Viavattene, C., and Scheuer, S.: Recommendations for the user-specific enhancement of flood maps, Nat. Hazards Earth Syst. Sci., 12, 1701–1716, doi:10.5194/nhess-121701-2012, 2012.
[28] UN-International Strategy for Disaster Reduction (UN-ISDR). “Disaster Risk Reduction Strategies and Risk Management Practices: Critical Elements for Adaptation to Climate Change” Submission to the UNFCCC Adhoc Working Group on Long Term Cooperative Action, 2008. Available at: www.unisdr.org/.../risk- reduction/climatechange/.../IASC- ISDR_paper_cc_and_DDR.pdf (Accessed 16 Oct. 2011).
[29] United Nations International Strategy for Disaster Reduction. In HFA-Asia Pacific, 2011–2013, Hyogo Framework for Action in Asia and the Pacific; UNISDR: Geneva, Switzerland.