Live-cell microscopy -...
15
753 Commentary Introduction Live-cell microscopy has been accessible for decades, as is evident from a movie that was taken with 16-mm film over 50 years ago of a neutrophil chasing a bacterium (David Rogers, Vanderbilt University, http://www.biochemweb.org/neutrophil.shtml). The technique now spans all fields of the life sciences and extends to the physical sciences as well. In recent years, technological advances, including sensor sensitivity, computing power, brighter and more-stable fluorescent proteins (FPs), and new fluorescent probes for cellular compartments, have given researchers the tools to study complex biological processes in great detail (Goldman and Spector, 2005). However, expertise in the optimization of image- acquisition conditions for various microscopy platforms is required to harness the full potential that live-cell microscopy offers. As with any measuring device, it is best to minimize any perturbations by optimizing the system so that it is minimally invasive. As part of their normal life cycle, most tissues and cells are never exposed to light, and it is known that ultraviolet (UV) light damages DNA, focused infrared (IR) light can cause localized heating, and fluorescence excitation causes phototoxicity to tissues and cells (Pattison and Davies, 2006). The main cause of phototoxicity in living cells is the oxygen-dependent reaction of free-radical species, which are generated during the excitation of fluorescent proteins or dye molecules with surrounding cellular components. Thus, for live-cell imaging, it is best to reduce the amount of excitation light by optimizing the efficiency of the light path through the microscope, and by using detectors that are optimized to detect most of the fluorescence emission. Low concentrations of fluorescent probes also need to be used to avoid causing nonspecific changes to the biological processes of interest. With live-cell microscopy, there must be a compromise between acquiring beautiful images and collecting data that provide a high enough signal-to-noise ratio (S/N) to make meaningful quantitative measurements of a living specimen. Therefore, the focus of this Commentary is to discuss how to keep cells or tissue alive and healthy during image acquisition, to provide guidelines for different types of samples to delineate the different imaging modalities that are most appropriate, and to provide general and imaging-platform-specific recommendations for instrument components and settings. A certain level of knowledge about transmitted-light microscopy and fluorescence microscopy is assumed. For the beginner, there are good articles on light microscopy (Murphy, 2001), fluorescence microscopy (Brown, 2007; Lichtman and Conchello, 2005; Murphy, 2001; North, 2006; Wolf, 2007) and confocal microscopy (Hibbs, 2004; Mueller, 2005; Pawley, 2006) that provide the necessary background. There are also many excellent publications on live- cell imaging that provide a lot of detailed and valuable information (Dailey et al., 2006; Day and Schaufele, 2005; Goldman and Spector, 2005; Haraguchi, 2002; Wang et al., 2008) (http://cshprotocols. cshlp.org/cgi/collection/live_cell_imaging). Image analysis is also a crucial component of live-cell imaging, but is beyond the scope of this article. Therefore, the reader is referred to other papers for more details on performing accurate colocalization measurements (Bolte and Cordelieres, 2006; Comeau et al., 2006; Kraus et al., 2007) and accurately quantifying fluorescence signals (Brown, 2007; Cardullo and Hinchcliffe, 2007; Murray, 2007; Swedlow, 2007; Wolf et al., 2007). The focus here is on imaging mammalian cells; however, most aspects of this discussion carry over to the imaging of any living organism or tissue. Imaging of living cells and tissue is now common in many fields of the life and physical sciences, and is instrumental in revealing a great deal about cellular dynamics and function. It is crucial when performing such experiments that cell viability is at the forefront of any measurement to ensure that the physiological and biological processes that are under investigation are not altered in any way. Many cells and tissues are not normally exposed to light during their life cycle, so it is important for microscopy applications to minimize light exposure, which can cause phototoxicity. To ensure minimal light exposure, it is crucial that microscope systems are optimized to collect as much light as possible. This can be achieved using superior-quality optical components and state-of-the-art detectors. This Commentary discusses how to set up a suitable environment on the microscope stage to maintain living cells. There is also a focus on general and imaging-platform-specific ways to optimize the efficiency of light throughput and detection. With an efficient optical microscope and a good detector, the light exposure can be minimized during live-cell imaging, thus minimizing phototoxicity and maintaining cell viability. Brief suggestions for useful microscope accessories as well as available fluorescence tools are also presented. Finally, a flow chart is provided to assist readers in choosing the appropriate imaging platform for their experimental systems. Supplementary material available online at http://jcs.biologists.org/cgi/content/full/122/6/753/DC1 Key words: CLSM, Multi-photon, TIRF, Live-cell imaging, Spinning disk Summary Live-cell microscopy – tips and tools Melanie M. Frigault 1 , Judith Lacoste 2,3 , Jody L. Swift 4 and Claire M. Brown 2, * 1 Molecular Oncology Group, McGill University Cancer Centre, Montreal, Canada 2 McGill University Life Sciences Complex Imaging Facility, Department of Biochemistry, Montreal, Canada 3 Cell Imaging and Analysis Network, Department of Biology, McGill University, Montreal, Canada 4 Department of Chemistry, McGill University, Montreal, Canada *Author for correspondence (e-mail: [email protected]) Journal of Cell Science 122, 753-767 Published by The Company of Biologists 2009 doi:10.1242/jcs.033837 Journal of Cell Science
Transcript of Live-cell microscopy -...
753Commentary
IntroductionLive-cell microscopy has been accessible for decades, as is evidentfrom a movie that was taken with 16-mm film over 50 years agoof a neutrophil chasing a bacterium (David Rogers, VanderbiltUniversity, http://www.biochemweb.org/neutrophil.shtml). Thetechnique now spans all fields of the life sciences and extends tothe physical sciences as well. In recent years, technologicaladvances, including sensor sensitivity, computing power, brighterand more-stable fluorescent proteins (FPs), and new fluorescentprobes for cellular compartments, have given researchers the toolsto study complex biological processes in great detail (Goldman andSpector, 2005). However, expertise in the optimization of image-acquisition conditions for various microscopy platforms is requiredto harness the full potential that live-cell microscopy offers.
As with any measuring device, it is best to minimize anyperturbations by optimizing the system so that it is minimallyinvasive. As part of their normal life cycle, most tissues and cellsare never exposed to light, and it is known that ultraviolet (UV)light damages DNA, focused infrared (IR) light can cause localizedheating, and fluorescence excitation causes phototoxicity to tissuesand cells (Pattison and Davies, 2006). The main cause of phototoxicity in living cells is the oxygen-dependent reaction offree-radical species, which are generated during the excitation of fluorescent proteins or dye molecules with surrounding cellularcomponents. Thus, for live-cell imaging, it is best to reduce theamount of excitation light by optimizing the efficiency of the lightpath through the microscope, and by using detectors that areoptimized to detect most of the fluorescence emission. Lowconcentrations of fluorescent probes also need to be used to avoidcausing nonspecific changes to the biological processes of interest.
With live-cell microscopy, there must be a compromise betweenacquiring beautiful images and collecting data that provide a highenough signal-to-noise ratio (S/N) to make meaningful quantitativemeasurements of a living specimen. Therefore, the focus of thisCommentary is to discuss how to keep cells or tissue alive andhealthy during image acquisition, to provide guidelines fordifferent types of samples to delineate the different imagingmodalities that are most appropriate, and to provide general andimaging-platform-specific recommendations for instrumentcomponents and settings.
A certain level of knowledge about transmitted-light microscopyand fluorescence microscopy is assumed. For the beginner, thereare good articles on light microscopy (Murphy, 2001), fluorescencemicroscopy (Brown, 2007; Lichtman and Conchello, 2005; Murphy,2001; North, 2006; Wolf, 2007) and confocal microscopy (Hibbs,2004; Mueller, 2005; Pawley, 2006) that provide the necessarybackground. There are also many excellent publications on live-cell imaging that provide a lot of detailed and valuable information(Dailey et al., 2006; Day and Schaufele, 2005; Goldman and Spector,2005; Haraguchi, 2002; Wang et al., 2008) (http://cshprotocols.cshlp.org/cgi/collection/live_cell_imaging). Image analysis is alsoa crucial component of live-cell imaging, but is beyond the scopeof this article. Therefore, the reader is referred to other papers for more details on performing accurate colocalizationmeasurements (Bolte and Cordelieres, 2006; Comeau et al., 2006;Kraus et al., 2007) and accurately quantifying fluorescence signals(Brown, 2007; Cardullo and Hinchcliffe, 2007; Murray, 2007;Swedlow, 2007; Wolf et al., 2007). The focus here is on imagingmammalian cells; however, most aspects of this discussion carryover to the imaging of any living organism or tissue.
Imaging of living cells and tissue is now common in many fieldsof the life and physical sciences, and is instrumental in revealinga great deal about cellular dynamics and function. It is crucialwhen performing such experiments that cell viability is at theforefront of any measurement to ensure that the physiologicaland biological processes that are under investigation are notaltered in any way. Many cells and tissues are not normallyexposed to light during their life cycle, so it is important formicroscopy applications to minimize light exposure, which cancause phototoxicity. To ensure minimal light exposure, it iscrucial that microscope systems are optimized to collect as muchlight as possible. This can be achieved using superior-qualityoptical components and state-of-the-art detectors. ThisCommentary discusses how to set up a suitable environmenton the microscope stage to maintain living cells. There is also
a focus on general and imaging-platform-specific ways tooptimize the efficiency of light throughput and detection. Withan efficient optical microscope and a good detector, the lightexposure can be minimized during live-cell imaging, thusminimizing phototoxicity and maintaining cell viability. Briefsuggestions for useful microscope accessories as well as availablefluorescence tools are also presented. Finally, a flow chart isprovided to assist readers in choosing the appropriate imagingplatform for their experimental systems.
Supplementary material available online athttp://jcs.biologists.org/cgi/content/full/122/6/753/DC1
Key words: CLSM, Multi-photon, TIRF, Live-cell imaging, Spinningdisk
Summary
Live-cell microscopy – tips and toolsMelanie M. Frigault1, Judith Lacoste2,3, Jody L. Swift4 and Claire M. Brown2,*1Molecular Oncology Group, McGill University Cancer Centre, Montreal, Canada2McGill University Life Sciences Complex Imaging Facility, Department of Biochemistry, Montreal, Canada3Cell Imaging and Analysis Network, Department of Biology, McGill University, Montreal, Canada4Department of Chemistry, McGill University, Montreal, Canada*Author for correspondence (e-mail: [email protected])
Journal of Cell Science 122, 753-767 Published by The Company of Biologists 2009doi:10.1242/jcs.033837
Jour
nal o
f Cel
l Sci
ence
754
Specimen environmentTo successfully image cellular processes in living cells, the cellsmust be kept in an environment that does not induce stressresponses, which can alter the cellular processes of interest. Someof the key factors to consider are the type of culture medium andits contents, and the temperature of the sample, which must be keptstable at 37°C for mammalian cells. Moreover, the pH of the samplemust be maintained at a physiological level and evaporation of themedium must be minimized to avoid changes in osmolarity.
MediaFor mammalian cells, bicarbonate-based culture medium requires CO2
to maintain physiological pH. If cells are grown in complete mediumcontaining 10% fetal bovine serum (FBS) in a 5% CO2 environment,
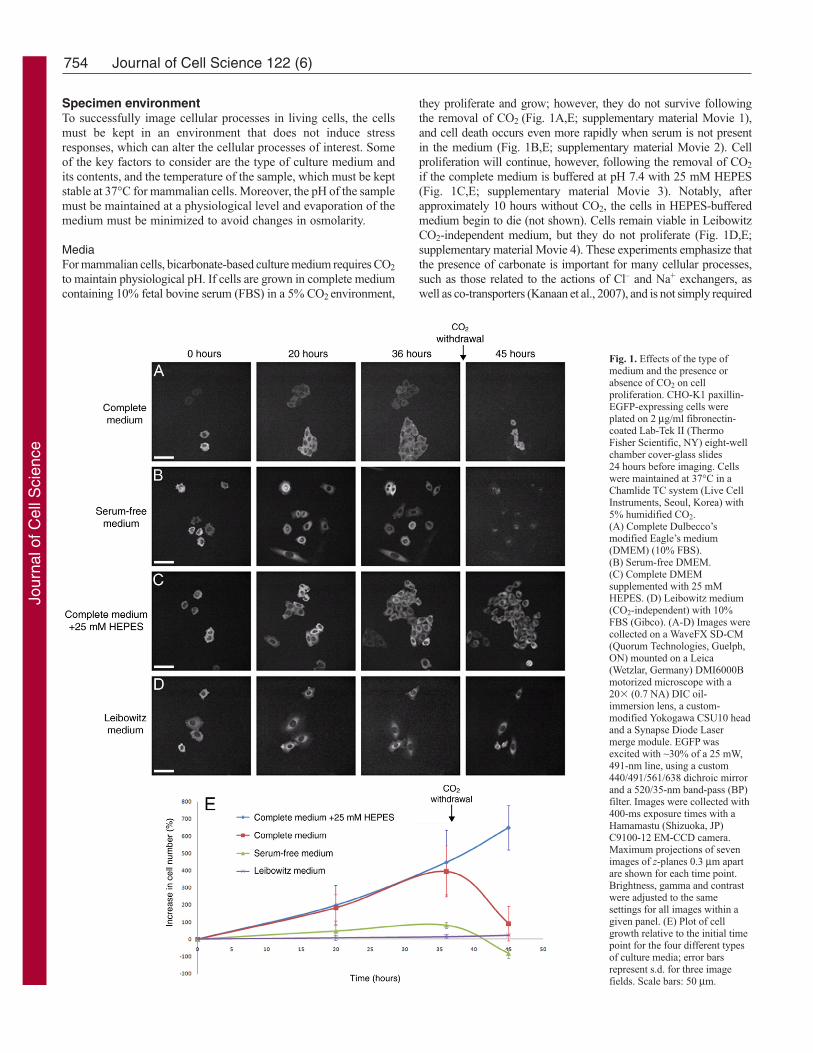
they proliferate and grow; however, they do not survive followingthe removal of CO2 (Fig. 1A,E; supplementary material Movie 1),and cell death occurs even more rapidly when serum is not presentin the medium (Fig. 1B,E; supplementary material Movie 2). Cellproliferation will continue, however, following the removal of CO2
if the complete medium is buffered at pH 7.4 with 25 mM HEPES(Fig. 1C,E; supplementary material Movie 3). Notably, afterapproximately 10 hours without CO2, the cells in HEPES-bufferedmedium begin to die (not shown). Cells remain viable in LeibowitzCO2-independent medium, but they do not proliferate (Fig. 1D,E;supplementary material Movie 4). These experiments emphasize thatthe presence of carbonate is important for many cellular processes,such as those related to the actions of Cl– and Na+ exchangers, aswell as co-transporters (Kanaan et al., 2007), and is not simply required
Journal of Cell Science 122 (6)
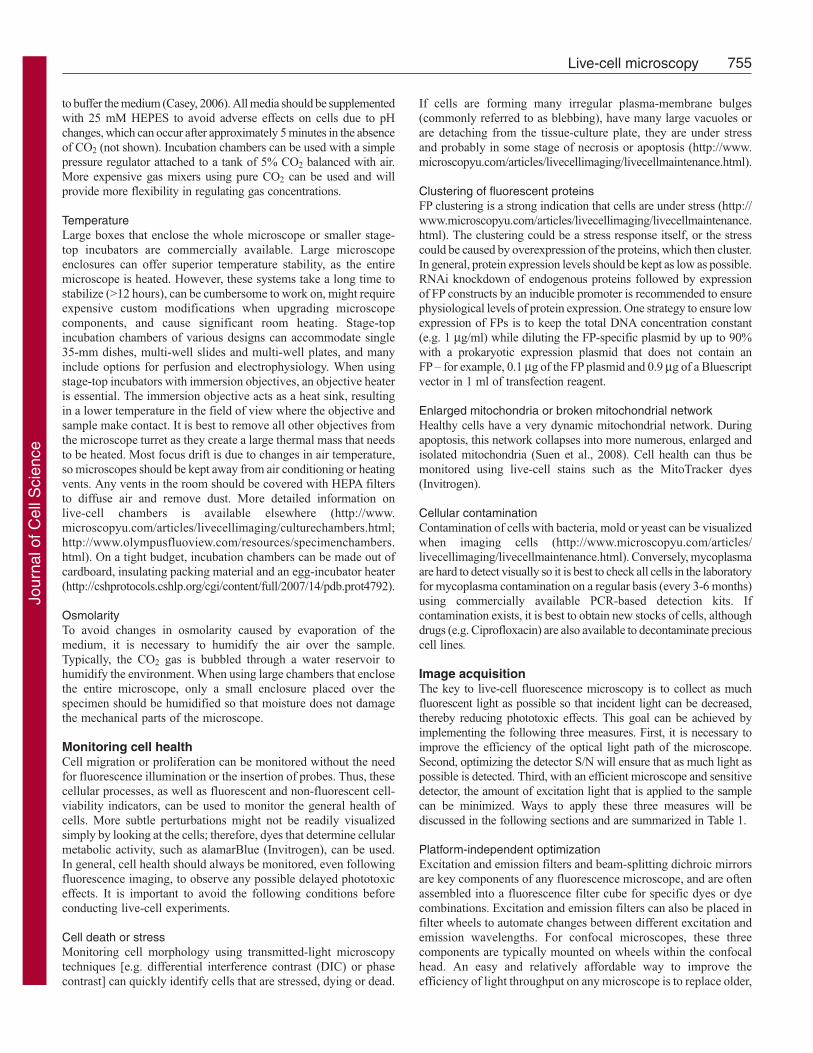
Fig. 1. Effects of the type ofmedium and the presence orabsence of CO2 on cellproliferation. CHO-K1 paxillin-EGFP-expressing cells wereplated on 2 μg/ml fibronectin-coated Lab-Tek II (ThermoFisher Scientific, NY) eight-wellchamber cover-glass slides 24 hours before imaging. Cellswere maintained at 37°C in aChamlide TC system (Live CellInstruments, Seoul, Korea) with5% humidified CO2.(A) Complete Dulbecco’smodified Eagle’s medium(DMEM) (10% FBS).(B) Serum-free DMEM.(C) Complete DMEMsupplemented with 25 mMHEPES. (D) Leibowitz medium(CO2-independent) with 10%FBS (Gibco). (A-D) Images werecollected on a WaveFX SD-CM(Quorum Technologies, Guelph,ON) mounted on a Leica(Wetzlar, Germany) DMI6000Bmotorized microscope with a20� (0.7 NA) DIC oil-immersion lens, a custom-modified Yokogawa CSU10 headand a Synapse Diode Lasermerge module. EGFP wasexcited with ~30% of a 25 mW,491-nm line, using a custom440/491/561/638 dichroic mirrorand a 520/35-nm band-pass (BP)filter. Images were collected with400-ms exposure times with aHamamastu (Shizuoka, JP)C9100-12 EM-CCD camera.Maximum projections of sevenimages of z-planes 0.3 μm apartare shown for each time point.Brightness, gamma and contrastwere adjusted to the samesettings for all images within agiven panel. (E) Plot of cellgrowth relative to the initial timepoint for the four different typesof culture media; error barsrepresent s.d. for three imagefields. Scale bars: 50 μm.
Jour
nal o
f Cel
l Sci
ence
755Live-cell microscopy
to buffer the medium (Casey, 2006). All media should be supplementedwith 25 mM HEPES to avoid adverse effects on cells due to pHchanges, which can occur after approximately 5 minutes in the absenceof CO2 (not shown). Incubation chambers can be used with a simplepressure regulator attached to a tank of 5% CO2 balanced with air.More expensive gas mixers using pure CO2 can be used and willprovide more flexibility in regulating gas concentrations.
TemperatureLarge boxes that enclose the whole microscope or smaller stage-top incubators are commercially available. Large microscopeenclosures can offer superior temperature stability, as the entiremicroscope is heated. However, these systems take a long time tostabilize (>12 hours), can be cumbersome to work on, might requireexpensive custom modifications when upgrading microscopecomponents, and cause significant room heating. Stage-topincubation chambers of various designs can accommodate single35-mm dishes, multi-well slides and multi-well plates, and manyinclude options for perfusion and electrophysiology. When usingstage-top incubators with immersion objectives, an objective heateris essential. The immersion objective acts as a heat sink, resultingin a lower temperature in the field of view where the objective andsample make contact. It is best to remove all other objectives fromthe microscope turret as they create a large thermal mass that needsto be heated. Most focus drift is due to changes in air temperature,so microscopes should be kept away from air conditioning or heatingvents. Any vents in the room should be covered with HEPA filtersto diffuse air and remove dust. More detailed information on live-cell chambers is available elsewhere (http:// www.microscopyu.com/articles/livecellimaging/culturechambers.html;http://www.olympusfluoview.com/resources/specimenchambers.html). On a tight budget, incubation chambers can be made out ofcardboard, insulating packing material and an egg-incubator heater(http://cshprotocols.cshlp.org/cgi/content/full/2007/14/pdb. prot4792).
OsmolarityTo avoid changes in osmolarity caused by evaporation of themedium, it is necessary to humidify the air over the sample.Typically, the CO2 gas is bubbled through a water reservoir tohumidify the environment. When using large chambers that enclosethe entire microscope, only a small enclosure placed over thespecimen should be humidified so that moisture does not damagethe mechanical parts of the microscope.
Monitoring cell healthCell migration or proliferation can be monitored without the needfor fluorescence illumination or the insertion of probes. Thus, thesecellular processes, as well as fluorescent and non-fluorescent cell-viability indicators, can be used to monitor the general health ofcells. More subtle perturbations might not be readily visualizedsimply by looking at the cells; therefore, dyes that determine cellularmetabolic activity, such as alamarBlue (Invitrogen), can be used.In general, cell health should always be monitored, even followingfluorescence imaging, to observe any possible delayed phototoxiceffects. It is important to avoid the following conditions beforeconducting live-cell experiments.
Cell death or stressMonitoring cell morphology using transmitted-light microscopytechniques [e.g. differential interference contrast (DIC) or phasecontrast] can quickly identify cells that are stressed, dying or dead.
If cells are forming many irregular plasma-membrane bulges(commonly referred to as blebbing), have many large vacuoles orare detaching from the tissue-culture plate, they are under stressand probably in some stage of necrosis or apoptosis (http://www.microscopyu.com/articles/livecellimaging/livecellmaintenance.html).
Clustering of fluorescent proteinsFP clustering is a strong indication that cells are under stress (http://www.microscopyu.com/articles/livecellimaging/livecellmaintenance.html). The clustering could be a stress response itself, or the stresscould be caused by overexpression of the proteins, which then cluster.In general, protein expression levels should be kept as low as possible.RNAi knockdown of endogenous proteins followed by expressionof FP constructs by an inducible promoter is recommended to ensurephysiological levels of protein expression. One strategy to ensure lowexpression of FPs is to keep the total DNA concentration constant(e.g. 1 μg/ml) while diluting the FP-specific plasmid by up to 90%with a prokaryotic expression plasmid that does not contain an FP – for example, 0.1 μg of the FP plasmid and 0.9 μg of a Bluescriptvector in 1 ml of transfection reagent.
Enlarged mitochondria or broken mitochondrial networkHealthy cells have a very dynamic mitochondrial network. Duringapoptosis, this network collapses into more numerous, enlarged andisolated mitochondria (Suen et al., 2008). Cell health can thus bemonitored using live-cell stains such as the MitoTracker dyes(Invitrogen).
Cellular contaminationContamination of cells with bacteria, mold or yeast can be visualizedwhen imaging cells (http://www.microscopyu.com/articles/livecellimaging/livecellmaintenance.html). Conversely, mycoplasmaare hard to detect visually so it is best to check all cells in the laboratoryfor mycoplasma contamination on a regular basis (every 3-6 months)using commercially available PCR-based detection kits. Ifcontamination exists, it is best to obtain new stocks of cells, althoughdrugs (e.g. Ciprofloxacin) are also available to decontaminate preciouscell lines.
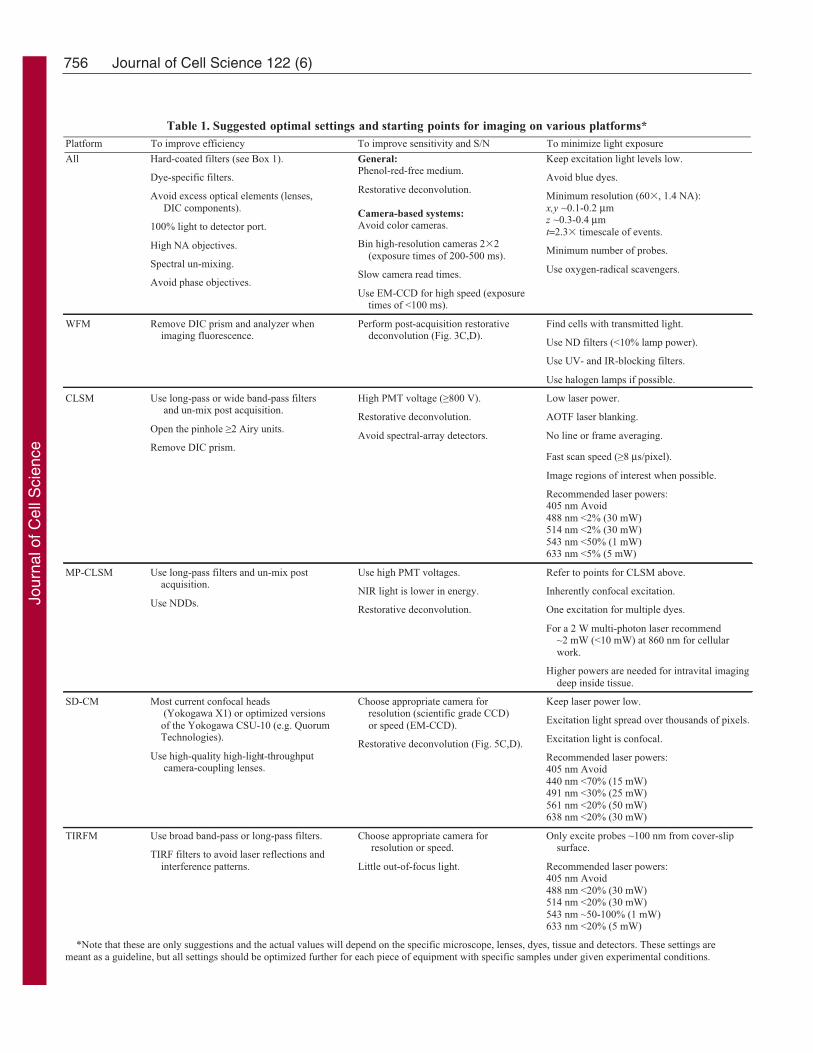
Image acquisitionThe key to live-cell fluorescence microscopy is to collect as muchfluorescent light as possible so that incident light can be decreased,thereby reducing phototoxic effects. This goal can be achieved byimplementing the following three measures. First, it is necessary toimprove the efficiency of the optical light path of the microscope.Second, optimizing the detector S/N will ensure that as much light aspossible is detected. Third, with an efficient microscope and sensitivedetector, the amount of excitation light that is applied to the samplecan be minimized. Ways to apply these three measures will bediscussed in the following sections and are summarized in Table 1.
Platform-independent optimizationExcitation and emission filters and beam-splitting dichroic mirrorsare key components of any fluorescence microscope, and are oftenassembled into a fluorescence filter cube for specific dyes or dyecombinations. Excitation and emission filters can also be placed infilter wheels to automate changes between different excitation andemission wavelengths. For confocal microscopes, these threecomponents are typically mounted on wheels within the confocalhead. An easy and relatively affordable way to improve theefficiency of light throughput on any microscope is to replace older,
Jour
nal o
f Cel
l Sci
ence
756 Journal of Cell Science 122 (6)
Table 1. Suggested optimal settings and starting points for imaging on various platforms*Platform To improve efficiency To improve sensitivity and S/N To minimize light exposure
All Hard-coated filters (see Box 1).
Dye-specific filters.
Avoid excess optical elements (lenses, DIC components).
100% light to detector port.
High NA objectives.
Spectral un-mixing.
Avoid phase objectives.
General:Phenol-red-free medium.
Restorative deconvolution.
Camera-based systems:Avoid color cameras.
Bin high-resolution cameras 2 2 (exposure times of 200-500 ms).
Slow camera read times.
Use EM-CCD for high speed (exposure times of <100 ms).
Keep excitation light levels low.
Avoid blue dyes.
Minimum resolution (60 , 1.4 NA):x,y ~0.1-0.2 µmz ~0.3-0.4 µmt=2.3 timescale of events.
Minimum number of probes.
Use oxygen-radical scavengers.
WFM Remove DIC prism and analyzer when imaging fluorescence.
Perform post-acquisition restorative deconvolution (Fig. 3C,D).
Find cells with transmitted light.
Use ND filters (<10% lamp power).
Use UV- and IR-blocking filters.
Use halogen lamps if possible.
CLSM Use long-pass or wide band-pass filters and un-mix post acquisition.
Open the pinhole 2 Airy units.
Remove DIC prism.
High PMT voltage ( 800 V).
Restorative deconvolution.
Avoid spectral-array detectors.
Low laser power.
AOTF laser blanking.
No line or frame averaging.
Fast scan speed ( 8 µs/pixel).
Image regions of interest when possible.
Recommended laser powers:405 nm Avoid488 nm <2% (30 mW)514 nm <2% (30 mW)543 nm <50% (1 mW)633 nm <5% (5 mW)
MP-CLSM Use long-pass filters and un-mix post acquisition.
Use NDDs.
Use high PMT voltages.
NIR light is lower in energy.
Restorative deconvolution.
Refer to points for CLSM above.
Inherently confocal excitation.
One excitation for multiple dyes.
For a 2 W multi-photon laser recommend ~2 mW (<10 mW) at 860 nm for cellular work.
Higher powers are needed for intravital imaging deep inside tissue.
SD-CM Most current confocal heads (Yokogawa X1) or optimized versions of the Yokogawa CSU-10 (e.g. Quorum Technologies).
Use high-quality high-light-throughput camera-coupling lenses.
Choose appropriate camera for resolution (scientific grade CCD) or speed (EM-CCD).
Restorative deconvolution (Fig. 5C,D).
Keep laser power low.
Excitation light spread over thousands of pixels.
Excitation light is confocal.
Recommended laser powers:405 nm Avoid440 nm <70% (15 mW)491 nm <30% (25 mW)561 nm <20% (50 mW)638 nm <20% (30 mW)
TIRFM Use broad band-pass or long-pass filters.
TIRF filters to avoid laser reflections and interference patterns.
Choose appropriate camera for resolution or speed.
Little out-of-focus light.
Only excite probes ~100 nm from cover-slip surface.
Recommended laser powers:405 nm Avoid488 nm <20% (30 mW)514 nm <20% (30 mW)543 nm ~50-100% (1 mW)633 nm <20% (5 mW)
*Note that these are only suggestions and the actual values will depend on the specific microscope, lenses, dyes, tissue and detectors. These settings aremeant as a guideline, but all settings should be optimized further for each piece of equipment with specific samples under given experimental conditions.
Jour
nal o
f Cel
l Sci
ence
757Live-cell microscopy
soft-coated excitation and emission filters and dichroic mirrors withnew, hard-coated filters and mirrors (Box 1). Hard-coated filtershave stable coatings that are not sensitive to heat and humidity, andthey offer a 20-30% increase in light throughput when comparedwith soft-coated filters (Standish, 2008). For single-colorexperiments, use excitation and emission filters, and a dichroicmirror that is optimized for the specific dye. For example, whenimaging red fluorescent protein (RFP), do not use filters and mirrorsthat are optimized for rhodamine. Additional surfaces in the lightpath, such as DIC optics or optivar lenses, should be avoided, andthe microscope should be configured to allow 100% of the light togo to the detection port.
For multi-color experiments, it is better to use filters and mirrorsthat are designed for single dyes, and to collect images sequentiallyto optimize the light collection for each fluorophore. However, caremust be taken because slight variations in mounting positionsbetween different mirrors can result in shifts in image focus andx,y locations between images of different colors, makingcolocalization measurements difficult. Multi-chroic mirrors avoidthese shifts and are required when imaging rapid cellular processes(on a timescale of <1 minute), but light-collection efficiency isreduced, sometimes significantly. For example, when imagingenhanced green fluorescent protein (EGFP) and RFP, the mirrormust reflect green light onto the specimen to excite RFPfluorescence; however, the mirror will also reflect much of the green fluorescence from the EGFP emission, so this will goundetected, thereby reducing the sensitivity of the system.
For multi-color experiments, it is essential to collect images inall detection channels for control samples that contain only one dye.By imaging these samples under the exact same conditions as multi-labeled samples, crosstalk (excitation of one dye by the incidentlight intended for another dye) and bleed-through (emission of onedye into the detection channel of another dye) in the images canbe corrected for (Kraus et al., 2007). For example, if EGFP andRFP are being imaged simultaneously, some of the EGFP signalwill be collected in the RFP image, so this contribution should bemeasured using a sample with only EGFP and re-assigned back tothe EGFP image. Avoid using phase objectives or DIC optics whileimaging fluorescence because the phase ring, the DIC prism andthe analyzer all reduce the light-collection efficiency.
The efficiency (E) of light collection by lenses is proportionalto the numerical aperture (NA) and the magnification (Mag) of thelens, and is defined as:
Thus, high NA lenses are crucial for live-cell imaging because smallchanges in NA result in significant improvements in light collection.However, increases in magnification decrease light-collectionefficiency. Therefore, a 60�, 1.4 NA lens will collect considerablymore light than a 100�, 1.4 NA lens (http://www.microscopyu.com/articles/livecellimaging/imagingsystems.html).
To improve the S/N, nonspecific background intensity can bereduced by using phenol-red-free medium. Images of live cellstypically have a low S/N, and do not use the full dynamic rangeof the camera (typically �20%) because of the need to reducephototoxicity. Nonetheless, the S/N must be high enough toobserve or measure the biological processes of interest. Forcamera-based systems, the choice of camera will depend on theapplication. For transmitted-light microscopy, affordable
E∝NA4
Mag2(1).
complementary metal-oxide semiconductor (CMOS) cameras areideal, whereas high-resolution scientific-grade charge-coupleddevice (CCD) sensors (e.g. Sony ICX-285 chip) (Box 1) shouldbe used for most fluorescence applications. These CCDs detectabout 60-70% of the photons that reach the detector – that is, theyhave a quantum efficiency (QE) of 60-70% across the visible-light spectrum. These CCD arrays give high-resolution images
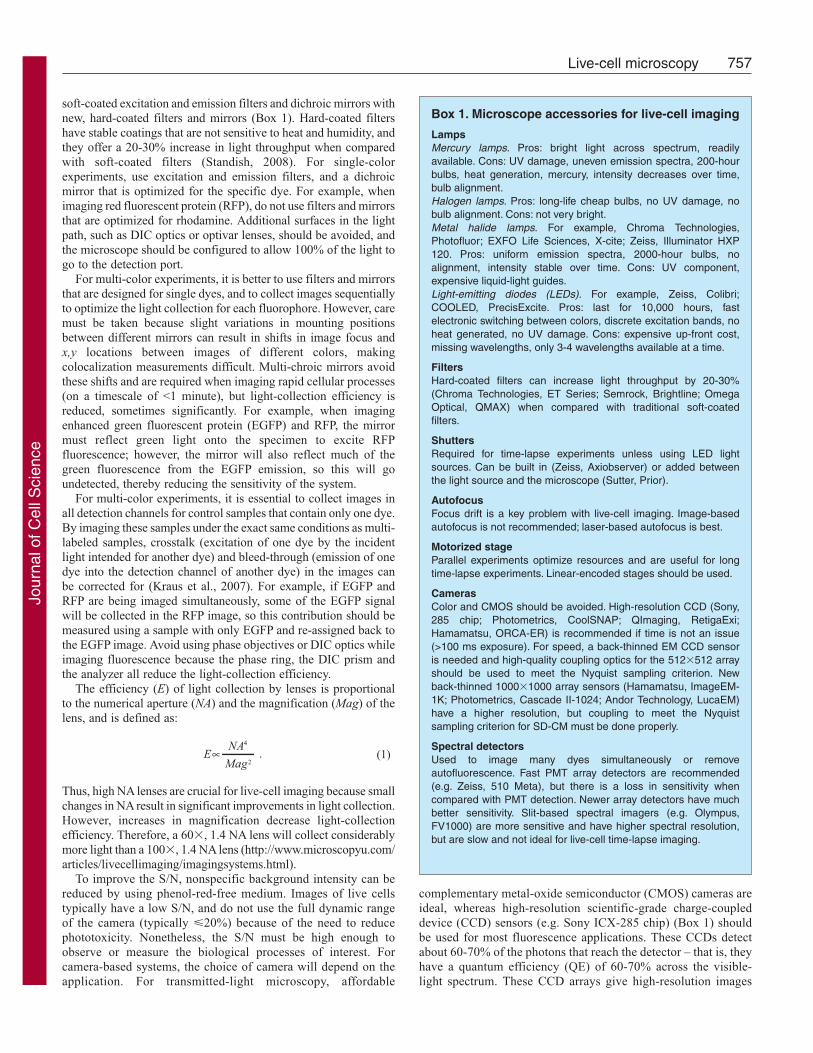
Box 1. Microscope accessories for live-cell imaging
LampsMercury lamps. Pros: bright light across spectrum, readilyavailable. Cons: UV damage, uneven emission spectra, 200-hourbulbs, heat generation, mercury, intensity decreases over time,bulb alignment.Halogen lamps. Pros: long-life cheap bulbs, no UV damage, nobulb alignment. Cons: not very bright.Metal halide lamps. For example, Chroma Technologies,Photofluor; EXFO Life Sciences, X-cite; Zeiss, Illuminator HXP120. Pros: uniform emission spectra, 2000-hour bulbs, noalignment, intensity stable over time. Cons: UV component,expensive liquid-light guides.Light-emitting diodes (LEDs). For example, Zeiss, Colibri;COOLED, PrecisExcite. Pros: last for 10,000 hours, fastelectronic switching between colors, discrete excitation bands, noheat generated, no UV damage. Cons: expensive up-front cost,missing wavelengths, only 3-4 wavelengths available at a time.
FiltersHard-coated filters can increase light throughput by 20-30%(Chroma Technologies, ET Series; Semrock, Brightline; OmegaOptical, QMAX) when compared with traditional soft-coatedfilters.
ShuttersRequired for time-lapse experiments unless using LED lightsources. Can be built in (Zeiss, Axiobserver) or added betweenthe light source and the microscope (Sutter, Prior).
AutofocusFocus drift is a key problem with live-cell imaging. Image-basedautofocus is not recommended; laser-based autofocus is best.
Motorized stageParallel experiments optimize resources and are useful for longtime-lapse experiments. Linear-encoded stages should be used.
CamerasColor and CMOS should be avoided. High-resolution CCD (Sony,285 chip; Photometrics, CoolSNAP; QImaging, RetigaExi;Hamamatsu, ORCA-ER) is recommended if time is not an issue(>100 ms exposure). For speed, a back-thinned EM CCD sensoris needed and high-quality coupling optics for the 512�512 arrayshould be used to meet the Nyquist sampling criterion. Newback-thinned 1000�1000 array sensors (Hamamatsu, ImageEM-1K; Photometrics, Cascade II-1024; Andor Technology, LucaEM)have a higher resolution, but coupling to meet the Nyquistsampling criterion for SD-CM must be done properly.
Spectral detectorsUsed to image many dyes simultaneously or removeautofluorescence. Fast PMT array detectors are recommended(e.g. Zeiss, 510 Meta), but there is a loss in sensitivity whencompared with PMT detection. Newer array detectors have muchbetter sensitivity. Slit-based spectral imagers (e.g. Olympus,FV1000) are more sensitive and have higher spectral resolution,but are slow and not ideal for live-cell time-lapse imaging.
Jour
nal o
f Cel
l Sci
ence
758
(~0.1 μm pixels at 60�) so the camera can be ‘binned’ byadding together pixel arrays to increase the S/N, allowing forshorter exposure times, albeit at the expense of some spatialresolution (Brown, 2007) (http://www. microscopyu.com/articles/livecellimaging/imagingsystems.html). Back-thinned electron-multiplied (EM)-CCDs are highly sensitive with a QE of ~90%across the visible-light spectrum. By activating a gain register onthe CCD chip, EM gain on these cameras can be turned on, whichamplifies the signal up to 1000-fold, although noise will alsobe amplified. These cameras are ideal for high-speed imaging(<100 ms exposure times), but care should be taken that the EMgain is optimal for an increased S/N without detector saturation.Notably, EM-CCDs typically have lower spatial resolutionthan the standard scientific-grade CCDs (512�512 pixel arraysensors have ~0.3 μm pixels at 60�). Reduce noise by using theslowest camera read speed available. For more information onCCD cameras and companies see the following references(Nordberg and Sluder, 2007; Spring, 2007) and website (http://micro.magnet.fsu.edu/primer/resources/digital.html).
Image deconvolution can considerably improve the S/N andspatial resolution of images post-acquisition. A microscope imageis a representation of an object generated from the convolution ofthe optical elements of the microscope, with the light emitted byor transmitted through that object. Light from a point source withina fluorescence image is spread out in x, y and z, making the pointsource appear larger than it really is. The size of the point sourcewill depend on the resolving power of the microscope objective,the detector resolution and the color of the emitted light. Imagedeconvolution relies on algorithms to restore the image so that itis a more accurate representation of the actual object, as though thelight was not distorted by the microscope optics. There are twomain types of deconvolution – non-quantitative and quantitative.Non-quantitative techniques (e.g. nearest neighbor) use subtractionalgorithms that estimate and remove light that was spread out bythe optics. The image S/N increases but sensitivity is lost, andimages are no longer quantitative (Swedlow, 2007; Wallace et al.,2001). Quantitative restorative image deconvolution relies onextensively developed algorithms that use an iterative process tomathematically reverse the blurring effects of the optics so thatcaptured light is reassigned to its true point of origin. In this way,the S/N of the image is significantly increased and quantificationof fluorescence is retained while generating higher resolutionimages (Holmes et al., 2006; McNally et al., 1999; Murray, 2005;Shaw, 2006; Swedlow, 2007; Wallace et al., 2001) (http://micro.magnet.fsu.edu/primer/digitalimaging/deconvolution/deconvolutionhome.html). Well-established commercial software packages thatuse algorithms to generate quantitative images are available forperforming restorative deconvolution, such as Huygens software(Scientific Volume Imaging), Zeiss Axiovision and AutoQuant X(Media Cybernetics). Image deconvolution requires the collectionof a z-stack of images, so for live-cell applications it should onlybe used if three-dimensional (3D) information is required. Placingsub-resolution 0.1 μm beads on the cells can be used to test forproper image restoration. Examples of deconvolution for specificplatforms will be given in the sections below.
For any light source, the power must always be minimized, anddyes that require UV excitation should be avoided. For instance,nuclear labeling with blue Hoechst dye can be substituted withthe far-red dye Draq5 (Biostatus Ltd); nevertheless, care shouldbe taken with nuclear dyes as they rarely allow normal cell divisionto occur.
Minimal lateral (x and y axes) and axial (z axis) resolution shouldbe used to see the structures of interest. The Nyquist criterion statesthat, in order to accurately reconstruct a signal (e.g. a microscopicobject), sampling should be carried out at a spacing ~2.3� smallerthan the signal that is being measured (Nyquist, 1928; Pawley, 2006;Shannon, 1949). In light microscopy, the smallest signal that canbe measured is the resolution limit of the system, which isdetermined by the wavelength of light being used and the NA ofthe lens. The resolution (R) of a specific lens is defined as:
where λ is the wavelength of the emission light. For a 60�, 1.4 NA oil-immersion lens using 500-nm light, the resolution is0.18 μm. In this case, sampling should be done at 0.078 μm. TheNyquist criterion can also be applied for temporal resolution toreconstruct dynamic events of interest. For example, if an eventtakes hours, samples should be taken every 20-30 minutes, asresolution on the scale of minutes or seconds is not required.
Use the minimum number of fluorescent probes that are required,thereby avoiding excess light exposure and reducing the potential forprobes to produce non-physiologically relevant responses and stresses.Oxygen-radical scavengers can be used to minimize photobleachingand phototoxicity, but should not affect cell viability, and should betested for effectiveness with the given fluorescent dye and imagingconditions.
Platform-specific optimizationTransmitted-light microscopy
A great deal of information can be gained simply by observing cellsusing transmitted-light microscopy techniques such as phase contrastor DIC (Murphy, 2001). Because there is plenty of light availableusing these techniques, light throughput and the S/N should not beissues; however, regular cleaning of the optical components isrequired to maintain high image quality. Proper Köhler alignmentof the microscope and alignment of phase or Nomarski (DIC) opticsare crucial. See your microscope manual or refer to the followingwebsites for further details (http://micro.magnet.fsu.edu/primer/techniques/dic/dicconfiguration.html; http://www.microscopyu.com/articles/phasecontrast/phaseconfiguration.html).
Low levels of white light do not show any obvious adverse effectson cells. However, care should be taken not to use high levels oftransmitted light as there are near-UV and near-IR (NIR)components in some white-light sources that, when highly focusedby the microscope, can disrupt the cell. It is best to reduce theintensity of the light and increase the camera exposure time togenerate high S/N images and minimize any potential adverse effectson the cell.
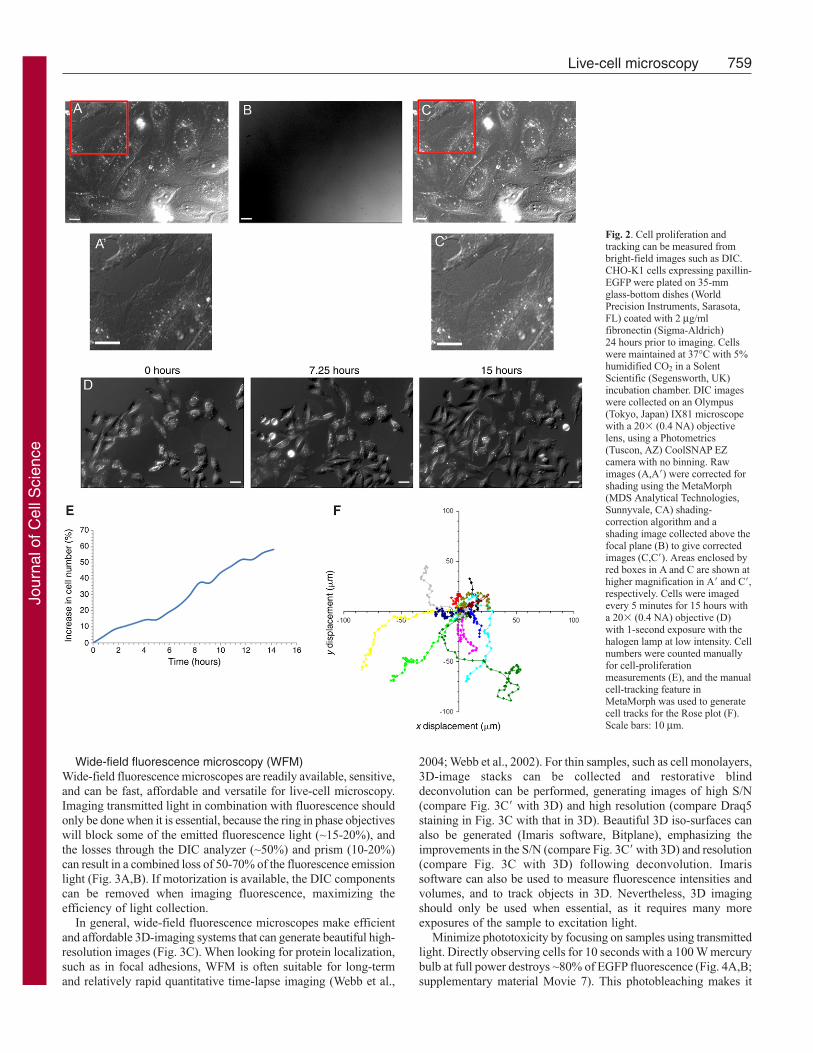
With transmitted-light microscopy, potential perturbations tocells owing to the introduction of FPs or dyes are avoided. DICimages inherently have some shading, which can be correctedusing an image that is collected with no sample on the microscopeor when the sample is out of focus. Automated shading-correctionalgorithms are often included in microscope software packagesand involve the original DIC image (Fig. 2A,A�) being dividedby the shading image (Fig. 2B), resulting in a corrected image(Fig. 2C,C�). From time-lapse DIC movies (Fig. 2D;supplementary material Movie 5), processes such as cellproliferation (Fig. 2E), migration (Fig. 2F), and the fast movementsof organelle and vesicle dynamics (supplementary material Movie 6)can be measured.
R =λ
2NA(2),
Journal of Cell Science 122 (6)
Jour
nal o
f Cel
l Sci
ence
759Live-cell microscopy
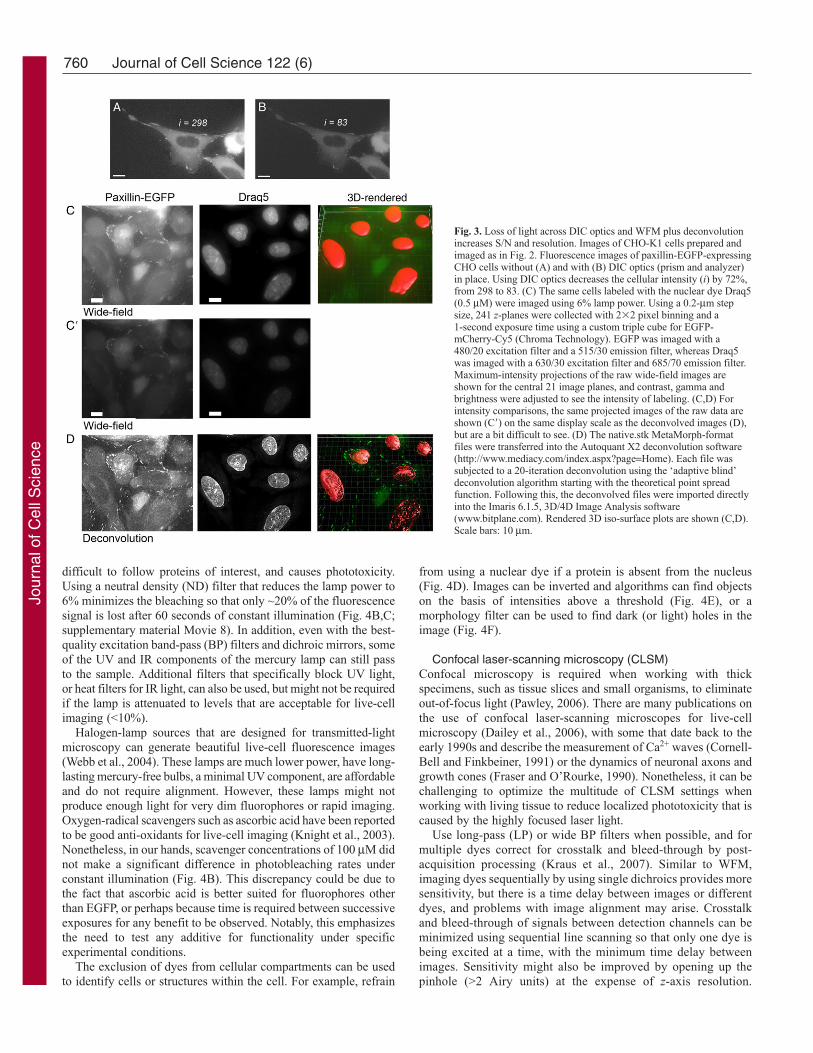
Wide-field fluorescence microscopy (WFM)Wide-field fluorescence microscopes are readily available, sensitive,and can be fast, affordable and versatile for live-cell microscopy.Imaging transmitted light in combination with fluorescence shouldonly be done when it is essential, because the ring in phase objectiveswill block some of the emitted fluorescence light (~15-20%), andthe losses through the DIC analyzer (~50%) and prism (10-20%)can result in a combined loss of 50-70% of the fluorescence emissionlight (Fig. 3A,B). If motorization is available, the DIC componentscan be removed when imaging fluorescence, maximizing theefficiency of light collection.
In general, wide-field fluorescence microscopes make efficientand affordable 3D-imaging systems that can generate beautiful high-resolution images (Fig. 3C). When looking for protein localization,such as in focal adhesions, WFM is often suitable for long-termand relatively rapid quantitative time-lapse imaging (Webb et al.,
2004; Webb et al., 2002). For thin samples, such as cell monolayers,3D-image stacks can be collected and restorative blinddeconvolution can be performed, generating images of high S/N(compare Fig. 3C� with 3D) and high resolution (compare Draq5staining in Fig. 3C with that in 3D). Beautiful 3D iso-surfaces canalso be generated (Imaris software, Bitplane), emphasizing theimprovements in the S/N (compare Fig. 3C� with 3D) and resolution(compare Fig. 3C with 3D) following deconvolution. Imarissoftware can also be used to measure fluorescence intensities andvolumes, and to track objects in 3D. Nevertheless, 3D imagingshould only be used when essential, as it requires many moreexposures of the sample to excitation light.
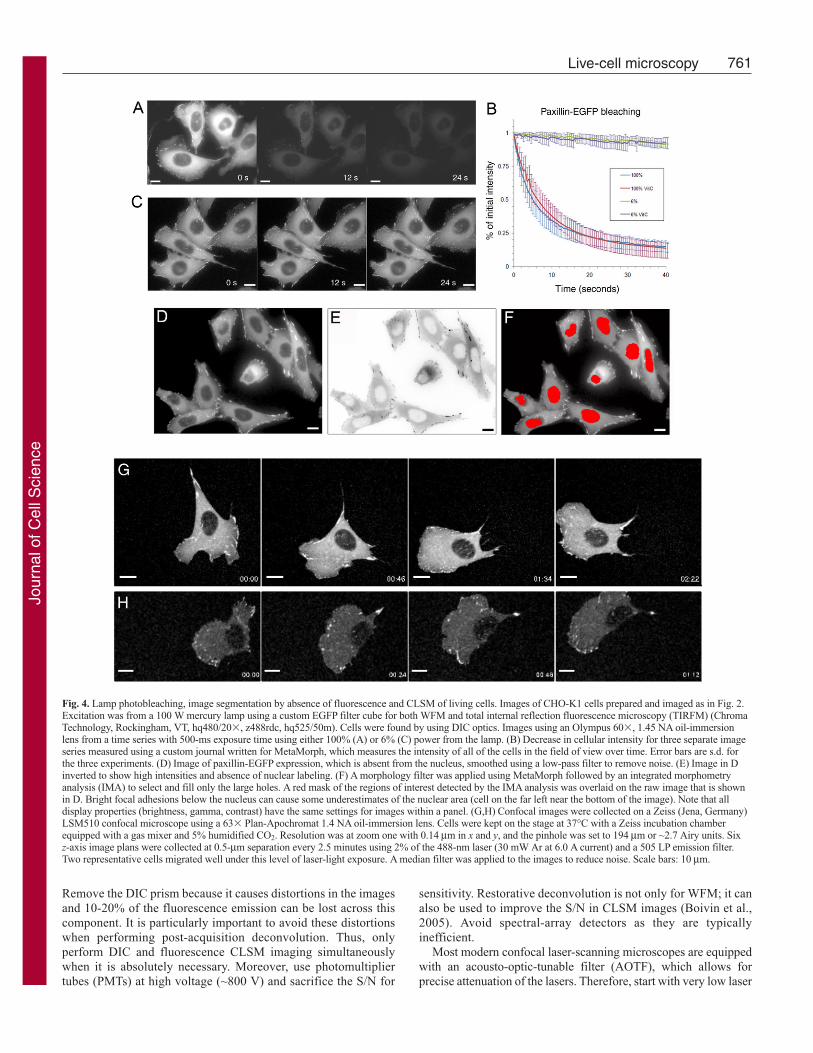
Minimize phototoxicity by focusing on samples using transmittedlight. Directly observing cells for 10 seconds with a 100 W mercurybulb at full power destroys ~80% of EGFP fluorescence (Fig. 4A,B;supplementary material Movie 7). This photobleaching makes it
Fig. 2. Cell proliferation andtracking can be measured frombright-field images such as DIC.CHO-K1 cells expressing paxillin-EGFP were plated on 35-mmglass-bottom dishes (WorldPrecision Instruments, Sarasota,FL) coated with 2 μg/mlfibronectin (Sigma-Aldrich) 24 hours prior to imaging. Cellswere maintained at 37°C with 5%humidified CO2 in a SolentScientific (Segensworth, UK)incubation chamber. DIC imageswere collected on an Olympus(Tokyo, Japan) IX81 microscopewith a 20� (0.4 NA) objectivelens, using a Photometrics(Tuscon, AZ) CoolSNAP EZcamera with no binning. Rawimages (A,A�) were corrected forshading using the MetaMorph(MDS Analytical Technologies,Sunnyvale, CA) shading-correction algorithm and ashading image collected above thefocal plane (B) to give correctedimages (C,C�). Areas enclosed byred boxes in A and C are shown athigher magnification in A� and C�,respectively. Cells were imagedevery 5 minutes for 15 hours witha 20� (0.4 NA) objective (D)with 1-second exposure with thehalogen lamp at low intensity. Cellnumbers were counted manuallyfor cell-proliferationmeasurements (E), and the manualcell-tracking feature inMetaMorph was used to generatecell tracks for the Rose plot (F).Scale bars: 10 μm.
Jour
nal o
f Cel
l Sci
ence
760
difficult to follow proteins of interest, and causes phototoxicity.Using a neutral density (ND) filter that reduces the lamp power to6% minimizes the bleaching so that only ~20% of the fluorescencesignal is lost after 60 seconds of constant illumination (Fig. 4B,C;supplementary material Movie 8). In addition, even with the best-quality excitation band-pass (BP) filters and dichroic mirrors, someof the UV and IR components of the mercury lamp can still passto the sample. Additional filters that specifically block UV light,or heat filters for IR light, can also be used, but might not be requiredif the lamp is attenuated to levels that are acceptable for live-cellimaging (<10%).
Halogen-lamp sources that are designed for transmitted-lightmicroscopy can generate beautiful live-cell fluorescence images(Webb et al., 2004). These lamps are much lower power, have long-lasting mercury-free bulbs, a minimal UV component, are affordableand do not require alignment. However, these lamps might notproduce enough light for very dim fluorophores or rapid imaging.Oxygen-radical scavengers such as ascorbic acid have been reportedto be good anti-oxidants for live-cell imaging (Knight et al., 2003).Nonetheless, in our hands, scavenger concentrations of 100 μM didnot make a significant difference in photobleaching rates underconstant illumination (Fig. 4B). This discrepancy could be due tothe fact that ascorbic acid is better suited for fluorophores otherthan EGFP, or perhaps because time is required between successiveexposures for any benefit to be observed. Notably, this emphasizesthe need to test any additive for functionality under specificexperimental conditions.
The exclusion of dyes from cellular compartments can be usedto identify cells or structures within the cell. For example, refrain
from using a nuclear dye if a protein is absent from the nucleus(Fig. 4D). Images can be inverted and algorithms can find objectson the basis of intensities above a threshold (Fig. 4E), or amorphology filter can be used to find dark (or light) holes in theimage (Fig. 4F).
Confocal laser-scanning microscopy (CLSM)Confocal microscopy is required when working with thickspecimens, such as tissue slices and small organisms, to eliminateout-of-focus light (Pawley, 2006). There are many publications onthe use of confocal laser-scanning microscopes for live-cellmicroscopy (Dailey et al., 2006), with some that date back to theearly 1990s and describe the measurement of Ca2+ waves (Cornell-Bell and Finkbeiner, 1991) or the dynamics of neuronal axons andgrowth cones (Fraser and O’Rourke, 1990). Nonetheless, it can bechallenging to optimize the multitude of CLSM settings whenworking with living tissue to reduce localized phototoxicity that iscaused by the highly focused laser light.
Use long-pass (LP) or wide BP filters when possible, and formultiple dyes correct for crosstalk and bleed-through by post-acquisition processing (Kraus et al., 2007). Similar to WFM,imaging dyes sequentially by using single dichroics provides moresensitivity, but there is a time delay between images or differentdyes, and problems with image alignment may arise. Crosstalkand bleed-through of signals between detection channels can beminimized using sequential line scanning so that only one dye isbeing excited at a time, with the minimum time delay betweenimages. Sensitivity might also be improved by opening up thepinhole (>2 Airy units) at the expense of z-axis resolution.
Journal of Cell Science 122 (6)
Fig. 3. Loss of light across DIC optics and WFM plus deconvolutionincreases S/N and resolution. Images of CHO-K1 cells prepared andimaged as in Fig. 2. Fluorescence images of paxillin-EGFP-expressingCHO cells without (A) and with (B) DIC optics (prism and analyzer)in place. Using DIC optics decreases the cellular intensity (i) by 72%,from 298 to 83. (C) The same cells labeled with the nuclear dye Draq5(0.5 μM) were imaged using 6% lamp power. Using a 0.2-μm stepsize, 241 z-planes were collected with 2�2 pixel binning and a 1-second exposure time using a custom triple cube for EGFP-mCherry-Cy5 (Chroma Technology). EGFP was imaged with a480/20 excitation filter and a 515/30 emission filter, whereas Draq5was imaged with a 630/30 excitation filter and 685/70 emission filter.Maximum-intensity projections of the raw wide-field images areshown for the central 21 image planes, and contrast, gamma andbrightness were adjusted to see the intensity of labeling. (C,D) Forintensity comparisons, the same projected images of the raw data areshown (C�) on the same display scale as the deconvolved images (D),but are a bit difficult to see. (D) The native.stk MetaMorph-formatfiles were transferred into the Autoquant X2 deconvolution software(http://www.mediacy.com/index.aspx?page=Home). Each file wassubjected to a 20-iteration deconvolution using the ‘adaptive blind’deconvolution algorithm starting with the theoretical point spreadfunction. Following this, the deconvolved files were imported directlyinto the Imaris 6.1.5, 3D/4D Image Analysis software(www.bitplane.com). Rendered 3D iso-surface plots are shown (C,D).Scale bars: 10 μm.
Jour
nal o
f Cel
l Sci
ence
761Live-cell microscopy
Remove the DIC prism because it causes distortions in the imagesand 10-20% of the fluorescence emission can be lost across thiscomponent. It is particularly important to avoid these distortionswhen performing post-acquisition deconvolution. Thus, onlyperform DIC and fluorescence CLSM imaging simultaneouslywhen it is absolutely necessary. Moreover, use photomultipliertubes (PMTs) at high voltage (~800 V) and sacrifice the S/N for
sensitivity. Restorative deconvolution is not only for WFM; it canalso be used to improve the S/N in CLSM images (Boivin et al.,2005). Avoid spectral-array detectors as they are typicallyinefficient.
Most modern confocal laser-scanning microscopes are equippedwith an acousto-optic-tunable filter (AOTF), which allows forprecise attenuation of the lasers. Therefore, start with very low laser
Fig. 4. Lamp photobleaching, image segmentation by absence of fluorescence and CLSM of living cells. Images of CHO-K1 cells prepared and imaged as in Fig. 2.Excitation was from a 100 W mercury lamp using a custom EGFP filter cube for both WFM and total internal reflection fluorescence microscopy (TIRFM) (ChromaTechnology, Rockingham, VT, hq480/20�, z488rdc, hq525/50m). Cells were found by using DIC optics. Images using an Olympus 60�, 1.45 NA oil-immersionlens from a time series with 500-ms exposure time using either 100% (A) or 6% (C) power from the lamp. (B) Decrease in cellular intensity for three separate imageseries measured using a custom journal written for MetaMorph, which measures the intensity of all of the cells in the field of view over time. Error bars are s.d. forthe three experiments. (D) Image of paxillin-EGFP expression, which is absent from the nucleus, smoothed using a low-pass filter to remove noise. (E) Image in Dinverted to show high intensities and absence of nuclear labeling. (F) A morphology filter was applied using MetaMorph followed by an integrated morphometryanalysis (IMA) to select and fill only the large holes. A red mask of the regions of interest detected by the IMA analysis was overlaid on the raw image that is shownin D. Bright focal adhesions below the nucleus can cause some underestimates of the nuclear area (cell on the far left near the bottom of the image). Note that alldisplay properties (brightness, gamma, contrast) have the same settings for images within a panel. (G,H) Confocal images were collected on a Zeiss (Jena, Germany)LSM510 confocal microscope using a 63� Plan-Apochromat 1.4 NA oil-immersion lens. Cells were kept on the stage at 37°C with a Zeiss incubation chamberequipped with a gas mixer and 5% humidified CO2. Resolution was at zoom one with 0.14 μm in x and y, and the pinhole was set to 194 μm or ~2.7 Airy units. Six z-axis image plans were collected at 0.5-μm separation every 2.5 minutes using 2% of the 488-nm laser (30 mW Ar at 6.0 A current) and a 505 LP emission filter.Two representative cells migrated well under this level of laser-light exposure. A median filter was applied to the images to reduce noise. Scale bars: 10 μm.
Jour
nal o
f Cel
l Sci
ence
762
powers and only increase them following optimization of otherinstrument settings (Table 1). AOTF control also allows the laserto be turned off during the back-scan for uni-directional scanning.
Use faster scan speeds (�8 μs/pixel) with no line or frameaveraging so that the laser spends less time at each pixel. Minimizesampling in x, y and z to reduce the amount of time the focused
Journal of Cell Science 122 (6)
Fig. 5. See next page for legend.
Jour
nal o
f Cel
l Sci
ence
763Live-cell microscopy
laser beam spends in any location within the sample. If informationis only needed in one area of the cell, then image a small regionof interest. CLSM can be used to image live cells in 3D for manyhours using optimized settings (Fig. 4G,H; supplementary materialMovies 9 and 10).
One of the limitations of CLSM is speed; however, there aresome strategies that can be used for rapid imaging. Two-colorquantitative data at rates of up to 20 frames per second (fps) wereachieved for endosomes moving in reticulocytes using smallimage regions, bi-directional scanning and only scanning everysecond line along the y-axis (Sheftel et al., 2007). Rapid imagingcan also be achieved by using repeated line scanning, generatingan image of intensity over time for a single line across the specimen(Digman et al., 2008). Spectral-array detectors can be used tocollect light of all colors with one pass of the lasers. A lot of lightcan be lost with these systems, although newer models continueto improve.
Keep in mind that WFM systems can be faster and moresensitive than CLSM systems, as light that is rejected by the pinholeon a confocal microscope is collected on a wide-field microscope.So, for some applications, WFM followed by restorativedeconvolution might be more appropriate than CLSM.
Multi-photon confocal laser-scanning microscopy(MP-CLSM)
Multi-photon confocal laser-scanning microscopes are ideal forintravital imaging in thick tissues, in live animals or in tissue-slicecultures (Piston, 2006; Rocheleau and Piston, 2003). Chromaticaberrations are limited with MP-CLSM because, rather thanfocusing multiple lasers of different colors, a single laser excitationcan be used for multiple fluorophores. This makes MP-CLSM ideal
for colocalization (Kawano et al., 2008) or co-dynamicmeasurements such as Förster (or fluorescence) resonance energytransfer (FRET), or two-color image-correlation microscopy (ICM)(Wiseman et al., 2000). Multi-photon fluorescence excitation isbased on the simultaneous absorption of more than one NIR photonof light by a single fluorophore molecule. Thus, MP-CLSM isinherently confocal because simultaneous absorption of multiplephotons only occurs in the highly photon-dense laser focal volume(Oheim et al., 2006).
Use LP or wide BP filters when possible, and correct forcrosstalk and bleed-through with post-acquisition processing(Kraus et al., 2007). The fluorescence emission can be harnessedand detected without going back through the scanning optics[termed non-descanned detectors (NDDs)] because, unlike CLSM,a pinhole is not required. NIR light will also have much less scatterin tissue owing to its long wavelength, so it can penetrate deeplyinto the specimen with less background fluorescence. Use PMTsat high voltage (~800 V) and, for low-light-level applications,avalanche photodiodes (APDs) can be used. Post-acquisitiondeconvolution can be performed on 3D multi-photon imagestacks.
Fluorescence excitation is limited to the focal volume (~1 fL),reducing overall phototoxicity compared with single-photon CLSM(Schwille et al., 1999). However, there is evidence that localizedphotobleaching within the focal volume is higher for MP-CLSM(Patterson and Piston, 2000). Therefore, use MP-CLSM for tissue,but single-photon CLSM is better suited for cellular monolayers.Nonetheless, NIR light is of much lower energy than visible lasersand, for multi-color imaging, an NIR laser can excite multiplefluorophores simultaneously. The lowest possible laser powershould be used to avoid phototoxicity and any potential heat damageowing to the focused NIR light (Konig, 2006).
With new lasers optimized to generate short, high-energy pulsesof NIR light, multi-photon imaging in intact brain is nowapproaching depths of 1 mm (Helmchen and Denk, 2005). Intravitalimaging of FPs combined with probe-free second-harmonic imagingof ordered protein structures, such as collagen fibers, within intacttumors have provided ground-breaking results in breast-cancerresearch (Yamaguchi et al., 2005). However, keep in mind that MP-CLSM is expensive and requires a lot of expertise, and many dyeshave not been characterized so might not be suitable for multi-photon excitation.
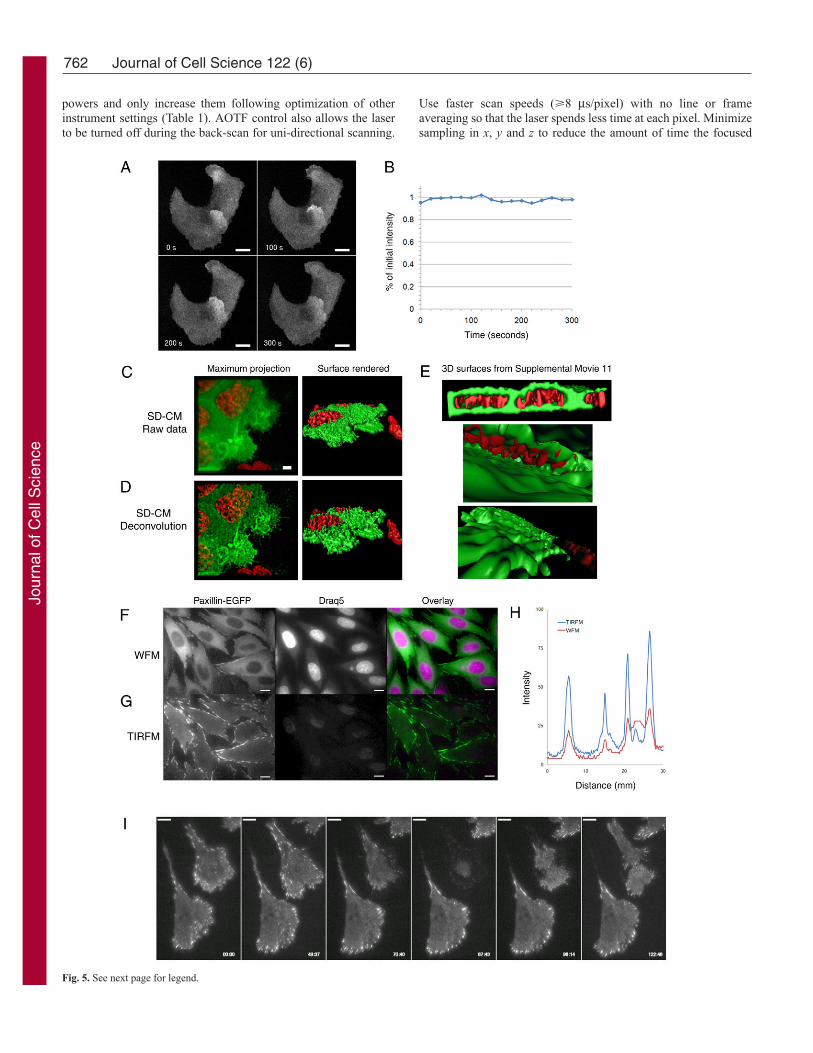
Spinning-disk confocal microscopy (SD-CM)For live-cell microscopy, techniques that spread the illuminationlight over a larger area of the sample minimize phototoxicity whencompared with CLSM (Fig. 5A,B). In addition, data are collectedby a CCD array from many sample locations simultaneously forrapid image acquisition. This can be done using a disk that haseither slits or thousands of pinholes that allow light to selectivelyexcite fluorescence in multiple regions of the sample. Over time,as the disk spins, the entire specimen is sampled and imaged on aCCD-array detector. Here, we specifically discuss the YokogawaSD-CM, which uses two disks – one with pinholes and one withmicro-lenses – to focus the excitation light into the pinholes,improving the excitation efficiency of the system (Ichihara et al.,1996). There are other designs on the market, which are summarizedelsewhere (Toomre and Pawley, 2006).
Use the most current generation of confocal heads (e.g.Yokogawa X1), or systems modified with custom mirrors, dichroicsand camera-coupling optics to increase light throughput and
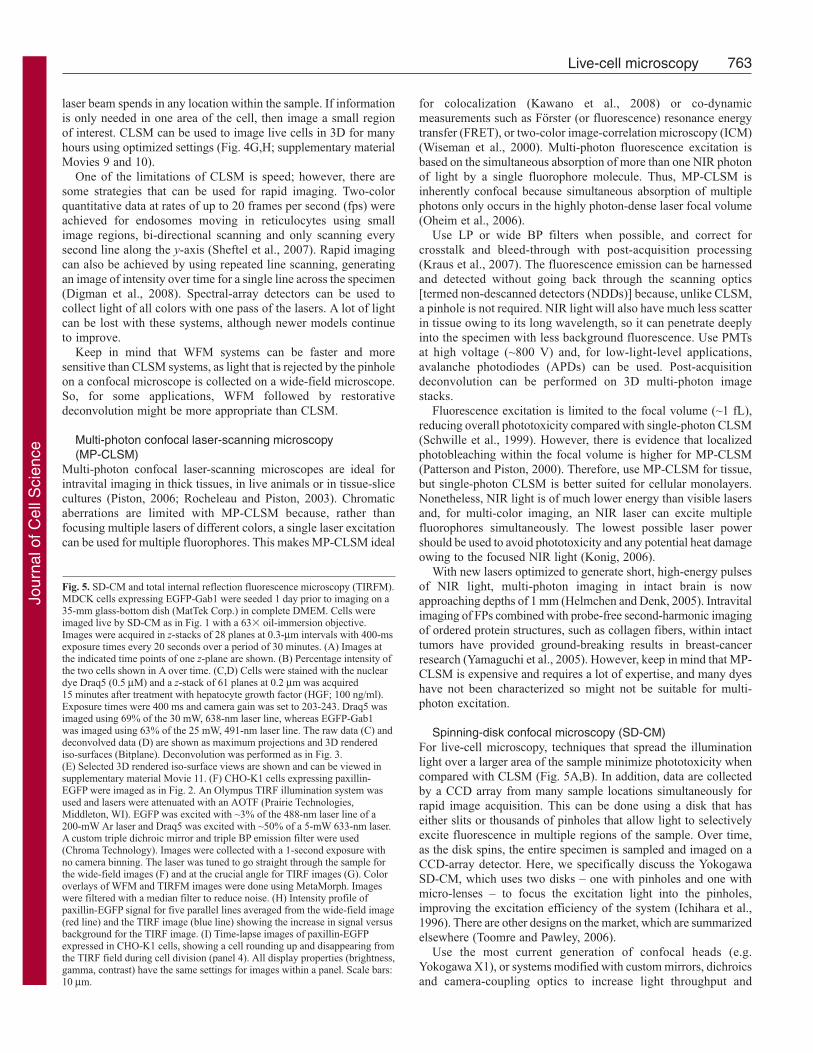
Fig. 5. SD-CM and total internal reflection fluorescence microscopy (TIRFM).MDCK cells expressing EGFP-Gab1 were seeded 1 day prior to imaging on a35-mm glass-bottom dish (MatTek Corp.) in complete DMEM. Cells wereimaged live by SD-CM as in Fig. 1 with a 63� oil-immersion objective.Images were acquired in z-stacks of 28 planes at 0.3-μm intervals with 400-msexposure times every 20 seconds over a period of 30 minutes. (A) Images atthe indicated time points of one z-plane are shown. (B) Percentage intensity ofthe two cells shown in A over time. (C,D) Cells were stained with the nucleardye Draq5 (0.5 μM) and a z-stack of 61 planes at 0.2 μm was acquired 15 minutes after treatment with hepatocyte growth factor (HGF; 100 ng/ml).Exposure times were 400 ms and camera gain was set to 203-243. Draq5 wasimaged using 69% of the 30 mW, 638-nm laser line, whereas EGFP-Gab1was imaged using 63% of the 25 mW, 491-nm laser line. The raw data (C) anddeconvolved data (D) are shown as maximum projections and 3D renderediso-surfaces (Bitplane). Deconvolution was performed as in Fig. 3.(E) Selected 3D rendered iso-surface views are shown and can be viewed insupplementary material Movie 11. (F) CHO-K1 cells expressing paxillin-EGFP were imaged as in Fig. 2. An Olympus TIRF illumination system wasused and lasers were attenuated with an AOTF (Prairie Technologies,Middleton, WI). EGFP was excited with ~3% of the 488-nm laser line of a200-mW Ar laser and Draq5 was excited with ~50% of a 5-mW 633-nm laser.A custom triple dichroic mirror and triple BP emission filter were used(Chroma Technology). Images were collected with a 1-second exposure withno camera binning. The laser was tuned to go straight through the sample forthe wide-field images (F) and at the crucial angle for TIRF images (G). Coloroverlays of WFM and TIRFM images were done using MetaMorph. Imageswere filtered with a median filter to reduce noise. (H) Intensity profile ofpaxillin-EGFP signal for five parallel lines averaged from the wide-field image(red line) and the TIRF image (blue line) showing the increase in signal versusbackground for the TIRF image. (I) Time-lapse images of paxillin-EGFPexpressed in CHO-K1 cells, showing a cell rounding up and disappearing fromthe TIRF field during cell division (panel 4). All display properties (brightness,gamma, contrast) have the same settings for images within a panel. Scale bars:10 μm.
Jour
nal o
f Cel
l Sci
ence
764
improve image quality (e.g. Quorum Technologies). Standardscientific-grade CCD cameras produce beautiful images and, inmost cases, can be binned 2�2 to increase the S/N and reduceexposure time. However, to take full advantage of the spinning-disk systems, it is best to equip them with highly sensitive back-thinned EM-CCD cameras, with which imaging speeds can reachvideo rate for full-frame imaging, or into the hundreds of framesper second with small regions of interest. If 512�512 EM-CCDarrays are used at high magnification (e.g. 60�), there must beadditional optical coupling between the camera and the microscopeto produce high-resolution images; however, high-quality opticsare required to minimize light loss. Post-acquisition blinddeconvolution improves SD-CM data, giving superior resolutionand a higher S/N relative to the raw data (compare Fig. 5C with5D). SD-CM data can also be processed, generating beautiful andinformative high-resolution 3D reconstruction images (Fig. 5C,D)and movies (Fig. 5E; supplementary material Movie 11) of FPsduring membrane ruffling.
Laser light is spread over thousands of pinholes, resulting infocused laser light that is orders of magnitude lower in power atthe sample than in CLSM. Each position is sampled hundreds orthousands of times depending on the speed of the disk spinning andthe camera’s exposure time. The laser passes through the pinholes
so that, unlike in CLSM, the excitation light is also confocal, onlyexciting fluorescence within a small confocal volume rather thanthrough the whole sample. The reduction in photobleaching andphototoxicity with SD-CM is substantial (Wang et al., 2005). InFig. 5, 28 z-axis image planes were collected every 20 seconds for30 minutes, resulting in virtually continuous sampling. Over 300seconds (~eight times longer than in Fig. 3B), there is no apparentphotobleaching of the FP (Fig. 5A,B). Of course, light levels shouldstill be kept to a minimum (Table 1) because, after 30 minutes ofcontinuous illumination, about 20% of the fluorescence signal islost (not shown). In general, cells can be imaged extensively formany days on the SD platform (48 hours, seven z-planes every 15 minutes) with no obvious effects on cell health or proliferation(Fig. 1C). Owing to the extensive reduction in light exposure whenimaging using SD-CM, it is more feasible to collect 3D time-seriesdata of live cells.
Total internal reflection fluorescence microscopy (TIRFM)TIRFM (also known as evanescent wave microscopy) (Axelrod,2001; Axelrod, 2003; Trache and Meininger, 2008), is ideal for thestudy of cell adhesion and migration (Adams et al., 2004; Choi et al., 2008; Nayal et al., 2006), as well as exocytosis (Nagamatsuand Ohara-Imaizumi, 2008) and endocytosis (Schneckenburger,2005). However, care must be taken when working with confluentcell monolayers because artifacts can be introduced in the TIRFillumination, presumably owing to the high refractive index of thecell monolayer (C.M.B., unpublished observation).
Use TIRF-specific filters to avoid laser-light reflections andinterference patterns, and broad BP or LP filters when possible.Similar to SD-CM, choose the appropriate camera on the basis ofthe need for high spatial resolution (scientific grade CCD) or speed(EM-CCD). There is an inherent increase in signal over backgroundowing to the lack of out-of-focus fluorescence excitation. It isimportant to note that there is reduced phototoxicity because onlythe molecules within ~100 nm of the cover glass are excited.
The specificity for the basal surface of the cell is evident fromthe lack of nuclear staining in the TIRF field (compare Draq5 inFig. 5F with that in 5G), and there is a significant improvement in the S/N for paxillin-EGFP-containing adhesions (Fig. 5H). Cellsmove, grow and divide well under TIRF illumination (Fig. 5I;supplementary material Movie 12), with cells disappearing fromthe TIRF field when rounding up to divide (Fig. 5I, panel 4).
Biophysical toolsThere are a tremendous number of biophysical probes, fromcolorful FPs to organelle-specific dyes, and molecular highlightersavailable to researchers for live-cell microscopy. We are justscratching the surface with the suggestions provided (Box 2). Theseprobes can be used in combination with photo-activation orfluorescence recovery after photobleaching (FRAP) and otherbleaching techniques (Snapp et al., 2003), but care must be takento ensure that the cells are not exposed to unnecessary amounts oflight. Try using one photobleaching scan and see whether it issufficient to measure protein kinetics. Perhaps looking at the shapeof the recovery curve when only 20% of the proteins are bleachedis enough. Cell viability should be monitored before, during andafter these invasive types of measurements.
Fluorescence-correlation spectroscopy (FCS) (Kim et al., 2007)and ICM (Brown et al., 2008; Wiseman et al., 2004) techniqueshave been optimized for live-cell microscopy. The ICM tools canbe used to map out protein dynamics, concentrations, co-dynamics
Journal of Cell Science 122 (6)
Start Fluorescence? TLMNo
Yes
~100 nm fromYes
No
100 nm frombasal surface?TIRFM
Thicker than200 µm?
YesMP-CLSM
Thinner than ~20 µm?
Yes
No
WFMCLSM
Rapid No
Line scan/ROI
NoNo
Y Rapiddynamics?
>5 fps2D-3D images?
NoCLSM
Yes
SD-CM
Yes
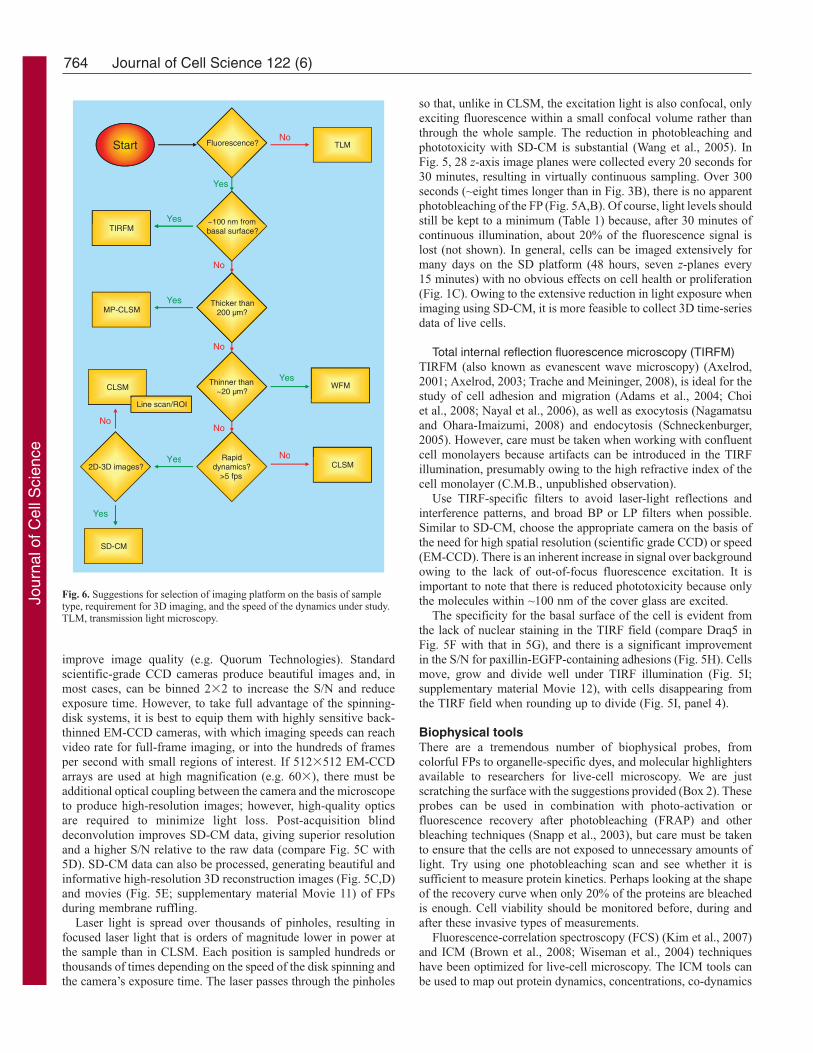
Fig. 6. Suggestions for selection of imaging platform on the basis of sampletype, requirement for 3D imaging, and the speed of the dynamics under study.TLM, transmission light microscopy.
Jour
nal o
f Cel
l Sci
ence
765Live-cell microscopy
and colocalization across the living cell. ICM is well-suited to live-cell microscopy because, in contrast to photobleaching techniques,it does not depend on photodamage. However, these techniques canbe difficult to master.
Conclusion and perspectivesAll of the above platforms can be optimized for live-cellmicroscopy, and each has its use, depending on the sample typeto be imaged and the speed of the cellular processes of interest(Fig. 6). Ensuring that optical light paths are optimized forsensitivity and throughput and that the most sensitive detectorsare used will allow for imaging conditions that minimizephototoxicity and maintain cell viability. Live-cell microscopyresearch is growing exponentially, giving researchers ever-clearerviews of the inner workings of the cell. Further improvements toFPs, more-diverse molecular highlighters (Stark and Kulesa,2007), and the ability to locally photo-uncage and activatemolecules (Judkewitz et al., 2006) give researchers a diverse arrayof tools to follow dynamics within the cell. This, taken togetherwith advances in optical microscopy, PMT and CCD-camerasensitivity and the availability of diverse imaging platforms, willallow the field of live-cell microscopy to continue to grow at anamazing pace. Perhaps, with the development of ultra-high-resolution imaging techniques (Lippincott-Schwartz and Manley,2009; Fernandez-Suarez and Ting, 2008) that are compatible withrapid live-cell imaging, we will be able to watch the intricatemolecular dynamics and interactions within the cell in great detail.Using live-cell imaging, researchers will continue to gain insightinto the vast array of cellular processes at work from the single-cell level to their function within the entire organism.
A special thanks to Cory Glowinski from Bitplane for his tirelessefforts deconvolving and generating a vast number of 3D renderedimages using the Imaris software for Figs 3 and 5. The versatility andimmense number and type of visualization tools provided by thesoftware could have been overwhelming without his expertise andguidance. Thank you to David Hitrys from QImaging for his criticalreading of the manuscript, his suggestions and interesting discussions.All images in the paper were collected at either the Cell Imaging andAnalysis Network (CIAN) or the McGill Imaging Facility, both of whichare funded by the Canadian Foundation for Innovation.
ReferencesAdams, M. C., Matov, A., Yarar, D., Gupton, S. L., Danuser, G. and Waterman-Storer,
C. M. (2004). Signal analysis of total internal reflection fluorescent speckle microscopy(TIR-FSM) and wide-field epi-fluorescence FSM of the actin cytoskeleton and focaladhesions in living cells. J. Microsc. 216, 138-152.
Ai, H. W., Henderson, J. N., Remington, S. J. and Campbell, R. E. (2006). Directedevolution of a monomeric, bright and photostable version of Clavularia cyan fluorescentprotein: structural characterization and applications in fluorescence imaging. Biochem.J. 400, 531-540.
Ando, R., Hama, H., Yamamoto-Hino, M., Mizuno, H. and Miyawaki, A. (2002). Anoptical marker based on the UV-induced green-to-red photoconversion of a fluorescentprotein. Proc. Natl. Acad. Sci. USA 99, 12651-12656.
Ando, R., Mizuno, H. and Miyawaki, A. (2004). Regulated fast nucleocytoplasmicshuttling observed by reversible protein highlighting. Science 306, 1370-1373.
Axelrod, D. (2001). Total internal reflection fluorescence microscopy in cell biology. Traffic2, 764-774.
Axelrod, D. (2003). Total internal reflection fluorescence microscopy in cell biology.Methods Enzymol. 361, 1-33.
Boivin, B., Villeneuve, L. R., Farhat, N., Chevalier, D. and Allen, B. G. (2005). Sub-cellular distribution of endothelin signaling pathway components in ventricularmyocytes and heart: lack of preformed caveolar signalosomes. J. Mol. Cell Cardiol.38, 665-676.
Bolte, S. and Cordelieres, F. P. (2006). A guided tour into subcellular colocalization analysisin light microscopy. J. Microsc. 224, 213-232.
Brown, C. M. (2007). Fluorescence microscopy-avoiding the pitfalls. J. Cell Sci. 120,1703-1705.
Brown, C. M., Dalal, R. B., Hebert, B., Digman, M. A., Horwitz, A. R. and Gratton,E. (2008). Raster image correlation spectroscopy (RICS) for measuring fast proteindynamics and concentrations with a commercial laser scanning confocal microscope. J.Microsc. 229, 78-91.
Cardullo, R. A. and Hinchcliffe, E. H. (2007). Digital manipulation of brightfield andfluorescence images: noise reduction, contrast enhancement, and feature extraction.Methods Cell Biol. 81, 285-314.
Box 2. Fluorescence tools for live-cell imaging
Fluorescent proteins (FPs) and highlightersThere are many reviews dealing with how to choose appropriateFPs with the full spectrum of colors (Day and Schaufele, 2008;Goldman and Spector, 2005; Shaner et al., 2005; Tsien, 2005).Monomeric EGFP is still the FP of choice (monomeric mutationA206K) (Zacharias et al., 2002); however, expression should bemaintained at levels similar to those of the endogenous protein.The brightest and most photostable FPs that are most commonlyused include: mCitrine (Griesbeck et al., 2001), venus-YFP(Nagai et al., 2002) or the optimal FRET pair of CyPet and YPet(Nguyen and Daugherty, 2005); Kusabira orange (KO) (Karasawaet al., 2004); tdTomato (Shaner et al., 2005); and the newlydeveloped teal FP (TFP) (Ai et al., 2006).
Photo-activatable (PA) and photo-switchable (PS) proteinsallow the local demarcation of cells or sub-cellular populations ofproteins. For example, PA-EGFP brightens 100 times with413-nm illumination (Patterson and Lippincott-Schwartz, 2002).Kaede is a tetrameric protein that is switched from green to red ina graded fashion with UV excitation (Ando et al., 2002). Dronpa isa reversibly switchable green FP that can repeatedly be turnedon with light at a wavelength of 400 nm and rapidlyphotoswitched ‘off’ with an excitation wavelength of 490 nm(Ando et al., 2004). The photo-physical properties of some ofthese proteins have been characterized (Stark and Kulesa, 2007)and reviewed (Lukyanov et al., 2005). Note that cell health mustbe monitored when applying UV-light sources to living cells.
Fluorescent probesNumerous fluorescent compounds are available to detect cellularstructures, including the cell-permeant MitoTracker, ER-Tracker andLysoTracker dyes (Invitrogen). Draq5 is a far-red nuclear stain(BioStatus) that is preferable to Hoechst. In general, the smallestamount of reagent possible should be used – often 10-100� more-dilute concentrations than recommended result in good labeling,reduced phototoxicity and reduced cell toxicity that is caused bythe presence of the dye. FP constructs that are fused to signalingsequences targeted to various sub-cellular domains can be usedeither as baculovirus (Organelle Lights, Invitrogen) or asmammalian expression vectors (Simpson et al., 2000;VanEngelenburg and Palmer, 2008). Some of these probes (e.g.FM4-64) are difficult to use with TIRFM because they adhere to theglass, resulting in a very high signal. Adding 5% BSA in thelabeling medium will help reduce this non-specific binding.
BiosensorsThe field of biosensors is growing rapidly (Hodgson et al., 2008; Liet al., 2006). Some of the many sensors that are available includeratiometric Ca2+ sensors such as Fura-2AM (Invitrogen) or FRET-based FPs such as Premo-Cameleon (Invitrogen). Acidity can bemeasured with pH-sensitive FPs (Patterson et al., 2001) or dyemolecules (BCECF, Invitrogen). Chloride concentrations can bemonitored using halide-sensitive YFP (Jayaraman et al., 2000).Ion-specific sensors are available from Invitrogen and individuallaboratories. Sensors are available for specific phosphorylationevents and protease cleavage (Rizzo and Piston, 2005). FRET-based biosensor probes that are even more specific andsophisticated have been developed, for example, for the Rho familyof proteins including Cdc42 (Nalbant et al., 2004) and Rac(Kraynov et al., 2000; Pertz and Hahn, 2004).
Jour
nal o
f Cel
l Sci
ence
766
Casey, J. R. (2006). Why bicarbonate? Biochem. Cell Biol. 84, 930-939.Choi, C. K., Vicente-Manzanares, M., Zareno, J., Whitmore, L. A., Mogilner, A. and
Horwitz, A. R. (2008). Actin and alpha-actinin orchestrate the assembly and maturationof nascent adhesions in a myosin II motor-independent manner. Nat. Cell Biol. 10, 1039-1050.
Comeau, J. W., Costantino, S. and Wiseman, P. W. (2006). A guide to accuratefluorescence microscopy colocalization measurements. Biophys. J. 91, 4611-4622.
Cornell-Bell, A. H. and Finkbeiner, S. M. (1991). Ca2+ waves in astrocytes. Cell Calcium12, 185-204.
Dailey, M. E., Manders, E., Soll, D. R. and Terasaki, M. (2006). Confocal microscopyof living cells. In Handbook of Biological Confocal Microscopy (ed. J. Pawley), pp.381-403. New York: Springer.
Day, R. N. and Schaufele, F. (2005). Imaging molecular interactions in living cells. Mol.Endocrinol. 19, 1675-1686.
Day, R. N. and Schaufele, F. (2008). Fluorescent protein tools for studying protein dynamicsin living cells: a review. J. Biomed. Opt. 13, 031202.
Digman, M. A., Brown, C. M., Horwitz, A. R., Mantulin, W. W. and Gratton, E. (2008).Paxillin dynamics measured during adhesion assembly and disassembly by correlationspectroscopy. Biophys. J. 94, 2819-2831.
Fernandez-Suarez, M. and Ting, A. Y. (2008). Fluorescent probes for super-resolutionimaging in living cells. Nat. Rev. Mol. Cell. Biol. 9, 929-943.
Fraser, S. E. and O’Rourke, N. A. (1990). In situ analysis of neuronal dynamics andpositional cues in the patterning of nerve connections. J. Exp. Biol. 153, 61-70.
Goldman, R. D. and Spector, D. L. (2005). Live Cell Imaging: A Laboratory Manual.Cold Spring Harbor, NY: Cold Spring Harbor Laboratory Press.
Griesbeck, O., Baird, G. S., Campbell, R. E., Zacharias, D. A. and Tsien, R. Y. (2001).Reducing the environmental sensitivity of yellow fluorescent protein. Mechanism andapplications. J. Biol. Chem. 276, 29188-29194.
Haraguchi, T. (2002). Live cell imaging: approaches for studying protein dynamics inliving cells. Cell Struct. Funct. 27, 333-334.
Helmchen, F. and Denk, W. (2005). Deep tissue two-photon microscopy. Nat. Methods2, 932-940.
Hibbs, A. (2004). Confocal Microscopy for Biologists. New York: Springer.Hodgson, L., Pertz, O. and Hahn, K. M. (2008). Design and optimization of genetically
encoded fluorescent biosensors: GTPase biosensors. Methods Cell Biol. 85, 63-81.Holmes, T. J., Biggs, D. and Abu-Tarif, A. (2006). Blind deconvolution. In Handbook
of Biological Confocal Microscopy (ed. J. Pawley), pp. 468-487: New York: Springer.Ichihara, A., Tanaami, T., Isozaki, K., Sugiyama, Y., Kosugi, Y., Mikuriya, K., Abe,
M. and Uemura, I. (1996). High speed confocal fluorescence microscopy using a nipkowscanner with microlenses for 3d imaging of single fluorescent molecule in real time.Bioimages 4, 52-62.
Jayaraman, S., Haggie, P., Wachter, R. M., Remington, S. J. and Verkman, A. S. (2000).Mechanism and cellular applications of a green fluorescent protein-based halide sensor.J. Biol. Chem. 275, 6047-6050.
Judkewitz, B., Roth, A. and Hausser, M. (2006). Dendritic enlightenment: using patternedtwo-photon uncaging to reveal the secrets of the brain’s smallest dendrites. Neuron 50,180-183.
Kanaan, A., Douglas, R. M., Alper, S. L., Boron, W. F. and Haddad, G. G. (2007).Effect of chronic elevated carbon dioxide on the expression of acid-base transporters inthe neonatal and adult mouse. Am. J. Physiol. Regul. Integr. Comp. Physiol. 293, R1294-R1302.
Karasawa, S., Araki, T., Nagai, T., Mizuno, H. and Miyawaki, A. (2004). Cyan-emittingand orange-emitting fluorescent proteins as a donor/acceptor pair for fluorescenceresonance energy transfer. Biochem. J. 381, 307-312.
Kawano, H., Kogure, T., Abe, Y., Mizuno, H. and Miyawaki, A. (2008). Two-photondual-color imaging using fluorescent proteins. Nat. Methods 5, 373-374.
Kim, S. A., Heinze, K. G. and Schwille, P. (2007). Fluorescence correlation spectroscopyin living cells. Nat. Methods 4, 963-973.
Knight, M. M., Roberts, S. R., Lee, D. A. and Bader, D. L. (2003). Live cell imagingusing confocal microscopy induces intracellular calcium transients and cell death. Am.J. Physiol. Cell Physiol. 284, C1083-C1089.
Konig, K. (2006). Cell damage during multi-photon microscopy. In Handbook of BiologicalConfocal Microscopy (ed. J. Pawley), pp. 680-689. New York: Springer.
Kraus, B., Zeigler, M. and Wolff, H. (2007). Linear fluorescence unmixing in cell biologicalresearch. In Modern Research and Educational Topics in Microscopy. Vol. 2, (ed. A.Mendez-Vilas and J. Diaz), pp. 863-873. Badajoz, Spain: Formatex Microscopy BookSeries.
Kraynov, V. S., Chamberlain, C., Bokoch, G. M., Schwartz, M. A., Slabaugh, S. andHahn, K. M. (2000). Localized Rac activation dynamics visualized in living cells. Science290, 333-337.
Li, I. T., Pham, E. and Truong, K. (2006). Protein biosensors based on the principle offluorescence resonance energy transfer for monitoring cellular dynamics. Biotechnol.Lett. 28, 1971-1982.
Lichtman, J. W. and Conchello, J. A. (2005). Fluorescence microscopy. Nat. Methods 2,910-919.
Lippincott-Schwartz, J. and Manley, S. (2009). Putting super-resolution fluorescencemicroscopy to work. Nat. Methods 6, 21-23.
Lukyanov, K. A., Chudakov, D. M., Lukyanov, S. and Verkhusha, V. V. (2005).Innovation: photoactivatable fluorescent proteins. Nat. Rev. Mol. Cell. Biol. 6, 885-891.
McNally, J. G., Karpova, T., Cooper, J. and Conchello, J. A. (1999). Three-dimensionalimaging by deconvolution microscopy. Methods 19, 373-385.
Mueller, M. (2005). Introduction to Confocal Fluorescence Microscopy. Bellingham, WA:SPIE Publications.
Murphy, D. (2001). Fundamentals of Light Microscopy and Electronic Imaging. Canada:John Wiley.
Murray, J. M. (2005). Confocal microscopy, deconvolution, and structured illuminationmethods. In Live Cell Imaging: A Laboratory Manual (ed. R. D. Goldman and D. L.Spector), pp. 239-279. Cold Spring Harbor, NY: Cold Spring Harbor Laboratory Press.
Murray, J. M. (2007). Practical aspects of quantitative confocal microscopy. Methods CellBiol. 81, 467-478.
Nagai, T., Ibata, K., Park, E. S., Kubota, M., Mikoshiba, K. and Miyawaki, A. (2002).A variant of yellow fluorescent protein with fast and efficient maturation for cell-biological applications. Nat. Biotechnol. 20, 87-90.
Nagamatsu, S. and Ohara-Imaizumi, M. (2008). Imaging exocytosis of single insulinsecretory granules with TIRF microscopy. Methods Mol. Biol. 440, 259-268.
Nalbant, P., Hodgson, L., Kraynov, V., Toutchkine, A. and Hahn, K. M. (2004).Activation of endogenous Cdc42 visualized in living cells. Science 305, 1615-1619.
Nayal, A., Webb, D. J., Brown, C. M., Schaefer, E. M., Vicente-Manzanares, M. andHorwitz, A. R. (2006). Paxillin phosphorylation at Ser273 localizes a GIT1-PIX-PAKcomplex and regulates adhesion and protrusion dynamics. J. Cell Biol. 173, 587-589.
Nguyen, A. W. and Daugherty, P. S. (2005). Evolutionary optimization of fluorescentproteins for intracellular FRET. Nat. Biotechnol. 23, 355-360.
Nordberg, J. J. and Sluder, G. (2007). Practical aspects of adjusting digital cameras.Methods Cell Biol. 81, 159-169.
North, A. J. (2006). Seeing is believing? A beginners’ guide to practical pitfalls in imageacquisition. J. Cell Biol. 172, 9-18.
Nyquist, H. (1928). Certain topics in telegraph transmission theory. Trans. AIEE 47, 617-644.
Oheim, M., Michael, D. J., Geisbauer, M., Madsen, D. and Chow, R. H. (2006). Principlesof two-photon excitation fluorescence microscopy and other nonlinear imagingapproaches. Adv. Drug Deliv. Rev. 58, 788-808.
Patterson, G. H. and Piston, D. W. (2000). Photobleaching in two-photon excitationmicroscopy. Biophys. J. 78, 2159-2162.
Patterson, G. H. and Lippincott-Schwartz, J. (2002). A photoactivatable GFP for selectivephotolabeling of proteins and cells. Science 297, 1873-1877.
Patterson, G., Day, R. N. and Piston, D. (2001). Fluorescent protein spectra. J. Cell Sci.114, 837-838.
Pattison, D. I. and Davies, M. J. (2006). Actions of ultraviolet light on cellular structures.EXS 131-157.
Pawley, J. (2006). Handbook of Biological Confocal Microscopy. New York: Springer.Pertz, O. and Hahn, K. M. (2004). Designing biosensors for Rho family proteins-
deciphering the dynamics of Rho family GTPase activation in living cells. J. Cell Sci.117, 1313-1318.
Piston, D. W. (2006). The coming of age of two-photon excitation imaging for intravitalmicroscopy. Adv. Drug Deliv. Rev. 58, 770-772.
Rizzo, M. A. and Piston, D. W. (2005). Fluorescent protein tracking and detection. InLive Cell Imaging: A Laboratory Manual (ed. R. D. Goldman and D. L. Spector), pp.3-23. Cold Spring Harbor, NY: Cold Spring Harbor Laboratory Press.
Rocheleau, J. V. and Piston, D. W. (2003). Two-photon excitation microscopy for thestudy of living cells and tissues. Curr. Protoc. Cell Biol. Chapter 4, Unit 4 11.
Schneckenburger, H. (2005). Total internal reflection fluorescence microscopy: technicalinnovations and novel applications. Curr. Opin. Biotechnol. 16, 13-18.
Schwille, P., Haupts, U., Maiti, S. and Webb, W. W. (1999). Molecular dynamics inliving cells observed by fluorescence correlation spectroscopy with one- and two-photonexcitation. Biophys. J. 77, 2251-2265.
Shaner, N. C., Steinbach, P. A. and Tsien, R. Y. (2005). A guide to choosing fluorescentproteins. Nat2 Methods 2, 905-909.
Shannon, C. E. (1949). Communication in the presence of noise. Proc. Inst. Radio Eng.37, 10-21.
Shaw, P. J. (2006). Comparison of widefield/deconvolution and confocal microscopy forthree-dimensional imaging. In Handbook of Biological Confocal Microscopy (ed. J.Pawley), pp. 453-467. New York: Springer.
Sheftel, A. D., Zhang, A. S., Brown, C., Shirihai, O. S. and Ponka, P. (2007). Directinterorganellar transfer of iron from endosome to mitochondrion. Blood 110, 125-132.
Simpson, J. C., Wellenreuther, R., Poustka, A., Pepperkok, R. and Wiemann, S. (2000).Systematic subcellular localization of novel proteins identified by large-scale cDNAsequencing. EMBO Rep. 1, 287-292.
Snapp, E. L., Altan, N. and Lippincott-Schwartz, J. (2003). Measuring protein mobilityby photobleaching GFP chimeras in living cells. Curr. Protoc. Cell Biol. Chapter 21,Unit 21 1.
Spring, K. R. (2007). Cameras for digital microscopy. Methods Cell Biol. 81, 171-186.Standish, B. (2008). High performance with fluorescence optical filters. BioOptics World
September/October, 35-37.Stark, D. A. and Kulesa, P. M. (2007). An in vivo comparison of photoactivatable
fluorescent proteins in an avian embryo model. Dev. Dyn. 236, 1583-1594.Suen, D. F., Norris, K. L. and Youle, R. J. (2008). Mitochondrial dynamics and apoptosis.
Genes Dev. 22, 1577-1590.Swedlow, J. R. (2007). Quantitative fluorescence microscopy and image deconvolution.
Methods Cell Biol. 81, 447-465.Toomre, D. and Pawley, J. B. (2006). Disk scanning confocal microscopy. In Handbook
of Biological Confocal Microscopy (ed. J. Pawley), pp. 221-238. New York: Springer.Trache, A. and Meininger, G. A. (2008). Total internal reflection fluorescence (TIRF)
microscopy. Curr. Protoc. Microbiol. Chapter 2, Unit 2A.2.1-2A.2.22.Tsien, R. Y. (2005). Building and breeding molecules to spy on cells and tumors. FEBS
Lett. 579, 927-932.
Journal of Cell Science 122 (6)
Jour
nal o
f Cel
l Sci
ence
767Live-cell microscopy
VanEngelenburg, S. B. and Palmer, A. E. (2008). Fluorescent biosensors of proteinfunction. Curr. Opin. Chem. Biol. 12, 60-65.
Wallace, W., Schaefer, L. H. and Swedlow, J. R. (2001). A workingperson’s guide todeconvolution in light microscopy. Biotechniques 31, 1076-1078; 1080; 1082;passim.
Wang, E., Babbey, C. M. and Dunn, K. W. (2005). Performance comparison betweenthe high-speed Yokogawa spinning disc confocal system and single-point scanningconfocal systems. J. Microsc. 218, 148-159.
Wang, Y., Shyy, J. Y. and Chien, S. (2008). Fluorescence proteins, live-cell imaging, andmechanobiology: seeing is believing. Annu. Rev. Biomed. Eng. 10, 1-38.
Webb, D. J., Parsons, J. T. and Horwitz, A. F. (2002). Adhesion assembly, disassemblyand turnover in migrating cells-over and over and over again. Nat. Cell Biol. 4, E97-E100.
Webb, D. J., Donais, K., Whitmore, L. A., Thomas, S. M., Turner, C. E., Parsons, J.T. and Horwitz, A. F. (2004). FAK-Src signalling through paxillin, ERK and MLCKregulates adhesion disassembly. Nat. Cell Biol. 6, 154-161.
Wiseman, P. W., Squier, J. A., Ellisman, M. H. and Wilson, K. R. (2000). Two-photonimage correlation spectroscopy and image cross-correlation spectroscopy. J. Microsc.200, 14-25.
Wiseman, P. W., Brown, C. M., Webb, D. J., Hebert, B., Johnson, N. L., Squier, J. A.,Ellisman, M. H. and Horwitz, A. F. (2004). Spatial mapping of integrin interactionsand dynamics during cell migration by image correlation microscopy. J. Cell Sci. 117,5521-5534.
Wolf, D. E. (2007). Fundamentals of fluorescence and fluorescence microscopy. MethodsCell Biol. 81, 63-91.
Wolf, D. E., Samarasekera, C. and Swedlow, J. R. (2007). Quantitative analysis of digitalmicroscope images. Methods Cell Biol. 81, 365-396.
Yamaguchi, H., Wyckoff, J. and Condeelis, J. (2005). Cell migration in tumors. Curr.Opin. Cell Biol. 17, 559-564.
Zacharias, D. A., Violin, J. D., Newton, A. C. and Tsien, R. Y. (2002). Partitioning oflipid-modified monomeric GFPs into membrane microdomains of live cells. Science296, 913-916.
Jour
nal o
f Cel
l Sci
ence