Little Shop of Performance Horrors - Brendan Gregg · USE IMPROVE EVANGELIZE Little Shop of...
34
USE IMPROVE EVANGELIZE Little Shop of Performance Horrors Brendan Gregg Staff Engineer Sun Microsystems, Fishworks FROSUG 2009
Transcript of Little Shop of Performance Horrors - Brendan Gregg · USE IMPROVE EVANGELIZE Little Shop of...

USE IMPROVE EVANGELIZE
Little Shop of Performance HorrorsBrendan GreggStaff EngineerSun Microsystems, Fishworks
FROSUG 2009

2
USE IMPROVE EVANGELIZE
Performance Horrors● I usually give talks on:
– how to perform perf analysis!
– cool performance technologies!!
– awesome benchmark results!!!
in other words, things going right.● This talk is about things going wrong:
– performance horrors
– learning from mistakes
3
USE IMPROVE EVANGELIZE
Horrific Topics● The worst perf issues I've ever seen!● Common misconfigurations● The encyclopedia of poor assumptions● Unbelievably bad perf analysis● Death by complexity● Bad benchmarking● Misleading analysis tools● Insane performance tuning● The curse of the unexpected

4
USE IMPROVE EVANGELIZE
The worst perf issuesI've ever seen!

5
USE IMPROVE EVANGELIZE
The worst perf issues I've ever seen!● SMC
– Administration GUI for Solaris
– Could take 30 mins to load on first boot
6
USE IMPROVE EVANGELIZE
The worst perf issues I've ever seen!● SMC
– Administration GUI for Solaris
– Could take 30 mins to load on first boot
● Problems:– 12 Million mostly 1 byte sequential read()s of
/var/sadm/smc/properties/registry.ser, a 72 KB file
– 7742 processes executed
– 9504 disk events, 2228 of them writes to the 72Kb registry.ser file.
● Happy ending – performance was improved in an update

7
USE IMPROVE EVANGELIZE
The worst perf issues I've ever seen!● SMC (cont.)● Analysis using DTrace:
– syscall frequency counts
– syscall args
This is “low hanging fruit” for DTrace● Lesson: examine high level events.● Happy ending – performance was improved in an update
8
USE IMPROVE EVANGELIZE
The worst perf issues I've ever seen!● nxge
– 10 GbE network driver
– tested during product development

9
USE IMPROVE EVANGELIZE
The worst perf issues I've ever seen!● nxge (cont.)
– 10 GbE network driver
– tested during product development
● Problems:– kstats were wrong (rbytes, obytes)
this made perf tuning very difficult until I realized what was wrong!
– CR: 6687884 nxge rbytes and obytes kstat are wrong
● Lessons:– don't trust statistics you haven't double checked

10
USE IMPROVE EVANGELIZE
The worst perf issues I've ever seen!● nxge (cont.)
– 10 GbE network driver
– tested during product development
● Problems (#2):– memory leak starving the ZFS ARC
– The kernel grew to 122 Gbytes in 2 hours.
– 6844118 memory leak in nxge with LSO enabled
– Original CR title: “17 MB/s kernel memory leak...”
● Lessons:– Bad memory leaks can happen in the kernel too

11
USE IMPROVE EVANGELIZE
The worst perf issues I've ever seen!● nxge (cont.)
– 10 GbE network driver
– tested during product development
● Problems (#3):– LSO (large send offload) destroyed performance:
Priority changed from [3-Medium] to [1-Very High]
This is a 1000x performance regression.
[email protected] 2008-05-01 23:25:58 GMT
– 6696705 enabling soft-lso with fix for 6663925 causes nxge to perform very very poorly
● Lessons:– All configurable options must be tested and retested during
development for regressions (such as LSO)

12
USE IMPROVE EVANGELIZE
CommonMisconfigurations

13
USE IMPROVE EVANGELIZE
Common misconfigurations● ZFS RAID-Z2 with half a JBOD
– half a JBOD may mean 12 disks. A RAID-Z2 stripe may be 12 disks in width, therefore this configuration acts like a single disk:
perf is that of the slowest disk in the stripe with so few stripes (1), a multi-threaded workload is much
more likely to scale
● Max throughput config without:– jumbo frames
– 10 GbE ports (they do work!)
● sync write workloads without ZFS SLOG devices

14
USE IMPROVE EVANGELIZE
Common misconfigurations● Not running the latest software bits
– perf issues are fixed often; always try to be on the latest software versions
● 4 x 1 GbE trunks, and < 4 clients– they won't map to all ports

15
USE IMPROVE EVANGELIZE
The Encyclopedia ofPoor Assumptions
16
USE IMPROVE EVANGELIZE
The Encyclopedia of Poor Assumptions● More CPUs == more performance
– not if the threads don't scale
● Faster CPUs == more performance– not if your workload is memory I/O bound
● More IOPS capability == more performance– slower IOPS? Imagine a server with thousands of
slow disks
● Network throughput/IOPS measured on the client reflects that of the server
– client caching?

17
USE IMPROVE EVANGELIZE
The Encyclopedia of Poor Assumptions● System busses are fast
– The AMD HyperTransport was the #1 bottleneck for the Sun Storage products
● 10 GbE can be driven by 1 client– may be true in the future, but difficult to do now
– may assume that this can be done with 1 thread!
● Performance observability tools are designed to be the best possible
● Performance observability statistics (or benchmark tools) are correct
– bugs happen!

18
USE IMPROVE EVANGELIZE
The Encyclopedia of Poor Assumptions● A network switch can drive all its ports to
top speed at the same time– especially may not be true for 10 GbE switchs
● PCI-E slots are equal– test, don't assume; depends on bus architecture
● Add flash memory SSDs to improve performance!
– Probably, but really depends on the workload
– This is assuming that HDDs are slow; they usually are, however their streaming performance can be competitive (~100 Mbytes/sec)

19
USE IMPROVE EVANGELIZE
Unbelievably BadPerformance Analysis

20
USE IMPROVE EVANGELIZE
Unbelievably bad perf analysis● The Magic 1 GbE NIC!● How fast can a 1 GbE NIC run in one
direction?

21
USE IMPROVE EVANGELIZE
Unbelievably bad perf analysis● The Magic 1 GbE NIC!● How fast can a 1 GbE NIC run in one
direction?● Results sent to me include:
– 120 Mbytes/sec
– 200 Mbytes/sec
– 350 Mbytes/sec
– 800 Mbytes/sec
– 1.15 Gbytes/sec
● Lesson: perform sanity checks

22
USE IMPROVE EVANGELIZE
Death byComplexity!

23
USE IMPROVE EVANGELIZE
Death by complexity!● Performance isn't that hard, however it
often isn't that easy either...● TCP/IP stack performance analysis
– heavy use of function pointers
● ZFS performance analysis– I/O processed asynchorously by the ZIO pipeline

24
USE IMPROVE EVANGELIZE
Bad Benchmarking

25
USE IMPROVE EVANGELIZE
Bad benchmarking● SPEC-SFS
– http://blogs.sun.com/bmc/entry/eulogy_for_a_benchmark
● cp– Copying a file from a local filesystem to an NFS
share, to performance test that NFS share
● various opensource benchmark tools that don't reflect your intended workload
● Lesson: don't run benchmark tools blindly; learn everything you can about what they do, and how close they match your environment

26
USE IMPROVE EVANGELIZE
MisleadingAnalysis Tools

27
USE IMPROVE EVANGELIZE
Misleading analysis tools● top
load averages: 0.03, 0.03, 0.03 17:05:29
236 processes: 233 sleeping, 2 stopped, 1 on cpu
CPU states: 97.7% idle, 0.8% user, 1.6% kernel, 0.0% iowait, 0.0% swap
Memory: 8191M real, 479M free, 1232M swap in use, 10G swap free
PID USERNAME LWP PRI NICE SIZE RES STATE TIME CPU COMMAND
101092 brendan 1 49 0 93M 25M sleep 187:42 0.28% realplay.bin
100297 root 26 100 -20 182M 177M sleep 58:13 0.14% akd
399362 brendan 1 49 0 95M 28M sleep 53:56 0.12% realplay.bin
115306 root 1 59 0 0K 0K sleep 21:30 0.06% dtrace
100876 brendan 1 59 0 0K 0K sleep 103:52 0.05% Xorg
– What does %CPU mean? Are they all CPU consumers?
– What does RSS mean?
28
USE IMPROVE EVANGELIZE
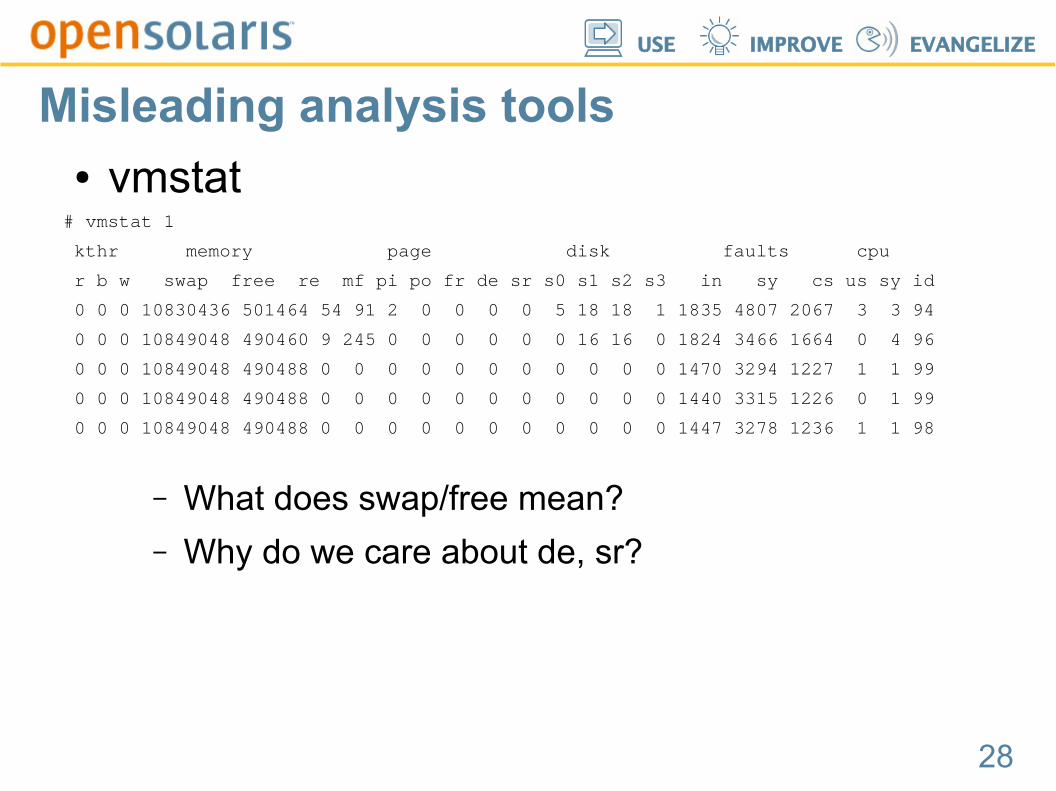
Misleading analysis tools● vmstat
# vmstat 1
kthr memory page disk faults cpu
r b w swap free re mf pi po fr de sr s0 s1 s2 s3 in sy cs us sy id
0 0 0 10830436 501464 54 91 2 0 0 0 0 5 18 18 1 1835 4807 2067 3 3 94
0 0 0 10849048 490460 9 245 0 0 0 0 0 0 16 16 0 1824 3466 1664 0 4 96
0 0 0 10849048 490488 0 0 0 0 0 0 0 0 0 0 0 1470 3294 1227 1 1 99
0 0 0 10849048 490488 0 0 0 0 0 0 0 0 0 0 0 1440 3315 1226 0 1 99
0 0 0 10849048 490488 0 0 0 0 0 0 0 0 0 0 0 1447 3278 1236 1 1 98
– What does swap/free mean?
– Why do we care about de, sr?
29
USE IMPROVE EVANGELIZE
InsanePerformance Tuning
30
USE IMPROVE EVANGELIZE
Insane performance tuning● disabling CPUs
– turning off half the available CPUs can improve performance (relieving scaleability issues)
● binding network ports to fewer cores– improves L1/L2 CPU cache hit rate
– reduces cache coherency traffic
● reducing CPU clock rate– if the workload is memory bound, this may have little
effect, but save heat, fan, vibration issues...
31
USE IMPROVE EVANGELIZE
Insane performance tuning● less memory
– systems with 256+ Gbytes of DRAM – codepaths that walk DRAM
● warming up the kmem caches– before benchmarking, a freshly booted server won't
have its kmem caches populated. Warming them up with any data can improve performance by 15% or so.

32
USE IMPROVE EVANGELIZE
The Curse of theUnexpected

33
USE IMPROVE EVANGELIZE
The Curse of the Unexpected● A switch has 2 x 10 GbE ports, and 40 x 1
GbE ports. How fast can it drive Ethernet?– Unexpected: some cap at 11 Gbit/sec total!
● Latency– Heat map discoveries
– DEMO (http://blogs.sun.com/brendan)

USE IMPROVE EVANGELIZE
Thank you!
Brendan GreggStaff Engineer
[email protected]://blogs.sun.com/brendan
“open” artwork and icons by chandan: http://blogs.sun.com/chandan