Little Blue Book - Rightmove Hub
74
Little Blue Book 2018/19
Transcript of Little Blue Book - Rightmove Hub

LittleBlue Book
2018/19
ContentsIntroduction
Sales
New Listings
Asking Prices
Spotting motivated sellersJosh Phegan
Mortgage Approvals
Sales Agreed
Fall Through Rates
Transactions
Industry View: Resale Market
Agents don’t plan to fail but often fail to plan Michael Day
Lettings
Available Stock
Regional Rents
Industry View: Growth of Glasgow
3
4
5
6
8
10
12
13
14
15
16
18
19
20
21
22
24
26
28
29
30
31
32
33
34
36
38
40
40
How banning tenant fees will affect agents David Cox
Rightmove Passport: making renting right
How to recruit with a vision Matt Giggs
New Homes
New Build Starts & Completions
Industry View: 2019 outlook
Build to Rent
Industry View: Building to Rent
Industry View: Supply of New Homes
Winter
Spring
Summer
Autumn
Local Data
Planning For Each Season

Welcome to Rightmove’s Little Blue Book for 2018, full of market insights and some thoughts on planning for each season of the year ahead.
When looking back on the 2018 market you can see a series of sub plots that have played out alongside the political uncertainty. These have included continuing readjustment in London with evidence this is spreading to the South, a more buoyant market as you go further north and a drop in buy to let activity leading to a lack of rental stock. Yet despite all of this, sales activity and prices at a national level are holding pretty steady compared to 2017.
There are some slower markets in the south where buyer affordability has been seriously stretched, leading to a very price sensitive market. As you move further afield the landscape is comparatively stronger with significant uplifts in activity in parts of Scotland and Wales such as Edinburgh and Newport.
The annual rate of price increase remains subdued for a second consecutive year, a result of national asking prices now being over 30% higher than they were back in 2010.
So what does 2019 look like for your business?
Underlying demand is a positive, though choosier buyers will be looking for the right
property at the right price. Setting realistic expectations with vendors from the outset will be key.
The many changes in the buy-to-let sector mean that landlords will need nurturing in the months to come, not least with the upcoming ban on tenant fees.
The skills of estate and lettings agents will be greatly appreciated by sellers, buyers, landlords and tenants, to help them navigate through the maze of political uncertainty and whatever Brexit has in store for us.
Forward planning, research and sound advice is what this year’s Little Blue Book is about. We take a look at the latest market insights, offer some tips on how you could prepare for each season, and we provide some wisdom from your peers.
Good luck for your year ahead, plan well and prosper.
Best wishes,
Miles.
Introduction
3

4
Sales
4
5
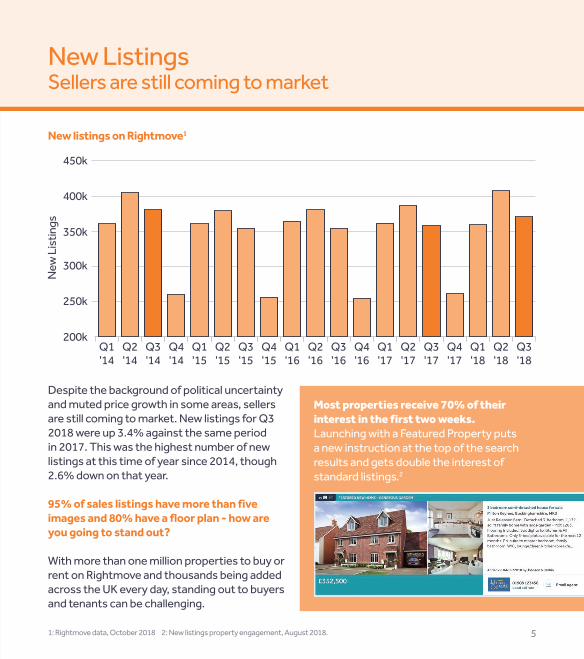
Despite the background of political uncertainty and muted price growth in some areas, sellers are still coming to market. New listings for Q3 2018 were up 3.4% against the same period in 2017. This was the highest number of new listings at this time of year since 2014, though 2.6% down on that year.
95% of sales listings have more than five images and 80% have a floor plan - how are you going to stand out?
With more than one million properties to buy or rent on Rightmove and thousands being added across the UK every day, standing out to buyers and tenants can be challenging.
Sellers are still coming to marketNew Listings
New listings on Rightmove1
450k
Q1'14
Q1'16
Q1'15
Q1'17
Q3'14
Q3'16
Q3'15
Q3'17
Q2'18
Q2'14
Q2'16
Q2'15
Q2'17
Q1'18
Q4'14
Q4'16
Q4'15
Q4'17
Q3'18
300k
New
List
ings
400k
250k
350k
200k
1: Rightmove data, October 2018 2: New listings property engagement, August 2018.
Most properties receive 70% of their interest in the first two weeks. Launching with a Featured Property puts a new instruction at the top of the search results and gets double the interest of standard listings.2
6
Asking Prices
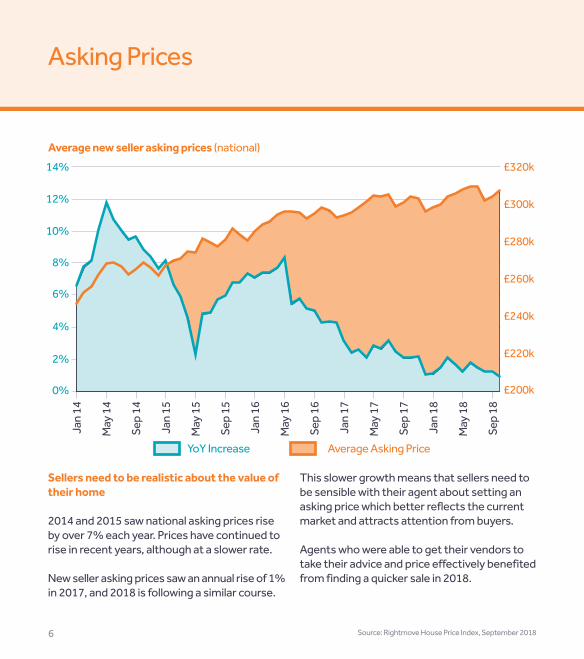
Sellers need to be realistic about the value of their home
2014 and 2015 saw national asking prices rise by over 7% each year. Prices have continued to rise in recent years, although at a slower rate.
New seller asking prices saw an annual rise of 1% in 2017, and 2018 is following a similar course.
This slower growth means that sellers need to be sensible with their agent about setting an asking price which better reflects the current market and attracts attention from buyers.
Agents who were able to get their vendors to take their advice and price effectively benefited from finding a quicker sale in 2018.
£320k14%
12%
10%
8%
6%
4%
2%
0%
£280k
£240k
£200k
Jan
14
Jan
16
Jan
15
Jan
17
Jan
18
Sep
14
Sep
16
Sep
15
Sep
17
Sep
18
May
14
May
16
May
15
May
17
May
18
£300k
£260k
£220k
Average Asking PriceYoY Increase
Source: Rightmove House Price Index, September 2018
Average new seller asking prices (national)
7
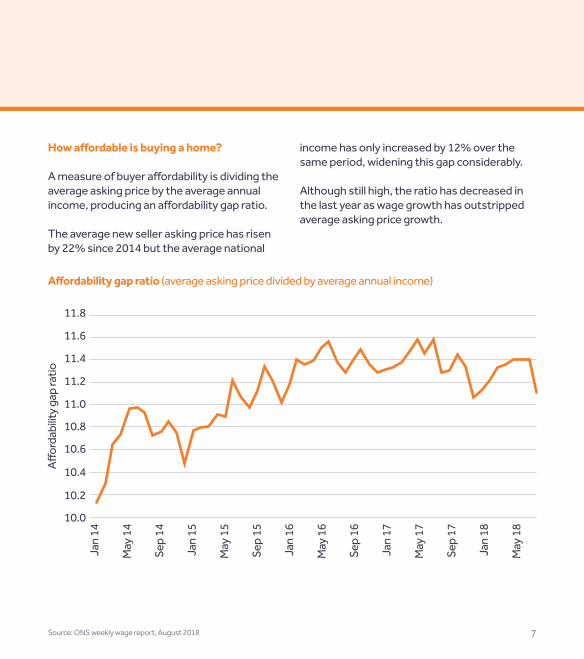
How affordable is buying a home?
A measure of buyer affordability is dividing the average asking price by the average annual income, producing an affordability gap ratio. The average new seller asking price has risen by 22% since 2014 but the average national
income has only increased by 12% over the same period, widening this gap considerably. Although still high, the ratio has decreased in the last year as wage growth has outstripped average asking price growth.
11.4
11.8
11.2
11.6
11.0
10.8
10.6
10.4
10.2
10.0
Jan
14
Jan
16
Jan
15
Jan
17
Jan
18
Sep
14
Sep
16
Sep
15
Sep
17
May
14
May
16
May
15
May
17
May
18
Source: ONS weekly wage report, August 2018
Affordability gap ratio (average asking price divided by average annual income)
Affor
dabi
lity g
ap ra
tio

8
The most important thing for an estate agent is to get clear on the job they're doing for their customer.
In the same way that you don’t walk into a car dealership when you’re happy with your car, a buyer doesn’t enquire about or view a property if they are satisfied with their living arrangements.
A great estate agent realises that they are a facilitator of change. The customer must have clear dissatisfaction and a vision for what it would look like fixed.
Five quick questions to cut to the chase:
1. What's the one thing you hate the most about your current home?
2. What are you looking for in your next home that you don't have in your current one?
3. What else can you tell me?4. What would it look like fixed?5. How soon before you'd like it fixed?
When you go deeper into these questions with a client, you’ll soon work out their real motivation.
When the market changes it's critical to remember the problem you're solving for your
customer. No one wants to list their home; they want to get it sold or let. Your job is to make that happen.
Ultimately, in every transaction you’re walking into one of ten scenarios:
1. Bereavement2. Divorce3. Growing family4. Job relocation5. Investor6. Developer7. Life change8. Downsizing9. Aspirational10. Bankruptcy
Spotting motivated sellers: Why you need more dissatisfied customers
9
With each situation, there's a driver of urgency, a possible solution and steps that need to be made. If you want to own the market, you need to know what to do to progress each customer.
In the modern world, we can press a button, and an Uber turns up, press another button and dinner turns up. If the modern consumer could press a button and not live where they live now and live where they want to, without having to go through the sale or let process, I’m sure they would.
Estate agents who make this process easier for their customers are the ones who will prosper in the future.
@joshphegan
Josh PheganReal Estate Trainer
Here are the three questions you need to answer:
1. What is the problem the customer's trying to solve?
2. What are the other underlying problems?3. How does the customer describe the solution?
Strip back the customer journey and learn where you can add value. The age-old maxims remain the same; one customer served well leads you to your next customer. If your service is good enough, if you get the job done, you'll never have to prospect again.
10
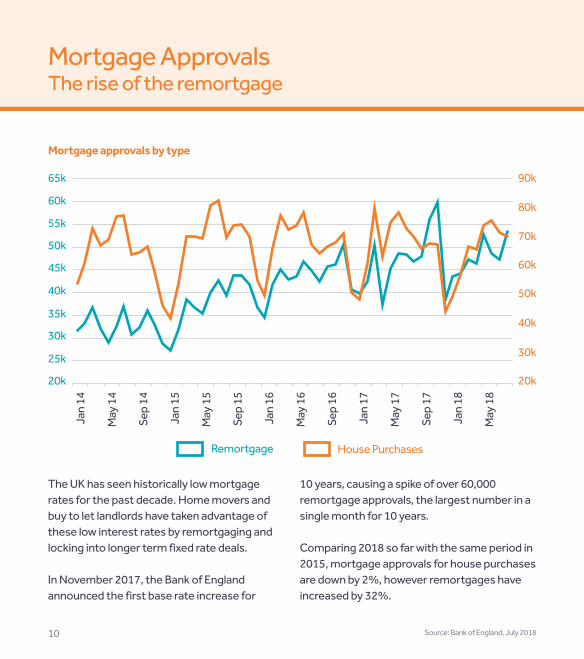
Mortgage ApprovalsThe rise of the remortgage
The UK has seen historically low mortgage rates for the past decade. Home movers and buy to let landlords have taken advantage of these low interest rates by remortgaging and locking into longer term fixed rate deals. In November 2017, the Bank of England announced the first base rate increase for
10 years, causing a spike of over 60,000 remortgage approvals, the largest number in a single month for 10 years. Comparing 2018 so far with the same period in 2015, mortgage approvals for house purchases are down by 2%, however remortgages have increased by 32%.
Source: Bank of England, July 2018
Mortgage approvals by type
House PurchasesRemortgage
65k 90k
60k 80k55k
70k50k
60k45k
50k40k
40k30k
20k
35k
30k25k
20k
Jan
14
Jan
16
Jan
15
Jan
17
Jan
18
Sep
14
Sep
16
Sep
15
Sep
17
May
14
May
16
May
15
May
17
May
18
11Source: Council for Mortgage Lenders/UK Finance, July 2018
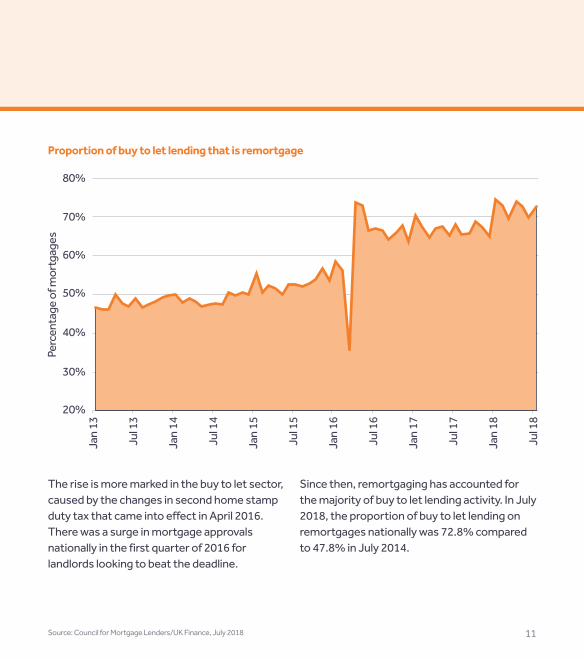
Proportion of buy to let lending that is remortgage
80%
70%
60%
50%
40%
20%
30%
Jan
13
Jan
16
Jul 1
4
Jul 1
7
Jan
14
Jan
17
Jul 1
5
Jul 1
8
Jul 1
3
Jul 1
6
Jan
15
Jan
18
Perc
enta
ge o
f mor
tgag
es
The rise is more marked in the buy to let sector, caused by the changes in second home stamp duty tax that came into effect in April 2016. There was a surge in mortgage approvals nationally in the first quarter of 2016 for landlords looking to beat the deadline.
Since then, remortgaging has accounted for the majority of buy to let lending activity. In July 2018, the proportion of buy to let lending on remortgages nationally was 72.8% compared to 47.8% in July 2014.
12
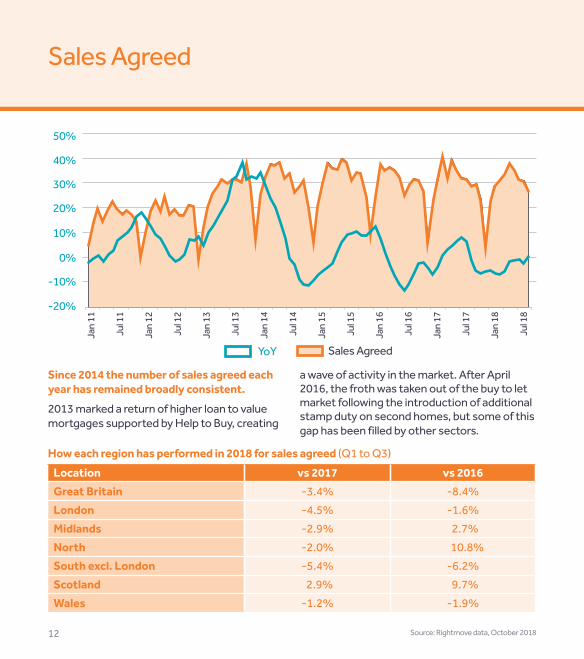
Location vs 2017 vs 2016Great Britain -3.4% -8.4%London -4.5% -1.6%Midlands -2.9% 2.7%North -2.0% 10.8%South excl. London -5.4% -6.2%Scotland 2.9% 9.7%Wales -1.2% -1.9%
Sales Agreed
Since 2014 the number of sales agreed each year has remained broadly consistent.2013 marked a return of higher loan to value mortgages supported by Help to Buy, creating
a wave of activity in the market. After April 2016, the froth was taken out of the buy to let market following the introduction of additional stamp duty on second homes, but some of this gap has been filled by other sectors.
How each region has performed in 2018 for sales agreed (Q1 to Q3)
Source: Rightmove data, October 2018
Jan
11
Jan
14
Jul 1
2
Jul 1
5
Jul 1
7
Jan
12
Jan
15
Jan
17
Jul 1
3
Jul 1
6
Jul 1
8
Jul 1
1
Jul 1
4
Jan
13
Jan
16
Jan
18
50%
40%
30%
20%
10%
-10%
-20%
0%
YoY Sales Agreed
13
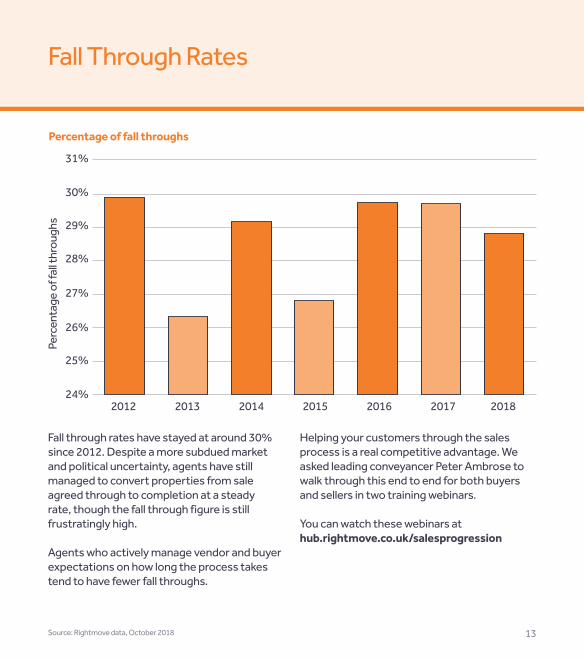
Fall through rates have stayed at around 30% since 2012. Despite a more subdued market and political uncertainty, agents have still managed to convert properties from sale agreed through to completion at a steady rate, though the fall through figure is still frustratingly high.
Agents who actively manage vendor and buyer expectations on how long the process takes tend to have fewer fall throughs.
Fall Through Rates
Helping your customers through the sales process is a real competitive advantage. We asked leading conveyancer Peter Ambrose to walk through this end to end for both buyers and sellers in two training webinars.
You can watch these webinars athub.rightmove.co.uk/salesprogression
Percentage of fall throughs
Source: Rightmove data, October 2018
31%
30%
29%
28%
27%
25%
24%
26%
2012 2014 20162013 2015 2017 2018
Perc
enta
ge o
f fal
l thr
ough
s
14
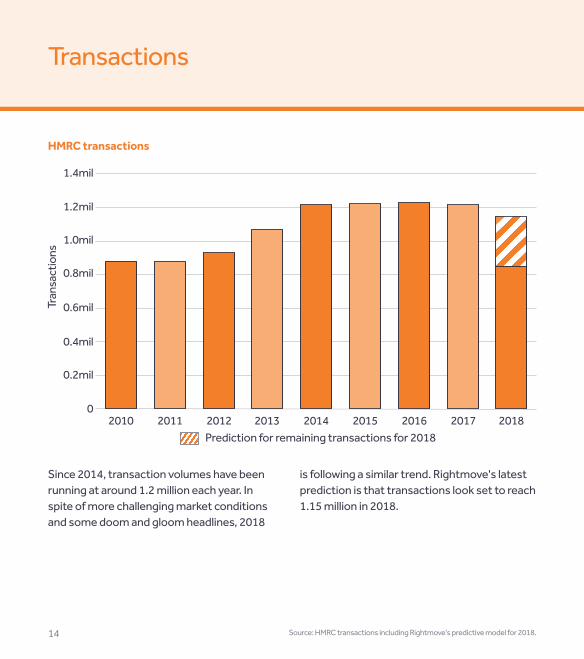
HMRC transactions
Transactions
Source: HMRC transactions including Rightmove's predictive model for 2018.
Since 2014, transaction volumes have been running at around 1.2 million each year. In spite of more challenging market conditions and some doom and gloom headlines, 2018
is following a similar trend. Rightmove's latest prediction is that transactions look set to reach 1.15 million in 2018.
Prediction for remaining transactions for 2018
1.4mil
1.2mil
1.0mil
0.8mil
0.6mil
0.2mil
0
0.4mil
2010 2012 2014 20172011 2013 2015 20182016
Tran
sact
ions

15
Martin TaylorDirector - Taylor Hill and Bond, Hampshire
"Brexit is creating overarching sentiment of uncertainty and I believe this is surrounding both buyers and sellers. I think a lot of people are holding back and the majority of the market activity is from people who ‘must move’ rather than ‘might move’.
Agents would be wise to focus their efforts towards people who must move, understand their sellers’ motivations and tailor their service to that need."
Nathan James Reeks Owner - Nathan James Estate Agents, Monmouthshire
"2018 has been the best year on record for our area. We’ve seen a market rise of nearly 150% compared to last year on sales with pricing not slowing.
On most occasions, houses have increased from an average of £140,000 for a three-bed semi to now touching the £230,000 mark.
With the confirmation of the Severn Bridges becoming free from December 2018, this will only instil another price rise moving into 2019, putting us firmly in line with the Bristol market.
Stock levels have started to rise in the last quarter of 2018. This has led to a lack of first time buyers being able to afford to buy property locally, allowing some stock to stay on the market."
There are differing markets across the UK… We asked two agents for their views on how their markets have performed in 2018.
Industry View: Resale Market

16
A good business plan sets out the vision and the objectives of the business and should be shared with the whole team.
I often use the analogy of the jigsaw puzzle. If I give you a 1,000-piece puzzle but don’t show you the picture on the box, it will be much harder for you to achieve. Your team hold many of the pieces – a good plan helps people see where all the pieces should go.
Well-visualised objectives for a business plan follow the SMART rule. They are specific, measurable, achievable, relevant and timed. If any objective you set fails to satisfy the SMART rule – revisit and rewrite.
Keep it simpleWriting a business plan isn’t about writing a book. It’s about having a clear plan in place, sharing it with your team and reviewing it regularly.
Know your numbersYou should know every key performance indicator (KPI) in your business. You should also know every financial element of your business – revenue lines and cost lines
– these should be kept under constant review as it is productivity and profitability that determines a good business, not just transaction numbers and revenues.
Keep an eye on the competitionI believe you should know everything about your competition. Understand their strengths, their unique selling points and their weaknesses. Look into their pricing strategy, their marketing, how do they position themselves in their advertising?
Reviewing the competition isn’t about rubbishing them, it’s about understanding why you would instruct them to sell or let your house.
When you understand who you are competing with, you’ll start to produce more effective marketing. Perhaps they are missing a trick or two, which you can benefit from, or you could discover a new, clever way of doing things.
Agents don’t plan to fail but often fail to plan
17
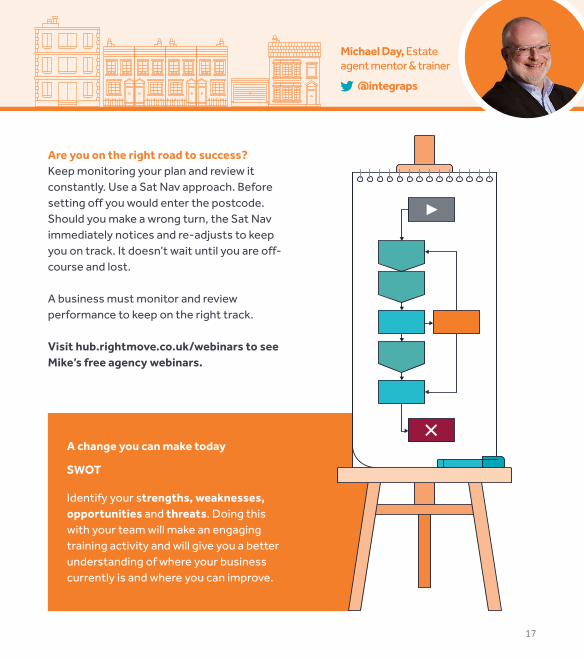
Are you on the right road to success?Keep monitoring your plan and review it constantly. Use a Sat Nav approach. Before setting off you would enter the postcode. Should you make a wrong turn, the Sat Nav immediately notices and re-adjusts to keep you on track. It doesn’t wait until you are off-course and lost.
A business must monitor and review performance to keep on the right track.
Visit hub.rightmove.co.uk/webinars to see Mike’s free agency webinars.
Michael Day, Estate agent mentor & trainer
@integraps
A change you can make today
SWOT
Identify your strengths, weaknesses, opportunities and threats. Doing this with your team will make an engaging training activity and will give you a better understanding of where your business currently is and where you can improve.

18
Lettings
44
18
19
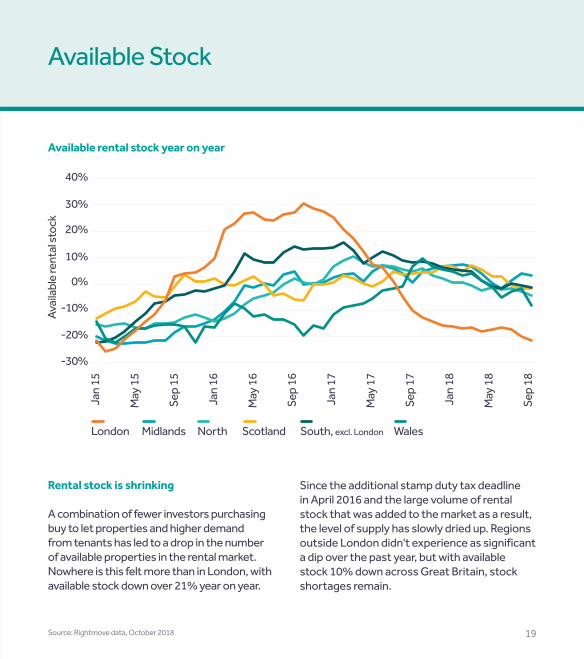
Rental stock is shrinking
A combination of fewer investors purchasing buy to let properties and higher demand from tenants has led to a drop in the number of available properties in the rental market. Nowhere is this felt more than in London, with available stock down over 21% year on year.
Available Stock
Since the additional stamp duty tax deadline in April 2016 and the large volume of rental stock that was added to the market as a result, the level of supply has slowly dried up. Regions outside London didn't experience as significant a dip over the past year, but with available stock 10% down across Great Britain, stock shortages remain.
20%
0%
-10%
10%
-20%
-30%
London NorthMidlands Scotland WalesSouth, excl. London
30%
40%
Jan
15
Jan
17
Jan
16
Jan
18
May
15
May
17
May
16
May
18
Sep
15
Sep
17
Sep
16
Sep
18
Available rental stock year on year
Source: Rightmove data, October 2018
Avai
labl
e re
ntal
stoc
k
20
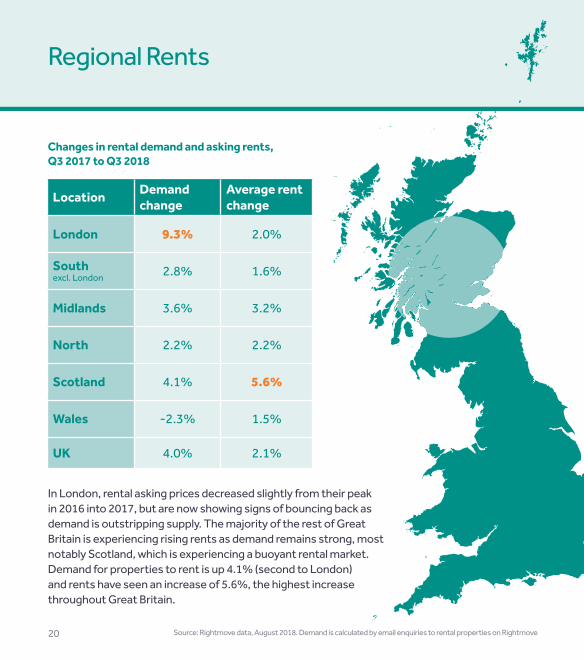
In London, rental asking prices decreased slightly from their peak in 2016 into 2017, but are now showing signs of bouncing back as demand is outstripping supply. The majority of the rest of Great Britain is experiencing rising rents as demand remains strong, most notably Scotland, which is experiencing a buoyant rental market. Demand for properties to rent is up 4.1% (second to London) and rents have seen an increase of 5.6%, the highest increase throughout Great Britain.
Regional Rents
Location Demand change
Average rent change
London 9.3% 2.0%
Southexcl. London 2.8% 1.6%
Midlands 3.6% 3.2%
North 2.2% 2.2%
Scotland 4.1% 5.6%
Wales -2.3% 1.5%
UK 4.0% 2.1%
Source: Rightmove data, August 2018. Demand is calculated by email enquiries to rental properties on Rightmove
Changes in rental demand and asking rents, Q3 2017 to Q3 2018

21
Sally Beard Co-Director - Fineholm, Glasgow
"Glasgow’s rental market is booming. Great news if you are a landlord, but if you are a student looking for a two bedroom flat close to university to share with a friend you probably need to up your budget this year.
This is due to restricted supply created by significantly fewer buy-to-let mortgages being approved. Areas which traditionally offered value accommodation for sharers have seen rents rise significantly. G51 postcode (Kinning Park, Cessnock, Ibrox) which would have been on average £550 per calendar month (pcm) for a two bedroom flat are now £600pcm or £650pcm. In the more sought after Westend areas, even a basic two bedroom is achieving rents of £800pcm and the time to let these properties is very short, with multiple applicants for every property. In short, investors should be looking north of the border. Purchase prices at sub-£100k and yields of 8% make it an attractive proposition."
Industry View: Growth of Glasgow
22
Back in 2016 the government announced a ban on tenant fees in England and Wales in their Autumn Statement.
Around 60% of rental stock is managed by letting agents, and banning fees could completely alter how agencies operate. Our advice is to prepare as soon as possible.
We now have greater certainty on what the ban on fees will involve. In England, the Tenant Fees Bill is progressing through Parliament and the Renting Homes (Fees etc.) (Wales) Bill has also begun its journey through the Welsh Assembly.
How banning tenant fees will affect agents
We’ve been working with the UK government and have been able to gain clarity on Schedule 1 of the Tenant Fees Bill, which fully sets out what can and can’t be charged when the ban comes into force.
What can be charged?• Rent• Holding deposit (maximum one week’s rent)• Tenancy deposit (maximum six week’s rent)• Default payments• Variation of tenancy (£50 cap, or reasonable costs incurred if higher)• Termination of tenancy• Utilities; Communication services; Council Tax; Green Deal; Television licence
23
@arla_uk
David Cox, Chief Executive, ARLA Propertymark
Watch David's latest updates for agents in his regular Rightmove webinars.Visit hub.rightmove.co.uk
What can’t be charged for?If it’s not included in Schedule 1 of the Act, tenants can’t be charged for it.
We want to remind agents that whilst the ban has not yet passed, any fees they currently charge are lawful. This is providing that they are clearly displaying them prominently in their branches and on their website.
You can find more information by visiting the ARLA Propertymark website where members can download a toolkit and fact sheets explaining the proposed legislation in England and Wales.
24
It’s not getting any more straight forward either as more legislation is being brought into the letting industry. Handling the admin is time consuming, repetitive and the introduction of a tenant fee ban will mean this must be done without charging the tenant.
The Rightmove Passport will make renting easier for agents and tenants
The Rightmove Passport will offer a new way of working which will speed up the process of renting a property. It’s an online profile for renters, which gathers all the information a tenant needs to rent a property up front, created just once, and then shared by the tenant with any agent.
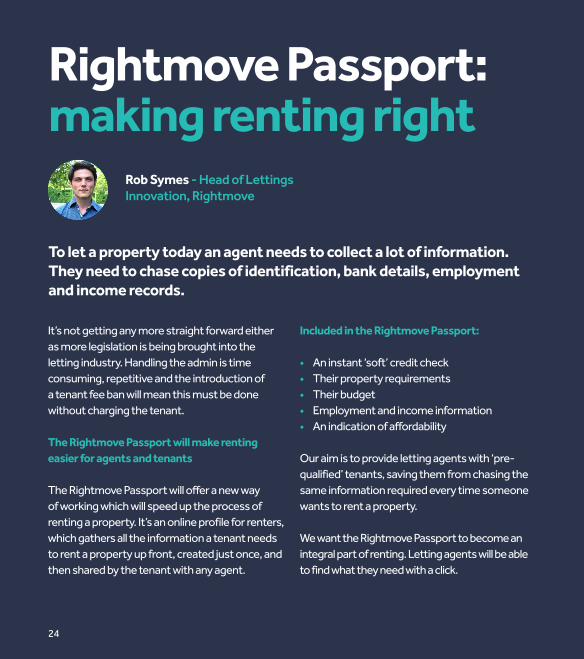
Rob Symes - Head of Lettings Innovation, Rightmove
To let a property today an agent needs to collect a lot of information. They need to chase copies of identification, bank details, employment and income records.
Included in the Rightmove Passport:
• An instant ‘soft’ credit check• Their property requirements• Their budget• Employment and income information• An indication of affordability Our aim is to provide letting agents with ‘pre-qualified’ tenants, saving them from chasing the same information required every time someone wants to rent a property.
We want the Rightmove Passport to become an integral part of renting. Letting agents will be able to find what they need with a click.
Rightmove Passport: making renting right
24
25
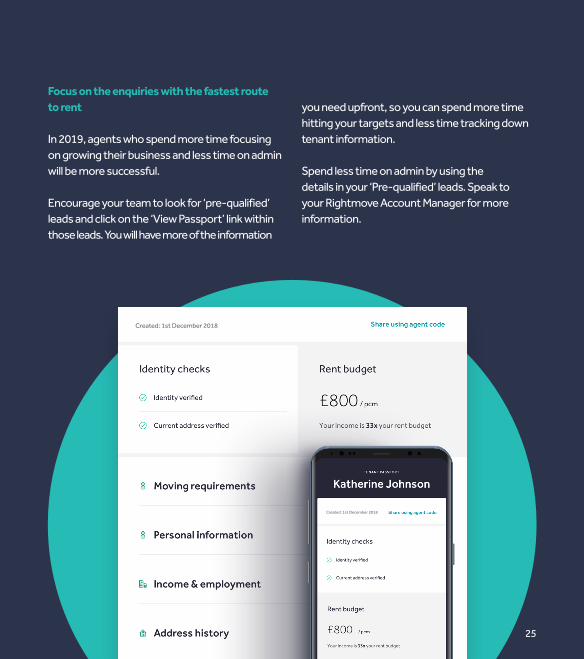
Focus on the enquiries with the fastest route to rent
In 2019, agents who spend more time focusing on growing their business and less time on admin will be more successful.
Encourage your team to look for ‘pre-qualified’ leads and click on the ‘View Passport’ link within those leads. You will have more of the information
you need upfront, so you can spend more time hitting your targets and less time tracking down tenant information.
Spend less time on admin by using the details in your ‘Pre-qualified’ leads. Speak to your Rightmove Account Manager for more information.
25
Created: 1st December 2018
Created: 1st December 2018

26
After 23 years in the property industry, I can say with absolute certainty that great agencies are being ripped apart by fear.
This is affecting both independents and large corporates, who are on the back foot rather than playing to their strengths. They aren’t allowing their talent to flourish and focus on what can influence their organisation.
Why is this happening? There’s too much focus on the competition, their local market and the never-ending compliance responsibilities, rather than focusing on their business.
New gimmicks, supposed game changers and social media quick fixes are bamboozling agents. Distracting them from investing more time in training and mentorship.
If this sounds familiar, stop and ask yourself, what are you going to do differently in 2019?
I know from personal experience that focussing on external issues and ignoring the internal challenges won’t grow your business.
Creating an amazing organisation filled with the best people will require a clear vision. I’ve created three simplified steps to help you find the right people and build both them and your business in 2019.
1. Reality checkAssess the talent you already have, their skills and their position in your organisation today. Play to their strengths and get them into their flow. Promoting good people out of sales roles into leadership is like moving your star striker to football club manager. Just because they can hit targets doesn’t mean they can inspire a team.
Detail-orientated and cautious personalities in your admin team are just as important to business growth as the sales team. Make it your mission to find the right place for each skill set.
2. Attracting talentStop hiring on experience. I would take someone with drive and desire over experience every day. I can teach them what they don’t know, I won’t need to train them to be a winner.
How to recruit with a vision

27
Can you sum up your company’s culture in one sentence? If you can’t then ask your team or your clients. Ask your team questions like "Why did you join the company?" or "What are we aiming to become?".
Once you know the answers to those questions, it makes it easier to find the right personalities.
@GiggsMg
Matt GiggsAgency Trainer/Mentor/Public Speaker
Matt coaches estate agents and helps them define their culture – don’t miss Matt on his Rightmove webinars. Visit hub.rightmove.co.uk/webinars
3. Retain and develop your teamInvest in the development of your leaders. Be clear on what great leadership looks like and get clarity on what leadership really means to them. Make the expectations of each role clear and identify the training requirements to meet the company goals.

28
New Homes
28
29
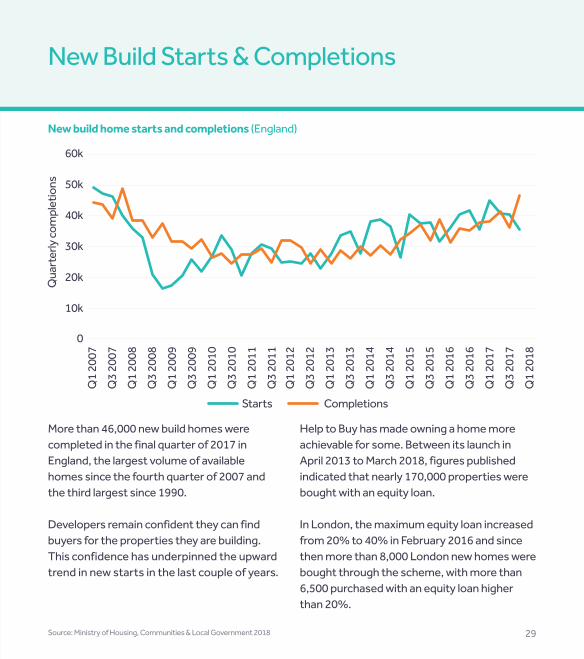
More than 46,000 new build homes were completed in the final quarter of 2017 in England, the largest volume of available homes since the fourth quarter of 2007 and the third largest since 1990.
Developers remain confident they can find buyers for the properties they are building. This confidence has underpinned the upward trend in new starts in the last couple of years.
New Build Starts & Completions
New build home starts and completions (England)
Help to Buy has made owning a home more achievable for some. Between its launch in April 2013 to March 2018, figures published indicated that nearly 170,000 properties were bought with an equity loan.
In London, the maximum equity loan increased from 20% to 40% in February 2016 and since then more than 8,000 London new homes were bought through the scheme, with more than 6,500 purchased with an equity loan higher than 20%.
Source: Ministry of Housing, Communities & Local Government 2018
60k
40k
20k
0
Starts Completions
Q1
2007
Qua
rter
ly co
mpl
etio
ns
Q1
2012
Q1
2009
Q1
2014
Q1
2008
Q1
2013
Q1
2010
Q1
2015
Q1
2017
Q1
2011
Q1
2016
Q1
2018
Q3
2007
Q3
2012
Q3
2011
Q3
2009
Q3
2014
Q3
2008
Q3
2013
Q3
2010
Q3
2015
Q3
2017
Q3
2016
50k
30k
10k

30
Industry View: 2019 outlook
Anne Marie Britton Group Sales & Marketing Director - Miller Homes
"We are continuing to experience demand for high-quality homes at good prices.
This is supported by Help to Buy, which is providing an important stimulus for key sectors of the home-buying market, interest rates which remain historically low, availability of a wide range of mortgage products and a government which is committed to increasing the UK's housing stock.
We expect demand will continue to outstrip supply, providing ongoing opportunities for the new build sector."
Mark Powell Group Sales and Marketing Director - Bloor Homes
“In 2018 we saw similar visitor levels to 2017. That being said, it’s evident that with more stock on the market, buyers have much more choice. Combining this with the uncertainty in the market, 2019 could be a tough environment; we could have a buyers’ market and they should seize this opportunity now as choice has increased.”
31
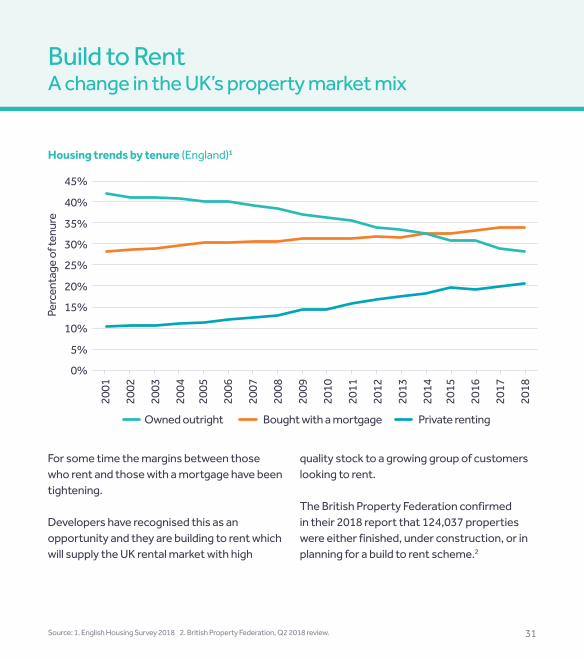
For some time the margins between those who rent and those with a mortgage have been tightening.
Developers have recognised this as an opportunity and they are building to rent which will supply the UK rental market with high
Housing trends by tenure (England)1
Build to Rent A change in the UK’s property market mix
quality stock to a growing group of customers looking to rent.
The British Property Federation confirmed in their 2018 report that 124,037 properties were either finished, under construction, or in planning for a build to rent scheme.2
Source: 1. English Housing Survey 2018 2. British Property Federation, Q2 2018 review.
10%
25%
40%
45%
0%
15%
30%
Owned outright Bought with a mortgage Private renting
2005
2015
2009
2007
2017
2001
Perc
enta
ge o
f ten
ure
2011
2003
2013
2006
2016
2004
2014
2010
2008
2018
2002
2012
5%
20%
35%
32
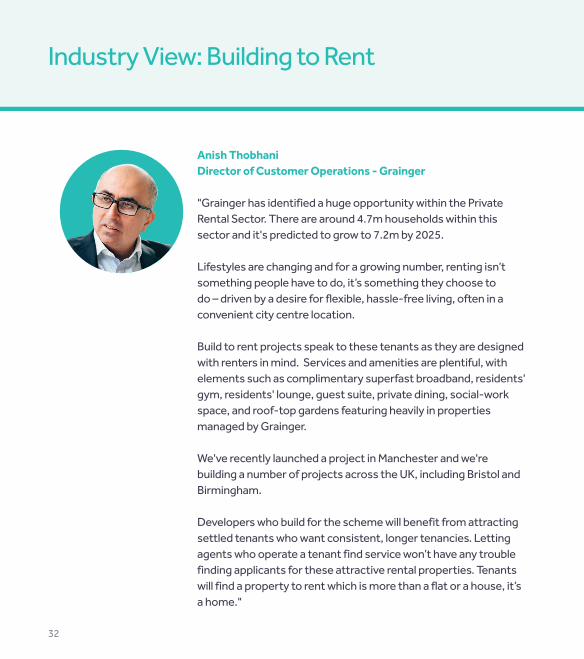
Industry View: Building to Rent
Anish ThobhaniDirector of Customer Operations - Grainger
"Grainger has identified a huge opportunity within the Private Rental Sector. There are around 4.7m households within this sector and it's predicted to grow to 7.2m by 2025.
Lifestyles are changing and for a growing number, renting isn’t something people have to do, it’s something they choose to do – driven by a desire for flexible, hassle-free living, often in a convenient city centre location.
Build to rent projects speak to these tenants as they are designed with renters in mind. Services and amenities are plentiful, with elements such as complimentary superfast broadband, residents' gym, residents' lounge, guest suite, private dining, social-work space, and roof-top gardens featuring heavily in properties managed by Grainger.
We've recently launched a project in Manchester and we're building a number of projects across the UK, including Bristol and Birmingham.
Developers who build for the scheme will benefit from attracting settled tenants who want consistent, longer tenancies. Letting agents who operate a tenant find service won’t have any trouble finding applicants for these attractive rental properties. Tenants will find a property to rent which is more than a flat or a house, it’s a home."

33
Industry View: Supply of New Homes
Stewart Baseley Executive Chairman - Home Builders Federation
"Although we have seen an unprecedented 74% increase in the supply of new homes over the last four years, demand still outstrips supply. All indicators suggest increases will continue – provided we have a level of economic and political stability.
However, the Government’s target of 300,000 additional new homes a year is a very challenging one. Despite the record levels of output, we are still only adding to our housing stock by around 220,000 homes a year.
Builders have focused heavily on how they attract more people into the industry; on how they train people better; on how they can use modern methods of construction and ensuring that as volumes increase, build quality and customer service levels increase too.
As we look to grow further there are of course challenges ahead. The new homes market is a relatively small part of the wider housing market, which relies heavily on political and economic stability.
Getting land approved in principle through the planning system quickly enough remains a challenge, as does recruiting the amount of people we need to actually build the homes. These, though, are challenges the industry is in good shape to tackle, and it is committed to doing so and helping to deliver the homes this country desperately needs."
34
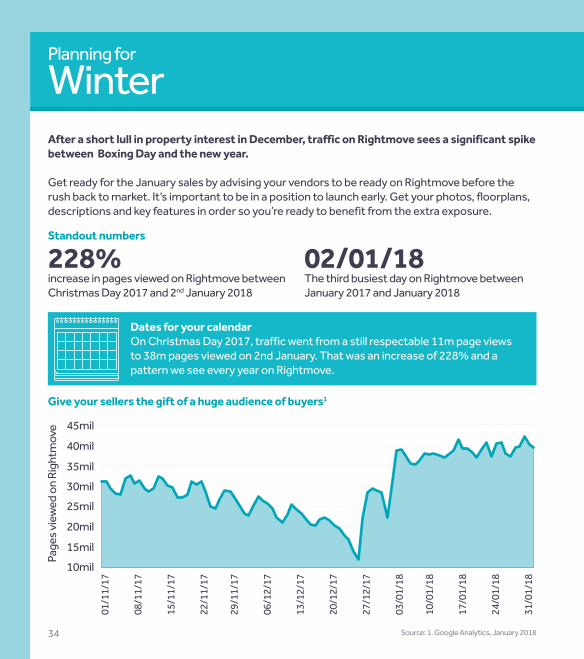
After a short lull in property interest in December, traffic on Rightmove sees a significant spike between Boxing Day and the new year.
Get ready for the January sales by advising your vendors to be ready on Rightmove before the rush back to market. It’s important to be in a position to launch early. Get your photos, floorplans, descriptions and key features in order so you’re ready to benefit from the extra exposure.
Standout numbers
228% increase in pages viewed on Rightmove between Christmas Day 2017 and 2nd January 2018
02/01/18 The third busiest day on Rightmove between January 2017 and January 2018
Dates for your calendarOn Christmas Day 2017, traffic went from a still respectable 11m page views to 38m pages viewed on 2nd January. That was an increase of 228% and a pattern we see every year on Rightmove.
Give your sellers the gift of a huge audience of buyers1
WinterPlanning for
Source: 1. Google Analytics, January 2018
Page
s vie
wed
on
Righ
tmov
e
20mil
40mil
10mil
30mil25mil
45mil
29/1
1/17
10/0
1/18
24/0
1/18
13/1
2/17
01/1
1/17
15/1
1/17
27/1
2/17
06/1
2/17
17/0
1/18
31/0
1/18
22/1
1/17
03/0
1/18
08/1
1/17
20/1
2/17
15mil
35mil
35
Hannah TowersAgency Partner - Armitstead Barnett LLP, Lancashire
"Based in the north west and operating throughout the rural, high end and new build sectors, many clients initially believe that marketing during winter can only be difficult.
Properties look fantastic in spring, but there are some advantages to marketing in the winter period, we just have to think outside the box!
In reality, houses marketed in winter can look fantastic when both the vendor and agent work together to make sure that the presentation to the market is exceptional. Cold crisp days with blue skies, warm fires, mulled wine and fireworks during festivities, we soon begin to feel differently.
People tend to spend more time at home during the winter months and those feelings of their home being too big, too small, too much work, start to focus potential sellers towards moving, pushing up demand in January.
Marketing in winter can have many benefits:
• The period between Christmas and New Year is far busier than most vendors think. We ensure our sales team is at full strength during this period• When less stock comes to market, the good quality stock really stands out• During the holiday season, buyers often have more time to view prospective properties
There’s no wrong time to sell a property. A proactive agent with a good team is key to successfully marketing a home."
36
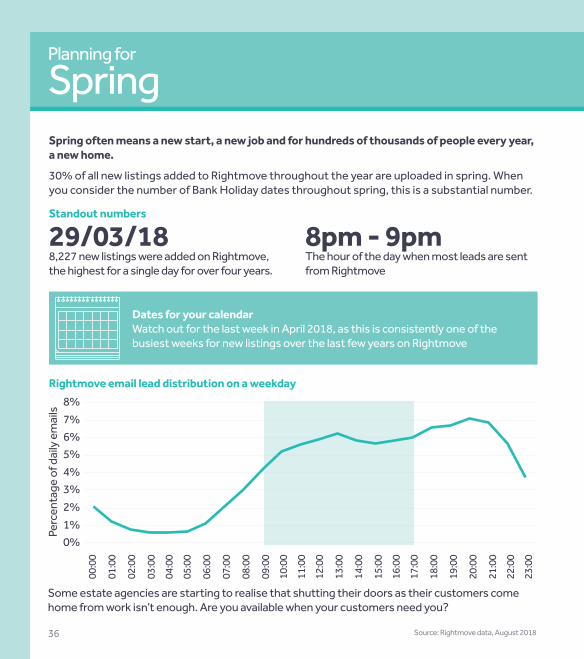
Spring often means a new start, a new job and for hundreds of thousands of people every year, a new home.
30% of all new listings added to Rightmove throughout the year are uploaded in spring. When you consider the number of Bank Holiday dates throughout spring, this is a substantial number.
Standout numbers
29/03/18 8,227 new listings were added on Rightmove, the highest for a single day for over four years.
8pm - 9pmThe hour of the day when most leads are sent from Rightmove
Some estate agencies are starting to realise that shutting their doors as their customers come home from work isn’t enough. Are you available when your customers need you?
Dates for your calendarWatch out for the last week in April 2018, as this is consistently one of the busiest weeks for new listings over the last few years on Rightmove
Source: Rightmove data, August 2018
Rightmove email lead distribution on a weekday
Perc
enta
ge o
f dai
ly e
mai
ls
04:0
0
16:0
0
10:0
0
22:0
0
05:0
0
17:0
0
11:0
0
23:0
0
00:0
0
12:0
0
02:0
0
14:0
0
08:0
0
20:0
0
03:0
0
15:0
0
09:0
0
21:0
0
01:0
0
13:0
0
07:0
0
19:0
0
06:0
0
18:0
0
2%
5%
8%
0%
3%
6%
1%
4%
7%
SpringPlanning for
37
Hetal ShahManaging Director – Ivy Gate, Borehamwood & Barnet
"We are one of the leading agents in our patch for new instructions and sales agreed. Our success has come from being available when our customers need us.
We’ve recognised that most enquiries are sent around 8pm when other agents are closed. To make ourselves more available when our clients need us, we extended our opening hours until late into the evening.
Our clients, prospective buyers and tenants get a Personal Relationship Manager who is available for more hours of the day, including their commute to work or in the evening when they return home.
Most estate agents call through the enquiries they have missed the following day. They also call when the home mover is at work and unable to respond.
We commit to respond to an enquiry within 15 minutes, by text or even a WhatsApp message, no matter the time. This greatly increases the chance of us confirming a viewing.
This level of service extends into our after-care process. Buyers really appreciate having a dedicated member of our team, available when they need them, from the start of the process to the finish.
We’ve managed to secure more sales and lets by using technology to manage relationships out of normal working hours and by having somebody available in person for our clients."
38
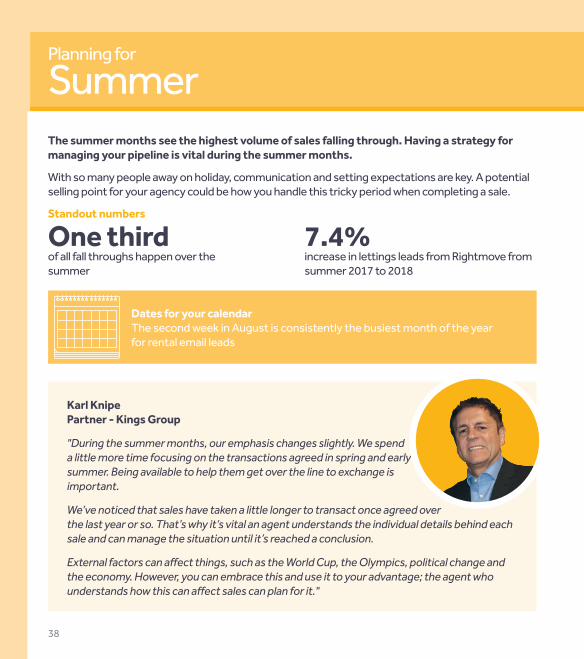
The summer months see the highest volume of sales falling through. Having a strategy for managing your pipeline is vital during the summer months.
With so many people away on holiday, communication and setting expectations are key. A potential selling point for your agency could be how you handle this tricky period when completing a sale.
Standout numbers
One thirdof all fall throughs happen over the summer
7.4% increase in lettings leads from Rightmove from summer 2017 to 2018
Karl Knipe Partner - Kings Group
"During the summer months, our emphasis changes slightly. We spend a little more time focusing on the transactions agreed in spring and early summer. Being available to help them get over the line to exchange is important.
We’ve noticed that sales have taken a little longer to transact once agreed over the last year or so. That’s why it’s vital an agent understands the individual details behind each sale and can manage the situation until it’s reached a conclusion.
External factors can affect things, such as the World Cup, the Olympics, political change and the economy. However, you can embrace this and use it to your advantage; the agent who understands how this can affect sales can plan for it."
Dates for your calendarThe second week in August is consistently the busiest month of the year for rental email leads
SummerPlanning for
39
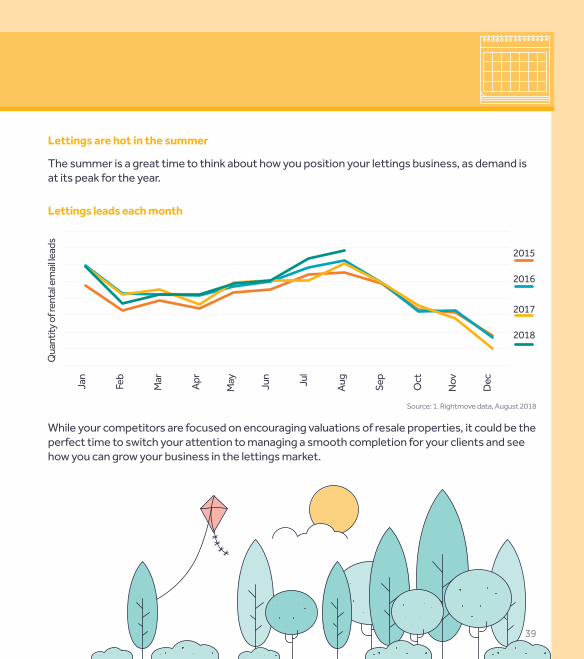
Lettings are hot in the summer
Lettings leads each month
While your competitors are focused on encouraging valuations of resale properties, it could be the perfect time to switch your attention to managing a smooth completion for your clients and see how you can grow your business in the lettings market.
The summer is a great time to think about how you position your lettings business, as demand is at its peak for the year.
Source: 1. Rightmove data, August 2018
May
NovJu
n
Dec
2015
2017
2016
2018
Jan
Qua
ntity
of r
enta
l em
ail le
ads
Mar
Sep
Apr
OctFeb
AugJul
40
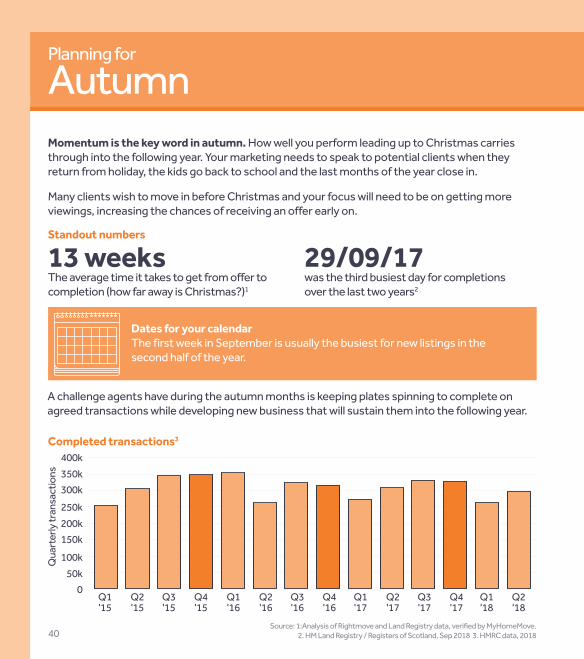
Momentum is the key word in autumn. How well you perform leading up to Christmas carries through into the following year. Your marketing needs to speak to potential clients when they return from holiday, the kids go back to school and the last months of the year close in.
Many clients wish to move in before Christmas and your focus will need to be on getting more viewings, increasing the chances of receiving an offer early on.
Standout numbers
13 weeks The average time it takes to get from offer to completion (how far away is Christmas?)1
29/09/17was the third busiest day for completions over the last two years2
A challenge agents have during the autumn months is keeping plates spinning to complete on agreed transactions while developing new business that will sustain them into the following year.
Dates for your calendarThe first week in September is usually the busiest for new listings in the second half of the year.
Source: 1:Analysis of Rightmove and Land Registry data, verified by MyHomeMove. 2. HM Land Registry / Registers of Scotland, Sep 2018 3. HMRC data, 2018
Completed transactions3
Q1'15
Q1'16
Q1'17
Q2'15
Q2'16
Q2'17
Q3'15
Q3'16
Q3'17
Q1'18
Q4'15
Q4'16
Q4'17
Q2'18
400k
250k
100k
350k
200k
50k
300k
Qua
rter
ly tr
ansa
ctio
ns
150k
0
AutumnPlanning for

41
Donald Collins Director - Go View London
"The autumn season is a great time to capitalise on achieving agreed sales with a view to completing prior to Christmas and re-visiting clients with a view of preparing them for the New Year sales market.
As with any time of the year, it is important you understand the journey your clients are on. To be constantly agreeing on business you need to be in tune with your most motivated clients.
Your first priority is the clients looking to move before Christmas. Who from your stock register has a real desire to get moved before Christmas? Are you doing everything you can in order to help them achieve this? Has the client responded to your advice in terms of aligning them to the market to help achieve this goal?
If you can answer the above you are absolutely putting your agency in the best position possible to achieve a successful last quarter of the year.
We talk to some clients for years before they put their property on the market. There is nothing wrong with this; it is a massive decision for people to make in their lives, and by being the agent that guides them over the long-term you are putting yourself in the best position possible to win the listing."

Local Data
42
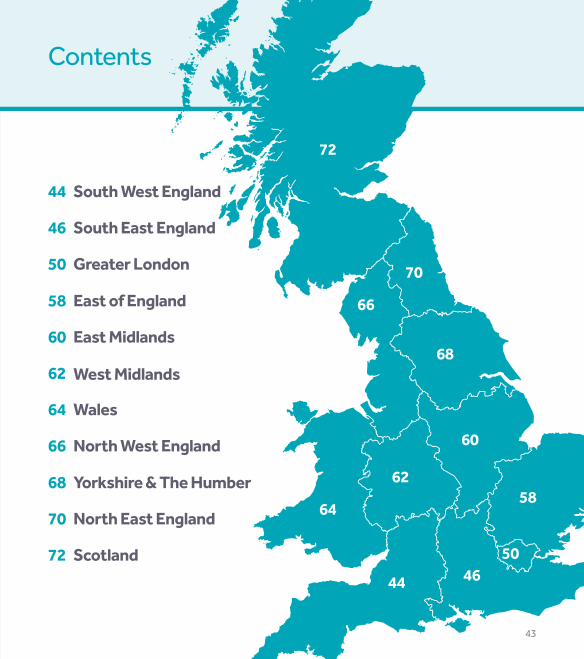
Contents
43
44
58
68
46
64
60
70
50
66
62
72
44
58
68
North East England
North West England
Greater London
46
64
60
70
Yorkshire & The Humber
South East England
East Midlands
Wales
50
66
62
72
East of England
South West England
West Midlands
Scotland
44
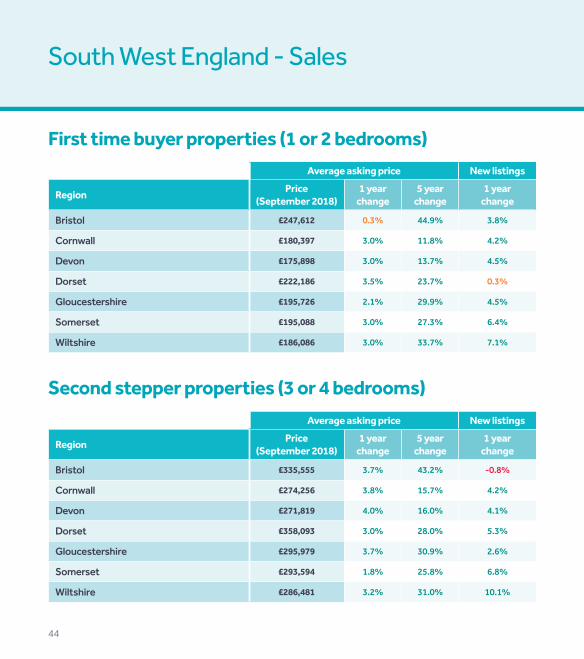
South West England - Sales
First time buyer properties (1 or 2 bedrooms)
Second stepper properties (3 or 4 bedrooms)
Average asking price New listings
Region Price(September 2018)
1 year change
5 year change
1 year change
Bristol £247,612 0.3% 44.9% 3.8%
Cornwall £180,397 3.0% 11.8% 4.2%
Devon £175,898 3.0% 13.7% 4.5%
Dorset £222,186 3.5% 23.7% 0.3%
Gloucestershire £195,726 2.1% 29.9% 4.5%
Somerset £195,088 3.0% 27.3% 6.4%
Wiltshire £186,086 3.0% 33.7% 7.1%
Average asking price New listings
Region Price(September 2018)
1 year change
5 year change
1 year change
Bristol £335,555 3.7% 43.2% -0.8%
Cornwall £274,256 3.8% 15.7% 4.2%
Devon £271,819 4.0% 16.0% 4.1%
Dorset £358,093 3.0% 28.0% 5.3%
Gloucestershire £295,979 3.7% 30.9% 2.6%
Somerset £293,594 1.8% 25.8% 6.8%
Wiltshire £286,481 3.2% 31.0% 10.1%

45
South West England - Lettings
1 bedroom
2 bedrooms
Average asking rent New listings
Region Rent(September 2018)
1 year change
5 year change
1 year change
Bristol £783 1.5% 26.4% -8.7%
Cornwall £533 2.4% 9.7% -4.2%
Devon £526 1.1% 6.5% 5.4%
Dorset £642 0.7% 13.1% -18.6%
Gloucestershire £592 0.7% 17.4% 17.3%
Somerset £600 2.8% 14.4% -8.4%
Wiltshire £585 -1.0% 19.1% -10.5%
Average asking rent New listings
Region Rent(September 2018)
1 year change
5 year change
1 year change
Bristol £1,033 1.1% 28.1% -25.3%
Cornwall £672 2.5% 8.5% -8.3%
Devon £677 2.0% 9.5% -3.2%
Dorset £859 2.7% 13.8% 8.8%
Gloucestershire £774 2.7% 18.8% 2.1%
Somerset £733 1.9% 17.1% -14.9%
Wiltshire £725 0.5% 18.3% 11.7%
New listings are Q3 2018 vs Q3 2017
46
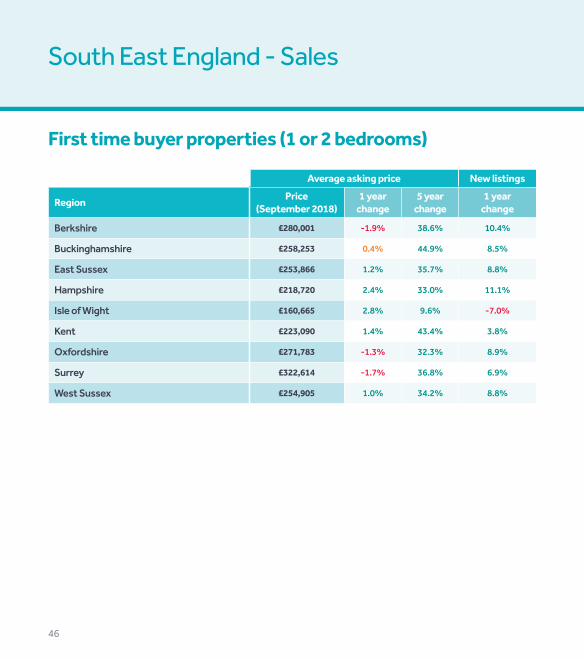
South East England - Sales
First time buyer properties (1 or 2 bedrooms)
Average asking price New listings
Region Price(September 2018)
1 year change
5 year change
1 year change
Berkshire £280,001 -1.9% 38.6% 10.4%
Buckinghamshire £258,253 0.4% 44.9% 8.5%
East Sussex £253,866 1.2% 35.7% 8.8%
Hampshire £218,720 2.4% 33.0% 11.1%
Isle of Wight £160,665 2.8% 9.6% -7.0%
Kent £223,090 1.4% 43.4% 3.8%
Oxfordshire £271,783 -1.3% 32.3% 8.9%
Surrey £322,614 -1.7% 36.8% 6.9%
West Sussex £254,905 1.0% 34.2% 8.8%
47
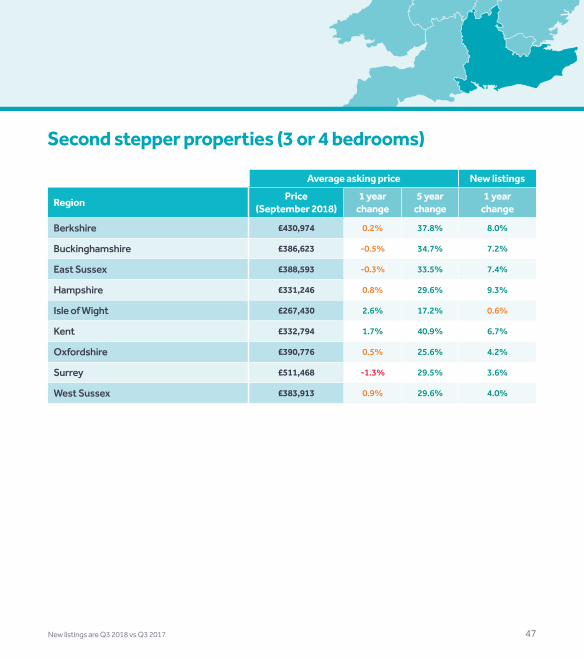
Second stepper properties (3 or 4 bedrooms)
Average asking price New listings
Region Price(September 2018)
1 year change
5 year change
1 year change
Berkshire £430,974 0.2% 37.8% 8.0%
Buckinghamshire £386,623 -0.5% 34.7% 7.2%
East Sussex £388,593 -0.3% 33.5% 7.4%
Hampshire £331,246 0.8% 29.6% 9.3%
Isle of Wight £267,430 2.6% 17.2% 0.6%
Kent £332,794 1.7% 40.9% 6.7%
Oxfordshire £390,776 0.5% 25.6% 4.2%
Surrey £511,468 -1.3% 29.5% 3.6%
West Sussex £383,913 0.9% 29.6% 4.0%
New listings are Q3 2018 vs Q3 2017
48
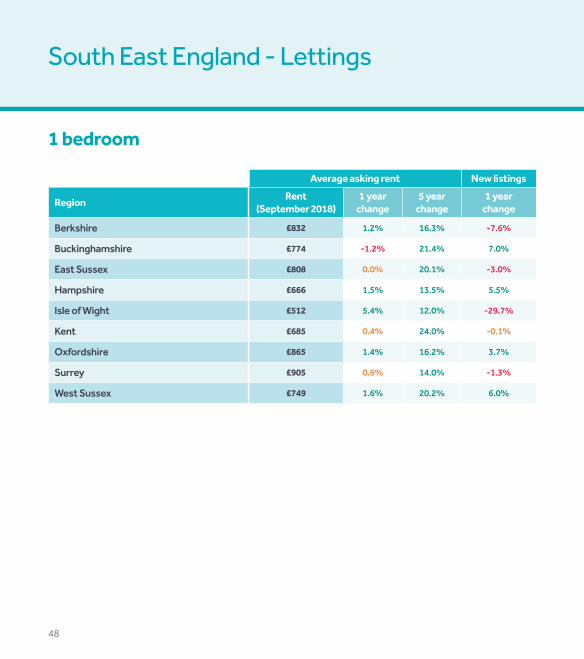
South East England - Lettings
1 bedroom
Average asking rent New listings
Region Rent(September 2018)
1 year change
5 year change
1 year change
Berkshire £832 1.2% 16.3% -7.6%
Buckinghamshire £774 -1.2% 21.4% 7.0%
East Sussex £808 0.0% 20.1% -3.0%
Hampshire £666 1.5% 13.5% 5.5%
Isle of Wight £512 5.4% 12.0% -29.7%
Kent £685 0.4% 24.0% -0.1%
Oxfordshire £865 1.4% 16.2% 3.7%
Surrey £905 0.6% 14.0% -1.3%
West Sussex £749 1.6% 20.2% 6.0%
49
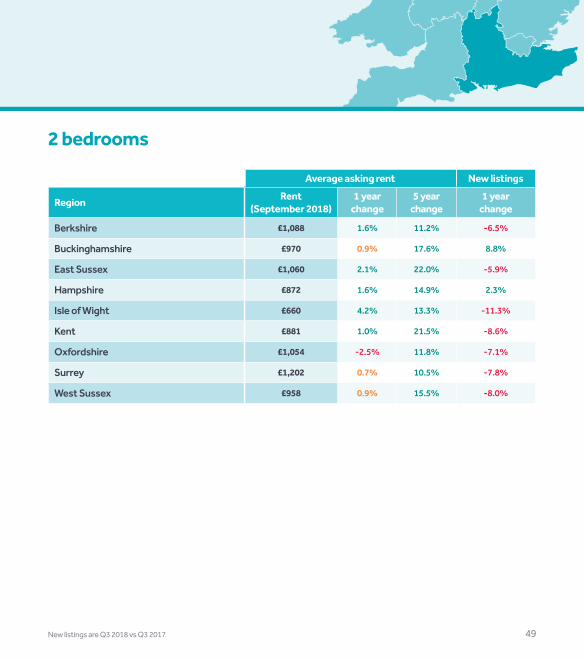
2 bedrooms
Average asking rent New listings
Region Rent(September 2018)
1 year change
5 year change
1 year change
Berkshire £1,088 1.6% 11.2% -6.5%
Buckinghamshire £970 0.9% 17.6% 8.8%
East Sussex £1,060 2.1% 22.0% -5.9%
Hampshire £872 1.6% 14.9% 2.3%
Isle of Wight £660 4.2% 13.3% -11.3%
Kent £881 1.0% 21.5% -8.6%
Oxfordshire £1,054 -2.5% 11.8% -7.1%
Surrey £1,202 0.7% 10.5% -7.8%
West Sussex £958 0.9% 15.5% -8.0%
New listings are Q3 2018 vs Q3 2017
50
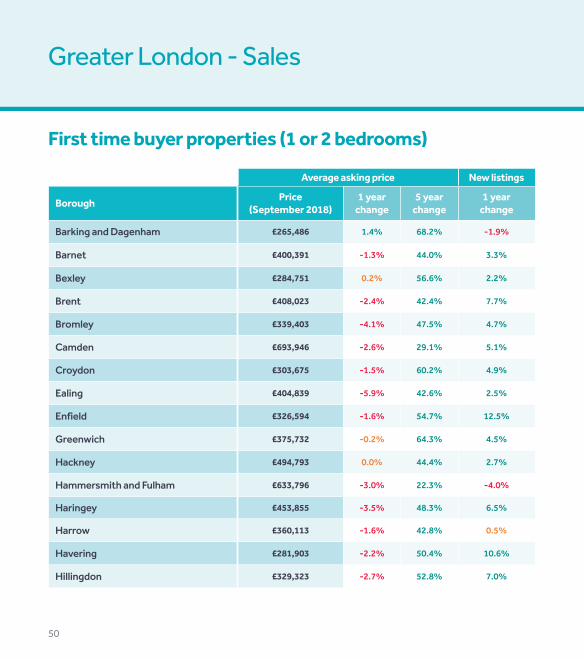
Greater London - Sales
First time buyer properties (1 or 2 bedrooms)
Average asking price New listings
Borough Price(September 2018)
1 year change
5 year change
1 year change
Barking and Dagenham £265,486 1.4% 68.2% -1.9%
Barnet £400,391 -1.3% 44.0% 3.3%
Bexley £284,751 0.2% 56.6% 2.2%
Brent £408,023 -2.4% 42.4% 7.7%
Bromley £339,403 -4.1% 47.5% 4.7%
Camden £693,946 -2.6% 29.1% 5.1%
Croydon £303,675 -1.5% 60.2% 4.9%
Ealing £404,839 -5.9% 42.6% 2.5%
Enfield £326,594 -1.6% 54.7% 12.5%
Greenwich £375,732 -0.2% 64.3% 4.5%
Hackney £494,793 0.0% 44.4% 2.7%
Hammersmith and Fulham £633,796 -3.0% 22.3% -4.0%
Haringey £453,855 -3.5% 48.3% 6.5%
Harrow £360,113 -1.6% 42.8% 0.5%
Havering £281,903 -2.2% 50.4% 10.6%
Hillingdon £329,323 -2.7% 52.8% 7.0%
51
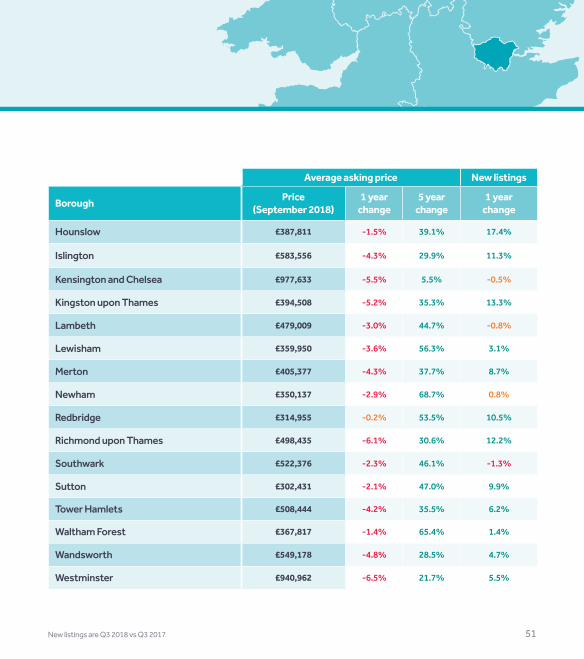
Average asking price New listings
Borough Price(September 2018)
1 year change
5 year change
1 year change
Hounslow £387,811 -1.5% 39.1% 17.4%
Islington £583,556 -4.3% 29.9% 11.3%
Kensington and Chelsea £977,633 -5.5% 5.5% -0.5%
Kingston upon Thames £394,508 -5.2% 35.3% 13.3%
Lambeth £479,009 -3.0% 44.7% -0.8%
Lewisham £359,950 -3.6% 56.3% 3.1%
Merton £405,377 -4.3% 37.7% 8.7%
Newham £350,137 -2.9% 68.7% 0.8%
Redbridge £314,955 -0.2% 53.5% 10.5%
Richmond upon Thames £498,435 -6.1% 30.6% 12.2%
Southwark £522,376 -2.3% 46.1% -1.3%
Sutton £302,431 -2.1% 47.0% 9.9%
Tower Hamlets £508,444 -4.2% 35.5% 6.2%
Waltham Forest £367,817 -1.4% 65.4% 1.4%
Wandsworth £549,178 -4.8% 28.5% 4.7%
Westminster £940,962 -6.5% 21.7% 5.5%
New listings are Q3 2018 vs Q3 2017
52
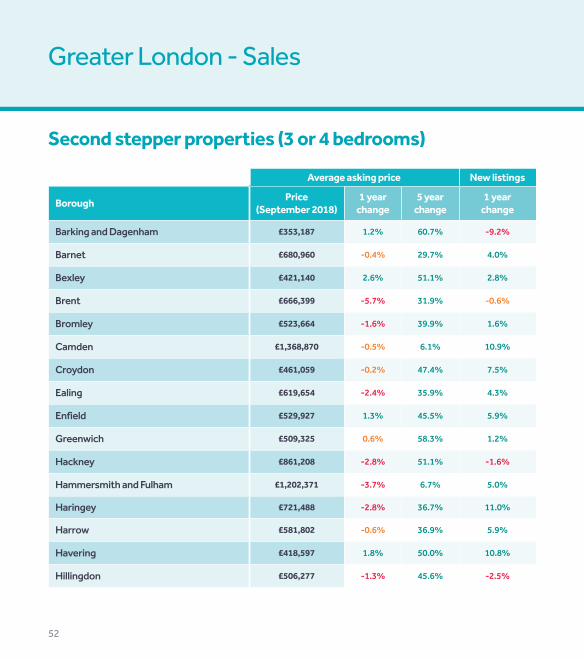
Greater London - Sales
Second stepper properties (3 or 4 bedrooms)
Average asking price New listings
Borough Price(September 2018)
1 year change
5 year change
1 year change
Barking and Dagenham £353,187 1.2% 60.7% -9.2%
Barnet £680,960 -0.4% 29.7% 4.0%
Bexley £421,140 2.6% 51.1% 2.8%
Brent £666,399 -5.7% 31.9% -0.6%
Bromley £523,664 -1.6% 39.9% 1.6%
Camden £1,368,870 -0.5% 6.1% 10.9%
Croydon £461,059 -0.2% 47.4% 7.5%
Ealing £619,654 -2.4% 35.9% 4.3%
Enfield £529,927 1.3% 45.5% 5.9%
Greenwich £509,325 0.6% 58.3% 1.2%
Hackney £861,208 -2.8% 51.1% -1.6%
Hammersmith and Fulham £1,202,371 -3.7% 6.7% 5.0%
Haringey £721,488 -2.8% 36.7% 11.0%
Harrow £581,802 -0.6% 36.9% 5.9%
Havering £418,597 1.8% 50.0% 10.8%
Hillingdon £506,277 -1.3% 45.6% -2.5%
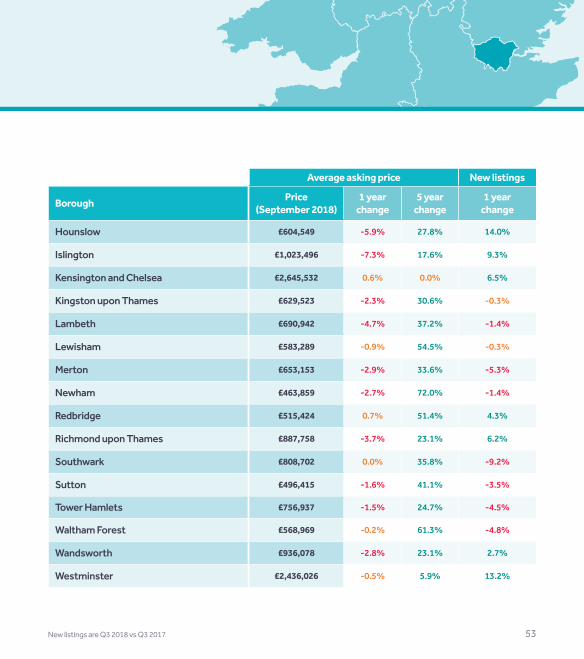
53
Average asking price New listings
Borough Price(September 2018)
1 year change
5 year change
1 year change
Hounslow £604,549 -5.9% 27.8% 14.0%
Islington £1,023,496 -7.3% 17.6% 9.3%
Kensington and Chelsea £2,645,532 0.6% 0.0% 6.5%
Kingston upon Thames £629,523 -2.3% 30.6% -0.3%
Lambeth £690,942 -4.7% 37.2% -1.4%
Lewisham £583,289 -0.9% 54.5% -0.3%
Merton £653,153 -2.9% 33.6% -5.3%
Newham £463,859 -2.7% 72.0% -1.4%
Redbridge £515,424 0.7% 51.4% 4.3%
Richmond upon Thames £887,758 -3.7% 23.1% 6.2%
Southwark £808,702 0.0% 35.8% -9.2%
Sutton £496,415 -1.6% 41.1% -3.5%
Tower Hamlets £756,937 -1.5% 24.7% -4.5%
Waltham Forest £568,969 -0.2% 61.3% -4.8%
Wandsworth £936,078 -2.8% 23.1% 2.7%
Westminster £2,436,026 -0.5% 5.9% 13.2%
New listings are Q3 2018 vs Q3 2017

54
Greater London - Lettings
1 bedroom
Average asking rent New listings
Borough Rent(September 2018)
1 year change
5 year change
1 year change
Barking and Dagenham £995 1.5% 23.7% -14.6%
Barnet £1,154 0.1% 15.9% -27.6%
Bexley £875 0.5% 22.3% -42.1%
Brent £1,263 -1.7% 14.2% -31.4%
Bromley £984 0.9% 19.6% 13.2%
Camden £1,705 0.3% 8.5% -31.6%
Croydon £963 0.2% 17.7% 6.5%
Ealing £1,252 0.2% 12.5% -22.1%
Enfield £1,036 -0.3% 20.6% -29.3%
Greenwich £1,220 3.0% 24.4% 1.1%
Hackney £1,469 2.3% 13.6% -16.3%
Hammersmith and Fulham £1,625 3.0% 16.0% -9.7%
Haringey £1,268 2.5% 13.3% -19.7%
Harrow £1,092 4.1% 22.6% 26.8%
Havering £905 2.0% 22.7% 11.8%
Hillingdon £1,010 0.1% 19.5% 0.5%
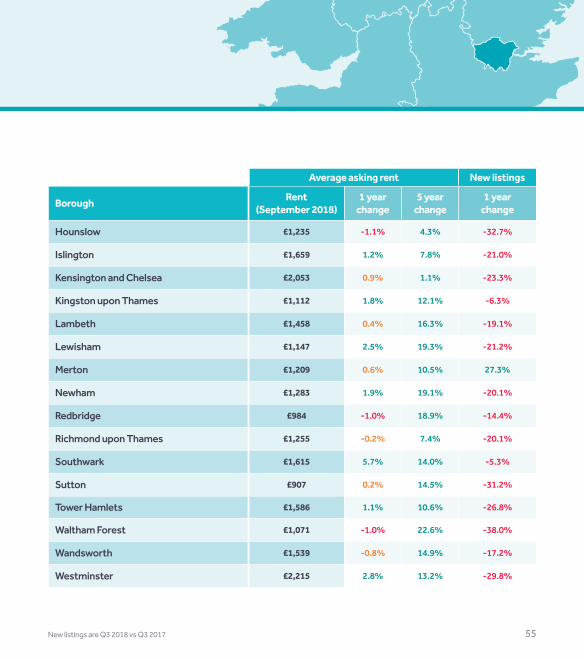
55
Average asking rent New listings
Borough Rent(September 2018)
1 year change
5 year change
1 year change
Hounslow £1,235 -1.1% 4.3% -32.7%
Islington £1,659 1.2% 7.8% -21.0%
Kensington and Chelsea £2,053 0.9% 1.1% -23.3%
Kingston upon Thames £1,112 1.8% 12.1% -6.3%
Lambeth £1,458 0.4% 16.3% -19.1%
Lewisham £1,147 2.5% 19.3% -21.2%
Merton £1,209 0.6% 10.5% 27.3%
Newham £1,283 1.9% 19.1% -20.1%
Redbridge £984 -1.0% 18.9% -14.4%
Richmond upon Thames £1,255 -0.2% 7.4% -20.1%
Southwark £1,615 5.7% 14.0% -5.3%
Sutton £907 0.2% 14.5% -31.2%
Tower Hamlets £1,586 1.1% 10.6% -26.8%
Waltham Forest £1,071 -1.0% 22.6% -38.0%
Wandsworth £1,539 -0.8% 14.9% -17.2%
Westminster £2,215 2.8% 13.2% -29.8%
New listings are Q3 2018 vs Q3 2017

56
Greater London - Lettings
2 bedrooms
Average asking rent New listings
Borough Rent(September 2018)
1 year change
5 year change
1 year change
Barking and Dagenham £1,222 1.2% 24.2% -26.4%
Barnet £1,475 1.4% 10.3% -18.5%
Bexley £1,101 0.8% 23.1% 7.3%
Brent £1,584 1.3% 9.1% -16.7%
Bromley £1,277 2.8% 15.7% 8.7%
Camden £2,428 2.7% 11.2% -19.3%
Croydon £1,236 0.2% 16.4% -18.8%
Ealing £1,580 1.2% 9.1% -28.0%
Enfield £1,332 0.6% 14.7% 5.1%
Greenwich £1,493 3.2% 16.4% -4.3%
Hackney £1,861 0.8% 10.4% -36.7%
Hammersmith and Fulham £2,246 6.8% 21.2% -0.1%
Haringey £1,564 3.0% 9.4% -17.8%
Harrow £1,344 0.8% 11.1% 5.1%
Havering £1,148 0.3% 21.4% -10.9%
Hillingdon £1,307 2.8% 13.6% -3.6%

57
Average asking rent New listings
Borough Rent(September 2018)
1 year change
5 year change
1 year change
Hounslow £1,585 0.9% -2.9% -18.1%
Islington £2,176 1.2% 4.8% -31.4%
Kensington and Chelsea £3,194 2.6% 10.8% -27.9%
Kingston upon Thames £1,384 0.0% 5.6% 1.3%
Lambeth £1,802 0.6% 16.6% -9.5%
Lewisham £1,399 1.1% 14.9% -21.8%
Merton £1,521 -1.0% 4.3% -1.2%
Newham £1,575 1.1% 19.1% -31.8%
Redbridge £1,285 1.4% 15.9% -21.2%
Richmond upon Thames £1,655 0.0% 3.9% -25.1%
Southwark £2,024 7.3% 13.3% -14.7%
Sutton £1,188 1.6% 12.6% -36.6%
Tower Hamlets £2,019 2.0% 9.0% -27.1%
Waltham Forest £1,340 0.9% 17.7% -13.5%
Wandsworth £1,983 3.2% 14.4% -11.6%
Westminster £3,267 4.0% 6.6% -23.1%
New listings are Q3 2018 vs Q3 2017
58
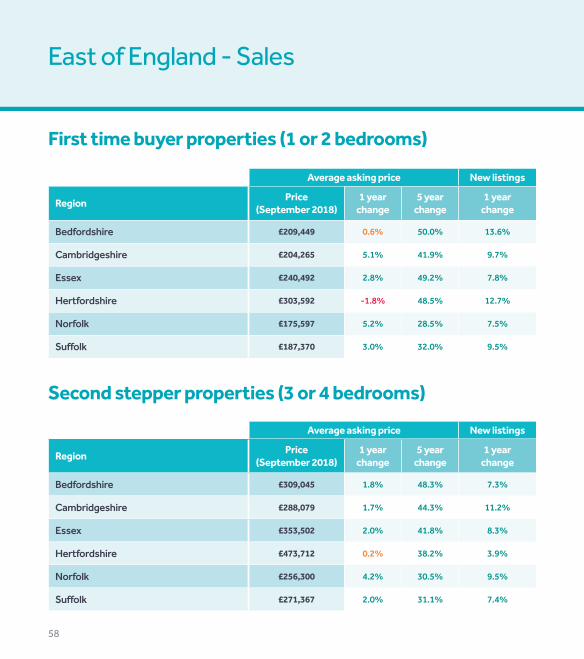
East of England - Sales
First time buyer properties (1 or 2 bedrooms)
Second stepper properties (3 or 4 bedrooms)
Average asking price New listings
Region Price(September 2018)
1 year change
5 year change
1 year change
Bedfordshire £209,449 0.6% 50.0% 13.6%
Cambridgeshire £204,265 5.1% 41.9% 9.7%
Essex £240,492 2.8% 49.2% 7.8%
Hertfordshire £303,592 -1.8% 48.5% 12.7%
Norfolk £175,597 5.2% 28.5% 7.5%
Suffolk £187,370 3.0% 32.0% 9.5%
Average asking price New listings
Region Price(September 2018)
1 year change
5 year change
1 year change
Bedfordshire £309,045 1.8% 48.3% 7.3%
Cambridgeshire £288,079 1.7% 44.3% 11.2%
Essex £353,502 2.0% 41.8% 8.3%
Hertfordshire £473,712 0.2% 38.2% 3.9%
Norfolk £256,300 4.2% 30.5% 9.5%
Suffolk £271,367 2.0% 31.1% 7.4%

59
East of England - Lettings
1 bedroom
2 bedrooms
Average asking rent New listings
Region Rent(September 2018)
1 year change
5 year change
1 year change
Bedfordshire £645 -2.3% 24.3% 20.9%
Cambridgeshire £708 -0.9% 20.8% 18.1%
Essex £716 1.2% 22.4% 11.8%
Hertfordshire £835 -0.2% 20.2% 8.4%
Norfolk £536 2.5% 15.2% -20.8%
Suffolk £571 3.3% 22.0% 7.8%
Average asking rent New listings
Region Rent(September 2018)
1 year change
5 year change
1 year change
Bedfordshire £808 -1.1% 22.4% 10.3%
Cambridgeshire £859 0.2% 21.7% -6.2%
Essex £912 0.6% 22.2% 7.9%
Hertfordshire £1,107 0.5% 17.0% -5.0%
Norfolk £665 1.7% 16.4% -14.3%
Suffolk £735 2.8% 22.8% 8.0%
New listings are Q3 2018 vs Q3 2017
60
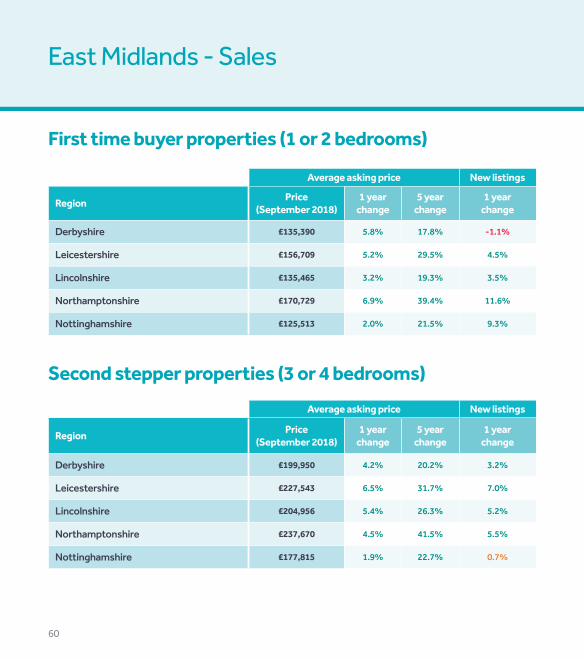
East Midlands - Sales
First time buyer properties (1 or 2 bedrooms)
Second stepper properties (3 or 4 bedrooms)
Average asking price New listings
Region Price(September 2018)
1 year change
5 year change
1 year change
Derbyshire £135,390 5.8% 17.8% -1.1%
Leicestershire £156,709 5.2% 29.5% 4.5%
Lincolnshire £135,465 3.2% 19.3% 3.5%
Northamptonshire £170,729 6.9% 39.4% 11.6%
Nottinghamshire £125,513 2.0% 21.5% 9.3%
Average asking price New listings
Region Price(September 2018)
1 year change
5 year change
1 year change
Derbyshire £199,950 4.2% 20.2% 3.2%
Leicestershire £227,543 6.5% 31.7% 7.0%
Lincolnshire £204,956 5.4% 26.3% 5.2%
Northamptonshire £237,670 4.5% 41.5% 5.5%
Nottinghamshire £177,815 1.9% 22.7% 0.7%
61
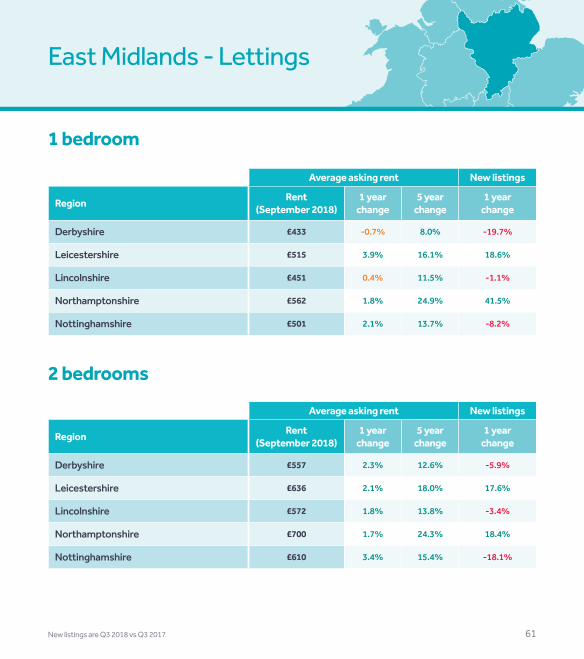
East Midlands - Lettings
1 bedroom
2 bedrooms
Average asking rent New listings
Region Rent(September 2018)
1 year change
5 year change
1 year change
Derbyshire £433 -0.7% 8.0% -19.7%
Leicestershire £515 3.9% 16.1% 18.6%
Lincolnshire £451 0.4% 11.5% -1.1%
Northamptonshire £562 1.8% 24.9% 41.5%
Nottinghamshire £501 2.1% 13.7% -8.2%
Average asking rent New listings
Region Rent(September 2018)
1 year change
5 year change
1 year change
Derbyshire £557 2.3% 12.6% -5.9%
Leicestershire £636 2.1% 18.0% 17.6%
Lincolnshire £572 1.8% 13.8% -3.4%
Northamptonshire £700 1.7% 24.3% 18.4%
Nottinghamshire £610 3.4% 15.4% -18.1%
New listings are Q3 2018 vs Q3 2017
62
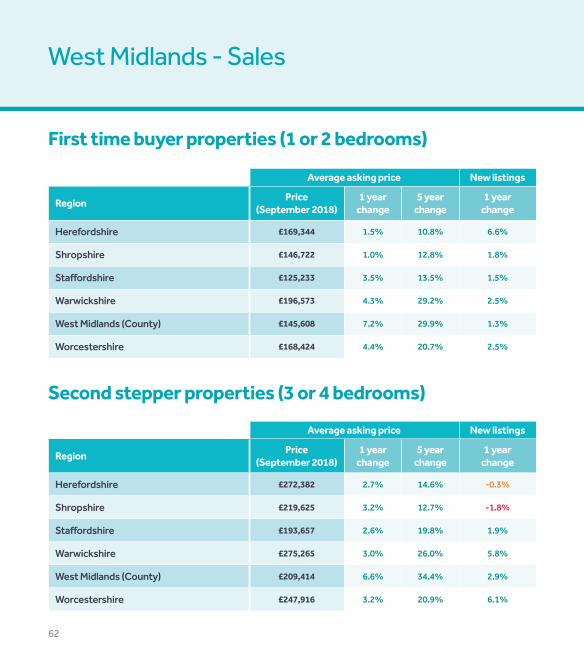
West Midlands - Sales
First time buyer properties (1 or 2 bedrooms)
Second stepper properties (3 or 4 bedrooms)
Average asking price New listings
Region Price(September 2018)
1 year change
5 year change
1 year change
Herefordshire £169,344 1.5% 10.8% 6.6%
Shropshire £146,722 1.0% 12.8% 1.8%
Staffordshire £125,233 3.5% 13.5% 1.5%
Warwickshire £196,573 4.3% 29.2% 2.5%
West Midlands (County) £145,608 7.2% 29.9% 1.3%
Worcestershire £168,424 4.4% 20.7% 2.5%
Average asking price New listings
Region Price(September 2018)
1 year change
5 year change
1 year change
Herefordshire £272,382 2.7% 14.6% -0.3%
Shropshire £219,625 3.2% 12.7% -1.8%
Staffordshire £193,657 2.6% 19.8% 1.9%
Warwickshire £275,265 3.0% 26.0% 5.8%
West Midlands (County) £209,414 6.6% 34.4% 2.9%
Worcestershire £247,916 3.2% 20.9% 6.1%
New listings are Q3 2018 vs Q3 2017 63
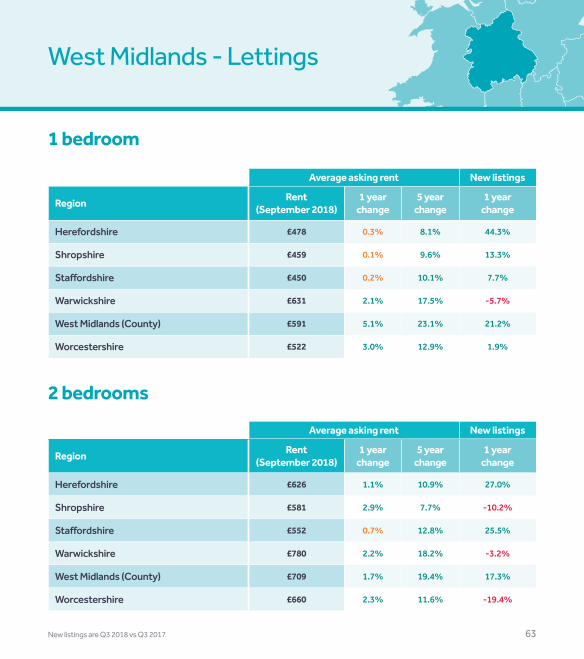
West Midlands - Lettings
1 bedroom
2 bedrooms
Average asking rent New listings
Region Rent(September 2018)
1 year change
5 year change
1 year change
Herefordshire £478 0.3% 8.1% 44.3%
Shropshire £459 0.1% 9.6% 13.3%
Staffordshire £450 0.2% 10.1% 7.7%
Warwickshire £631 2.1% 17.5% -5.7%
West Midlands (County) £591 5.1% 23.1% 21.2%
Worcestershire £522 3.0% 12.9% 1.9%
Average asking rent New listings
Region Rent(September 2018)
1 year change
5 year change
1 year change
Herefordshire £626 1.1% 10.9% 27.0%
Shropshire £581 2.9% 7.7% -10.2%
Staffordshire £552 0.7% 12.8% 25.5%
Warwickshire £780 2.2% 18.2% -3.2%
West Midlands (County) £709 1.7% 19.4% 17.3%
Worcestershire £660 2.3% 11.6% -19.4%
64
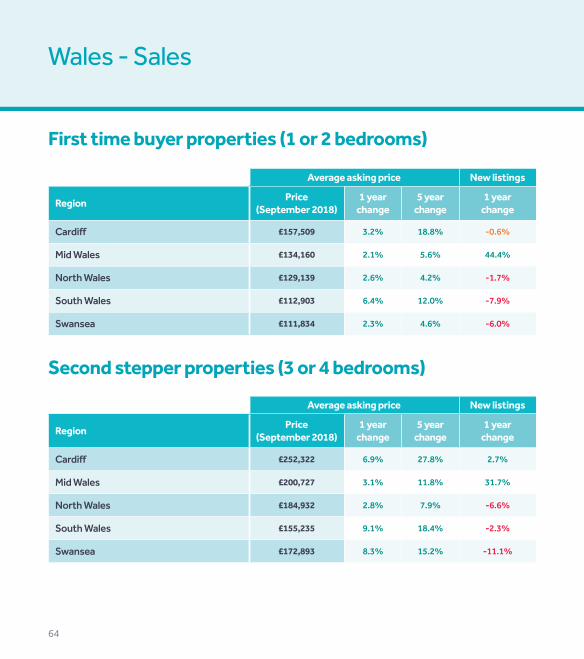
Wales - Sales
First time buyer properties (1 or 2 bedrooms)
Second stepper properties (3 or 4 bedrooms)
Average asking price New listings
Region Price(September 2018)
1 year change
5 year change
1 year change
Cardiff £157,509 3.2% 18.8% -0.6%
Mid Wales £134,160 2.1% 5.6% 44.4%
North Wales £129,139 2.6% 4.2% -1.7%
South Wales £112,903 6.4% 12.0% -7.9%
Swansea £111,834 2.3% 4.6% -6.0%
Average asking price New listings
Region Price(September 2018)
1 year change
5 year change
1 year change
Cardiff £252,322 6.9% 27.8% 2.7%
Mid Wales £200,727 3.1% 11.8% 31.7%
North Wales £184,932 2.8% 7.9% -6.6%
South Wales £155,235 9.1% 18.4% -2.3%
Swansea £172,893 8.3% 15.2% -11.1%
New listings are Q3 2018 vs Q3 2017 65
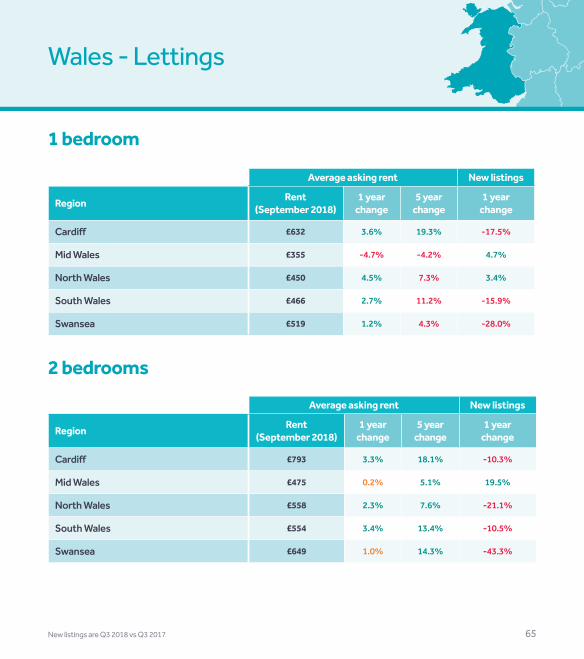
Wales - Lettings
1 bedroom
2 bedrooms
Average asking rent New listings
Region Rent(September 2018)
1 year change
5 year change
1 year change
Cardiff £632 3.6% 19.3% -17.5%
Mid Wales £355 -4.7% -4.2% 4.7%
North Wales £450 4.5% 7.3% 3.4%
South Wales £466 2.7% 11.2% -15.9%
Swansea £519 1.2% 4.3% -28.0%
Average asking rent New listings
Region Rent(September 2018)
1 year change
5 year change
1 year change
Cardiff £793 3.3% 18.1% -10.3%
Mid Wales £475 0.2% 5.1% 19.5%
North Wales £558 2.3% 7.6% -21.1%
South Wales £554 3.4% 13.4% -10.5%
Swansea £649 1.0% 14.3% -43.3%
66
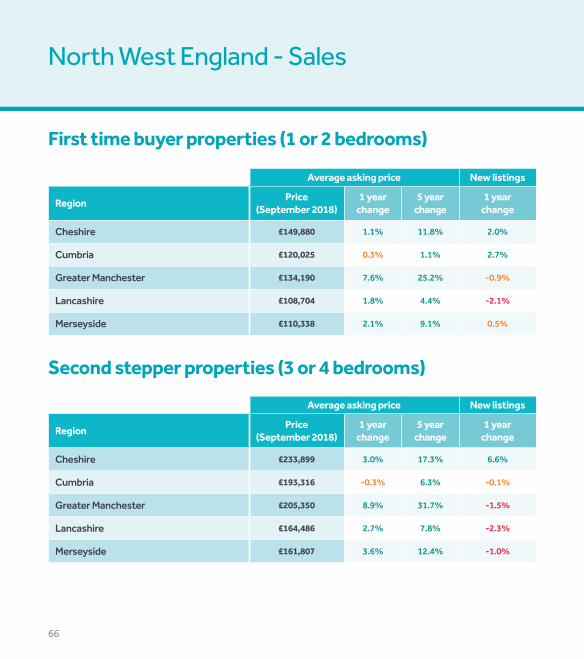
North West England - Sales
First time buyer properties (1 or 2 bedrooms)
Second stepper properties (3 or 4 bedrooms)
Average asking price New listings
Region Price(September 2018)
1 year change
5 year change
1 year change
Cheshire £149,880 1.1% 11.8% 2.0%
Cumbria £120,025 0.3% 1.1% 2.7%
Greater Manchester £134,190 7.6% 25.2% -0.9%
Lancashire £108,704 1.8% 4.4% -2.1%
Merseyside £110,338 2.1% 9.1% 0.5%
Average asking price New listings
Region Price(September 2018)
1 year change
5 year change
1 year change
Cheshire £233,899 3.0% 17.3% 6.6%
Cumbria £193,316 -0.3% 6.3% -0.1%
Greater Manchester £205,350 8.9% 31.7% -1.5%
Lancashire £164,486 2.7% 7.8% -2.3%
Merseyside £161,807 3.6% 12.4% -1.0%
New listings are Q3 2018 vs Q3 2017 67
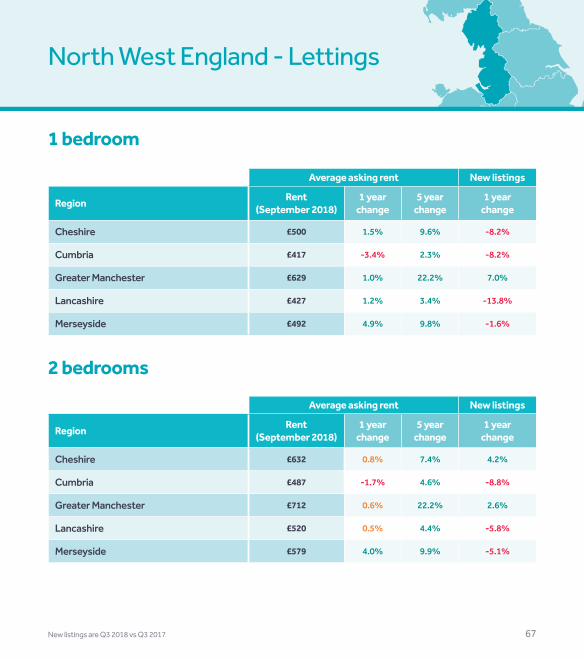
North West England - Lettings
1 bedroom
2 bedrooms
Average asking rent New listings
Region Rent(September 2018)
1 year change
5 year change
1 year change
Cheshire £500 1.5% 9.6% -8.2%
Cumbria £417 -3.4% 2.3% -8.2%
Greater Manchester £629 1.0% 22.2% 7.0%
Lancashire £427 1.2% 3.4% -13.8%
Merseyside £492 4.9% 9.8% -1.6%
Average asking rent New listings
Region Rent(September 2018)
1 year change
5 year change
1 year change
Cheshire £632 0.8% 7.4% 4.2%
Cumbria £487 -1.7% 4.6% -8.8%
Greater Manchester £712 0.6% 22.2% 2.6%
Lancashire £520 0.5% 4.4% -5.8%
Merseyside £579 4.0% 9.9% -5.1%

68
Yorkshire & The Humber - Sales
First time buyer properties (1 or 2 bedrooms)
Second stepper properties (3 or 4 bedrooms)
Average asking price New listings
Region Price(September 2018)
1 year change
5 year change
1 year change
East Riding of Yorkshire £110,839 0.7% 11.0% 2.7%
North Yorkshire £173,457 2.2% 16.4% -0.8%
South Yorkshire £103,458 2.9% 9.9% -1.2%
West Yorkshire £120,255 4.5% 12.3% -1.6%
Average asking price New listings
Region Price(September 2018)
1 year change
5 year change
1 year change
East Riding of Yorkshire £169,074 3.9% 15.3% 4.9%
North Yorkshire £261,163 4.1% 16.0% 0.1%
South Yorkshire £152,715 6.5% 16.7% 1.1%
West Yorkshire £182,135 3.8% 17.3% 1.2%
New listings are Q3 2018 vs Q3 2017 69
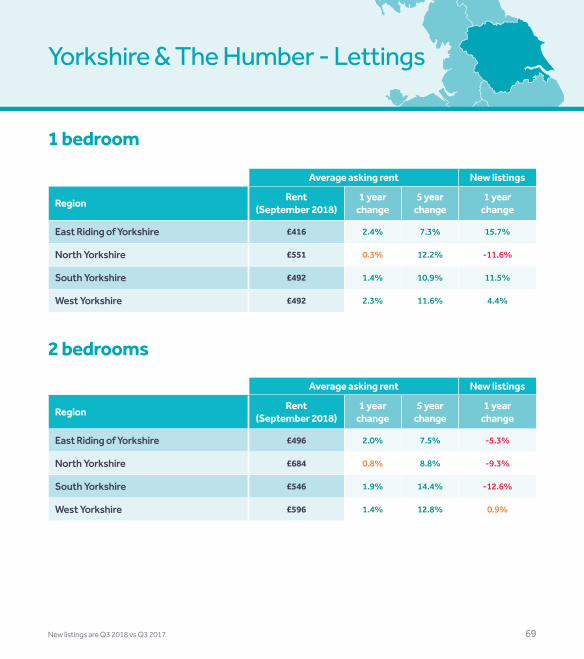
Yorkshire & The Humber - Lettings
1 bedroom
2 bedrooms
Average asking rent New listings
Region Rent(September 2018)
1 year change
5 year change
1 year change
East Riding of Yorkshire £416 2.4% 7.3% 15.7%
North Yorkshire £551 0.3% 12.2% -11.6%
South Yorkshire £492 1.4% 10.9% 11.5%
West Yorkshire £492 2.3% 11.6% 4.4%
Average asking rent New listings
Region Rent(September 2018)
1 year change
5 year change
1 year change
East Riding of Yorkshire £496 2.0% 7.5% -5.3%
North Yorkshire £684 0.8% 8.8% -9.3%
South Yorkshire £546 1.9% 14.4% -12.6%
West Yorkshire £596 1.4% 12.8% 0.9%
70
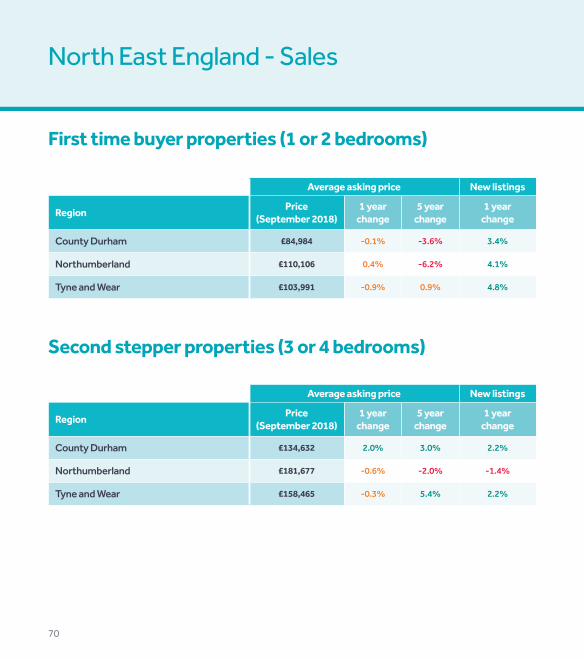
North East England - Sales
First time buyer properties (1 or 2 bedrooms)
Second stepper properties (3 or 4 bedrooms)
Average asking price New listings
Region Price(September 2018)
1 year change
5 year change
1 year change
County Durham £84,984 -0.1% -3.6% 3.4%
Northumberland £110,106 0.4% -6.2% 4.1%
Tyne and Wear £103,991 -0.9% 0.9% 4.8%
Average asking price New listings
Region Price(September 2018)
1 year change
5 year change
1 year change
County Durham £134,632 2.0% 3.0% 2.2%
Northumberland £181,677 -0.6% -2.0% -1.4%
Tyne and Wear £158,465 -0.3% 5.4% 2.2%
New listings are Q3 2018 vs Q3 2017 71
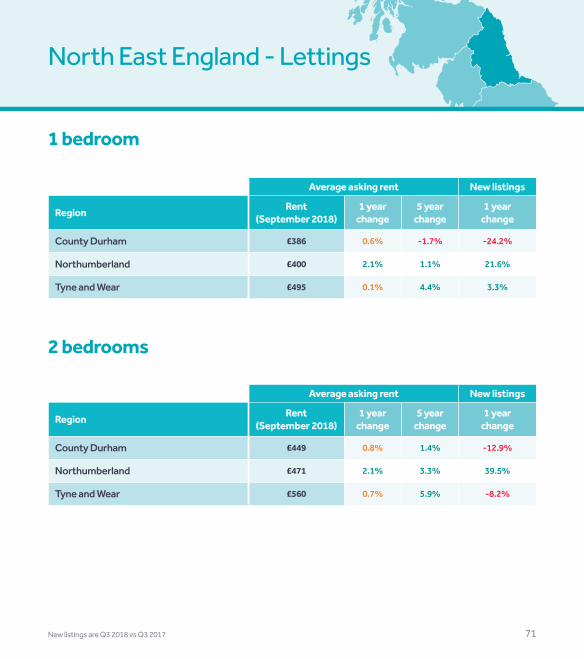
North East England - Lettings
1 bedroom
2 bedrooms
Average asking rent New listings
Region Rent(September 2018)
1 year change
5 year change
1 year change
County Durham £386 0.6% -1.7% -24.2%
Northumberland £400 2.1% 1.1% 21.6%
Tyne and Wear £495 0.1% 4.4% 3.3%
Average asking rent New listings
Region Rent(September 2018)
1 year change
5 year change
1 year change
County Durham £449 0.8% 1.4% -12.9%
Northumberland £471 2.1% 3.3% 39.5%
Tyne and Wear £560 0.7% 5.9% -8.2%
72
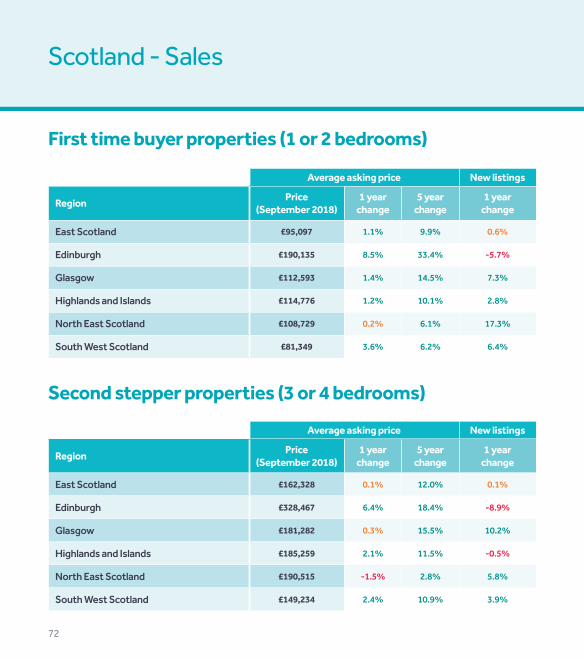
Scotland - Sales
First time buyer properties (1 or 2 bedrooms)
Second stepper properties (3 or 4 bedrooms)
Average asking price New listings
Region Price(September 2018)
1 year change
5 year change
1 year change
East Scotland £95,097 1.1% 9.9% 0.6%
Edinburgh £190,135 8.5% 33.4% -5.7%
Glasgow £112,593 1.4% 14.5% 7.3%
Highlands and Islands £114,776 1.2% 10.1% 2.8%
North East Scotland £108,729 0.2% 6.1% 17.3%
South West Scotland £81,349 3.6% 6.2% 6.4%
Average asking price New listings
Region Price(September 2018)
1 year change
5 year change
1 year change
East Scotland £162,328 0.1% 12.0% 0.1%
Edinburgh £328,467 6.4% 18.4% -8.9%
Glasgow £181,282 0.3% 15.5% 10.2%
Highlands and Islands £185,259 2.1% 11.5% -0.5%
North East Scotland £190,515 -1.5% 2.8% 5.8%
South West Scotland £149,234 2.4% 10.9% 3.9%
New listings are Q3 2018 vs Q3 2017 73
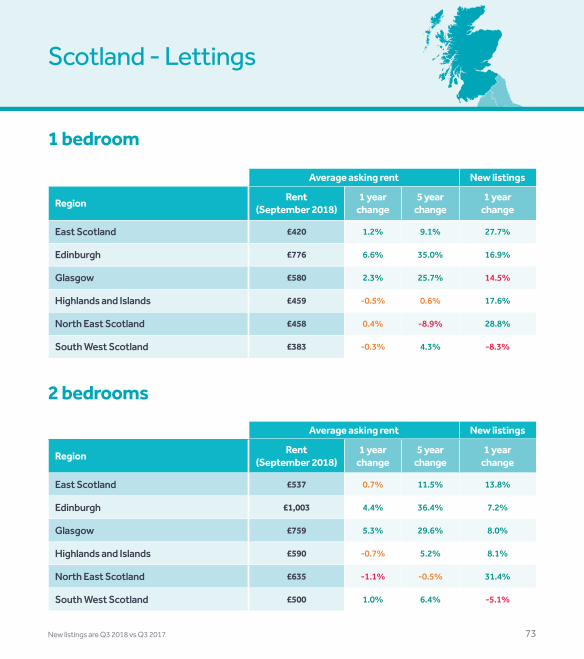
Scotland - Lettings
1 bedroom
2 bedrooms
Average asking rent New listings
Region Rent(September 2018)
1 year change
5 year change
1 year change
East Scotland £420 1.2% 9.1% 27.7%
Edinburgh £776 6.6% 35.0% 16.9%
Glasgow £580 2.3% 25.7% 14.5%
Highlands and Islands £459 -0.5% 0.6% 17.6%
North East Scotland £458 0.4% -8.9% 28.8%
South West Scotland £383 -0.3% 4.3% -8.3%
Average asking rent New listings
Region Rent (September 2018)
1 year change
5 year change
1 year change
East Scotland £537 0.7% 11.5% 13.8%
Edinburgh £1,003 4.4% 36.4% 7.2%
Glasgow £759 5.3% 29.6% 8.0%
Highlands and Islands £590 -0.7% 5.2% 8.1%
North East Scotland £635 -1.1% -0.5% 31.4%
South West Scotland £500 1.0% 6.4% -5.1%

Get the most detailed picture of your local marketRightmove Data Services provides agents and developers across the country with bespoke data, analytics and insight
Find out more:rightmove.co.uk/data