
Lithium mineralizations of Barroso-Alvão aplite … mineralizations of Barroso-Alvão...
94
Lithium mineralizations of Barroso-Alvão aplite-pegmatite field Filipa Catarina Lopes Dias Mestrado em Geologia Departamento de Geociências, Ambiente e Ordenamento do Território 2016 Orientador Alexandre Martins Campos de Lima, Professor Auxiliar, Faculdade de Ciências da Universidade do Porto Coorientador Fernando Manuel Pereira de Noronha, Professor Jubilado, Faculdade de Ciências da Universidade do Porto
-
Upload
nguyenkhanh -
Category
Documents
-
view
220 -
download
0
Transcript of Lithium mineralizations of Barroso-Alvão aplite … mineralizations of Barroso-Alvão...

Lithium mineralizations of Barroso-Alvão aplite-pegmatite field
Filipa Catarina Lopes Dias
Mestrado em Geologia Departamento de Geociências, Ambiente e Ordenamento do Território 2016 Orientador Alexandre Martins Campos de Lima, Professor Auxiliar, Faculdade de Ciências da Universidade do Porto Coorientador Fernando Manuel Pereira de Noronha, Professor Jubilado, Faculdade de Ciências da Universidade do Porto


Todas as correções determinadas pelo júri, e só essas, foram efetuadas. O Presidente do Júri,
Porto, ______/______/_________


Agradecimentos
Gostaria de apresentar os meus profundos agradecimentos a todas as
pessoas que contribuíram para que esta tese se tornasse uma realidade:
Ao professor Alexandre Lima, pela paciência com que sempre ouviu as
ideias e teorias que lhe eram propostas.
Ao professor Fernando Noronha que muito me ajudou na compreensão
e interpretação das observações feitas no trabalho de campo e na análise
petrográfica.
À professora Lia Duarte pela disponibilidade e simpatia com que me
ajudou a utilizar o software ArcGis.
À Professora Mona-Liza Sirbescu, da University Central de Michigan,
pela ajuda na compreensão e interpretação do que observei no campo.
À Sra. D.ª Irene Lopes por ter sempre tentado ir ao encontro dos
pedidos feitos, permitindo-me obter muitos dos dados que são referidos nesta
tese.
À Cátia Dias que, como minha colega na área dos pegmatitos, me
acompanhou durante a análise de problemas e em saídas de campo.
À Diana Silva por me ter dado coragem e ajudar-me quando precisei.
Aos meus pais e irmã, por me terem apoiado ao longo do decorrer desta
tese, em especial ao meu pai que perdeu muito tempo comigo.
Ao meu namorado e melhores amigas que sempre me apoiaram e
encorajaram a seguir em frente, com uma referência especial ao primeiro, que
acompanhou esta tese do início ao fim.
A todos aqueles que, embora não mencionados especificamente neste
local, de alguma forma contribuíram para a conclusão deste trabalho.

Acknowledgments
I would like to express my deepest thanks to all the people who
contributed to making this thesis a reality:
To Professor Alexandre Lima for the patience with which he always
listened to the ideas and theories that were proposed to him.
To Professor Fernando Noronha who helped me a lot in the
understanding and interpretation of the observations that I made in the fieldwork
and during the petrographic analysis.
To Professor Lia Duarte for her availability and for the friendliness with
which she helped me to use ArcGis software.
To Professor Mona-Liza Sirbescu of the Central Michigan University, for
the way she helped me understand and interpret correctly what I observed in
the fieldwork.
To Mrs. Irene Lopes for always trying to meet the requests we made,
allowing me to obtain many of the data that are referred to in this thesis.
To Cátia Dias who, as my colleague in the pegmatites theme,
accompanied me during the analysis of various problems and in all field trips.
To Diana Silva for giving me courage and helping me when I needed it.
To my parents and sister, for having supported me during the course of
this thesis, especially to my father who spent a lot of time helping me.
To my boyfriend and best friends who always supported and
encouraged me to move on. With a special reference to the first, who
accompanied this thesis from the start to the end.
To all those who, although not specifically mentioned at this place, have
somehow contributed to the completion of this work.

Abstract
The use of lithium has been increasing over the years. According to the
European Commission report of 2014 about the EU critical raw materials,
Portugal was the only significant Li producer of the EU, contributing with 0.5%
of world production from 2010 to 2014, using only the lepidolite mineral.
However, there are three Li-rich regions with spodumene and petalite that have
a high potential to be explored and that could also be an important contribution
at European level: Serra de Arga, Barroso-Alvão and Almendra-Barca de Alva.
The Barroso-Alvão Li-rich aplite-pegmatite veins are the center of this
study. However, countless aplite-pegmatite veins are known in this area and
only some of this, hosted in the metasediments of certain lithostratigraphic
units, can contain Li-mineralizations.
Therefore, in order to quickly find the Li-rich ones, were created, through
ArcGIS software, catchment basins to which were assigned the Li-contents of
stream sediments obtained in previous studies of the aplite-pegmatite field of
Barroso-Alvão. The created basins have less than 2km², and display the Li-
contents analyzed from the stream sediments of 654 sampling points. This way
it was created a probability map, with Li-rich areas. It was also possible to
define among the Li-rich areas, areas with higher probability of containing
petalite aplite-pegmatite veins, through the assignment of Sn-contents to the
catchment basins, using the known relation of petalite with cassiterite.
During the field work done in this area, 12 Li-rich aplite-pegmatite
veins were observed, as well as, 4 others that are now old Sn mining works.
Of the 12 Li-rich veins, 6 were first identified, as having Li-mineralizations, in
the course of this thesis.
Most of the aplite-pegmatite veins studied in this work are petalite
subtype, despite de fact of existing also spodumene ones, and a large
portion of the first has later spodumene (SQI - Spodumene Quartz
Intergrowth). In order to better understand this aplite-pegmatite veins that
contain both petalite and spodumene, and where the spodumene can be a
petalite replacement, there were also made some petrographic studies.

Resumo
O uso do lítio tem vindo a aumentar ao longo dos anos. Segundo um
relatório da Comissão Europeia de 2014 sobre os materiais críticos para a UE,
Portugal era o único produtor significativo de Li da UE, tendo contribuído com
0.5% da produção mundial entre 2010 e 2014, usando apenas o mineral
lepidolite. No entanto, existem três regiões ricas em Li, com espodumena e
petalite, com um alto potencial para serem exploradas e que também poderiam
ser importantes contribuidores a nível europeu: Serra de Arga, Barroso-Alvão e
Almendra-Barca de Alva.
Os filões aplito-pegmatíticos ricos em Li do Barroso-Alvão são o centro
deste estudo. No entanto, são reconhecidos numerosos filões aplito-
pegmatíticos nesta área e apenas alguns dos filões aplito-pegmatíticos,
encaixados em metassedimentos de certas unidades litoestratigráficas, podem
conter mineralizações litiníferas.
De modo a encontrar mais rapidamente os filões mineralizados em Li,
criaram-se, através do software ArcGIS, bacias de drenagem às quais foram
atribuídos os teores de Li de sedimentos de corrente, obtidos em estudos
anteriores, do campo aplito-pegmatítico do Barroso-Alvão. Deste modo
criaram-se áreas inferiores a 2km² com os teores de Li constatados nos
sedimentos de corrente dos 654 pontos de amostragem, obtendo-se assim um
mapa de probabilidades de áreas ricas em Li. Também foi possível definir entre
as áreas ricas em Li, áreas com maior probabilidade de conter filões aplito-
pegmatíticos de petalite, através da atribuição se teores de Sn às bacias de
drenagem, usando a relação, já conhecida, da petalite com a cassiterite.
Durante o trabalho de campo feito neste local, observaram-se 12 filões
aplito-pegmatíticos mineralizados em Li e 4 outros que correspondem a antigas
explorações de Sn. Dos 12 filões mineralizados em Li, 6 foram identificados,
como mineralizados em Li, pela primeira vez, no decorrer desta tese.
A maioria dos filões aplito-pegmatíticos estudados são de petalite,
apesar de também existirem de espodumena, e uma grande parte dos
primeiros possui espodumena posterior à petalite (SQI – Spodumene Quartz
Intergrowth). De forma a melhor entender os filões aplito-pegmatíticos que

contém tanto petalite, como espodumena, e onde a espodumena pode
substituir a petalite, fizeram-se também alguns estudos petrográficos.

Keywords
Pegmatites, Li, spodumene, petalite, ArcGIS

Palavras-chave
Pegmatítos, lítio, espodumena, petalite, ArcGIS

Table of Contents
Agradecimentos v
Acknowledgments vi
Abstract vii
Resumo viii
List of Figures xiv
List of Tables xviii
List of abbreviations xix
Chapter 1 – Introduction 21
Chapter 2 – Geological Setting 27
Chapter 3 – Desk work with ArcGIS software 37
Chapter 4 – Field work and sampling 45
4.1. N312-1 and N312-2 aplite-pegmatite veins 51
4.2. CHN3 aplite-pegmatite vein 53
4.3. Alijó aplite-pegmatite vein 55
4.4. Pinheiro aplite-pegmatite vein 58
4.5. Vila Grande aplite-pegmatite vein 59
4.6. Lousas aplite-pegmatite vein 60
4.7. AL56 aplite-pegmatite vein 63
4.8. Gondiães aplite-pegmatite vein 65
4.9. Dias 1 aplite-pegmatite vein 66
4.10. Dias 2 aplite-pegmatite vein 66
4.11. Dias 3 aplite-pegmatite vein 67
Chapter 5 – Petrographic and mineralogical study 69
5.1. AL56 71

5.2. CHN3 74
Chapter 6 – Discussion and conclusions 79
References 83
List of websites consulted 88
Annexes 91
Annex 1 93
Annex 2 94

List of Figures
Fig. 1- Lithium world production, in tonnes, from 2010 to 2014. The trend
line as a positive slope. (Reichl et al., 2016) .................................................... 23
Fig. 2 – Lithium world production from 2010 to 2014 (Reichl et al., 2016)
........................................................................................................................ 24
Fig. 3 - Geologic map of the study area located in Barroso-Alvão aplite-
pegmatite field. Most of the known Li-rich aplite-pegatite veins are located in
and units. Adapted from “Mapa Geológico de la Península I érica, Baleares
y anarias`” scale 1:1 000 000, 2015 edition. Availa le in IGME (Instituto
Geológico y Minero de España) website, 26 Jan. 2016. This geological map
was created by IGME and LNEG (Laboratório Nacional de Energia e Geologia)
(Portugal). ....................................................................................................... 29
Fig. 4- Gondwana and Rheic oceans. Adapted from “Key time slices in
North American History” from “Li rary of Paleogeography”, olorado Plateau
Geosystems, Inc website, retrieved: 15/02/2016 ............................................. 30
Fig. 5 – Lithostratigraphic units of TMSD (Ribeiro, 1999) .................... 31
Fig. 6 - Lithostratigraphic units of CSD (Ribeiro, 1999) ........................ 32
Fig. 7- PT diagram of spodumene, eucriptite and petalite stability fields.
Adapted from: fig. 7-7, pag. 116, ook “Pegmatites” of David London, 2008,
Mineralogical Association Canada ................................................................... 34
Fig. 8 - Schematic representation of the P-T fields of the pegmatites host
rock, where you can observe the following classes: abyssal (AB), muscovite
(MS), rare muscovite elements (MSREL), rare elements (REL) and miarolitic
(MI). Arrows indicate regional fractionation trends present in pegmatites in
relation to metamorphic gradients of the wall rocks. In some cases there are
passages of a class to another, such as in cases of MS classes and MSREL,
and in the cases of classes REL and MI (figure obtained from Cerny and Ercit
2005). .............................................................................................................. 35
Fig. 9 - (A) Satellite image of the study area retrieved from the “World
Imagery” map service of ArcGI v. 10.3. (B) Representation of the flow direction
image within the study area (“clip_fllow”). ........................................................ 40
Fig. 10 – Representation of the “flow_accum” raster-based file that
resulted from the “Flow Accumulation” tool. The lack pixels represent the 0-70
class and white pixels represent the 70-479464 class, allowing the view of the
waterlines. The red points represent the “ ” points. ...................................... 40

Fig. 11 – Representation of “ etNull” raster-based file that resulted from
the “ et Null” tool. The lack pixels have a value of 1 and represent the
waterlines within the study area. ...................................................................... 41
Fig. 12 – Representation of the catchment basins raster image
(“ acias_raster”) resultant from the Watershed tool. Each color represents one
catchment asin that was created from a “ ” point and from the “clip_flow”
raster image, that provided the information about the flow direction according to
the terrain topography. .................................................................................... 41
Fig. 13- Conversion errors from the raster image to the shapefile. (A)
Representation of the catchment basins raster-based file. (B) Representation of
the result of the conversion to a shapefile with the resulting subdivision of some
catchment basin polygons into small individual ones. (C) Representation of the
new and corrected catchment basins shapefile. .............................................. 42
Fig. 14 – Representation of “Bacia_dreno_final” file, where each color
represents a different class of Li contents. ....................................................... 43
Fig. 15 - Locations of the 12 Li-mineralized veins observed in the field,
together with the representation of the Li-bearing catchment basins, as well as
the mining concessions that can be found here. .............................................. 49
Fig. 16 - Locations of the 12 Li-mineralized veins observed in the field,
together with the representation of the Sn-bearing catchment basins, as well as
the mining concessions that can be found here. .............................................. 50
Fig. 17 – (A) Legend with the symbols, structures and lithostratigraphic
units from the geological maps shown in fig. 15 and Fig. 16, corresponding to
sheet 6C - Cabeceiras de Basto, scale 1: 50000. (B) Li- and Sn-content classes
used in the representation of the catchment basins from fig. 15 and fig. 16. .... 50
Fig. 18 – Feldspar crystals growing in a comb structure from the aplite-
pegmatite (N312-2) contact with the country rock. ........................................... 51
Fig. 19 – Localization of N312-1 and N312-2 aplite-pegmatite veins on
the Li-bearing (fig. 19A) and Sn-bearing (fig. 19B) catchment basins maps,
using 6D - Vila Pouca de Aguiar sheet of the Geological Map of Portugal. The
blue lines represent the waterlines. ................................................................. 52
Fig. 20 – Petalite crystal from CHN3 aplite-pegmatite vein. .................. 53
Fig. 21 - Two shear-zones cross-cutting the aplite-pegmatite vein: a
shear-zone with attitude N132 °; SV and a later one with attitude N160 °; SV.
Both are right-lateral (indicated by the yellow arrows). ..................................... 54

Fig. 22 - (A) Small shear-zone filled by quartz and with spodumene in
the edges, observed in CHN3 aplite-pegmatite vein. (B) Close-up of the shear-
zone represented in fig. 22A. ........................................................................... 54
Fig. 23 – Alijó aplite-pegmatite vein exploration site. (A) Exploration site
photo. (B) Satellite image of the exploration site. Google Earth adapted image.
(C) Schematic figure representative of the contacts directions observed in the
exploration site of the aplite-pegmatite vein and of a shear plane located north
of the exploration. ............................................................................................ 55
Fig. 24 – D3 shear corridor at the exploration site of Alijó aplite-
pegmatite vein ................................................................................................. 56
Fig. 25 – (A) Collected sample with several spodumene crystals. (B)
Close-up of fig. 25.A. ....................................................................................... 57
Fig. 26 - Pinheiro aplite-pegmate vein. (A) Satellite image with the
representation of the structural setting observed during field work. This image
was adapted using the ArcGIS 10.3 World Imagery service. (B) Spodumene
crystal. ............................................................................................................. 58
Fig. 27 - Location of Pinheiro aplite-pegmatite vein on the Li-bearing
(fig.27A) and Sn-bearing (fig.27B) catchment basin maps, using the 6C -
Cabeceiras de Basto sheet, from the Geological Map of Portugal. The blue lines
and lue points represent the waterlines and “ ” points respectively............. 58
Fig. 28 - (A) Columbo-tantalite and petalite from Vila Grande aplite-
pegmatite vein. (B) Close-up of the columbo-tantalite crystal from fig. 28A. .... 59
Fig. 29 - Vila Grande aplite-pegmatite vein location on the Li-bearing (fig.
29A) and Sn-bearing (fig.29B) catchment basin maps, using 6C - Cabeceiras de
Basto sheet, from the Geological Map of Portugal. The blue lines and blue
points represent the waterlines and “ ” points respectively. .......................... 59
Fig. 30 - Spodumene with quartz intergrowths (SQI - Spodumene Quartz
Intergrowth) ..................................................................................................... 60
Fig. 31 - Petalite crystals randomly distributed in Lousas aplite-pegmatite
vein. In these crystals can be seen very well the translucent appearance of
fresh petalite. ................................................................................................... 61
Fig. 32 – Location of Lousas aplite-pegmatite vein on the Li-bearing (fig.
28A) and Sn-bearing (fig.28B) catchment basin maps, using 6C - Cabeceiras de
Basto sheet, from the Geological Map of Portugal. The blue lines and blue
points represent the waterlines and “ ” points respectively. .......................... 61
Fig. 33 - Direction of the pegmatitic melt and petalite crystals
fragments of Lousas aplite-pegmatite vein. The arrows indicate the fluid

direction and the black dashed lines represents the crystallization fronts.
The red dashed line outline the petalite broken crystals area, being that
they are the darker ones. .............................................................................. 62
Fig. 34 - Deformed feldspars from the aplite-pegmatite vein located in
the AL56 vein area. ......................................................................................... 63
Fig. 35 – Sample with SQI crystals from the aplite-pegmatite vein
located in the AL56 vein area. ......................................................................... 63
Fig. 36 - Location of the aplite-pegmatite vein present in the AL56 vein
area in the Li-bearing (fig.36A) and Sn-bearing (fig.36B) catchment basin maps,
using the 6C - Cabeceiras de Basto sheet, from the Geological Map of Portugal.
........................................................................................................................ 64
Fig. 37 - Gondiães aplite-pegmatite vein location on Li-bearing (fig. 36A)
and Sn-bearing (fig. 36B) catchment basin maps, using 6C - Cabeceiras de
Basto sheet, from the Geological Map of Portugal. .......................................... 65
Fig. 38 – Petalite crystals from Dias 1 aplite-pegmatite vein sample. ... 66
Fig. 39 – Dias 3 aplite-pegmatite vein location on the Li-bearing (fig.
39A) and Sn-bearing (Fig. 39B) catchment basin maps, using the 6D - Vila
Pouca de Aguiar sheet, from the Geological Map of Portugal. ......................... 67
Fig. 40 - Aplite-pegmatite vein sample from AL56 aplite-pegmataite vein
area, where it can be seen with the naked eye, a petalite crystal being replaced
by spodumene + quartz (SQI). This sample also contains other petalite
crystals. ........................................................................................................... 71
Fig. 41 - Thin section photomicrograph from the sample referred above
(fig. 40) where a petalite crystal is being replaced by spodumene + quartz
(inside the red dashed line), next to another petalite crystal (on the right side).
(A) Plane polarized light. (B) Cross polarized light. .......................................... 71
Fig. 42 – Photomicrograph of some of the spodumene aspects from
aplite-pegmatite vein in the area of AL56 vein. (A) Lateral replacement of
petalite by spodumene and quartz. (B) SQI replacement in another petalite
crystal, where the spodumene + quartz resemble a symplectite texture. (C)
Close-up on the spodumene and quartz within the main petalite crystal from
figure 40 and figure 41. .................................................................................... 73
Fig. 43 – Shear corridor from CHN3 aplite-pegmatite vein, with
ultramylonitic to mylonitic texture, where most of the ocelli indicate that this is a
dextral shear. (B) Ocelli in plane polarized light. (C) Ocelii in cross polarized
light. The yellow arrows show the ocelli indicating that this is a dextral shear. . 74

Fig. 44 - Photomicrograph of petalite being replaced by spodumene and
quartz (SQI) from CHN3 aplite-pegmatite vein. ................................................ 76
Fig. 45– Photomicrograph of some features of spodumene from CHN3
aplite-pegmatite vein. (A) Largest spodumene and quartz crystals in an
elongated aggregate, where it’s possi le to see the sympletite texture at one
end. (B) Close-up of fig. 41A. (C) Small spodumene and quartz crystals in a
elongated aggregate. (D) Close-up of Fig. 41C. (E) Small spodumene crystals
posterior to the shear. ...................................................................................... 77
Fig. 46 – Photomicrograph with some features of the CHN3 thin section.
(A) Ambligonite ocelli with pressure shadows. (B) Albites with deformation
induced twinning and bent twinning. (C) Vermicular quartz inclusions on an
albite crystal. (D) Small crystals of quartz and albite forming what seems to be a
mosaic. (E) Quartz resulting from dynamic recrystallization. (F) Deformed
moscovite. (G) Microcline with the typical cross-hatched twin pattern (H)
Fractured cassiterite. (I) Deformed cassiterite within a shear corridor. (J) Apatite
inclusion on quartz........................................................................................... 78
Fig. 47 – Location of Romano old Sn mine (green point) in the Li-
bearing (fig.47A) and Sn-bearing (fig.47B) catchment basin maps. The
coordinates of this aplite-pegmatite vein are 41°44'14.592'' W7°
43'43.591''W. The red outline represents the planned drill area by Dakota
Minerals. In Pires (2005) this zone had already been identified has having
high Li-contents, as represented by the black counter lines in the fig.47A.
The catchment basins create now smaller and more precise Li-rich areas.
........................................................................................................................ 81
List of Tables
Table 1 – Some examples of brine deposits with Li concentrations (ppm)
(Moura and Velho, 2011)……………………………………………………………22

List of abbreviations
Ppm – Parts per million
UE – European Union
LNEG – Laboratório Nacional de Energia e Geologia
GTMZ – Galicia Trás-os-Montes Zone
CIZ – Central Iberian Zone
CSD – Carrazedo Structural Domain
TMSD – Três Minas Structural Domain
SV – Subvertical
SH – Subhorizontal
Pet – Petalite
Qtz – Quartz
Spd – Spodumene
SQI - Spodumene Quartz Intergrowth
SS – Stream sediments
FD – Flow Direction
D1, – First phase of deformation of Variscan Orogeny
D2 – Second phase of deformation of Variscan Orogeny
D3 – Third phase of deformation of Variscan Orogeny
1 – Main foliation resulting from D1
- Main foliation resulting from D2
3 - Main foliation resulting from D3

20

21
Chapter 1 – Introduction

22

23
Nowadays, lithium (Li) is mainly used in the ceramics and glass industries, but
its use has been increasing due to the manufacture of rechargeable batteries, used, for
example, in portable electronic equipment (European Comission, 2014).
During the geological evolution of the earth's crust, sometimes "traps" are
formed, allowing the concentration of some chemical elements. These “traps” tend to
exceed the average abundance of these elements in the Earth's crust.
Lithium abundance in Earth's crust is 20 ppm. However, quantities economically
exploitable can be found both in pegmatites and in brine deposits. The later have
volcanic contribution and the lithium is concentrated through solar evaporation.
Obtaining Li through the brine deposits become less expensive than the
metallurgical processing required when exploiting pegmatites. However, if in the
coming years the consumption of lithium increases, as expected, the pegmatites will be
more valued since they are an important source of lithium (European Comission,
2014a; Moura and Velho, 2011).
Fig. 1- Lithium world production, in tonnes, from 2010 to 2014. The trend line as a positive slope. (Reichl et al., 2016)
The use of lithium has been increasing in the automotive industry, for which the
technology of choice used in the electric and hybrid vehicles batteries is the lithium ion.
As this type of vehicle is, at this moment, a world bet, there are those who already
consider it the gasoline of the future.
In 2014, a report of critical raw materials for the European Union (EU) indicated
that the main uses of lithium were 30% in the industries of ceramics and glass and 22%
in electric batteries.
The EU is a major importer of Li, and imports about 13,000t per year of Li
carbonate and Li oxides and hydroxides. Most of this is imported from Chile (European
Comission, 2014a).
24
Brine deposits have become the main mineral resource of lithium and the
largest reserves in the world are located precisely in Chile, which has half of world
reserves, not to mention the other countries of South America that also have significant
reserves.
According to the report on critical materials for the European Union in 2014, the
United States Geological Survey (USGS) said that the world reserves of lithium are
about 40 million tons (European Comission, 2014a).
Table 1 – Some examples of brine deposits with Li concentrations (ppm) (Moura and Velho, 2011)
South America
Chile 1000 - 5000 ppm
Argentina 100 - 700 ppm
Bolivia 100 - 500 ppm
Asia Tibet 700 - 1000 ppm
China 100 ppm
North America Nevada (EUA) 100 - 300 ppm
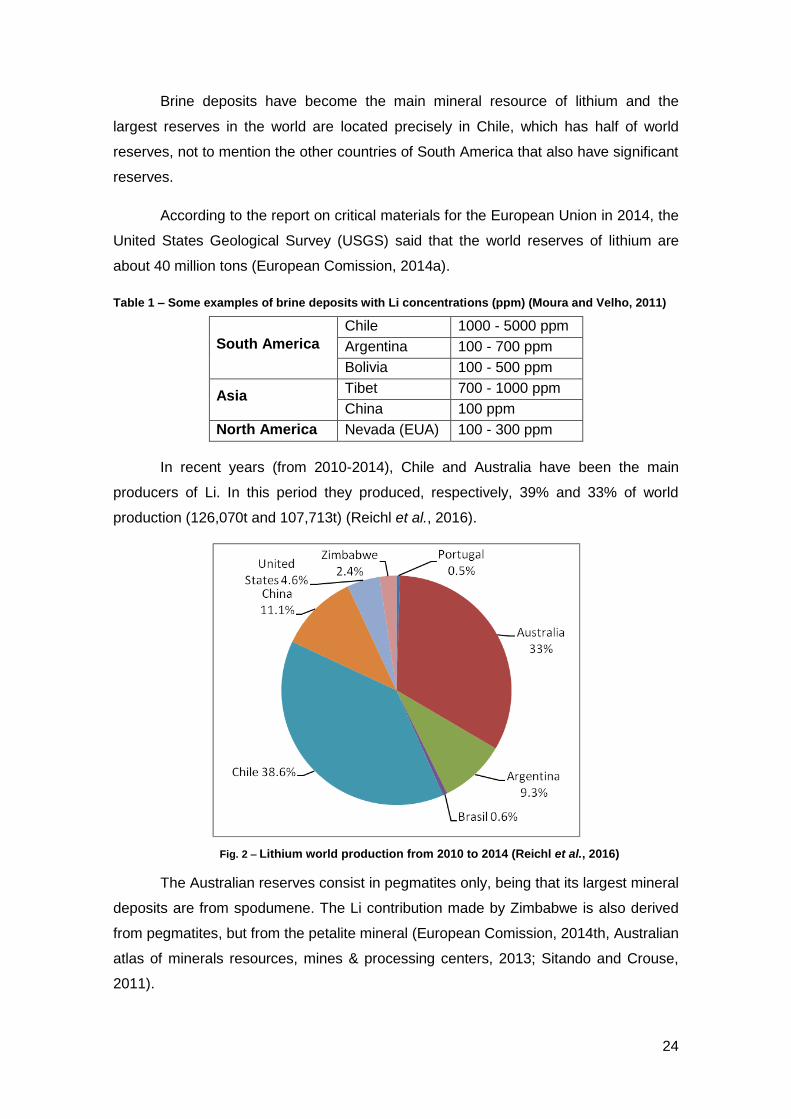
In recent years (from 2010-2014), Chile and Australia have been the main
producers of Li. In this period they produced, respectively, 39% and 33% of world
production (126,070t and 107,713t) (Reichl et al., 2016).
Fig. 2 – Lithium world production from 2010 to 2014 (Reichl et al., 2016)
The Australian reserves consist in pegmatites only, being that its largest mineral
deposits are from spodumene. The Li contribution made by Zimbabwe is also derived
from pegmatites, but from the petalite mineral (European Comission, 2014th, Australian
atlas of minerals resources, mines & processing centers, 2013; Sitando and Crouse,
2011).

25
According to European Comission (2014) and Reichl et al. (2016), until 2014,
Portugal was the only EU country with significant reserves of lithium that has been
contributing to the world production, through the lepidolite mineral of aplite-pegmatite
origin from Goncalo-Vela area (Guarda district). This area has been indicated as
having the highest gross reserves of Li in Portugal. According to Moura and Velho
(2011), Ramos (2000) assessed them as being more than 1 400 000t.
From 2010 to 2014, Portugal has contributed to the lithium world production
with 1 615t (Moura and Velho, 2011; European Comission, 2014, Reichl et al., 2016).
The minerals considered more important for obtaining Li are spodumene
(LiAl i2 6), lepidolite K2(Li,Al)5-6( i
6-7Al2-1 20)( ,F) , amblygonite
(LiAl(P )(F, )) and Petalite (LiAl i 10), corresponding to them, theoretically, 3.7%
Li, 3.6% Li, 4.7% Li, 2.3% Li, respectively. However, due to substitutions which
generally occur between different elements, spodumene content ranges from 1.3% -
3.6%, the lepidolite content between 1.4% - 1.9%, the amblygonite content between
3.5% - 4.2% and the contents of petalite between 1.6% - 2.1% (European Comission,
2014; Moura and Velho, 2011; Kogel et al., 2006).
According to the report on critical materials for the European Union in 2014, the
United States Geological Survey (USGS) reported the existence of two lithium related
mining projects, namely, a spodumene exploration project in Finland and a jadarite
mining operation in Serbia, which is a candidate country to the European Union.
The mineral jadarite (LiNaB₃SiO₇(OH)) is a new species recently discovered in
Serbia, to which was assigned theoretically a 3.4% Li-content (Bryner et al., 2013).
Despite the fact of the European Comission (2014) stating that the Portuguese
significant amount of lithium production is derived from the lepidolite mineral, there are
three Li-rich regions with spodumene and petalite that have a high potential to be
explored and that could also be an important contribution at an european level: Serra
de Arga, Barroso-Alvão and Almendra-Barca de Alva (Viegas et al., 2012; European
Comission, 2014).
The Li-rich aplite-pegmatite veins of Barroso-Alvão are the center of this
study. Some of the studied aplite-pegmatite veins were already known to be Li-
mineralized, but in other veins these mineralizations weren't identified until the
development of this study. For example, Alijó aplite-pegmatite vein, in which the
main lithium mineral is spodumene, were already appraised 402,800t of ore with an
average grade of 1.40% of Li₂O (0.65% Li, or 6500ppm) (Moura and Velho, 2011).
26
The aplite-pegmatite field of Barroso-Alvão has a lot of aplite-pegmatite veins,
some of which have been explored in the past to obtain Sn. Currently the only lithium
veins explorations are for the ceramics and glass industries.
The lithium concentrations within mining concessions with aplite-pegmatite
veins, that have a lot of spodumene and petalite with high Li-contents, should also be
seen as a potential source of Li-carbonate for the chemical industry. Meanwhile, the
veins with petalite should be considered better for the ceramics and glass industries
since they usually have a low content of iron and other contaminants (Lima et al, 2011).
The lithium potential of the aplite-pegmatite field Barroso-Alvão was first
discovered in 1987, during a petrographic study of granites and the elaboration of the
geological mapping of 6C sheet (Cabeceiras de Basto), scale 1: 50000, of the
Geological Map of Portugal.
The team of Professor Fernando Noronha, during the preparation of the four
geological maps covering this area at 1: 50000 scale (6-A, Montalegre, 6-B, Chaves; 6-
C, Cabeceiras de Basto, 6-D, Vila Pouca de Aguiar) charted a lot of aplite-pegmatite
veins, including veins with spodumene, which were the first lithium mineralized veins to
be described.
At this time, it was also taken into account the pegmatites with lepidolite and
phosphates of the amblygonite-montebrasite series and aplites associated with tin
mineralizations, as well as the host rocks and their tectonic setting.
Many of the aplite-pegmatite veins observed in the Barroso-Alvão aplite-
pegmatite field were exploited to obtain cassiterite as tin ore, but most of the methods
used for its exploration were artisanal causing the choice of the most friable ones.
In 2003, under the guidance of Professor Alexandre Lima, it was discovered
aplite-pegmatite veins in which petalite was the dominant phase, when compared to
spodumene.
Because of the importance of these mineralizations, there have been several
studies at the mineralogical, petrological, and geochemical levels, spatial analysis and
in the exploration context, such as Charoy and Noronha (1988) Dória et al. (1989)
Noronha e Charoy (1991), Charoy et al. (1992); Pires (1995), Amarante et al. (1999),
Farinha and Lima (2000), Lima (2000), Charoy et al. (2001), Martins (2009), Martins
and Lima (2011) and Silva (2014).

27
Chapter 2 – Geological Setting

28

29
The Barroso-Alvão aplite-pegmatite field is located in the Trás-os-Montes
region, North of Portugal. From the geotectonic point of view, it is located in the
Northwest of the Hesperic Massif, in the parautochthonous metasedimentary
sequences of the "Galicia Trás-os-Montes Zone" (GTMZ), more precisely, to the west
of Régua-Verín fault. As indicated in geological
cartography the host-rocks of the Li-
rich aplite-pegmatite veins are
metasedimentary sequences of early
Paleozoic (late Ordovician to
Devonian), with low to medium grade
metamorphism.
Fig. 3 - Geologic map of the study area located in Barroso-Alvão aplite-pegmatite field. Most of the known Li-
rich aplite-pegatite veins are located in and
units. Adapted from “Mapa Geológico de la Península I érica,
Baleares y anarias`” scale 1:1 000 000, 2015 edition. Available in IGME (Instituto Geológico y Minero de España) website, 26 Jan. 2016. This geological map was created by IGME and LNEG (Laboratório Nacional de Energia e Geologia) (Portugal). (http://info.igme.es/cartografiadigital/datos/geologicos1M/Geologico1000_(2015)/pdfs/EditadoG1000_(2015).pdf)

30
The GTMZ tectonic setting is due
to the Variscan Orogeny, defined by a
succession of three main deformation
phases (D1, D2 and D3). These three
phases produced three main foliations in
the host-rocks of the aplite-pegmatite veins
( 1, 2, 3) (Martins, et al., 2006; ant’
Ovaia, et al., 2011).
The Variscan mountain range was
the result of the continental collision of
Laurasia and Gondwana, closing the Rheic
ocean, and creating an overthrust of
several structural units (crustal nappes),
separated by thrust faults, that built the
GTMZ.
The boundary of this zone is
marked by a large D2 thrust fault that places all allochthonous and parautochthonous
nappes over the autocthonous sequences (Douro Inferior Domain of CIZ - Central
Iberian Zone) (Noronha, et al., 2006).
D1 phase generated folds with a predominant orientation NW-SE.
Parautochthonous units folding has a dipping axial plane and an 1 foliation that was
later reoriented by phase D2.
D2 phase has a continuity in style with D1 phase, highlighting the SE folding dip,
creating overturned folds, with a very short limb. In the parautochthonous units, the D2
phase forced 1 foliation to be horizontalized, resulting in a crenulation cleavage ( ).
D3 phase is represented by a small amplitude folding, with a vertical axial plane,
as well as vertical ductile shear zones. On a regional scale, the parautochthonous
units show the results of D3 phase by folds of subhorizontal hinge and N100° to N120°
subvertical axial plane.
Afterwards a period of ductile-brittle and brittle deformation succeeded (late-D3
and post-D3) creating a conjugated fractures systems with NNE-SSW and NNW-SSE
azimuths, where the first orientation is the more considerable. An example of the NNE-
SSW fractures system is the Régua-Verin fault that was nucleated in D3 phase and
Fig. 4- Gondwana and Rheic oceans. Adapted from “Key time slices in North American History” from “Li rary of Paleogeography”, olorado Plateau Geosystems, Inc website, retrieved: 15/02/2016 (http://cpgeosystems.com/images/NAM_key-375Ma.jpg)

31
then reactivated as strike-slip fault. In this fault we can see two different crustal levels,
a deeper level located to the west of the fault and another one less deep on the east
side (Noronha et al., 2006, Ribeiro, 1998; ant’ vaia et al., 2011).
GTMZ parauthochtones units are divided in two domains from a
lithostratigraphic, lithochemistry and structural point of view, separated by a larger
thrust fault (Palheiros-Vila Flor trust fault).
Both these domains have different designations on the 6-C and 6-D sheets of
the Geologial Map of Portugal, scale 1:50000: in 6-C the lower domain is identified as
Lower Parautochthonous, and the upper domain as Upper Parautochthonous, while in
6-D this are identified as Três Minas Structural Domain (TMSD) and Carrazedo
Structural Domain (CSD) respectively.
The parautochthonous units of GTMZ, have similar lithostratigraphic
characteristics to the authoctonous units of CIZ, being that the DETM units are
correlated with authoctonous units of the Lower Douro Domain.
The paleographic interpretation of the Parautochthonous Domain, of GTMZ,
indicates deposition in the margin of Gondwana, where the CIZ authoctonous was
deposited, from Pre-Cambrian to Devonian. The lithogeochemistry composition of
parautochthonous units indicates that initially the sedimental basin was an anoxic
environment, suggesting a passive margin (TMSD), and latter became a more oxigen
rich environment, active margin (CSD).
The TMSD (fig. 5)
consists of two lithostratigraphic
units, called Fragas Negras unit
(base unit) and Curros unit (top
unit), but only the unit of Fragas
Black was individualized in
aplite-pegmatite field Barroso -
Alvão, at west of Régua-Verin
fault. This unit is correlative with
the authoctonous units of the
Marão region, such as the
formation of Campanhó, and corresponds to Sᵃ unit in 6-C sheet.
Fig. 5 – Lithostratigraphic units of TMSD (Ribeiro, 1999)

32
As for the CSD (fig.
6), at west of Régua-Verín
fault, only the Rancho sub-unit
and Santa Maria de Emeres
unit are individualized. These
correspond to Sb unit and the
Sc unit in 6-C sheet,
respectively.
The structural unit of Fragas Negras surfaces in alternating narrow bands with
an azimuth of N120°, which repeat due to a tight folding. This unit is rich in organic
matter, consisting of quartz-phyllites and gray to black phyllites, interlayered with
lidytes rocks that can change laterally to gray quartzites and calcosilicate rocks and
black carbonate rocks.
The Ranch sub-unit has several black lithologies, such as black schists and rare
lidytes. It is also composed of gray phyllite and predominant black schists with sporadic
lidytes that, like in the previous unit, can change laterally to gray quartzite. In this unit,
there are also some intercalated calcosilicate rocks, some striped quartz-feldspathic
levels and acid metavulcanic rocks.
The unit of Santa Maria de Emeres consists of feldspathic strips, black schists,
and some lidytes, phyllites, calcosilicate rocks, quartzite and some acid metavulcanic
rocks (Sant 'Ovaia et al., 2011) (Noronha et al., 2006).
As can be seen in figure 5, Santa Maria de Emeres unit overthrusts Rancho
sub-unit, which in turn, overthrust the Fragas Negras unit.
In the vicinity of the aplite-pegmatite field different types of granitoids occur:
post-tectonic biotite granitoids with calcic plagioclase of Vila Pouca de Aguiar and of
Gerês, sintectonic two-mica granites of Cabeceiras de Basto complex, of Serra do
Barroso and of Chaves, and sintectonic two-mica granitoids with predominant biotite of
Vila Pouca de Aguiar and of the Domo do Barroso-Alvão (Lima and Noronha, 2006).
The continental collision caused a crustal thickening during D1 and D2 phases,
favored by the overthrust of the crustal nappes. This allowed the formation of syn-D3
sintectonic granites by crustal anatexis, that intruded in the cores of D3 structural
antiforms. These are two-mica granites with dominant muscovite (leucogranite),
originated at a mesocrustal level derived from a wet peraluminous magma related,
Fig. 6 - Lithostratigraphic units of CSD (Ribeiro, 1999)
33
therefore, with the metamorphic processes. Thus, these granites were also marked by
a 3 foliation, NW-SE.
The relation of the metamorphic processes with sintectonic and tardi-tectonic
granites in the study area is evident. The granites have an elongated shape, of NW-SE
direction, parallel to the regional structure. Also, along Cabeceiras de Basto granite,
and at shouth of Fragas Negras unit it's possible to see regional metamorphism
isograds, parallel to the igneous contacts and lithostratigraphic contacts resulting from
the thermal peak, late-D3 to syn-D3, derived from a prograd dinamotermal evolution.
This evolution is expressed by the occurrence of early staurolite, relative to andalusite,
and by the existence of andalusite and cordierite poikilitics, late- to post- tectonic.
According to Lima (2000), data from Holtz (1987) allowed to classify the
sintectonic two-mica granites of Cabeceiras de Basto and Barroso as a type of granite
strongly differentiated through Bouseily El & El Sokkary (1975) diagram.
The post-tectonic biotite granitoids with calcic plagioclase, occur in massives
with an elongated form, that takes advantage of deep fractures, generated at the end of
D3-phase, to intrude. They are considered as having originated at a deep crustal level,
are subalkaline and usually intrude in the upper crust since they are formed by a dry
magma that can travel longer distances over the crust. An example of this type of
granites is Vila Pouca de Aguiar granite (Sant 'Ovaia et al., 2011; Noronha et al.,
2006).
According to a genetic model, created in recent studies, the rare elements-rich
pegmatites may result from a low melting rate of crustal material with successive
injections of different melts, favored by regional shear-zones, as it seems to happen in
Monts d'Ambazac pegmatitic field, Central massif, France and in Forcarei pegmatite
field, NW of Galícia, Spain.
Forcarei field southern border is limited by Celanova migmatitic dome, derived
from a low temperature hydrated melt, derived from the fusion of crustal material
(Deveaud et al., 2014).
Barroso-Alvão aplite-pegmatite field also fits in these examples, showing a
spatial association between, granites, migmatites, shear zones and aplite-pegmatite
veins, classified according to Cerný and Ercit (2005) as rare elements pegmatites, of
the LCT family (Li, Cs, Ta), complex type and petalite and spodumene subtypes.

34
In Barroso-Alvão aplite-pegmatite field also seems to exist a structure similar to
Celanova migmatitic dome, named Barroso-Alvão dome, which is limited in the west by
Gerês granite, named Barrroso-Alvão dome.
In the area, a large amount of aplite-pegmatite veins seems to be structurally
controlled by existing foliations, and D3 related planes, with an azimuth of N130º and
NS to N10º, suggesting they were emplaced along the preferential structural planes
during and after the peak of metamorphism (Deveaud et al., 2014; Noronha et al.,
2006).
According to Noronha et al., (2006) the fact that spodumene veins seem to be
posterior to the petalite veins, and the first were formed at lower pressures, suggests
an evolution related to an up-lift process.
By classifying the pegmatites we are assigning them a set of features that will
define them among the global population of pegmatites.
The Cerný and Ercit classification (2005) is based on two concepts. Thus, the
aplite-pegmatite veins in this area belong to rare elements class, according to the first
concept, and to the LCT family according to the second concept.
When we divide the pegmatites into five classes (abyssal, muscovite, muscovite
- rare elements, rare elements and miarolitic) we are defining an interval of pressure
conditions, and also partly of temperature, that characterize the rocks in which they are
hosted without necessarily reflecting the conditions of consolidation of the pegmatites
themselves. These P-T conditions should be regarded as maximum estimates, since
they correspond to the metamorphism peak that in many cases precedes the
Fig. 7- PT diagram of spodumene, eucriptite and petalite stability fields. Adapted from: fig. 7-7, pag. 116, ook “Pegmatites” of David London, 2008, Mineralogical Association Canada

35
pegmatites emplacement. As such, classifying these pegmatites as belonging to the
rare elements class, it’s assuming that they likely have settled at an intermediate to
shallow depth and that when they become more fractioned they will tend to concentrate
lithophile rare elements of economical interest (fig. 8).
Fig. 8 - Schematic representation of the P-T fields of the pegmatites host rock, where you can observe the following classes: abyssal (AB), muscovite (MS), rare muscovite elements (MSREL), rare elements (REL) and miarolitic (MI). Arrows indicate regional fractionation trends present in pegmatites in relation to metamorphic gradients of the wall rocks. In some cases there are passages of a class to another, such as in cases of MS classes and MSREL, and in the cases of classes REL and MI (figure obtained from Cerny and Ercit 2005).
In particular, the members of the REL-Li subclass, where they were inserted,
commonly are emplaced at low pressures (between the green schist facies and the
amphibolite).
As previously mentioned, the aplite-pegmatite veins studied in this area were
classified as complex type, spodumene sub-type and petalite sub-type. The complex
type is precisely characterized by having a large amount of lithium aluminosilicates and
may contain some of the most advanced structures and obtain some of the most
extreme fractionation levels found in the earth's crust.
The spodumene subtype is the most common category of the pegmatite
complex type. It’s considered that these pegmatites usually crystallize at relatively high
pressures (≈3 - 4kbar).

36
The petalite subtype compared to the previous subclass is a smaller category,
where the pegmatites of this type tend to crystallize sometimes at a bit higher
temperatures and at lower pressures (≈1.5 - 3kbar) than those of the pegmatite class of
spodumene. However, these Li aluminosilicate may locally reflect the stage at which
they reached saturation, instead of reflecting the pressure at which they were formed.
In general, the geochemical and paragenetics characteristics of these two
subtypes are identical and usually have lower Li-content than those that were
experimentally established as maximum.
According to the second concept of this classification, dividing the pegmatites in
families is doing petrological and geochemical considerations of their origin. As such,
this concept is different from the previous hierarchy, which had a more descriptive
purpose, related to the geological environment.
Within the class of rare elements can therefore exist three families: NYF, LCT
and NYF + LCT. NYF and LCT abbreviations correspond, respectively, to a family with
a fractionation sequence enriched in niobium (Nb), yttrium (Y) + rare earth elements
(REE) and fluorine (F) and a family with sequence fractionation enriched in lithium (Li),
cesium (Cs) and tantalum (Ta).
The enrichment on these elements, within each pegmatite or population, of a
given family, doesn’t have to e proportional, nor occur evenly, and the assignment to
a family of a pegmatite population doesn't mean that the elements of another family
can't be present. However, these atypical phases occur in insignificant quantities when
compared with the signature minerals of a particular family.
The LCT family usually contains, and progressively gets richer, in Li, Rb, Cs,
Be, Ta, Nb (Ta> Nb) and in large part in B, P and F, as fractionation occurs in the melt.
In conclusion, Cerný and Ercit (2005), states that the two main sources of LCT
parental melt are the anatexis of the metasedimentary and metavolcanic protoliths of
the upper- to middle-undepleted crust, and a low percentage anatexis of (meta-)
igneous rocks from the basement, or a mix of both (Cerný and Ercit, 2005).

37
Chapter 3 – Desk work with
ArcGIS software

38

39
One of the goals of this study was to define catchment basins to which Li-
contents, obtained through the analyses of stream sediments collected in previous
studies of the Aplite-Pegmatite Field of Barroso-Alvão, could be assigned. Using this
methodology it was possible to create a probability map of the Li-rich areas.
The chosen software was ArcGis v. 10.3. It was necessary to have a points
shapefile, in which each point marks the location where each catchment basin area
starts being defined, and a flow direction raster-based file from the region in study. With
these two files it’s possi le to create a raster-based file of the catchment basins in the
area of interest, using the Watershed tool from ArcGis software.
The points shapefile chosen to do this procedure was a shapefile with the
location of 654 stream sediments sampling points, obtained through a previous study
(Pires, 1995), containing in its table of contents, the content values of Li, Sn W, Nb, Ta
and U, obtained in the analysis of each sample. The name of this shapefile is “ ”
(stream sediments).
The flow direction raster image used was “d108_mod_esc”, provided by the
National System of Environmental Information (Sistema Nacional de Informação de
Ambiente – SNIAmb). It had a pixel size of 25 m x 25 m (retrieved from SNIAmb, 24
Feb. 2016:
http://sniamb.apambiente.pt/infos/shpzips/D108_MOD_ESC_25_PTCONT_20790.zip).
The coordinate system used in this project was Hayford-Gauss, datum Lisboa.
In order to reduce the percentage error when constructing the catchment
basins, waterlines were created through the flow direction image “d108_mod_esc”, to
adjust the “ ” points to the higher water accumulation areas from this image. The
spatial analyst tools Flow Accumulation and Set Null were used to create the
waterlines. To restrict the waterlines to the study area, the flow direction image (FD)
was cropped with the Clip tool (from Data Management Tools section), overlapping the
“ ” shapefile area. In the resultant new image, “clip_flow”, the values with no data
were defined as “0” (fig. 9B).

40
Fig. 9 - (A) Satellite image of the study area retrieved from the “World Imagery” map service of ArcGIS v. 10.3. (B) Representation of the flow direction image within the study area (“clip_fllow”). The dark points represent the “ ” points.
Therefore, the Flow Accumulation tool (from the Spatial Analyst section) used
the flow direction image (fig.9B) to create another raster image, in which higher values
were assigned to the places (pixels) that had higher water accumulation, while lower
values were assigned to the places with less water accumulation.
The pixels values of the
resulting file were divided in two
classes: 0-70 (black colored pixels)
and 70-479464 (white colored pixels),
where 479464 was the highest value
attributed by this tool. The 0-70 class
was created because all the values
that were below 70 were of minor
importance, since they correspond to
zones of very little water accumulation.
This way it was possible to have a
better clue of the final appearance of
the waterlines. The resulting raster
image was named "flow_accum" (fig.
10).
Alto Rabagão’s
Dam Reservoir
Fig. 10 – Representation of the “flow_accum” raster- ased file that resulted from the “Flow Accumulation” tool. The black pixels represent the 0-70 class and white pixels represent the 70-479464 class, allowing the view of the waterlines. The red points represent the “ ” points.

41
The next step was to use the
Set Null tool (from the Spatial Analyst
section) to set, from the raster image
“flow_accum”, that the pixels values
under 70 were to be considered null
(“value” < 70) and that the remaining
pixel values would have a value of 1.
The resulting raster image was named
"SetNull" and represents the
waterlines.
In order to use the Watershed
tool it was necessary to manually
adjusted the stream sediments
sampling points to overlap the newly
formed waterlines, to avoid errors to
happen, since the “ ” points need to be right in the zones of highest water
accumulation, of the FD file, to correctly create the catchment basins.
To verify that the “SS”
shapefile was really overlapping the
raster waterlines, the “ ” points
were also converted to a raster-based
file.
Finally, it was possible to use
the Watershed tool (from the Spatial
Analyst section), with the adjusted
“ ” points and the “clip_flow” image,
to obtain a raster image of the
catchment basins. The resultant file
was named “ acias_raster” and was
then converted into a vector-based
file (polygons) in order to transfer the
attributes with the Li-contents from the
"SS" points, to the new catchment
basins shapefile.
Fig. 11 – Representation of “ etNull” raster-based file that resulted from the “ et Null” tool. The black pixels have a value of 1 and represent the waterlines within the study area.
The dark points represent the “ ” points.
Fig. 12 – Representation of the catchment basins raster image (“ acias_raster”) resultant from the Watershed tool. Each color represents one catchment basin that was created from a “ ” point and from the “clip_flow” raster image, that provided the information about the flow direction according to the terrain topography. The dark points represent the “ ” points and the gray
lines represent the waterlines.
Alto Ra agão’s
Dam Reservoir
Alto Ra agão’s
Dam Reservoir

42
However, during the conversion of the raster-based file, of the catchment
basins, to a shapefile, some of the catchment basins polygons have been divided into
small individual ones that should not exist, corresponding to individual pixels from the
previous file, that had 625m² of area (fig. 13). Therefore, it was necessary to merge
them in order to form the entire basins again. For this, the Dissolve tool (from the Data
Management Tools section) was chosen and the catchment basins that had the same
value in the “grid code” column, of the shapefile attribute table, were merged since
each catchment basin had one value obtained from the previous file, “ acias_raster”.
The new catchment asins shapefile was named “ acias_hidro_dissolve”.
Fig. 13- Conversion errors from the raster image to the shapefile. (A) Representation of the catchment basins raster-based file. (B) Representation of the result of the conversion to a shapefile with the resulting subdivision of some catchment basin polygons into small individual ones. (C) Representation of the new and corrected catchment basins shapefile. The red points represent the “ ” points and the lack lines represent the waterlines.
The next step was to use the Spatial Join tool (from the Analysis Tools sector)
to copy the data with the Li-contents from the “ ” points to the new catchment asins.
To do this, the “ ontains” option was used so that when the " " points were inside the
"hydro_dissolve" polygons, the attributes of the points were transcribed to the polygons
of the basins. The resulting vector file was named "bacias_dren_final".
In the properties, within the symbology field, the Li-contents of the catchment
basins were separated into seven classes, each one with a different color. According to
Pires (1995) the background was considered as being 50%, the anomaly threshold as
84% and the anomaly as 97.5%. This way, the percentiles used were 50%, 75%, 84%,
90%, 95% and 97,5% which are respectively 99ppm, 134ppm, 156ppm, 186ppm,
229ppm and 267ppm. However, all the values starting from 50% must be taken into
account as potential locations for Li-mineralized veins.
A B C A B C

43
The Li-contents were separated in the following classes:
38.000000 – 99.000000
99.000001 – 134.000000
134.000001 – 156.000000
156.000001 – 186.000000
186.000001 – 229.000000
229.000001 – 267.000000
267.000000 – 635.000000
The catchment basins that had an area over 2 km² were eliminated or cut
because they were created due to lack of information, as there were no more stream
sediments sampling points in those locations (final image result in Annexes 1).
It should be taken into account the Li-barren granites and the areas that are
overlapping them, since they are not to be considered as likely zones to contain Li-
mineralized veins.
Fig. 14 – Representation of “Bacia_dreno_final” file, where each color represents a different class of Li contents. The red points are the “ ” points and the lack lines are the waterlines.

44

45
Chapter 4 – Field work and
sampling

46

47
The studied veins are aplite-pegmatites because they have both aplite texture
and pegmatitic texture. It's often assumed that crystal size directly indicates the degree
of growth rate and magma cooling rate, being the small crystals derived from a quickly
cooling magma and the large crystals derived from a magma that has cooled slowly,
however, according to Webber (2007), this doesn't explain what really happens in
many pegmatite bodies, especially in the aplite-pegmatite bodies where a strong
cooling variability would be required.
Therefore, it seems that the crystallization parameters, such as nucleation and
growth rates, couldn’t always e the same during the formation of these aplite-
pegmatite veins. Events such as melt emplacement into a relatively cold country rock
(quench thermal), a chemical quench caused, for example, by the crystallization of
tourmaline, which can effectively remove boron from the melt, or rupture or dilatation of
a body (pressure quench), may increase the degree of melt undercooling and can start
an destabilization of the crystallization dynamics in a pegmatite system. Thus, these
events can initiate rapid heterogeneous nucleation and an oscillatory crystallization,
such as development of a layer of excluded components on a crystallization front
(Martins, 2009; Webber, 2007; Webber et al., 2005).
In Barroso-Alvão aplite-pegmatite field the aplite-pegmatite veins only appear in
sintectonic two-mica granites and in early Paleozoic metassediments, but only some of
the veins emplaced in the metasediments of Rancho sub-unit and Santa Maria de
Émeres unit, belonging to the Carrazedo Structural Domain, have Li-mineralizations.
This aplite-pegmatite population has no apparent spatial zonation, both barren
and Li-mineralized aplite-pegmatite veins appear within the same metasedimentary
rocks, from the same lithostratigraphic units. They show up as countless aplite-
pegmatite veins and locally appear in dense swarms of more than 10 bodies, with
different lengths and thicknesses, that sharply cross-cut the metasediments (Charoy
and Lhote, 1992; Martins, 2009; Lima, 2000).
During the field work done in this area 12 Li-mineralized aplite-pegmatite veins
were observed, as well as 4 old mines from where Sn used to be obtained. Of the first
12 veins, 10 are from the Rancho sub-unit and 2 from the Santa Maria de Émeres unit
(fig.15). All the coordinates of this aplite-pegmatite veins can be found in Annex 2.
Some veins are controlled by the 2 foliation and may be locally deformed by
D3 (N120°), but some others are also be controlled by D3-related planes. This seems to
indicate that the emplacement of the pegmatitic melt was structurally controlled during

48
the peak of metamorphism, from ante-D3 to sin-D3 (Noronha, F. et al., 2013; Charoy et
al., 1992; Martins, 2009).
However, there are some veins that also appear to have filled sub-horizontal
and sub-vertical fracture systems like shear fractures, as veins can be found parallel to
each other, possibly echelon structures. This suggests that the melt installation would
also have occurred after the peak of metamorphism, during a later and less ductile
phase. Lima and Noronha (2006) also states that the installation of the melt could have
occurred during and after the peak of metamorphism.
Recent studies from Dakota Minerals (2016b) also state that some pegmatites
appear to be curved in folds with vertical axis to slightly recumbent, with thicker
pegmatites commonly developed in the fold nose of NW anticlines.
The Li-mineralized aplite-pegmatite veins have a mineralogical composition
identical to a granitic composition. According to Martins (2009), the veins are mainly
composed of feldspars, up to 50 cm in length, uniformly distributed or forming swarms,
spodumene and/or petalite single or in clustered crystals, and small rounded grains of
quartz.
The spodumene has a pearl-white color and can have up to 30 cm in length.
The petalite is almost transparent when it is fresh and has a light yellowish color when
weathered.
As accessory minerals, the most common is moscovite, with centimeter size,
but there are also montebrasite, apatite, tourmaline, cassiterite, columbo-tantalite, clay
minerals and Fe and Mn oxides.
The cassiterite can be primary (cassiterite I) or secondary, of hydrothermal
origin (cassiterite II). Primary cassiterite was found as an accessory mineral of petalite
dominant veins and had deformation. As such, possibly, in the maps with Li- and Sn-
contents (obtained according to the methodology described in chapter 3), the zones
that are anomalous in both elements, would have a higher probability of containing
petalite veins. However, it is possible that due to the great Sn demand that existed in
this region, currently the stream sediments in certain areas have been washed by the
population to obtain this ore (Lima, 2000, Lima et al., 2003, Martins et al., 2007).
In field work, several andalusite porphyroblasts were also observed in the
metasediments, as described by Lima (2000) by M.A. Ribeiro (1998), who described
the DEC units as having a degree of metamorphism corresponding to the biotite zone,

49
where these large crystals can be found. It was also observed that is common to find
exudation quartz in the metasediments.
The data collected in this study is now part of the Barroso-Alvão database
(pegmatitos_barroso.dbf), that also contains data from geological charts 1: 50000 (6A,
6B, 6C and 6D) and from several other researchers that already have studied the area.
Some of the aplite-pegmatite veins presented in this work were already known
for their contents in Li, ut others, weren’t yet identified as eing Li-rich or weren’t yet
identified at all. These were found using the results of the desk work referred in
Chapter 3.
In the following figures are represented the locations of the 12 Li-mineralized
veins observed in the field, together with the representation of the Li-bearing (fig.15)
and Sn-bearing (fig. 16) catchment basins, as well as the mining concessions that can
be found here. The maps were created in ArcGIS v. 10.3, using 6C - Cabeceiras de
Basto 1: 50000 sheet and 6D - Vila Pouca de Aguiar 1: 50000 sheet of the Geological
Map of Portugal. The colors chosen to represent Sn-contents range from dark green to
red, with the darkest green corresponding to the "regional background" (percentile of
50%), the lighter green to the "anomaly threshold" (percentile of 84%) and the reddish
orange to the "anomaly" (percentile of 97.5%).
Fig. 15 - Locations of the 12 Li-mineralized veins observed in the field, together with the representation of the Li-bearing catchment basins, as well as the mining concessions that can be found here. The maps were created in ArcGIS v. 10.3, using 6C - Cabeceiras de Basto 1: 50000 sheet and 6D - Vila Pouca de Aguiar 1: 50000 sheet of the Geological Map of Portugal.

50
Fig. 16 - Locations of the 12 Li-mineralized veins observed in the field, together with the representation of the Sn-bearing catchment basins, as well as the mining concessions that can be found here. The maps were created in ArcGIS v. 10.3, using 6C - Cabeceiras de Basto 1: 50000 sheet and 6D - Vila Pouca de Aguiar 1: 50000 sheet of the Geological Map of Portugal.
Fig. 17 – (A) Legend with the symbols, structures and lithostratigraphic units from the geological maps shown in fig. 15 and Fig. 16, corresponding to sheet 6C - Cabeceiras de Basto, scale 1: 50000. (B) Li- and Sn-content classes used in the representation of the catchment basins from fig. 15 and fig. 16.

51
4.1. N312-1 and N312-2 aplite-pegmatite veins
Both the N312-1 and the N312-2 aplite-pegmatite veins were first indicated as
having a high probability of being Li-mineralized by the Li-bearing catchment basins
from Chapter 3. These are emplaced in Rancho sub-unit metasediments that have a
foliation of N120°; subvertical (to north), that is typical found as D3 regional orientation.
The N312-1 aplite-pegmatite vein is quite weathered and has an 8.4m width.
Despite the weathered appearance, as it seemed to be able to contain relics of old Li-
minerals and was within an area with high content in Li (fig. 19), some samples were
collected in order to prepare thin sections (P1a, P1b, P1c and P1d) that were later
observed under the petrographic microscope.
The resultant thin section was very weathered, as was already expected, but
they gave the confirmation that this vein was actually mineralized, since relics of
petalite, ambligonite and cookeite were found.
In the field, this aplite-pegmatite vein appeared to have an orientation of about
N70°.
The N312-2 aplite-
pegmatite vein is subhorizontal,
and is also very weathered. It
seems to have some Li-content
indicated by the pink colored
alteration of some minerals.
In this vein there are
feldspar crystals growing in a comb
structure from the aplite-pegmatite
contact with the country rock
(fig.18).
According to Webber (2007), London (1992) states that when a progressively
larger liquidus undercooling of a hydrous silicate melt occurs, the crystals cease to
have a random orientation and begin to orient themselves in a comb structure.
Webber (2007) also states that an important characteristic in pegmatites is the
textural heterogeneity they display with respect to crystal morphologies, being that the
Fig. 18 – Feldspar crystals growing in a comb structure from
the aplite-pegmatite (N312-2) contact with the country rock.

52
textural relations within the pegmatites minerals reflect the pegmatite undercooling
degree, nucleation rate and growth rate. A strong undercooling is required to explain
many textural characteristics of pegmatites, such as the development of comb
structures along the pegmatite contacts with the country rock. This is what seems to
happen in this aplite-pegmatite vein.
According to the analysis of the Li-bearing and Sn-bearing maps, these aplite-
pegmatite veins are inserted in a catchment basin with high Li-contents and that also
has some important Sn-contents. With only this analysis it was already possible to
assume that this vein could be a petalite one, but the petrographic analysis from N312-
1 vein also possessed petalite relics. Therefore, the results of this analysis are within
expectations.
Fig. 19 – Localization of N312-1 and N312-2 aplite-pegmatite veins on the Li-bearing (fig. 19A) and Sn-bearing (fig. 19B) catchment basins maps, using 6D - Vila Pouca de Aguiar sheet of the Geological Map of Portugal. The blue lines represent the waterlines.
B
Sn
A
Li

53
4.2. CHN3 aplite-pegmatite vein
The CHN3 aplite-pegmatite vein is subvertical and in general it possess an
azimuth of N150°. However, a contact between the schist and the aplite-pegmatite was
measured with an attitude of N120 °; SV.
This is a Li-mineralized body, and
contains spodumene crystals, that can be
seen in the outcrop visited more southerly,
but it also contains petalite crystals further
north still in the same outcrop.
A petalite sample was collected (fig.
20) and later analyzed by the Scanning
Electron Microscope (SEM) at the Materials
Center of the University of Porto (CEMUP),
where its identification was confirmed by the
Al/Si relation, which is only compatible with
this mineral.
According to Charoy et al. (1992), this vein is cross-cut by several late-D3
shear-zones, 3-5 cm wide, and was known as being only mineralized in spodumene.
During this 1992 study, thin sections were made with the purpose of containing some
shear-zones. These thin sections were reanalysed in the course of this dissertation.
During the field work it was possible to see shear-zones cross-cutting the aplite-
pegmatite vein and to notice that these are right-lateral. In this case, there were shear-
zones with attitude of N132 °; SV that were cut by later shear-zones with attitude of
N162 °; SV (fig. 21). Moreover, there was a small shear-zone, about 1cm wide, filled
with quartz and with spodumene on the edges (fig. 22). This spodumene is posterior to
the one previously observed, like what was seen in the mentioned thin blades from
Charoy et al. (1992).
The local metasediments also have a very fine and well marked foliation, again
indicating the presence of a 3rd phase shear corridor (D3). In addition, there were
andalusite porphyroblasts also deformed by these shear-zones in the vicinity.
Fig. 20 – Petalite crystal from CHN3 aplite-pegmatite vein.

54
This aplite-pegmatite vein isn’t covered y the Li-bearing map produced in
Chapter 3 because no sample of stream sediments was collected in the secondary
waterline that would outline the catchment basin of this area.
However, this body contains cassiterite (seen in thin section) and, therefore, this
area should contains high contents of Sn and Li.
Fig. 21 - Two shear-zones cross-cutting the aplite-pegmatite vein: a shear-zone with attitude N132 °; SV and a later one with attitude N160 °; SV. Both are right-lateral (indicated by the yellow arrows).
Fig. 22 - (A) Small shear-zone filled by quartz and with spodumene in the edges, observed in CHN3 aplite-pegmatite vein. (B) Close-up of the shear-zone represented in fig. 22A.
A B
qtz
spd

55
4.3. Alijó aplite-pegmatite vein
Alijó aplite-pegmatite vein belongs to José Aldeia Lagoa & Filhos, SA. mining
concession.
In the exploration zone of "Alijó vein" there are two sub-parallel, aplite-
pegmatite veins with an azimuth of N165° and a variable inclination of 45°W to 60°E.
The exploration is being carried out on the largest vein, on the west side (between 5 m
and 45 m of width).
According to Farinha (1998) this vein must have at least 380 m of extension.
Despite the fact that at the exploration site the vein seems to be a continuous
body, according to the survey results from previous studies, the vein has a schist
enclave, in depth, which displays the same deformation as the schist of the country
rock (Lima, 2000).
According to Professor Fernando Noronha (personal communication, 2016)
these veins emplacement seems to have been controlled by a shear zone.
In this location, the metasediments were very deformed, with azimuths from
N70° to N160°, indicating the presence of a D3 shear corridor (fig. 24). This goes along
with the observations that were made in Lima (2000), where it was stated that the
B
B
Fig. 23 – Alijó aplite-pegmatite vein exploration site. (A) Exploration site photo. (B) Satellite image of the exploration site. Google Earth adapted image. (C) Schematic figure representative of the contacts directions observed in the exploration site of the aplite-pegmatite vein and of a shear plane located north of the exploration.
A B
C N

56
metasediments are marked by D3, with directions from N120° to N140°. According to
this study, andalusite crystals of ante-D3, were also observed.
Fig. 24 – D shear corridor at the exploration site of Alijó aplite-pegmatite vein
As previously reported, in the aplite-pegmatite vein exploration site, only
spodumene crystals were seen (fig. 25) and no petalite was found. It's also stated that
spodumene aplite-pegmatite veins, like this one, usually have higher Fe-contents than

57
those of petalite. Spodumene aplite-pegmatite veins usually have low Sn-contents, like
what happens with this vein (Martins et al, 2007).
In this aplite-pegmatite vein it’s possi le to see the aplitic texture and the
pegmatite texture occurring alternately. Within the aplitic portion there were bands rich
in small crystals of tourmaline.
Locally an interesting orientation of the crystals (N70°) is observed, which could
indicate a preferred orientation of the spodumene crystals, but in general the crystals
show a random direction such as N60°, N40° and N90°.
In the enclosing schists, there are millimetric tourmaline crystals near the aplite-
pegmatite vein. They could have been formed due to the mutual contribution of the
aplite-pegmatite and the schist, being that the first would have provided the B and the
second the Mg. Supporting this idea is the fact that it was not found tourmaline in
quartzitic zones because the Mg would have come from the biotite in the schist.
Already in Martins (2009) was referred the occurrence of tourmalinization in the
metasediments that were near the contacts with the pegmatites emplaced in Rancho
sub-unit and Santa Maria de Émeres unit. In Lima (2000), it is also mentioned that
Ramos (1998) stated that the intense tourmaline crystallization could have happened
thanks to the released of B from the pegmatitic melt to the country rock.
Alijó aplite-pegmatite vein is also not covered by the Li-bearing and Sn-bearing
catchment basins maps. The catchment basin where this vein was in, was a basin with
several kilometers belonging to a main water stream (the Beça river), meaning that the
stream sediments collected there were a mixture of sediments brought by other water
courses.
A
B
Fig. 25 – (A) Collected sample with several spodumene crystals. (B) Close-up of fig. 25.A.
A B
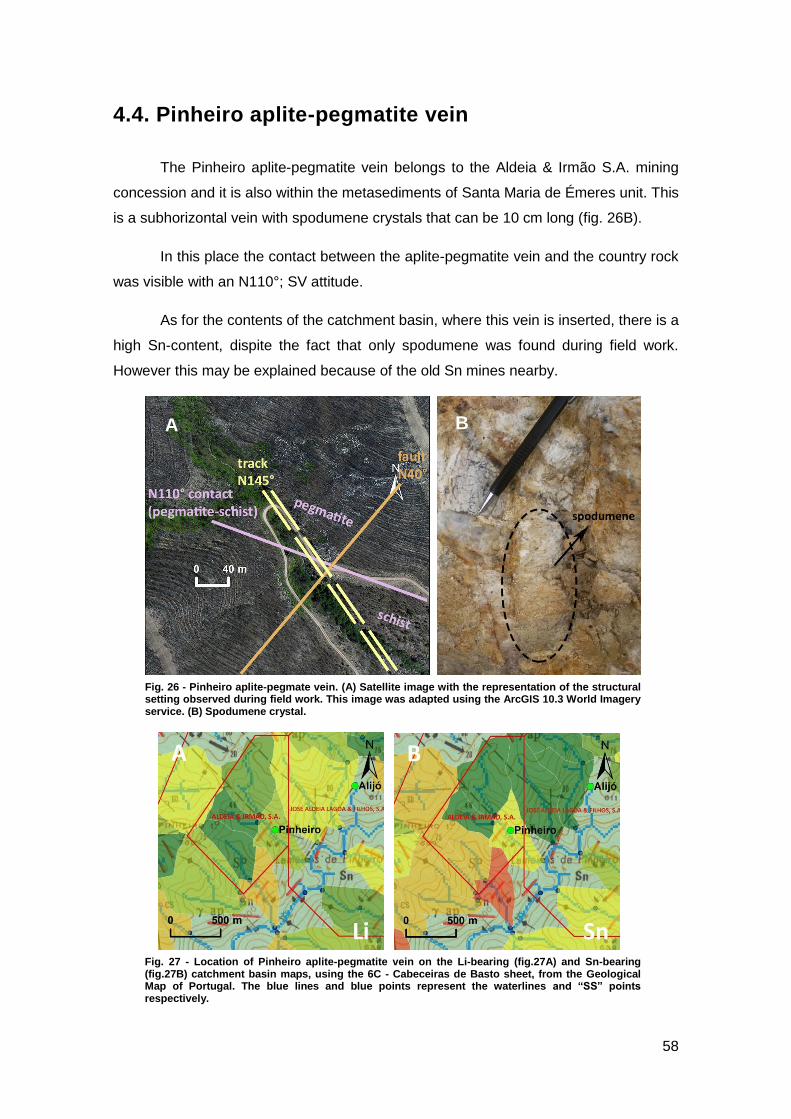
58
Fig. 26 - Pinheiro aplite-pegmate vein. (A) Satellite image with the representation of the structural setting observed during field work. This image was adapted using the ArcGIS 10.3 World Imagery service. (B) Spodumene crystal.
4.4. Pinheiro aplite-pegmatite vein
The Pinheiro aplite-pegmatite vein belongs to the Aldeia & Irmão S.A. mining
concession and it is also within the metasediments of Santa Maria de Émeres unit. This
is a subhorizontal vein with spodumene crystals that can be 10 cm long (fig. 26B).
In this place the contact between the aplite-pegmatite vein and the country rock
was visible with an N110°; SV attitude.
As for the contents of the catchment basin, where this vein is inserted, there is a
high Sn-content, dispite the fact that only spodumene was found during field work.
However this may be explained because of the old Sn mines nearby.
B A
Fig. 27 - Location of Pinheiro aplite-pegmatite vein on the Li-bearing (fig.27A) and Sn-bearing (fig.27B) catchment basin maps, using the 6C - Cabeceiras de Basto sheet, from the Geological Map of Portugal. The blue lines and blue points represent the waterlines and “ ” points respectively.

59
Fig. 28 - (A) Columbo-tantalite and petalite from Vila Grande aplite-pegmatite vein. (B) Close-up of the columbo-tantalite crystal from fig. 28A.
4.5. Vila Grande aplite-pegmatite vein
Vila Grande aplite-pegmatite vein is very weathered, but it was still possible to
find some petalite crystals, meaning that this one is Li-mineralized vein. Its attitude,
measured in the field, is N110 °; 48 ° SW. It belongs to the metasediments of Santa
Maria de Émeres unit.
In this vein a columbo-tantalite crystal was also found, later confirmed by a
portable X-ray fluorescence device (XRF).
Previously, this aplite-pegmatite vein wasn't identified as Li-mineralized.
Although the Li-bearing and Sn-bearing maps show that this area has high Li-
contents, the Sn- contents are only 0.5 ppm, despite their relation with petalite veins.
It’s possible that these values are due to the large Sn demand that occurred in this
region, causing the stream sediments in certain locations to have been washed by the
local populations.
A
Fig. 29 - Vila Grande aplite-pegmatite vein location on the Li-bearing (fig. 29A) and Sn-bearing (fig.29B) catchment basin maps, using 6C - Cabeceiras de Basto sheet, from the Geological Map of Portugal. The lue lines and lue points represent the waterlines and “ ” points respectively.
B

60
4.6. Lousas aplite-pegmatite vein
Lousas aplite-pegmatite vein belongs to Felmica Minerais Industriais, S.A.
mining concession and is emplaced in Rancho sub-unit metasediments.
This vein is sub-horizontal (70°W), and its azimuth varies between N-S and
N20°, making him discordant from the main fabric found in the surrounding
metasediments, in other words from the F3 crenulation cleavage.
In the exploration site, the Lousas vein shows 70m of maximum width (E-W)
and 13 - 15m of depth. However, there are lateral branches with several meters in
length that already have been recognized, which indicates that this aplite-pegmatite
vein should have a total extension of about 500 m (N-S) (Farinha, 2012, Martins et al.,
2007).
The most abundant lithium mineral present in this aplite-pegmatite vein is
petalite. Although, Professor Alexandre Lima (personal communication, 2016) states
that there is spodumene at the southern and northern extremes of this vein.
Further north, still within the
exploration site, there are some spodumene
crystals with the characteristic fine cleavage,
with quartz intergrowths that suggests SQI
(Spodumene Quartz Intergrowth) (fig. 30).
According to Lima et al. (2007), London
(1984) states that petalite is stable at a
temperature between 550°C - 680°C and at
a pressure between 2 Kbar - 4 Kbar, being
that below these temperatures the petalite
decomposes into spodumene + quartz,
forming what is known as SQI. Therefore,
this spodumene would be posterior to the
petalite.
Close by, it was possible to find the direction of the pegmatite melt, shown by a
crystallization front were the crystals have grown in the fluid movement direction. There
were also broken petalite crystals nearby, which seemed to have been the first to
crystallize in the melt, but then would have been pushed, resulting in scattered
SQI
spd
spd
qtz
qtz
Fig. 30 - Spodumene with quartz intergrowths (SQI - Spodumene Quartz Intergrowth)

61
fragments (fig. 33). Close to them there were also petalite crystals, but this time
unbroken. These ones didn’t have a preferential orientation such as most of the petalite
crystals observed in this vein (fig. 31).
One of the fractures of this aplite-pegmatite vein has pink areas, corresponding
to Li-rich altering minerals. This has already been seen previously in other Li-
mineralized veins.
Concerning the probability map of Li- and Sn- contents, the catchment basin
where this vein is inserted has a high Li-content, but very low Sn-contents (0.5 ppm),
despite of this being a petalite vein and having old Sn mining works in this location (fig.
32). As such, it’s possible that the stream sediments were washed to obtain Sn, as
what may have happened in Vila Grande aplite-pegmatite vein.
Fig. 32 – Location of Lousas aplite-pegmatite vein on the Li-bearing (fig. 28A) and Sn-bearing (fig.28B) catchment basin maps, using 6C - Cabeceiras de Basto sheet, from the Geological Map of Portugal. The
blue lines and blue points represent the waterlines and “ ” points respectively.
Fig. 31 - Petalite crystals randomly distributed in Lousas aplite-pegmatite vein. In these crystals can be seen very well the translucent appearance of fresh petalite.

62
Fig. 33 - Direction of the pegmatitic melt and petalite crystals fragments of Lousas aplite-pegmatite vein. The arrows indicate the fluid direction and the black dashed lines represents the crystallization fronts. The red dashed line outline the petalite broken crystals area, being that they are the darker ones.

63
4.7. AL56 aplite-pegmatite vein
The aplite-pegmatite vein located in the AL56
vein area, emplaced in the metasediments of the
Santa Maria de Émeres unit, belongs to Imerys
Ceramics Portugal, S.A mining concession. This is
sub-vertical and has an orientation of about N136°,
like the main fabric of the surrounding
metasediments.
In this vein there are many crystals of
spodumene with quartz intergrowth (SQI) (fig. 35).
Feldspars that, according to Professor Mona-Liza
Sirbescu (personal communication, 2016), appear to
have been deformed while the surrounding minerals
would have melted and crystallized around them (fig.
29).
In this zone it was collected a sample of
petalite passing to spodumene + quartz, from which thin sheets were made. Their
petrographic analysis can be found in Chapter 2.
According to the Li-bearing and Sn-bearing maps, this site, besides being
indicated as an area that possibly contains Li-mineralized veins, is also indicated as
having a large amount of Sn, which corroborates the fact that this vein was of petalite
that was replaced by spodumene + quartz.
spd
qtz
spd
spd qtz
Fig. 34 - Deformed feldspars from the aplite-pegmatite vein located in the AL56 vein area.
Fig. 35 – Sample with SQI crystals from the aplite-pegmatite vein located in the AL56 vein area.

64
Fig. 36 - Location of the aplite-pegmatite vein present in the AL56 vein area in the Li-bearing (fig.36A) and Sn-bearing (fig.36B) catchment basin maps, using the 6C - Cabeceiras de Basto sheet, from the Geological Map of Portugal. The lue lines and lue points represent the waterlines and “ ” points respectively.

65
4.8. Gondiães aplite-pegmatite vein
Gondiães aplite-pegmatite vein belongs to Felmica Minerais Industriais, S.A.
mining concession, has about 950 m of extension and 5 m width. It’s within the
Rancho sub-unit metasediments.
The aplite-pegmatite vein is subvertical and has a direction around N30°. The
main Li-mineral is petalite and it also has cassiterite that was already explored to obtain
Sn (Internal Report Felmica, 2004).
According to Professor Alexandre Lima (personal communication, 2016), this
aplite-pegmatite vein, like the one from Lousas, also has spodumene in its southern
and northern extremes.
The analysis of the Li-bearing and Sn-bearing maps makes it easy to assume
the presence of petalite veins, since they contain high Li-contents and high Sn-contents
(fig. 37).
Fig. 37 - Gondiães aplite-pegmatite vein location on Li-bearing (fig. 36A) and Sn-bearing (fig. 36B) catchment basin maps, using 6C - Cabeceiras de Basto sheet, from the Geological Map of Portugal. The lue lines and lue points represent the waterlines and “ ” points respectively.

66
4.9. Dias 1 aplite-pegmatite vein
Dias 1 aplite-pegmatite vein had not yet been identified, and was first
discovered in the course of this work, moreover it's Li-mineralized, with abundant
petalite crystals, where most are about 1 cm wide and 4 cm long. A sample of this vein
has been collected (fig. 38).
This aplite-pegmatite vein is embedded in schist with andalusite from Rancho
sub-unit, with a N112° foliation, where there is exudation quartz.
Dias 1 is not covered by Li-bearing and Sn-bearing maps, same as Alijó aplite-
pegmatite vein, because of the catchment basin where it was located, a main
watercourse (Beça river catchment basin). As such, the collected stream sediments are
a mixture of other sediments brought by different water streams that flow there.
4.10. Dias 2 aplite-pegmatite vein
Dias 2 aplite-pegmatite vein was also first discovered while doing field work.
Despite of the above referred vein being very weathered, it was still possible to
determine that it was Li-mineralized. Some crystals of spodumene and quartz, that
seemed to be SQI, were found. It’s also pro a le that this aplite-pegmatite vein has
petalite crystals, but due to the degree of the weathering and to the small emerging
Fig. 38 – Petalite crystals from Dias 1 aplite-pegmatite vein sample.
B

67
area it was impossible to be sure. This vein belongs to Rancho sub-unit
metassediments.
Dias 2 is not covered by Li-bearing and Sn-bearing probability maps, since it is
outside the stream sediments sampling area.
4.11. Dias 3 aplite-pegmatite vein
Dias 3 aplite-pegmatite vein is a Sn old mine with several galleries, located in
the metasediments of Rancho sub-unit. In this vein it was possible to see several
millimetric cassiterite needles.
This aplite-pegmatite vein wasn't yet identified as Li-mineralized. However, it
has abundant spodumene and quartz crystals (SQI), some of which are about 20 cm
long and 10 cm wide. Besides the occurrence of these crystals, Dias 3 is in a
catchment basin with high contents in Li and Sn (fig. 39).
Only the most aplitic and weathered parts seem to have been explored, since
the more pegmatitic and hard parts seem to have stayed intact.
All the Li-minerals observed at this site seemed to be SQI. As such, this aplite-
pegmatite vein, which appears to be now spodumene dominant, could have originally
been petalite dominant.
Fig. 39 – Dias 3 aplite-pegmatite vein location on the Li-bearing (fig. 39A) and Sn-bearing (Fig. 39B) catchment basin maps, using the 6D - Vila Pouca de Aguiar sheet, from the Geological Map of Portugal.

68

69
Chapter 5 – Petrographic and
mineralogical study

70

71
5.1. AL56
In the area of the AL56 aplite-pegmatite vein, a sample with several petalite
crystals was collected, in which some of them have SQI (fig. 40).
A thin section was made from this sample, containing one of the ends of a
petalite crystal that showed the passage of petalite to spodumene + quartz (fig. 41).
Fig. 40 - Aplite-pegmatite vein sample from AL56 aplite-pegmataite vein area, where it can be seen with the naked eye, a petalite crystal being replaced by spodumene + quartz (SQI). This sample also contains other petalite crystals.
B
Fig. 41 - Thin section photomicrograph from the sample referred above (fig. 40) where a petalite crystal is being replaced by spodumene + quartz (inside the red dashed line), next to another petalite crystal (on the right side). (A) Plane polarized light. (B) Cross polarized light.

72
The thin section shows a total of five petalite crystals. In addition to the main
crystal where SQI was observed with naked eye, the same occurs on another petalite
crystal edge.
About 70% of the thin section is occupied by petalite crystals. The matrix
consists of quartz, albite and white mica.
In this thin section the minerals observed were petalite, quartz, spodumene,
albite and white mica.
Petalite occasionally has white mica, albite and quartz inclusions. The crystals
have irregular borders and it’s also common to find white mica crystals along the lateral
edges, which often take advantage of the petalite cleavage to grow into them. The
petalite crystals do not appear to be deformed.
In one of the petalite crystals it’s possi le to find an aggregate of small
spodumene and quartz crystals along one of the petalite cleavages.
In the thin section, the highest spodumene + quartz (SQI) concentration,
belongs to the petalite crystal shown in figure 40 and figure 41, where the replacement
can be seen in the ends of the crystal, even with the naked eye. In this thin section, it’s
possible to see that in the limit of this replacement there is a lateral replacement of
petalite to spodumene and quartz (fig. 42A). Spodumene usually grows in the same
direction as the petalite cleavage, in other words, with a perpendicular direction to the
petalite crystal direction from which it was formed. However, this replacement can also
be observed occurring in another petalite crystal, where the spodumene + quartz
resemble a symplectite texture (fig. 42B).
One of the other five petalite crystals is very weathered, possessing several
small flakes of white mica that appear to be distributed along the cleavages and
partitions directions of the old petalite crystal. However, it is still possible to see several
petalite relics, alternating with spodumene and quartz relics, that have the same
direction of the old petalite cleavege. In this crystal there are also some small albite
crystals.
Quartz is one of the main matrix constituents, and can have subgranulation, a
deformation indicative. There is also quartz between the spodumene (SQI), which does
not appear to be deformed. Quartz also occurs as inclusions, from goticular to
vermicular, within albites and white mica.

73
Albite is also one of the main constituents of the matrix surrounding the petalite
crystals and it’s common to show deformation induced twinning, and sometimes bent
twinning, which are stress results. These matrix crystals seem to have a tendency to be
oriented with the same direction of the bigger petalite crystals. Albite may also occur as
petalite crystals inclusions.
The white mica is also one of the matrix constituents and can occur as flakes or
needles that can cross each other. Sometimes they also occur along the petalite
crystals edges, growing into these crystals through the cleavage planes.
Fig. 42 – Photomicrograph of some of the spodumene aspects from aplite-pegmatite vein in the area of AL56 vein. (A) Lateral replacement of petalite by spodumene and quartz. (B) SQI replacement in another petalite crystal, where the spodumene + quartz resemble a symplectite texture. (C) Close-up on the spodumene and quartz within the main petalite crystal from figure 40 and figure 41.
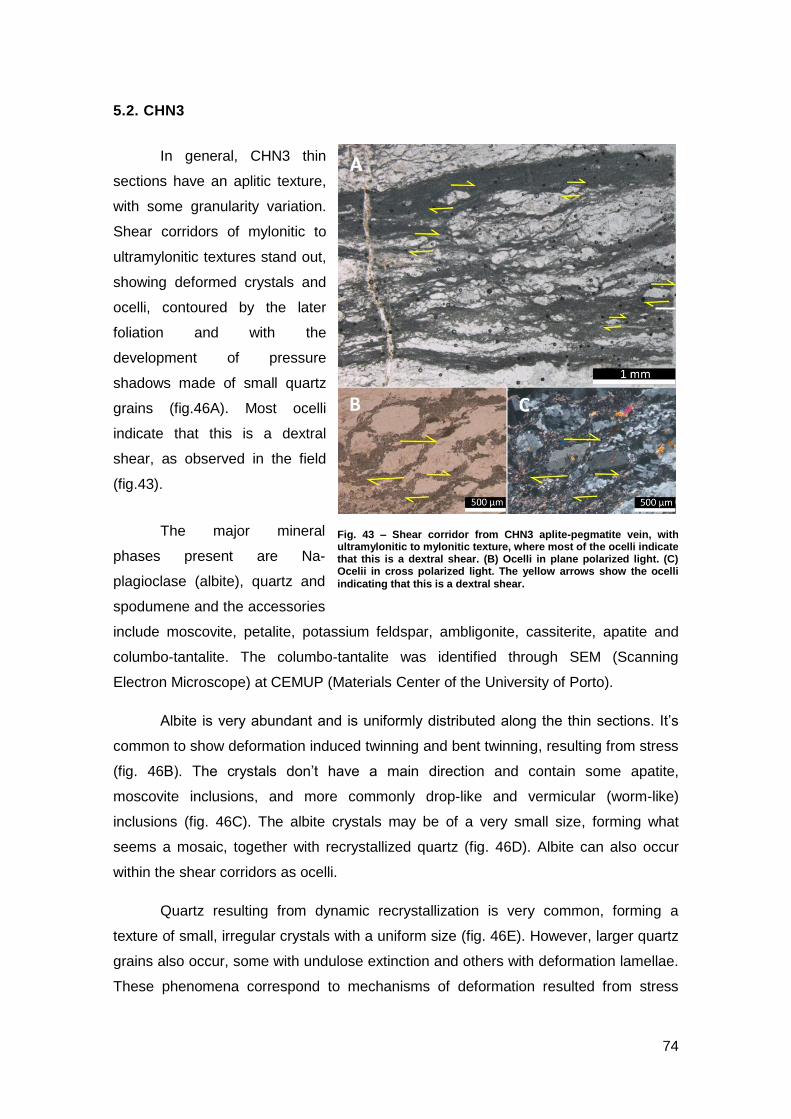
74
Fig. 43 – Shear corridor from CHN3 aplite-pegmatite vein, with ultramylonitic to mylonitic texture, where most of the ocelli indicate that this is a dextral shear. (B) Ocelli in plane polarized light. (C) Ocelii in cross polarized light. The yellow arrows show the ocelli
indicating that this is a dextral shear.
5.2. CHN3
In general, CHN3 thin
sections have an aplitic texture,
with some granularity variation.
Shear corridors of mylonitic to
ultramylonitic textures stand out,
showing deformed crystals and
ocelli, contoured by the later
foliation and with the
development of pressure
shadows made of small quartz
grains (fig.46A). Most ocelli
indicate that this is a dextral
shear, as observed in the field
(fig.43).
The major mineral
phases present are Na-
plagioclase (albite), quartz and
spodumene and the accessories
include moscovite, petalite, potassium feldspar, ambligonite, cassiterite, apatite and
columbo-tantalite. The columbo-tantalite was identified through SEM (Scanning
Electron Microscope) at CEMUP (Materials Center of the University of Porto).
Al ite is very a undant and is uniformly distri uted along the thin sections. It’s
common to show deformation induced twinning and bent twinning, resulting from stress
(fig. 46B). The crystals don’t have a main direction and contain some apatite,
moscovite inclusions, and more commonly drop-like and vermicular (worm-like)
inclusions (fig. 46C). The albite crystals may be of a very small size, forming what
seems a mosaic, together with recrystallized quartz (fig. 46D). Albite can also occur
within the shear corridors as ocelli.
Quartz resulting from dynamic recrystallization is very common, forming a
texture of small, irregular crystals with a uniform size (fig. 46E). However, larger quartz
grains also occur, some with undulose extinction and others with deformation lamellae.
These phenomena correspond to mechanisms of deformation resulted from stress

75
where dynamic recrystallization is the final stage of a recovery process. Quartz may
also contain inclusions of albite, moscovite, and apatite.
podumene isn’t uniformly distri uted along the thin sections, eing usually in
localized areas, forming aggregates. It occurs with different sizes from large euhedral
crystals of about 500 μm to 2 mm, that are oriented and have quartz grain intergrowths
(fig. 45A and fig. 45B), to small spodumene and quartz aggregates, with very irregular
shapes, forming alignments along the thin sections (fig. 45C and fig. 45D). The larger
spodumene and quartz aggregates have an elongated shape and, occasionally, on the
edges of these agglomerates, the spodumene may have a symplectite texture. This
intercalation of spodumene and quartz resembles SQI. In these thin sections there are
also posterior, small and prismatic-like crystals, that are associated with the shear
zones (fig. 45E). In SEM (Scanning Electron Microscope) these were found to be made
of alternate spodumene and quartz.
Muscovite, despite being relatively scarce, is the most abundant accessory
mineral. The larger crystals usually have a size etween 500μm - 1mm. It’s common
for these to be curved (fig. 46F), a deformation result, and may contain quartz
inclusions. There are many small moscovite flakes, with irregular borders, in
intergranular spaces. Moscovite can also occur as inclusions in albite and quartz
crystals.
Petalite is one of the accessory minerals of this thin sections and it’s possi le to
find some places with petalite being replaced by spodumene + quartz. This type of
replacement, has already been seen in the petalite crystals of the aplite-pegmatite vein
in AL56 area, appears to start by the edges of the petalite crystals and the spodumene
appears to grow perpendicularly to the former petalite crystal (fig. 41).
K-feldspar was occasionally found showing the typical cross-hatched twin
pattern of microcline. However, other K-feldspars may occur with simple twinning,
making them hard to distinguish from the abundant albite crystals (fig. 46G).
Amblygonite is also a bit rare and the largest observed crystals are about 800
μm. It’s common to exhibit the typical polysynthetic twinning. They can also be found
within the shear corredors as ocelli (fig. 46A).
assiterite is scarce, has pleochroism and is fractured. The largest observed
crystals are a out 200 μm. owever, within the shear corridor there is also smaller,
deformed cassiterite, oriented in the direction of the fabric and without fractures, which

76
indicates that these crystals, just like those of ambligonite, are older compared with the
shear corridors. The cassiterite can exhibit simple twining.
Theoretically, the replacement of petalite to spodumene + quartz would result in
56% spodumene and 44% quartz.
Fig. 44 - Photomicrograph of petalite being replaced by spodumene and quartz (SQI) from CHN3 aplite-pegmatite vein.

77
Fig. 45– Photomicrograph of some features of spodumene from CHN3 aplite-pegmatite vein. (A) Largest spodumene and quartz crystals in an elongated aggregate, where it’s possi le to see the sympletite texture at one end. (B) Close-up of fig. 41A. (C) Small spodumene and quartz crystals in a elongated aggregate. (D) Close-up of Fig. 41C. (E) Small spodumene crystals posterior to the shear.
spd spd

78
Fig. 46 – Photomicrograph with some features of the CHN3 thin section. (A) Ambligonite ocelli with pressure shadows. (B) Albites with deformation induced twinning and bent twinning. (C) Vermicular quartz inclusions on an albite crystal. (D) Small crystals of quartz and albite forming what seems to be a mosaic. (E) Quartz resulting from dynamic recrystallization. (F) Deformed moscovite. (G) Microcline with the typical cross-hatched twin pattern (H) Fractured cassiterite. (I) Deformed cassiterite within a shear corridor. (J) Apatite inclusion on quartz.

79
Chapter 6 – Discussion and
conclusions

80

81
The method of using the Li-bearing and Sn-bearing catchment basins maps to
find Li-mineralized veins during field work showed good potential. It allows to cover
large areas by collecting and analyzing stream sediments and defining potential
mineralized areas. Therefore, it seems to be a good prospecting method and can be
applied to other areas of interest.
Taking in consideration, that the aplite-pegmatite veins from old Sn mining
works can also be seen as potential zones to find petalite, we have new exploration
targets to obtain lithium. The referred Dias 3, Gondiães and Lousas aplite-pegmatite
veins are some examples.
In the figures 47A and 47B, the Li-bearing and Sn-bearing catchment basin
maps show another example of an old Sn mining work in an aplite-pegmatite vein
located in a potentially mineralized area with high probability of containing petalite
mineralization (has high Li- and Sn-contents). This one belongs to a recent example of
mineral exploration for lithium ores, where a drill campaign was carried out (Dakota
Minerals, 2016a).
Romano old Sn mine was the first place where a borehole was made within the
scope of the Sepeda Lithium Project (fig. 47). According to Dakota Minerals (2016b),
the results show that the ore contains mainly petalite, with some associated
spodumene, and that the petalite has high Li-contents. Therefore, the results obtained
through my study are coincident with those from the borehole, confirming that the main
Li-mineral from Romano aplite-pegmatite vein is petalite.
Fig. 47 – Location of Romano old Sn mine (green point) in the Li-bearing (fig.47A) and Sn-bearing (fig.47B) catchment basin maps. The coordinates of this aplite-pegmatite vein are 41°44'14.592'' W7° 43'43.591''W. The red outline represents the planned drill area by Dakota Minerals. In Pires (2005) this zone had already been identified has having high Li-contents, as represented by the black counter lines in the fig.47A. The catchment basins create now smaller and more precise Li-rich areas.
82
Dakota Minerals also states that many of the pegmatites in that area (Sepeda
Lithium Project) do not outcrop and are only visible through old mining works. This
statement, also confirms that old Sn mines should be seen has potential places do find
Li-minerals, even more if it’s an area with high Li-content.
As for the aplite-pegmatite veins genetic model, it hasn’t een found within the
aplite-pegmatite population any apparent spatial zonation with the local granites.
Therefore, the model defended by Deveaud et al. (2014) of a low melting rate of crustal
material with successive injections of different melts, favored by regional shear-zones,
seems to be a good theory.
With this study, it can also be concluded that the occurrence of SQI in the
Barroso-Alvão aplite-pegmatite field is a more common occurrence than previously
thought. Therefore, if we are seeing a dominant spodumene vein it must be taken into
account that this spodumene could be SQI.
For example, it was assumed that the aplite-pegmatite vein in AL56 area, within
the Imerys Ceramics Portugal, S.A. mining concession, was a spodumene vein
because of having dominant spodumene. However, this would initially be a dominant
petalite vein since all the crystals rich in spodumene seem to be SQI. The same is
verified in the Dias 3 aplite-pegmatite vein, in which this isochemical replacement of
petalite by spodumene and quartz (SQI) was observed in countless crystals localized in
an old Sn mining work. SQI was also observed in Lousas aplite-pegmatite vein, where
the major Li-phase is petalite. Spodumene crystals, that probably are SQI, also occur
at the ends of the Gondiães aplite-pegmatite vein.
CHN3 aplite-pegmatite vein also belongs to this group of prior petalite when
compared to spodumene. In addition to the petalite found in the field and in the thin
sections, it was also observed its replacement to SQI. Finally, there is also cassiterite,
prior to the shear-zones that is commonly associated with petalite veins.
Finally, it seems that shear-zones cutting Li-rich aplite-pegmatite veins can
generate a recrystalization of new small crystals that are constituted by spodumene
and quartz, like what was found in the CHN3 aplite-pegmatite vein.

83
References

84

85
Amarante, M. M., Botelho de Sousa, A. and Machado Leite, M. (1999). Processing
a spodumene ore to obtain lithium concentrates for addition to glass and
ceramics bodies. IGM - Geological and Mining Institute (now named LNEG -
National Laboratory of Energy and Geology). Minerals Engineering, Vol. 12. Nº.
4. pp. 433-436. Portugal.
Cerný, P. and Ercit, T. (2005). The classification of granitic pegmatites revisited. The
Canadian Mineralogist Vol.43. pp 2005-2026
Charoy, B., Lhote, F. and Dusausoy, Y. and Noronha, F. (1992). The Crystal
Chemistry of Spodumene in Some Granitic Aplite-Pegmatite of Northern
Portugal. Canadian Mineralogist. Vol.30, pp. 639-651.
Charoy, B. and Noronha, F. (1988). A espodumena como fase litinífera de
aplitopegmatitos da região de Covas de Barroso (Norte de Portugal). Resumos
da X Reunião sobre a Geologia do Oeste Peninsular (Coimbra-Salamanca).
Charoy, B., Noronha, F. and Lima A. (2001). Spodumene-Petalite-Eucryptite: mutual
relationships and alteration style in pegmatite-aplite dykes from Northern
Portugal. Canadian Mineralogist. Vol. 39, pp. 729-746.
Deveaud, S., Silva, D., Gumiaux, C., Gloaguen, E., Branquet, Y., Lima, A., Villaros, A.,
Guillou-Frottier, L. and Melleton J. (2014). Which parameters control the Variscan
pegmatite field-scale organization?
Dória, A., Charoy, B. and Noronha, F. (1989). Fluid inclusion studies in spodumene
bearing pegmatite-aplite dykes of Covas de Barroso, Northern Portugal. ECROFI
X. Program Abstr. Londres. pp 25.
Farinha, J. (1998). Prospeção de Jazidas Litiníferas e de Metais Associados entre as
Serras do Barroso e Alvão. (Alto Tâmega). IGM - Geological and Mining Institute
(now named LNEG - National Laboratory of Energy and Geology). Portugal
Farinha, J. (2012). Cartografia Geológica de Detalhe e Levantamento Topográfico
Expedito do Filão Aplitopegmatítico N°103: Dornelas - Boticas. IGM - Geological
and Mining Institute (now named LNEG - National Laboratory of Energy and
Geology) - Departamento de Prospeção de Minérios Metálicos. Coimbra.
Farinha, J. and Lima, A. (2000). Estudo dos filões aplitopegmatíticos litiníferos da
Região do Barroso-Alvão (Norte de Portugal) Estudos, Notas e Trabalhos. Tomo
86
42. IGM - Geological and Mining Institute (now named LNEG - National
Laboratory of Energy and Geology). Lisboa. pp. 3 – 49.
Holtz, F. (1987). Étude structurale, métamorphique et géochimique des granitoides
hercyniens et de leur encaissant dans la région de Montalegre (Trás-os-
Montes, Nord Portugal). Ph. D. thesis. Nancy University. 223 pp.
Lima, A. (2000). Estrutura, Mineralogia e Génese dos Filões Aplitopegmatíticos com
Espodumena da Região do Barroso-Alvão. Ph. D. thesis in Sciences (Geologia).
Faculty of Sciences of University of Porto. Porto.
Lima, A. and Noronha, F. (2006). Da génese à aplicação tecnológica dos
aplitopegmatitos litiníferos da Região do Barroso-Alvão e de Almendra. VII
Congresso Nacional de Geologia – Resumos alargados. Évora University.
Vol 3. pp. 1183 - 1184.
Lima, A., Noronha, F. and Bobos, I. (2007). Hydrothermal Alteration Process of the
Lithium Bearing Aplite-Pegmatite Veins from the Barroso-Alvão Field, Portugal.
Memórias N.º 9 - Granitic Pegmatites: The State of the Art - Field Trip
Guidebook. Editado por Alexandre Lima e Encarnación Roda Robles. Porto.
Lima, A., Martins T., Vieira R. and Noronha F. (2011). Campo aplitopegmatítico
litinífero do Barroso-Alvão. Os seus diferentes minerais de lítio e sua melhor
aplicação futura. Mini-fórum Cyted-Iberoeka - Valorização de Pegmatitos
Litiníferos. Colaboração: DGEG-Direcção Geral de Energia e Geologia; LNEG-
Laboratório Nacional de Energia e Geologia. Apoio: CYTED-Ciencia y
Tecnología para el Desarrollo; LNEG-Laboratório Nacional de Energia e
Geologia. Lisboa.
Kogel, J., Trivedi, N., Barker, J. and Krukowski, S. (2006). Industrial Mineral & Rocks.
7ª edição. Society for Mining, Metallurgy, and Exploration, Inc. Colorado, Estados
Unidos da América (USA). 601 pp.
Martins, T. (2009). Multidisciplinary study of pegmatites and associated Li and Sn-Nb-
Ta mineralisation from the Barroso-Alvão region. Ph. D. thesis in Geology
(Geologia). Faculty of Sciences of University of Porto. Porto.
Martins, T. and Lima A. (2011). Pegmatites from Barroso-Alvão, Northern Portugal:
anatomy, mineralogy and mineral geochemistry. Cadernos Lab. Xeolóxico de
Laxe. Corunha. Vol. 36. pp. 177 - 206.

87
Martins, T., Lima, A. and Noronha, F. (2007). Locality No. 1 - An overview of the
Barroso-Alvão Aplite-Pegmatite Field. Memórias Nº 9 - Granitic Pegmatites: The
State of the Art - Field Trip Guidebook. Edited by Alexandre Lima e Encarnación
Roda Robles. Porto.
Martins, T., Lima, A., Vieira, R., Noronha, F. and Dinis Machado, J. (2006).
Aplitopegmatitos litiníferos, um exemplo de Recursos Geológicos no Município
de Ribeira de Pena, VII Congresso Nacional de Geologia – Resumos alargados,
University de Évora. Évora. Vol. 3 . pp. 1035 – 1036.
Moura, A. and Velho, J. (2012). Recursos Geológicos de Portugal. Palimage. Coimbra.
pp. 245 – 250.
Noronha, F. and Charoy, B. (1991). Pegmatitos graníticos com elementos raros da
região de Barroso (Norte de Portugal). Resumos do I Congresso de Geoquímica
dos Países de Língua Portuguesa. S. Paulo University, 1, pp 276-279.
Noronha, F., Ribeiro, M. A., Almeida, A., Dória, A., Guedes, A., Lima, A., Martins, H.
., ant’ vaia, ., Nogueira, P., Martins, T., Ramos, R. and Vieira, R. (2006).
Jazigos filonianos hidrotermais e aplitopegmatíticos espacialmente associados a
granitos (Norte de Portugal). Geologia de Portugal no Contexto da Ibéria. Évora
University. Évora. pp. 123 – 135.
Pacheco, F., Moreiras, P. and Matias, R. (2006). Caracterização Industrial do Filão
Aplito-pegmatítico com Espodumena de Alijó (Ribeira de Pena, Norte de
Portugal). VII Congresso Nacional de Geologia – Resumos alargados. Évora
University. Évora. Vol. 3. pp. 1048.
Pires, M. (1995). Prospecção Geológica e Geoquímica. Relatório interno da
Prospecção de Jazidas Litiníferas e de Metais Associados entre as Serras de
Barroso e Alvão – Ribeira de Pena. IGM - Geological and Mining Institute (now
named LNEG - National Laboratory of Energy and Geology). Lisboa.
Reichl, C., Schatz, M., and Zsak, G. (2016). World Mining Data - Minerals Production.
31º Volume. International Organizing Committee for the World Mining
Congresses. Viana.
Ribeiro, M. A. (1998). Estudo litogeoquímico das formações metassedimentares
encaixantes de mineralizações em Trás-os-Montes Ocidental: Implicações

88
metalogénicas. Ph. D. thesis in Geology. Faculty of Sciences of University of
Porto. Porto.
ant’ Ovaia, H., Ribeiro, M.A., Martins, H. C. B. and Noronha, F. (2011). Notícia
explicativa da Carta geológica de Portugal na escala 1:50000 - Folha 6D – Vila
Pouca de Aguiar. LNEG - National Laboratory of Energy and Geology. Lisboa.
Silva, D. (2014). Spatial analysis applied to the Barroso-Alvão rare-elements pegmatite
field (Northern Portugal). Master's thesis in Geology. Faculty of Sciences of
University of Porto. Porto.
Sitando, O. and Crouse, P.L. (2011). Processing of a Zimbabwean petalite to obtain
lithium carbonate. International Journal of Mineral Processing.
Viegas, H., Martins, L. and Oliveira, D. (2012) Alguns aspectos da geoestratégia global
do lítio. O caso de Portugal. Geonovas, n.º 25. pp. 19-25.
Webber, K. (2007). Crystallization Dynamics. Granitic Pegmatites: the state of the art.
International Symposium. 6º. Porto. Portugal.
Webber, K., Simmons, W. and Falster A. (2005). Rapid Conductive Cooling of Sheet-
Like Pegmatites.
List of websites consulted
Australian Government – Geoscience Australia (2013). Lithium. Available at Australian
atlas of minerals resources, mines & processing centres website:
http://www.australianminesatlas.gov.au/aimr/commodity/lithium.html (retrieved:
17/09/2016)
Bryner, M., Clarke, G., Jansen, A., Patel, A. and Spotnitz R. (2013). Lithium-Ion
Batteries. American Institute of Chemical Enginners (AIChE). New York.
Available at: https://www.aiche.org/sites/default/files/cep/20131033-64_r.pdf
(retrieved: 18/09/2016)
Dakota Minerals (2016). Strategic Lithium Acquisition in Portugal (Announcement).
Available at:

89
https://www.google.pt/url?sa=t&rct=j&q=&esrc=s&source=web&cd=1&ved=0ahU
KEwifk--
u9pvPAhWHCsAKHXelCTQQFggbMAA&url=http%3A%2F%2Fwww.dakotaminer
als.com.au%2Findex.php%2Fasx-announcements%2F2016%2Fdownload-
file%3Fpath%3D1559741.pdf&usg=AFQjCNFCi0vSS5YRVV_A2Z7JHx0-
SrM5Qg&sig2=pWFy_pS6MPP1ueIms3DyZw&bvm=bv.133178914,d.ZGg&cad=r
ja (retrieved: 15/09/2016)
Dakota Minerals (2016a). Drilling Commences at Sepeda Lithium Project, Portugal
(Announcement). Available at Investor Insight website:
http://www.asx.com.au/asxpdf/20160830/pdf/439rynq0jmpf50.pdf (retrieved:
22/09/2016)
Dakota Minerals (2016b). Phase two Drilling brought forward after Encouraging Initial
Drill Results from Sepeda Lithium Project – Portugal. (Announcement). Available
at:
http://www.dakotaminerals.com.au/index.php/asx-
announcements/2016/download-file?path=1602965.pdf (Retrieved: 10/10/2016)
Dakota Minerals (2016c). Major European Lithium Discovery Confirmed - Sepeda
Project, Portugal (Announcement). Available at:
http://www.dakotaminerals.com.au/index.php/asx-
announcements/2016/download-file?path=1614613.pdf (Data de consulta:
8/11/2016)
European Comission (2014). Report on critical raw materials for the EU – Non-critical
raw materials profiles. Available at European Comission website:
http://ec.europa.eu/DocsRoom/documents/7422/attachments/1/translations
(retrieved: 16/09/2016)
European Comission (2014a). Annexes to the report on critical raw materials for the
EU. Available at European Comission website:
http://ec.europa.eu/DocsRoom/documents/10011/attachments/1/translations
(retrieved: 15/09/2016)

90

91
Annexes

92

93
Annex 1
Illustration of Li-bearing catchment basins final result, mentioned in Chapter 3:
“ acias_hidro_final_cortadas".
SS sampling points
Li-rich aplite-pegmatites
Aplite-pegmatites
Watercourses
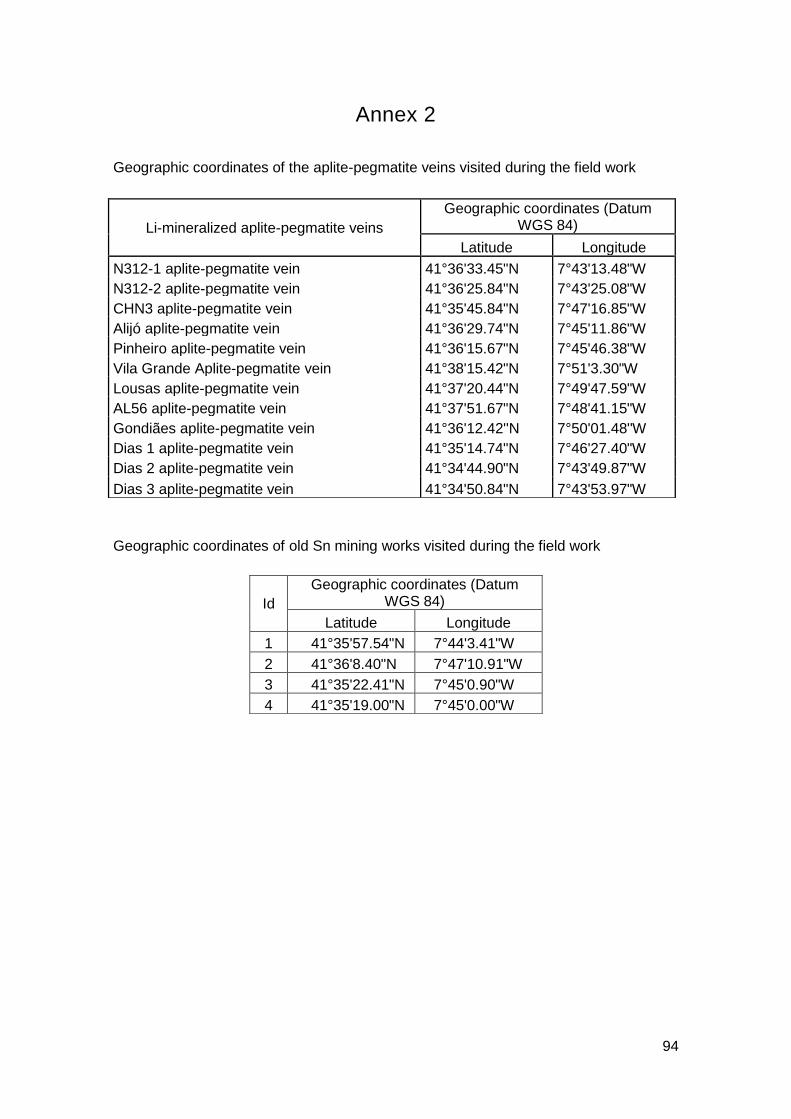
94
Annex 2
Geographic coordinates of the aplite-pegmatite veins visited during the field work
Geographic coordinates of old Sn mining works visited during the field work
Li-mineralized aplite-pegmatite veins
Geographic coordinates (Datum WGS 84)
Latitude Longitude
N312-1 aplite-pegmatite vein 41°36'33.45"N 7°43'13.48"W
N312-2 aplite-pegmatite vein 41°36'25.84"N 7°43'25.08"W
CHN3 aplite-pegmatite vein 41°35'45.84"N 7°47'16.85"W
Alijó aplite-pegmatite vein 41°36'29.74"N 7°45'11.86"W
Pinheiro aplite-pegmatite vein 41°36'15.67"N 7°45'46.38"W
Vila Grande Aplite-pegmatite vein 41°38'15.42"N 7°51'3.30"W
Lousas aplite-pegmatite vein 41°37'20.44"N 7°49'47.59"W
AL56 aplite-pegmatite vein 41°37'51.67"N 7°48'41.15"W
Gondiães aplite-pegmatite vein 41°36'12.42''N 7°50'01.48''W
Dias 1 aplite-pegmatite vein 41°35'14.74"N 7°46'27.40"W
Dias 2 aplite-pegmatite vein 41°34'44.90"N 7°43'49.87"W
Dias 3 aplite-pegmatite vein 41°34'50.84"N 7°43'53.97"W
Id
Geographic coordinates (Datum WGS 84)
Latitude Longitude
1 41°35'57.54"N 7°44'3.41"W
2 41°36'8.40"N 7°47'10.91"W
3 41°35'22.41"N 7°45'0.90"W
4 41°35'19.00"N 7°45'0.00"W


![Mining Records Curator Arizona Geological Survey Tucson ...docs.azgs.az.gov/SpecColl/2008-01/2008-01-0556.pdf · loca] pegmatite-aplite dikes all locally strongly fo]iated (generally](https://static.fdocuments.net/doc/165x107/5ecbdb89daa81a6f1a66ed71/mining-records-curator-arizona-geological-survey-tucson-docsazgsazgovspeccoll2008-012008-01-0556pdf.jpg)
