Literature review ZZ diboson
19
Department of Physics and Astronomy Literature Review ZZ diboson production measurements Dimitris Kyriazopoulos Supervisor: Stathes Paganis August 2013
description
Literature review ZZ diboson - Dimitris Kyriazopoulos - The University of Sheffield
Transcript of Literature review ZZ diboson

Department of Physicsand Astronomy
Literature ReviewZZ diboson production measurements
Dimitris KyriazopoulosSupervisor: Stathes Paganis
August 2013

1 IntroductionThe production of pairs of Z bosons (ZZ diboson) is of great interest in particlescollisions and it has been actively studied on the last years.Although the productionof Z pairs is much smaller than the other diboson cross sections, the significance ofthe ZZ diboson state lies on both Higgs boson and Standard Model studies. Fromthe Higgs side, it has been proven to be the state with the cleaner signal, by thedecay to 4 leptons. This particular studies provides a great chance for precisiontests of Standard Model in the Electroweak sector at the TeV scale and is a directprobe for Physics Beyond the Standard Model as well as an irreducible backgroundfor the Higgs→ ZZ→ 4leptons searches. The hints of New Physics can be derivedby, the study of the neutral triple gauge boson couplings (nTGCs)[1],[2] and thedeviation from Standard Model predictions or by the decay of the hypotheticalRandal-Sundrum Graviton to a ZZ resonance.
Figure 1: Leading order Feynman diagrams for ZZ production through the qq andgg initial state at hadron colliders. The s-channel diagram, (c), contains the ZZZand ZZγ neutral TGC vertices which do not exist in the SM.
1

Figure 2: Higgs boson decay to ZZ → 4 leptons
2 ZZ properties
2.1 ZZ production on hadron colliders
On hadron colliders. the production of the ZZ resonance is achieved with thequark-antiquark annihilation (qq → ZZ) Leading Order (LO) process at tree levelvia t- and u- channel. In addition, there is a small contribution from the gluon-gluon fusion process (gg → ZZ) via quark box diagrams. Despite being Next-to-Next to Leading Order (NNLO) process are suppressed by a factor of α2
s, theycontribute around 5%[4] in the total ZZ diboson production, due to the high gluoncontent on the energies scale at the LHC. Lastly, it should be mentioned that isvery common for an off-shell photon (γ∗) to be indistinguishable from the statewith a Z, especially on the low energy scales. As the result of that, the qq→ZZprocess involves a small contribution from those γ∗ processes.
The decay modes of the ZZ resonance, are based on the ones of single Z bosons.Z bosons decay to quark-antiquark pair followed by hadronization, to a neutrino-antineutrino pair, and to a pair of leptons with oppposite charge, since the Zboson charge is 0. The branching ratios (BRs) for the single Z boson decays arewell known[3]. Those are 69.9% for qq̄, 20% for νν̄ and 10.1% for l+l−. Whenthere is a ZZ decay, each boson decays independently, so the branching ratios forthe final states are the products of the two single Z boson decays.
BR ( ZZ → eeee) = 0.113 ± 0.008BR ( ZZ → µµµµ) = 0.113 ± 0.014BR ( ZZ → eeµµ) = 0.226 ± 0.016
Table 1: Branching ratios for ZZ
In our studies, we investigate ZZ decays to 4 leptons, where the leptons could
2

be either electrons, or muons. The branching ratios for the ZZ→ 4 leptons analysisare shown on table 1:
2.2 New Physics from ZZ
As it has already been mentioned, the ZZ production provides a direct probe forNew Physics. The ZZZ and ZZγ vertices are forbidden at tree level on the s-channel. Some beyond the Standard Model model predict values for those verticesat the level of O(10−4) in one loop corrections. Those anomalous neutral triplegauge couplings are introduced by the assumption that Beyond Standard ModelPhysics lie on at a mass scale Λ, further than current experiments’ reach. Thesimplest model for generating anomalous nTGCs is from heavy fermion loops aris-ing from a new generation of fermions. New heavy fermions arise in many modelsbeyond the SM, such as SUSY, GUTs and Technicolor. At this energy scale the re-sulting new particles are thus not directly observable, and the only observable effectof the New Physics is anomalous interactions of Standard Model particles. Sincein ZZZ and ZZγ couplings there are always at least two identical particles, Bosestatistics forbid on both vertices all particles being on-shell and therefore at leastone of the bosons must be off-shell. Non-zero nTGCs would manifest themselvesas an increased ZZ productioncross section, particularly at high centre-of-mass en-ergies. This means that the enhancement of the cross section is most apparent athigh ZZ invariant mass and high Z transverse momentum, and at large scatteringangles.
3 ZZ Cross sectionThe main element of interest in a ZZ diboson study is the cross-section mea-surement for a non-resonant production. One definition is to use a zero -widthapproximation for the Z bosons and calculate a total cross section. Alternatively,the natural width of the Z bosons can be used, and requirements made on theinvariant masses of the Z bosons to define a cross section. Measurements are alsopresented in a restricted phase space called fiducial volume, which correspondsclosely to the experimental selection requirements . The corresponding fiducialcross section has smaller the- oretical uncertainties than the total cross section,since in extrapolating from the experimentally measured fiducial cross section tothe total cross section additional uncertainties arise due to uncertainties on thePDF and the factorisation and renormalisation scales. The fiducial cross sectionsare measured using decays where both Z bosons decay to either electrons or muons.They are then extrapolated to the total cross section, correcting for the geometricacceptance of the fiducial volume and the branching fractions to leptons.
3

3.1 Theoretical Predictions[4]
The cross production of ZZ diboson is the lowest from all the possible dibosonicstates. Predictions for up until the highest LHC energy scale have been made ap-plying NLO corrections, using the MCFM NLO generator. The selection of partondistribution function (PDF) plays an important role in the theoretical calculations.A PDF is defined as the probability density for finding a particle with a certainlongitudinal momentum fraction x at resolution scale Q2. Due to the fact thatpartons can’t be observed as free particles, perturbative QCD isn’t able to extractthe parton densities. However, with QCD it is possible study variation of partondensity with resolution scale provided by external probe. For the theoretical cal-culations below the sets of Martin, Stirling, Thorne and Watt [11] (MSTW) wereused.
Figure 3: NLO boson production in pp-collisions. The decay branching ratios ofthe W’s and Z’s into one species of leptons are included.
4 Previous experimental results
4.1 LEP
The first observation of the ZZ diboson production was in 1997 at the LargeElectron-Positron collider at CERN (LEP)[5], The L3 experiment published thefirst observation and cross section measurement of on-shell ZZ production, based
4

Figure 4: Total cross sections for ZZ production as a function of energy withMCFM. The renormalisation scale and factorisation scales are MZ. Vector bosonsare produced exactly on-shell and no decays are included.
on 55.3 pb−1 of data collected at an average centre-of-mass energy of 182.7 GeV.All the visible decay channels were used in the measurement. Whilst no eventswere observed in the 4 leptons final state, a total of 63 were observed in the othervisible final states. The majority of these events were in the hadronic channel,which suffered from high backgrounds. In this channel a neural network methodwas used to distinguish the signal events from the background. A log-likelihood fitof the neural network output and the observed mass spectra in the other channelswas used to combine the channels, and gave a cross section of σZZ = 0.30± 0.22 pb,in very good agreement with the Standard Model prediction. Measurements of theZZ production cross section in e+ e− collisions were later made by all four LEPexperiments (ALEPH, DELPHI, OPAL) at centre of mass energies between 183GeV and 209 GeV. These have been combined at each centre of mass energy using aχ2 minimisation technique, taking into account correlations between the systematicuncertainties. The resulting combined cross sections as a function of centre of massenergy, shown in figure ??, are in good agreement with the theoretical predictions.
5

Figure 5: Measurements of the ZZ production cross section in e+ e− collisionscross-section, compared to theoretical predictions. The measurements are a com-bination of measurements from the four LEP experiments.
4.2 Tevatron
Both the major Fermilab Tevatron experiments, CDF and D0, have thouroughlystudied the ZZ diboson production at proton-antiproton collisions. They providedsome really interesting results on the cross section σ(pp̄→ Zγ∗Zγ∗) at
√(s) = 1.96
TeV.
Figure 6: Feynmann diagram of ZZ production at proton-antiproton collisions
6

4.2.1 CDF experiment
The latest ZZ → 4leptons CDF result (ref) was presented on June 2013 using thefull CDF dataset (9.7fb−1) [6].
The CDF selection, is based on the transverse energy of the leptons and theirkinematic properties. An exactly 4 leptons selection is performed (eeee, µµµµ,2e2µ, 2µ2e). A requirement of at least one lepton with transverse energy above 20GeV/c2 and above 10 GeV/c2 for the rest. Also, isolation criteria are applied tothe leptons, and cuts for the dilepton mass where M12 should be 76 - 106 GeVc2,which should be the closest to Z mass PDG value (ref) and M34 should be 40 -140 GeV/c2. In the case of 4e or 4µ, the leptons can be arranged in several waysto reconstruct the 2 Z’s, we choose the combination for which the two dileptoninvariant mass are the closest to the nominal mZ.
A small background contribution is expect to derive from Z(γ)+jets events,where the photon or a jet is mis-identified as a lepton. The rate of the backgroundcoming from fake leptons is evaluated from data, measuring the probability for ajet-like object to be reconstructed as a real lepton. This fake rate is then appliedto events with 2 or 3 real leptons, obtaining the estimate for this background.∫
L=9.7 fb−1
Process candidate eventsZZ 9.59 ± 1.55Z(γ)+jets 0.06 ± 0.03Total Expected 9.65 ± 1.55Data 7
ZZ → ```′`′ Signal Region
Table 2: Number of candidates on the CDF full dataset analysis
Finally, the cross-section calculated is
σ(pp̄→ ZZ) = 1.02+0.43−0.34(stat.)
+0.11−0.07(syst.) pb
Whereas the theoritical NLO prediction using the MCFM generator is:
σ(pp̄→ ZZ) = 1.4± 0.1 pb
7

Figure 7: Distribution on M12 and M34 on CDF full dataset analysis
Figure 8: Distribution of 4 leptons invariant mass
8

4.3 D0 experiment
The latest ZZ cross section measurement calculated by the D0 experiment in Fer-milab, was presented on April 2013[7]. The analysis method is similar to the oneof the CDF experiment. High transverse momentum criteria are applied to theleptons, where in both electron and muon cases, the transverse momentum shouldbe higher that 15 GeV. Also, extra cuts are applied for the kinematics of the lep-tons (∆R,η). It also should be mentioned that especially for electrons, differentcriteria apply based on the information from the calorimeters. In addition, elec-tron candidates must pass a neural net discrimanant so as to be separated fromjets.
Similar to the CDF analysis, the main background source is Z+(γ)+jets withsmaller contributions from WZ + jets, WW + jets, W +jets, and multijet produc-tion with ≥4 jets). Contamination comes when a jet is falsely reconstructed as anisolated lepton. In order to estimate the background contribution a data-drivenmethod is used in order to calculate the probability of a jet to fake an isolatedlepton.
The integrated luminosity for the analysis was 9.6 fb−1 and the number of thecandidate events is shown on the table 3 ∫
L=9.6 fb−1
Process candidate eventsInstrumental bkg 1.32 ± 0.01Non ZZ-bkg 1.48 ± 0.01Total Expected 16.8 ± 1.9Data 13
Table 3: Number of candidates on the D0 full dataset analysis
In order to calculate the cross-section, a negative log-likelihood function wasperformed by taking as input the expected signal acceptance, the number of ex-pected The cross section, after the NLO correction with theoretical prediction ofthe MCFM generator, was calculated to be
σ(pp̄→ ZZ) = 1.05+0.37−0.30(stat.)
+0.12−0.06(syst.)± 0.06(lumi.) pb
The measured cross section values from D0 are consistent with the SM expec-tation of 1.43 ± 0.10 pb.
9
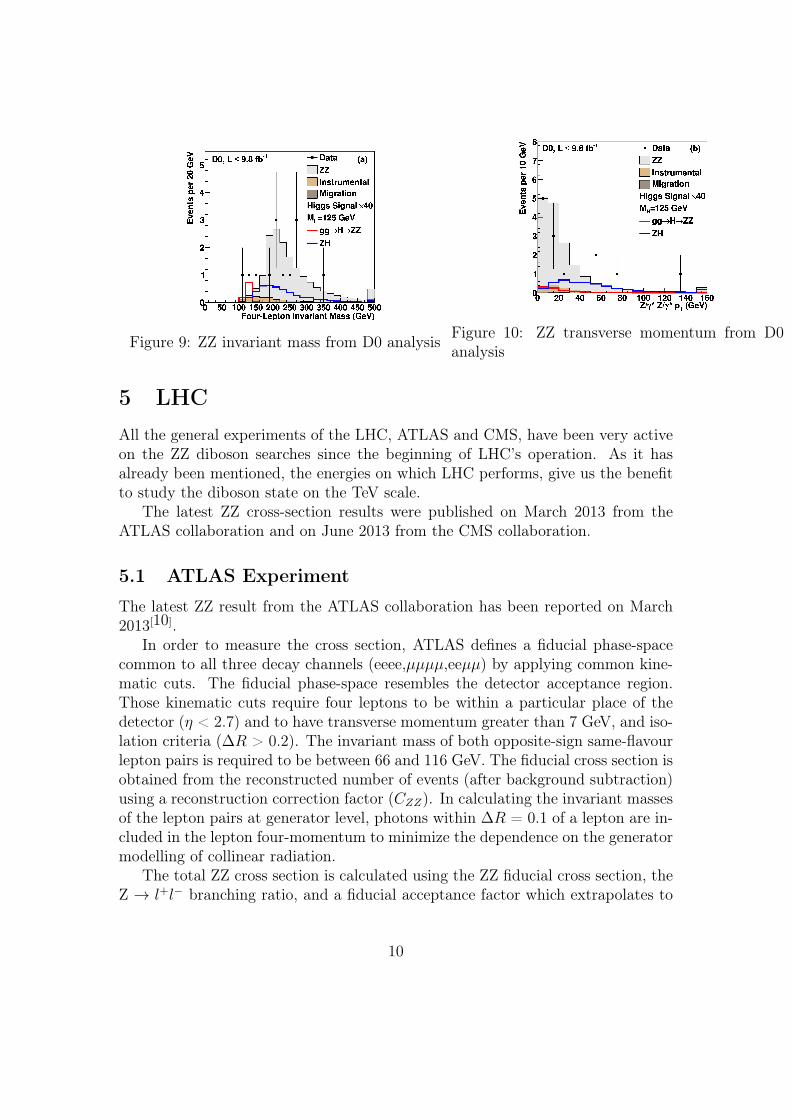
Figure 9: ZZ invariant mass from D0 analysis Figure 10: ZZ transverse momentum from D0analysis
5 LHCAll the general experiments of the LHC, ATLAS and CMS, have been very activeon the ZZ diboson searches since the beginning of LHC’s operation. As it hasalready been mentioned, the energies on which LHC performs, give us the benefitto study the diboson state on the TeV scale.
The latest ZZ cross-section results were published on March 2013 from theATLAS collaboration and on June 2013 from the CMS collaboration.
5.1 ATLAS Experiment
The latest ZZ result from the ATLAS collaboration has been reported on March2013[10].
In order to measure the cross section, ATLAS defines a fiducial phase-spacecommon to all three decay channels (eeee,µµµµ,eeµµ) by applying common kine-matic cuts. The fiducial phase-space resembles the detector acceptance region.Those kinematic cuts require four leptons to be within a particular place of thedetector (η < 2.7) and to have transverse momentum greater than 7 GeV, and iso-lation criteria (∆R > 0.2). The invariant mass of both opposite-sign same-flavourlepton pairs is required to be between 66 and 116 GeV. The fiducial cross section isobtained from the reconstructed number of events (after background subtraction)using a reconstruction correction factor (CZZ). In calculating the invariant massesof the lepton pairs at generator level, photons within ∆R = 0.1 of a lepton are in-cluded in the lepton four-momentum to minimize the dependence on the generatormodelling of collinear radiation.
The total ZZ cross section is calculated using the ZZ fiducial cross section, theZ → l+l− branching ratio, and a fiducial acceptance factor which extrapolates to
10

the full phase-space. The total cross section is defined with both Z bosons havingmasses between 66 GeV and 116 GeV.
Similar to Tevatron experiments, the main background arises from Z+jetsevents, from other diboson (W+W−/W±Z) final states and tt̄ and single top)where the t → Wb decay is followed by a leptonic W boson and a semileptonicb-quark decay. Following the data-driven methods used on Tevatron, ATLAS ap-plied a "fake factor" method at the calculation of tthe background. By definingcontrol regions on data, the probability of a jet faking a lepton is measured. Usingthis probability, the numbers of events with 3 "good" and 1 "fake" leptons or 2"good" and 2 "fake" leptons, are measured, as the main background contribution.
The background from ZZ → 2l2taus and ZZ → 4taus where the taus decay toelectrons or muons, is negligible and it is corrected in the reconstruction acceptancefactor defined abovee. On the ATLAS analysis,the important components for thisare the inner tracking detector (ID),the electromagnetic calorimeter (ECAL) andthe muon spectrometer (MS).
Following the previous analysis, ATLAS observes 305 events.
Figure 11: Event yield on the ATLAS analysis with the corresponding reconstruc-tion factors (Czz)
The ZZ cross section is determined using a likelihood fit with the systematicuncertainties included as nuisance parameters. The final result for the fiducialcross section corresponding to the phase-space
The fiducial cross section was calculated to be:
Figure 12: Event yield on the ATLAS analysis with the corresponding reconstruc-tion factors (Czz)
This result is consistent with the Standard Model prediction of 21.1+0.9−0.7 fb
calculated with the MCFM generator.
11

Also, ATLAS reported cross sections for all the different decay channels
Figure 13: Cross sections for all the analysis channels on ATLAS
After the inclusion of the acceptance factor (Azz) the total cross section wascalculated to be:
Figure 14: Event yield on the ATLAS analysis with the corresponding reconstruc-tion factors (Czz)
Figure 15: Distribution of M12 and M34 on the ATLAS analysis
12

Figure 16: ZZ invariant mass from ATLAS
Figure 17: ZZ transverse momentum from ATLAS
5.2 CMS experiment
The latest ZZ cross section result from the CMS collaboration has been reportedon July 2013[9].
The analysis method is based on lepton reconstruction techniques which includeinformation from all the CMS subdetectors. The particles are classified into mu-tually exclusive categories as, charged hadrons, neutral hadrons, photons, muons,and electrons. The electrons are reconstructed within the geometrical acceptance,
13

|η| < 2.5, and for transverse momentum pT > 7 GeV. Muons are reconstructedwithin |η|< 2.4 and pT > 5 GeV. The reconstruction combines the informationfrom both the silicon tracker and the muon spectrometer. Also, the analysis in-cludes tau leptons which are identified in their leptonic decay mode, either anelectron or muon as a measurable decay product, or as semileptonic denoted withhadrons among the decay products.
For both electrons and muons the isolation cut (∆R =√
∆η2 + ∆φ2 is , lessthan 0.4, whereas for taus is 0.5.
Furthermore, contrary to ATLAS analysis, CMS performs a QED final stateradiation selection (FSR). Photons reconstructed within |η| < 2.4 are possiblefinal state radiation (FSR) candidates. To be accepted as an FSR candidate, areconstructed photon must either have a transverse momentum pT > 2 GeV andbe found within ∆R < 0.07 from a selected lepton candidate, or have pT > 4 GeVand be found isolated within 0.07 < DR < 0.5 around a selected lepton candidatesand its isolation observable divided by the transverse energy within a cone, shouldpass a specific cut. The performance of the FSR selection algorithm has beenmeasured using MC simulation samples, and the rate was verified with single-Zand ZZ data events. The photons within the acceptance for the FSR selectionare measured with an efficiency of 50"%" and with a mean purity of 80%. FSRphotons are selected in 5% of single-Z events with muon pairs, and 0.5% of single-Zevents with electron pairs.
On event level, at least one lepton with pT > 15 GeV is required in orderto trigger the event. When building the Z candidates, only the FSR photonsassociated with the closest lepton and which make the ”dressed” lepton pair masscloser to the nominal Z mass are kept, with a maximum mass mZZγ of 100 GeV.The Z candidate should formed with a pair of leptons of the same flavour andopposite charge. The pair with an invariant mass closest to the nominal Z mass isdenoted mZ1 and retained if it satisfies 60 < mZ1 < 120 GeV. We then considerall remaining leptons and require a second pair of leptons with mass denoted mZ2,to also satisfy 60 < mZ2 < 120 GeV. In case of Z2 candidates multiplicity the onewith the higher pT above 20 GeV is selected.
For the taus final state, events are required to have one Z1 candidate with onelepton at pT > 20 GeV and the other at pT > 10 GeV, and Z2 with a tau decayingto electrons or muons or semi-leptonic. The leptons from the t leptonic decays arerequired to have pT > 10 GeV. The FSR correction is not applied for the lltt finalstate. The invariant mass of the reconstructed Z1 is required to satisfy 60 < mZZ< 120 GeV, and that of the Z2 to satisfy mmin < mtt < 90 GeV, where mmin =20 GeV for Z2 → tt → em final states, and 30 GeV for all others. At low mtt, theZ2 is restricted by the selection requirements on the pT of the leptons.
The origin of the background contribution is similar to the ATLAS, with the
14

majority coming from Z+jets. Again, a lepton misidentification probability ismeasured on control regions. The control region for Z+X, where X stands for bb̄, cc̄, gluon or light quark jets, is obtained by selecting events containing Z1 andtwo additional lepton candidates. The Z1 passes usual selection requirements andrelaxed criteria on isolation and identification are applied to the two additionalleptons. To take into account all possible sources of backgrounds there are tworegions defined, one where both additional leptons pass the loose requirements andanother one, where one of the additional leptons passes all the final requirements.Finally, the number of the "misidentified" events is calculated.
The measured yields are used to evaluate the ZZ production cross section.
Figure 18: Event yield from CMS
Again, a signal acceptance factor is applied, from simulation and corrected foreach individual lepton flavor in bins of pT and h using factors obtained with the"tag-and-probe" technique. To include all final states in the cross section calcu-lation a simultaneous fit on the number of observed events in all decay channelsis performed. The likelihood is written as a combination of individual channellikelihoods for the signal and background hypotheses with the statistical and sys-tematic uncertainties in the form of scaling nuisance parameters. Each tau decaymode is treated as a separate channel.
It is clearly shown that CMS measured cross section is consistent with the SMprediction.
15

Figure 19: Cross section measurments from CMS
Figure 20: (a) Distribution of the four-lepton reconstructed mass for the sum of the4e, 4m and 2e2m decay channels. Points represent the data, shaded histogramsrepresent the expected ZZ signal and reducible background. (b) Reconstructedmass of Z1. (c,d) Plots demonstrate correlation between reconstructed Z1 and Z2masses for (c) 4e, 4m, 2e2m and (d) lltt final states.
16

6 SummarySo far,all the ZZ cross sections measurements, show consistency with the expectedStandard Model predictions without any unexpected deviations. However, studiesgo on in order to investigate further open issues like the limits on the anomaloustriple gauge bosons couplings, or high mass resonances. After the LHC upgrade,when the energy limit will reach 14 TeV, more detailed studies can be performedin order to answer all the open questions.
Figure 21: Comparison of experimental measurements and theoretical predictionsof the total ZZ production cross section as a function of centre-of-mass energy
17

References[1] J. Ellison and J. Wudka, Study of trilinear gauge-boson couplings at the Teva-
tron collider, Annu. Rev. Nucl. Part. Sci. 48, 33 (1998)
[2] G. J. Gounaris, J. Layssac, and F. M. Renard Off-shell structure of theanomalous Z and γ self-couplings, Phys. Rev. D62 (2000) 073012, arXiv:hep-ph/0005269.
[3] K. Nakamura et al. (Particle Data Group), Review of particle physics, J. Phys.G 37, 075021 (2010)
[4] J. M. Campbell, R. K. Ellis, and C. Williams,Vector boson pair production atthe LHC, JHEP 1107 (2011) 018, arXiv:1105.0020.
[5] The LEP Collaborations ALEPH, DELPHI, L3, OPAL, and the LEP Elec-troweak Working Group,A Combination of preliminary electroweak measure-ments and constraints on the Standard Model, arXiv:hep-ex/0612034.
[6] The CDF collaboration, Z0Z0 cross section measurement in llll and llνν nalstates using the full CDF dataset. CDF note 10957, 2013
[7] The D0 collaboration, Measurement of the ZZ production cross section andsearch for the standard model Higgs boson in the four lepton final state in pp̄collisions, Phys. Rev. D 88, 032008 (2013) - arXiv:1304.5422
[8] The D0 collboration,Studies of Gauge Boson Pair Production and TrilinearCouplings, Phys. Rev. D 56, 6742 (1997), hep-ex/9704004
[9] The CMS collaboration,Measurement of the ZZ production cross section andanomalous trilinear gauge couplings in llll decays at
√s = 8 TeV at the LHC,
CMS PAS SMP-13-005, 2013
[10] The ATLAS collaboration, Measurement of the total ZZ production cross sec-tion in proton-proton collisions at
√s = 8 TeV in 20 fb−1 with the ATLAS
detector, ATLAS-CONF-2013-020, 2013
[11] A. D. Martin, W. J. Stirling, R. S. Thorne and G. Watt,Parton distributionsfor the LHC, Eur. Phys. J. C63 (2009) 189–285 [0901.0002]
18