
Literature Review of the Agricultural Distribution ... · For comments, suggestions or further...
86
For comments, suggestions or further inquiries please contact: Philippine Institute for Development Studies The PIDS Discussion Paper Series constitutes studies that are preliminary and subject to further revisions. They are be- ing circulated in a limited number of cop- ies only for purposes of soliciting com- ments and suggestions for further refine- ments. The studies under the Series are unedited and unreviewed. The views and opinions expressed are those of the author(s) and do not neces- sarily reflect those of the Institute. Not for quotation without permission from the author(s) and the Institute. July 2001 The Research Information Staff, Philippine Institute for Development Studies 3rd Floor, NEDA sa Makati Building, 106 Amorsolo Street, Legaspi Village, Makati City, Philippines Tel Nos: 8924059 and 8935705; Fax No: 8939589; E-mail: [email protected] Or visit our website at http://www.pids.gov.ph DISCUSSION PAPER SERIES NO. 2001-14 Literature Review of the Agricultural Distribution Services Sector: Performance, Efficiency and Research Issues Ponciano S. Intal Jr. and Luis Osman Ranit
Transcript of Literature Review of the Agricultural Distribution ... · For comments, suggestions or further...

For comments, suggestions or further inquiries please contact:
Philippine Institute for Development Studies
The PIDS Discussion Paper Seriesconstitutes studies that are preliminary andsubject to further revisions. They are be-ing circulated in a limited number of cop-ies only for purposes of soliciting com-ments and suggestions for further refine-ments. The studies under the Series areunedited and unreviewed.
The views and opinions expressedare those of the author(s) and do not neces-sarily reflect those of the Institute.
Not for quotation without permissionfrom the author(s) and the Institute.
July 2001
The Research Information Staff, Philippine Institute for Development Studies3rd Floor, NEDA sa Makati Building, 106 Amorsolo Street, Legaspi Village, Makati City, PhilippinesTel Nos: 8924059 and 8935705; Fax No: 8939589; E-mail: [email protected]
Or visit our website at http://www.pids.gov.ph
DISCUSSION PAPER SERIES NO. 2001-14
Literature Review of the AgriculturalDistribution Services Sector: Performance,
Efficiency and Research Issues
Ponciano S. Intal Jr. and Luis Osman Ranit

Literature Review of the Agricultural Distribution Services Sector:
Performance, Efficiency, and Research Issues
Abstract:
This literature review characterizes the structure and performance of the agricultural
distribution sector in the Philippines. Drawing from previous studies, it describes agricultural
marketing in the country as a complex and fragmented system. The paper looks at several
models that deal with market integration and price correlations, and emphasizes the urgency
of applying these methods in analyzing different commodity markets in the country. Based
on the existing literature, it discusses issues such as price margins, monopoly power in
agricultural distribution, transportation, infrastructure, and technology. Finally, it presents a
number of major research gaps and corresponding suggestions for research.
Keywords: agricultural distribution sector, agricultural market, agricultural performance, distribution channels, literature review

Literature Review of the Agricultural Distribution Services Sector:
Performance, Efficiency and Research Issues
Ponciano S. Intal, Jr. and Luis Osman Ranit1 I Introduction
A competitive agriculture sector requires not only more productive farms and
agricultural processors, but also a more efficient agriculture distribution system. This is
especially the case for the Philippines being an archipelago of thousands of islands, of
which only a few are large enough to have the scale of farming that allow economies of
scale in processing. Thus, in comparison to Vietnam or Thailand or Peninsula Malaysia,
the Philippine agricultural economy is far more fragmented and vulnerable to the
inefficiencies and vagaries of the country's distribution system. There is a familiar
lament about the state of the Philippine agricultural distribution system; that is, it is
cheaper to bring corn from Bangkok to Manila than to bring corn from Cotabato to
Manila. This familiar lament exemplifies a fragmented agricultural economy.
A fragmented agricultural economy has important negative welfare effects on the
country. First, as the Congressional Commission on Agricultural Modernization
(Congress of the Philippines, 1997, p.72) noted, ”marketing inefficiencies result in
farmers’ getting low prices for their produce and consumers’ paying more than the fair
price”. Second, unexpected large harvests leave farmers with much lower farm prices in a
1 Professor of Economics and Associate Professor of Business respectively, De La Salle University. The authors would like to express their sincere thanks to Ms. Maricar Garde for her excellent research assistance.

2
fragmented economy than in a well-functioning distribution system. Third, unexpected
demand surges end up in increased imports rather than increased sales by domestic
farmers. Fourth, an inefficient distribution system leads to additional pressure for
agriculture protection in order for the domestic producers to be able to compete with
imports in greater Manila, the country's largest net deficit food market. And finally, the
resulting high food prices lead to demands for higher wages.
The last mentioned effect deserves elaboration. Higher wages without
corresponding increases in labor productivity means higher unit labor costs, which other
things being equal, result in the decline of the international competitiveness of the
country's export and import substituting industries. In addition, higher wages lead to
higher than necessary wage bill in the country's non-traded sectors (e.g. government).
Indeed, for the government that is faced with tight budget constraint, the higher wage bill
leaves less room for expenditures in the very important areas of operations and
maintenance as well as capital expenditures. In short, the protection -induced higher
domestic food prices, caused in part by the fragmentation of the agricultural economy and
the inefficiency of the agricultural distribution sector, have significant macroeconomic
impact on the rest of the economy.
The macroeconomic implications of high food prices cannot be underestimated.
Indeed, it can be argued that one key reason for the comparatively lackluster performance
of the Philippine manufacturing sector during the 1990's was the comparatively higher
wages in the country than in competitor countries like Indonesia and China. The higher
domestic wages coincided with the significant rise in agriculture protection, and the
consequent higher food costs, in the country during the latter 1980's and the 1990's.
Aggravating the cost-push effect of the higher food prices on the manufacturing sector
were the decline in industrial protection and the appreciation of the Philippine peso. As a
result, many manufacturing plants folded up and it has been mainly in the semi-skilled,
less wage-sensitive industries like electrical machinery and automobile parts where the
Philippine manufacturing sector registered robust growth.

3
Even the country's non-traded sector has been affected by the agriculture
protection-induced higher wages during the 1990's. Thus, for example, the World Bank
(2000) asserts that the rise in the share of personnel expenditures in the total government
budget in the 1990's can be explained in part by the salary increases during the decade
induced in part by higher food costs. Because of the higher wage bill, the government
budget for operations and maintenance suffered leading to, for example, poorly
maintained irrigation facilities, roads and bridges. It must be emphasized that the poor
maintenance of the country's main irrigation facilities, for example, has contributed to the
significant drop in recent years in the proportion of farms irrigated compared to the total
programmed irrigated areas (Tolentino, et. al., 2001). Clearly, with the drop in the actual
irrigation rate, agricultural productivity is ultimately compromised. Similarly, the
inefficiency of the agricultural distribution system can be attributed in part to poor rural
infrastructure facilities such as rural roads and bridges.
It is therefore important that the government gives as much policy importance to
the distribution system as to the production sector. How can the Philippines have an
efficient and dynamic agricultural distribution services sector? How can the sector be a
catalyst for changes and innovation in the agricultural sector? Making the distribution
system and the market work better for the farmers, processors and consumers is a
continuing challenge. This means, on the one hand, allowing private sector reforms
under competitive or contestable conditions that encourage continuing private investment
in the distribution services sector. This also means, on the other hand, high social returns
to the government's complementary roles and investments in the sector. By making the
market work better, farmers and processors are provided better information on the
changing demands on the agricultural sector and its products. With markets working
better, there can be greater coordination and collaboration among farmers, distribution
service providers, and processors in order to meet effectively the changing demands for
agri-based products. With the agricultural sector remaining a major economic sector of
the Philippine economy, then the more efficient the distribution sector is, the greater is
the social benefit to the whole society.
4
The critical role of an efficient, progressive, and dynamic agricultural distribution
services sector for the long term competitiveness, productivity, and dynamism of the
Philippines in an increasingly liberalized trading environment calls for improved
understanding of the sector. Specifically, there is a need to better understand the
following:
(a) the organization and dynamics of the agriculture distribution services sector,
(b) the interaction and interrelationship of markets and prices across area and
over time, and
(c) the impact of government policies and programs on the workings of
agricultural markets and the agricultural distribution services sector.
This implies the need for a research program towards a deeper understanding of the
Philippine agricultural distribution sector and agricultural markets.
This paper is a review of literature to jumpstart the research program. The paper
focuses on the characterization of the structure and performance of the agricultural
distribution sector, and on the efficiency or inefficiency of agricultural markets and the
agricultural distribution services sector. Specifically, drawing from the literature, how
can we characterize the flow of agricultural goods through the distribution system? What
do studies tell us about the efficiency of the price transmission process in the Philippine
agricultural economy? What do studies on price margins indicate in terms of
(in)efficiency of agricultural product markets and whether such could be explained by
monopoly elements or by transport, storage and handling costs? What research gaps need
to be addressed with respect to the issues of agricultural market (in)efficiency and the
development of the agricultural distribution services sector?
The paper consists of five sections. Section Two is a characterization of the
Philippine agricultural distribution system. Section Three examines the issue of market
integration and the efficiency of the price transmission process. Section Four discusses

5
determinants of price margins, including the issue of monopoly in agricultural trading.
The section also discusses policy issues. Section Five presents research issues and gaps.

6
I. Characterization of the Philippine Agricultural Distribution System
Agricultural distribution or marketing is primarily concerned with moving
agricultural produce from the farm gate to consumers at home and abroad. However, to
bring agricultural produce from the farm to the consumers involves a complex
distribution system performing several functions including assembling, cleaning, sorting,
transporting, storing, processing, grading, wholesaling, retailing, importing, and
exporting. Complimentary or support services include financing and market information
services. Marketing costs are necessarily incurred at each stage of the distribution system.
Complex and diverse distribution system. The prevailing impression about the
Philippine agricultural distribution system is best exemplified by the following excerpt
from the Report and Recommendations of the Congressional Commission on Agricultural
Modernization (Congress of the Philippines, 1997 (?), pp. 72-73):
The country’s agricultural marketing system is complicated, unwieldy and chaotic. Too
many layers impede the smooth flow of agricultural commodities from the producers to the
consumers. The system could be compared to an hourglass, where the producers are on top and the
consumers in the bottom. The market intermediaries are crowded in the neck of the hourglass….
High marketing costs are partly due to poor infrastructure and the multiple layers of trade margins.
The complexity, diversity and multiple layering of the agricultural distribution
system is best illustrated by a number of studies on the marketing systems of a number of
agricultural products in the Philippines. These studies were undertaken by the Foundation
for Resource Linkage and Development, Inc. (FRLD) and the Confederation of Grains
Association, Inc. for the Department of Agriculture and USAID. The studies include
those on corn, potato, mungbean, mango, tomatoes, and cutflowers. Other important
studies are in rice (Lantican, 1992), livestock (Galvez, 1998) and fish (Sikap/Strive
Foundation, 2000). A good review of the marketing participants and marketing flows is
given in Sikap/Strive Foundation’s (2000) Final Report of the Study on Strategic Food
and Agricultural Commodity Exchange under the overall research program on Global
Competitiveness Strategies for Philippine Agribusiness.

7
The various studies bring out that market participants in the agricultural
distribution system are numerous and varied. Similarly, the distribution channels and
networks differ among commodities and even by area.
Participants and their relationships in the distribution system are illustrated in the
case of corn in Cagayan Valley (see Figure 1a and Figure 1b and Malenab, et.al., 1991,
pp. 37-51). Farmers’ link to the demand market is primarily through the hierarchy of
traders at the barangay, municipality and provincial levels. The municipal and provincial
traders distribute the yellow corn mainly to the integrators and feedmillers in Central
Luzon, National Capital region and Southern Tagalog. The less important links of
farmers are through the farmers’ cooperatives (which then feeds into the National Food
Authority) and direct links to poultry integrators and feedmillers in the Cagayan Valley
region. Other distribution links include the following:
(a) the so-called “viajeros” or itinerant traders from the demand regions (Central
Luzon and Southern Tagalog) who travel to Cagayan Valley for the yellow
corn,
(b) agents and brokers who are individuals acting as intermediaries between the
"viajeros" and the municipal traders,
(c) Trader-brokers who are feed ingredient suppliers and who broker between
corn to supplement their feed ingredient business.
The itinerant traders usually offer slightly higher prices than the prevailing prices in
order to fill up the trucks that they bring with them. The agents and brokers receive
commissions for their services.
Notice that the participants in the yellow corn distribution system barely include
retailers. This is because yellow corn is largely production input into the feedmilling,
livestock and poultry industries. In contrast, in largely consumer agricultural produce
such as potatoes (see Figures 2a and 2b) and mungbeans (see Figures 3a and 3b),
wholesalers-retailers and retailers play large roles in the distribution process, although
producers have direct links primarily with wholesalers and assemblers (also called
8
viajeros), wholesalers (for potatoes), contract buyers, and agents (for mungbeans).
Contract buyers in yellow mungbean in Pangasinan sell to assembler-wholesalers. (See
FRLD, 1995a and 1995b.)
The case of rice also brings out the multi-layered nature of relationships at the
wholesale level before the commodity reaches the consumer. Generally, the producers
link is with assembler-wholesalers, wholesalers and commission agents, except for those
with limited marketable surplus where palay is sold primarily to nearby millers or local
buyers. The assemblers-wholesalers and commission agents pass the palay to rice millers-
wholesalers and to wholesalers-retailers before rice (unhusked palay) is sold to
consumers primarily through retailers. (See Lantican, 1992 as presented in Sikap/Strive
Foundation, 2000.)
The marketing channel of roses for Benguet, Cebu, and Davao City further
illustrates the diversity of marketing flows and relationships (see Figure 4 and FRLD,
1993). In major supply areas with limited local demand, and the major demand areas are
located far from the production areas (e.g., Benguet and Davao City), the marketing
flows are primarily through the assembler-wholesalers, wholesalers-retailers, and the
assembler-wholesalers-retailers. In sharp contrast, in places like Cebu where production
is barely enough for the local market, the preponderant marketing link is from the
producers to the retailers and florists, rather than to the assembler-wholesalers.
Similarly, in the case of carabao mangoes, where the producer of carabao
mangoes is also the main producer of processed mangoes as in Cebu, the bulk of the
marketing flows is from the farmers directly to the processors (see Figure 5). Where the
carabao mangoes are mainly for the out-of-province markets (e.g., Manila) as in the case
of carabao mangoes in Batangas, the marketing flows are primarily through the
wholesalers directly or indirectly (through contract buyers who then sell to wholesalers)
(see Figure 6).

9
The diversity of marketing participants, channels, and network of relationships
suggest that economic specialization of marketing functions depends on a number of
considerations. The factors include the need for processing or not and the extent of
economies of scale in processing as well as the physical distance from the producers to
the consumers. Thus, a commodity like corn that requires huge volume in order to
maximize economies of scale of processing (primarily for feeds in the case of yellow
corn) requires a hierarchy of traders to assemble the needed volume from widely
dispersed producers. In contrast, for commodities with virtually no economies of scale of
processing and with production largely geared for a large local demand (e.g., roses in
Cebu) or for commodities where the main market is locally based (as in carabao mangoes
in Cebu), the marketing channel can be primarily direct from the producers to the retailer-
florists or food processors. For commodities without significant economies of scale of
processing but which nonetheless face a long physical distance between the supply areas
and the major demand areas (e.g., roses and potatoes from Benguet or potatoes from
Northern Mindanao), a reasonable amount of volume is needed to minimize the cost of
transport. In such circumstances, assemblers become more important. Thus, the farther
the distance is the greater is the reliance on assembler-wholesalers in the distribution
chain. In addition, the chain of assembling and wholesaling is much more differentiated
and structured in commodities in cases where the producers are far more dispersed, the
demand is large and the main demand areas are either geographically distant from the
supply areas but narrowly confined (e.g., Metro Manila for corn) or also geographically
dispersed (as in the case of rice). As a result, the potentials for profitable niches in the
distribution chain become greater.
The various studies cited above also provide good description of the nature of
niches, specialization of functions, and network of relationships in the distribution chain.
Thus, for corn in the Cagayan Valley and Southern Mindanao (Malenab, et.al., 1991;
Manalaysay, et.al., 1988) the barangay traders tend to be small traders usually residing in
the same (or nearby) barangay as the farmers and who act as agents or assemblers for
large municipal traders, and who have credit-marketing tie-up with the farmers. The
barangay traders usually have sari-sari stores that allow the traders to extend subsistence
10
credits to farmers in terms of dry goods in exchange for crops during harvest. The
municipal and provincial traders are the large traders, who buy either directly from
farmers or through the assemblers (e.g. barangay traders) and who own warehouses and
transport equipment to ferry the produce from the farmers and to the demand markets.
The municipal and provincial traders tend to have multiple businesses and, especially for
provincial traders, have access to formal financial institutions. The provincial traders,
usually based in the major regional trading centers, are big volume traders with purchase
orders from big purchasers in major demand areas; e.g., for corn, integrators, feedmillers
and medium-to-large hog raisers and poultry growers in Metro Manila, Central Luzon
and Southern Tagalog. (See Malenab, et.al., 1991.)
Assemblers-wholesalers are the major players in the distribution process in a
number of agricultural commodities; e.g., potatoes, mungbeans, cutflowers. They have
both the financial and logistic capability to procure and transport agricultural produce to
the major demand centers. Because of the needed large volume, some of them provide
financing and cash advances to farmers to guarantee the volume of procurement (FRLD,
1995a and b, p. 42).
There are other examples of specialization of functions and niches in the
agricultural distribution process. For example, in potatoes, barangay-based agents for the
assemblers-wholesalers (in return for a commission) supervise the sorting/grading and
packaging activities done by the farmers to conform with their trader-buyers’
requirements (FRLD, 1995a, p.49). In mungbeans, the contract-buyers who offer bids to
farmers for their whole harvest (“pakyaw”) take care of the harvesting and post-harvest
activities (FRLD, 1995b, p.42). In cutflowers, brokers whether specialized or multi-
commodity, facilitate the entry of planting materials, cutflowers, and cutflower tools and
equipment into the country.
It may be argued that the heavy reliance by farmers on traders in bringing their
produce to consumers is because the farmers have not banded themselves together
successfully into organizations like cooperatives that can provide the services provided

11
by traders. In the case of cutflowers in Negros Occidental, the growers formed a strong
and well-organized cooperative that effectively prevented the entry of traders except for
the local retailers and florists of Bacolod (capital city of Negros Occidental). The
cooperative sells cutflowers for the grower-members as well as provide planting
materials, farm inputs and technical information on proper cultural practices (FRLD,
1993, pp.62-63).
The credit-marketing tie up and the multi-business nature of many of the traders
are two of the striking characteristics of the agricultural distribution system. The credit-
marketing tie up stems from the lack of access of farmers and even small traders to the
formal credit market. Thus, the implicit advances of the traders to the farmers allow the
latter to smooth out their consumption pattern despite the seasonality of production. In
addition, the credit-marketing tie up provides a mechanism for the traders to effectively
monitor and generate information on the reliability of the farmer-borrowers. The tie up
also allows the traders to reduce the uncertainty of supply; i.e., akin to a futures contract.
The multi-business nature of many traders appears to be a response to the seasonality of
crop production and harvesting. In view of the large fixed costs of large traders (in terms
of storage and transportation facilities, for example), traders need to engage in related
businesses in order to maximize the utilization of their fixed capital especially during the
“off season”.
There are indications from the studies that credit-marketing tie-ups are not always
resorted to by traders. Thus, for example, the newer corporate-type “trader-shippers” in
Southern Mindanao buy spot rather than extend credit to farmers in exchange for crops
during harvest time (Manalaysay et.al.,1988, p.60). The de-emphasis of the credit-
marketing tie up appears to be in response to difficulties of farmers to repay their loans.
The studies provide a snap shot at a point in time. What is not clear is whether or not
credit-marketing tie-ups are indeed being resorted to less and less in the agricultural
distribution system and if so, why.

12
In summary, the complexity, diversity and multiple layers of the agricultural
distribution system is the market response to the differing requirements of, and the profit
opportunities accorded by, the different commodities in the light of varying
infrastructural bottlenecks and credit constraints in the various parts of the country.
Is the complexity, diversity and multiple layering of the agricultural distribution
system in the Philippines unique among developing countries? If the Vietnamese rice
marketing system is any gauge, then the Philippine situation is most likely typical of
developing country agricultural markets. As the IFPRI report on the Vietnamese rice
economy (Goleti et al.,1996) points out, the web of relationships among the marketing
agents in the Vietnamese rice system is “… very complex. Farmers, assemblers,
wholesalers, retailers, millers, and SOEs (state enterprises) all interact with each other
and are responsible for the movement, storage, processing, export, and distribution of the
paddy produced in the country” (p.73).
In the distribution of paddy (i.e., unhusked rice), the strongest link is from farmers
to traders, and then from traders to millers. “ This link is related to the farmers’ lack of
transportation, the remote location of many farmers, and the need for quick cash by
farmers in order for them to repay the loans they incurred in the course of production.
Similarly, the link between traders and millers is being strengthened by credit relations
whereby millers give short term credit to traders in order to facilitate procurement
activities (Goleti et al., 1996, p. 98). The weak links are from farmers to millers as well as
from farmers to state enterprises (akin to the Philippine National Food Authority).
The IFPRI Report further notes (pp. 98, 101):
(There is a) … very complex set of relations between retailers, wholesalers, and
assemblers. The intermediation takes place at different sizes of operation, so that a small
assembler sells to a larger assembler or to a wholesaler. These transactions are partly related to
spatial dimension, so that a wholesaler working at the district level might sell to another
wholesaler working at the provincial or regional level. There is a particularly strong link between
assemblers and wholesalers.

13
It is apparent from the IFPRI Report that the Vietnamese rice marketing system is
almost a carbon copy of the Philippine marketing system for grains such as corn as
described earlier in the paper.
Marketing Institutions: Food terminals and commodity exchanges. The rich
detail of the marketing channels and participants in the studies cited above conducted
primarily for the Department of Agriculture includes the description and analysis of
major public markets and the Food Terminal Inc. Indeed, a key component of the studies
under the “Global Competitiveness Strategies for Philippine Agri-business” project is the
study on the desirability and feasibility of establishing a system of commodity exchanges
in the country. The study included the analysis of the experiences of other countries in the
development of commodity exchanges and wholesale markets (Thailand, Japan, Taiwan,
and South Korea). Underpinning the apparent high interest of the government on the
development of commodity exchanges appear to be the presumption that the agricultural
distribution in the country is disorganized and haphazard, that the facilities for storage,
refrigeration, handling and trading are inadequate resulting in high spoilage costs, and
that farmers implicitly shoulder the attendant high marketing costs through lower and
unstable farm prices.
The Sikap/Strive Foundation report (2000) shows that the ownership of such
commodity exchanges and wholesale markets ranges from purely private (Thailand) to
joint public-private ventures (Taiwan and South Korea) to totally government owned
(Japan and Philippines). Of the cases studied, only the Philippine food terminal failed
(Food Terminal Inc.). The report states that the failure of FTI stems from unclear vision
and mission, overdesign given lack of provincial linkages (e.g., packing houses),
bureaucratic constraints to its operations, politically motivated entry into retail operations
Kadiwa, and fast turnover of management. Despite the failure of FTI, the Sikap/Strive
Foundation report proposes the establishment of four Food and Agricultural Commodity
Exchanges (FACEs) in the country located in Bulacan (for provinces north of Manila),
Batangas (for Southern Luzon), Cebu (for the Visayas) and Cagayan de Oro (for
Mindanao). The report proposes either BOT-BOO schemes or Joint Venture between the

14
government and the private sector, with the private sector managing the exchanges and
the government providing the support services (e.g, farm-to-market road leading to the
exchanges).
The Sikap/Strive Foundation report fails, however, to examine what is probably
the most important failing of the Food Terminal Inc. (FTI). That is, FTI attempted to
supplant the prevailing distribution system. As the discussion on the complexity and
diversity of the agricultural distribution system suggests, the distribution system is a
product of thousands if not hundreds of thousands of participants who search for
profitable niches in the distribution chain and who adjust their operations to adapt to each
participant’s unique operating circumstances. It is apparent that FTI would fail especially
given the organizational, resource, bureaucratic and political constraints it operated
during the 1970s through the 1990s. The failure of the Sikap/Strive report to examine the
FTI experience in terms of its lack of congruence with the overall dynamics, networks
and relationships in the distribution system is also evident in its analysis of the four
proposed food and commodity exchanges.
This brings out the issue of efficiency of the agricultural distribution system,
which is the focus of Section III.
Economic contribution of agricultural wholesaling and retailing. The
complexity and diversity of the agricultural distribution system and its participants is not
well captured in the country’s statistical system. Nonetheless, wholesaling and retailing
are central to the distribution process. Data on the wholesalers and retailers of
agricultural products may provide some indication of the economic importance of the
agricultural distribution system in the country. The available data from the census and
surveys of establishments are on wholesalers of farm, fishery and forestry products and
on the retailers of cereals, beans and pulses, fruits and vegetables, fish and other
seafooods, and meat and poultry products. It must be noted however that the available
published data does not cover all the wholesalers and retailers of agricultural products as
will be discussed later.

15
Table 1 presents data on the number of agricultural wholesale and retail
establishments for both “large” and “small” establishments, drawn from the 1988 and
1994 censuses of establishments. “Small” establishments have total employment of less
than 10 persons; “large” establishments have total employment of 10 persons or more.
Table 1 shows that out of the total number of 144, 384 small wholesale and retail
establishments; 6.3 % were wholesalers of farm, forest and marine products, 8.4 % were
retailers of rice, corn, other cereals, beans and pulses; 1.5 % were retailers of fruits and
vegetables; 1.3 % were retailers of fresh and dried fish and other seafoods, and 0.5 %
were retailers of meat and poultry products. Among the agri-products wholesalers, half
were in coconut and coconut by-products while another third were in rice, corn and other
cereals trading.
Similarly, Table 1 shows that there were 9, 173 “large” wholesale and retail
establishments in 1988, of which 5.8 % and 1.0 % respectively were wholesalers and
retailers respectively of agricultural, fishery and forestry products. As in the case of
“small” establishments, wholesalers of coconut products and grains formed the majority
of wholesalers in 1988. Similarly, retailers of grains, beans and pulses formed the largest
share of “large” retailers of agricultural products.
Table 1 also shows the number of small and large establishments in 1994. Out of
the total number of 179, 428 small wholesale and retail establishments in 1994, 6.59
percent were wholesalers of farm, forest and fishery products; 7.44 percent were retailers
of cereals, beans, and pulses; 0.79 percent were retailers of meat and poultry products;
1.45 percent were retailers of fresh and dried fish and other seafoods; and 1.71 percent
were retailers of fruits and vegetables. As in 1988, the preponderant small retailers of
agricultural products in 1994 were the retailers of cereals, beans and pulses. The
wholesalers of coconut and coconut by-products as well as of grains dominated the small
wholesalers.

16
In 1994, there were 9, 775 large wholesale and retail establishments in the
country. Large wholesalers of agricultural products accounted for 3.9 percent while large
retailers of agricultural products consisted of 1.41 percent of the total. Wholesalers of
coconut and coconut by-products and of grains accounted for most of the large
wholesalers of agricultural products. Similarly, large retailers of cereals, beans and pulses
were the most numerous among the large retailers of agricultural products.
Table 1 shows that there was a decline in the total number of large wholesalers of
agricultural products during 1988-1994. The decline is almost across-the-board.
Nonetheless, the drop is particularly substantial in the wholesaling of coconut and
coconut by-products, tobacco leaf dealing, forest products dealing, and wholesaling of
grains. The large wholesalers that saw an increase were in fruits, nuts and vegetables as
well as in livestock and poultry.
Given the appreciable gap between the two censuses (1988 and 1994), the rise in
the level of population and some increase in the per capita income during the period, the
decline in the number of large wholesalers of agricultural products is somewhat
surprising. The decline in the number of large establishments may indicate some
restructuring within the industry towards fewer but larger establishments; this seems to be
the case for the wholesaling of rice, corn and other grains. Another likely major reason
for the decline is that the industries themselves registered sluggish growth if not actual
decline (as in the case of forestry) during the 1988-1994 period (e.g., the coconut industry
and forestry). The increase in number of large establishments was in the retail sector,
especially in the fast growing meat and poultry products (which is consistent with the
robust growth of the country’s livestock and poultry industry).
Much of the increase in the number of establishments of agricultural products was
in the small wholesalers and retailers. The increase was nearly across-the-board, except
most notably in the wholesaling of forest products (the industry that has seen a
continuous decline in the country since the 1970s). In terms of the absolute number of
the increase, the largest increases were in the wholesaling of grains and of coconut and
17
coconut by- products as well as in the retailing of cereals and fish and fish products. In
terms of the rate of increase, however, the most notable was in the wholesaling and
retailing of livestock, poultry and meat products. This reflects the higher-than-average
growth rate of the livestock and poultry industry during the period.
Table 2 presents the total employment, gross sales and value added for small and
large wholesalers and retailers of agricultural products in 1988 and 1994. In Table 3, it is
likely to be an underestimate of the actual number of participants in the wholesaling and
retailing of agricultural products. First, as noted earlier, the barangay traders tend to be
sari-sari store-owners; hence, they are likely to be excluded from the list of wholesalers.
Indeed, “one-man” operations like agents and brokers are likely to be not included in the
Census list of establishments. Second, multi-product retailers like supermarkets are not
included in the list of retailers of agriculture products in Table 1. Similarly, legions of
sari-sari stores and itinerant vendors of vegetables, fruits, fish and meat are excluded
from the list in Table 1. Thus, the total number of participants in the wholesale and retail
of agricultural products is much higher than what is formally listed in the country’s
census statistics.
In Table 2, it is worth noting that the share of “small” wholesalers of agriculture
products to total employment and sales is higher than to the total number of
establishments. This suggests that they tend to be larger than the average small wholesale
establishment. In contrast, small retailers of agriculture products have smaller share of
total employment as well as of sales. This reflects the apparent “mom and pop” nature of
most small retailers of agricultural products. Table 2 presents a slightly different picture
for large wholesalers and retailers of agricultural products. The table indicates that, with
the exception of tobacco leaf dealers and wholesalers of fish and other seafoods, the
average large wholesaler and retailer of agricultural products is comparatively smaller
than the average large wholesale or retail establishment.
Table 2 accentuates the trends among the industries indicated earlier in the
discussion of changes in the number of establishments. Specifically, total employment

18
declined during 1988-1994 in large wholesalers of coconut and coconut by-products,
tobacco leaf and forest products. Likewise, employment rose markedly among large
wholesalers and retailers of livestock and poultry products as well as in fruits, nuts and
vegetables. As noted earlier, the latter two industries are the faster growing segments of
Philippine agriculture.
The estimation of value added in Table 2 show generally lower share to total
value added in the wholesale and retail sector. As in the previous discussions, the
industries with the largest number of establishments and employment tend to be the ones
with the largest contribution to sectoral value added.2 Notice also the sharp rise in the
value added shares of retailers of meat and poultry products during the period.
Estimates of labor productivity in the wholesale and retail of agricultural support
services are shown in Table 3. Of interest are the last two columns of the table, which
show the change in labor productivity in real terms over the period 1988-1994 for large
enterprises and small enterprises. The change in labor productivity in real terms was
measured by the rate of change of labor productivity at current prices minus the general
rate of inflation (proxied by the rate of change of the GDP deflator). Table 3 shows that
labor productivity in real terms in most of the agriculture-related wholesale and retail
industries declined during the 1988-1994 period.3 The major exceptions are coconut and
coconut by-products wholesaling, tobacco leaf dealing, and fruits and vegetables retailing
among large enterprises and meat and poultry products retailing among small firms.4
Notice that among the large enterprises, the industries that streamlined generated
significant rise in labor productivity. The robust growth of labor productivity in meat and
poultry products retailing among small enterprises may reflect the significant rise in meat
and poultry consumption in the country together with the rise in the more professionally
2 The negative estimate for large wholesalers of cereals is likely caused by data error. 3 The estimates for the large enterprises under farm, forest and marine products wholesaling (611) and palay, corn (unmilled) and other grains wholesaling (61101) are not credible. Labor productivity estimates for 611 in 1988 are extremely low and the gross margins for 61101 in 1988 are negative. Negative gross margins in an industry with many firms indicate problems with data. 4 The estimate for fish and other seafood wholesaling under small enterprises is also suspect because of the extremely low value of labor productivity in 1988.

19
run stand alone meat and poultry products retailers (e.g., “Monterrey meat stores”) during
the period.
The finding of decline in labor productivity of most of the agriculture related
wholesale and retail industries is consistent with the results of studies showing poor
overall productivity performance of the Philippine economy (see e.g., Cororaton). The
decline in the labor productivity of the agriculture related wholesale and retail industries
could likely be even lower if the more informal traders and retailers (excluded from the
census of establishments) were included in the total employment for the industries. This
reflects one role of the wholesale and retail sector which is as a reserve pool of
underemployed workers in the non-agricultural sector. Only when there is sustained fast
growth of the economy would underemployment in wholesaling and retailing, especially
in the informal sector, decline and correspondingly, labor productivity in the sector
increase over time.
The regional distribution of small wholesalers of agricultural products is shown in
Table 4. It is interesting to note that the Mindanao regions together with Southern
Tagalog, Bicol and Eastern Visayas have most of the small wholesalers. What is
especially worth noting is the regional distribution of total employment and paid
employees of small wholesale establishments in agriculture, fishery and forestry
products. Table 4 shows that Southern Mindanao, Central Mindanao and Cagayan Valley
account for nearly one half of all paid employees. The three regions, especially Southern
Mindanao and Cagayan Valley, are major agricultural surplus regions in the country.
Hence, it is probably not surprising that the larger of the small wholesalers of agricultural
products are located in the three regions. The large share of Western Mindanao and
Eastern Visayas in the number of establishments and total employment stems from the
dominance of coconut production in the agricultural economies of the two regions. As
stated earlier, the wholesalers of coconut products and of cereals form the majority of
wholesalers in agricultural products.

20
Available data for 1995 from the Annual Survey of Establishments still shows the
large number of agri-based wholesale establishments in Western Mindanao and Eastern
Visayas, comparable with Southern Mindanao and much higher than Cagayan Valley (see
Table 5). In terms of employment, however, it is Southern Mindanao and Cagayan
Valley, and to a less extent Western Mindanao and Southern Tagalog, that contribute
most to total employment. Again, this reflects the roles of Southern Mindanao and
Cagayan Valley (and for coconut, Western Mindanao and Southern Tagalog) as major
agricultural surplus regions in the country.
Tables 1 to 5 are illustrative of the information that can be drawn from the census
and the annual surveys of establishments. The information from the census and the
annual surveys of establishments in wholesaling and retailing has barely been mined and
analyzed however. It is apparent that continuing analyses of the data on wholesalers and
retailers in the census and annual surveys would be useful in understanding better the
performance of the agricultural distribution system over time.

21
III. Price Transmission and Market Integration
The complexity and diversity of the Philippine agricultural distribution system is
not surprising given that producers are spread out in the country and generally situated far
from the main demand areas. Thus, the view that “…produce should move from the far
directly (italics supplied) to retail outlets… (rather than) travel in a more roundabout way
through layers of middlemen.” (CRC, 2000, p.43) is likely to be unrealistic. Nonetheless,
it is important to examine whether or not agricultural markets work well and the
distribution system competitive and efficient. There are two dimensions of this issue that
are of interest for this review paper.
The first issue is whether supply and demand markets are well integrated across
the country so that unexpected supply and demand shocks in some parts of the country
are readily addressed through appropriate changes in prices, behavior of suppliers and
demanders, and commodity flows. Considering that prices provide the signal that
facilitate the coordination of thousands if not millions of farmers, consumers and
middlemen across the country, the extent of market integration can be examined through
the efficacy of transmission of price shocks across the country and within the agricultural
supply-distribution chain. This issue of market integration and price transmission is
discussed in this section.
The second dimension is whether distribution margins are relatively high or not
compared to some “international average” or “competitive norm”. Margins allow for the
provision of storage, transport, handling and processing services needed to transform
agricultural produce in form, over time and across space in order to meet the needs of the
consumers in the country. Clearly the policy challenge is in ensuring a competitive (at
least contestable) and efficient distribution system such that at a point in time the margins
do not incorporate significant monopoly rents nor unnecessary transactions costs like
police “tongs”. In addition, the policy challenge includes the encouragement of
efficiency improvements in storage, transport, handling and processing through
technological and organizational/institutional changes as well as capital investments. The
22
issue of the level and evolution of distribution margins and the related issues of transport,
storage, handling and processing will be discussed in the succeeding section, Section IV.
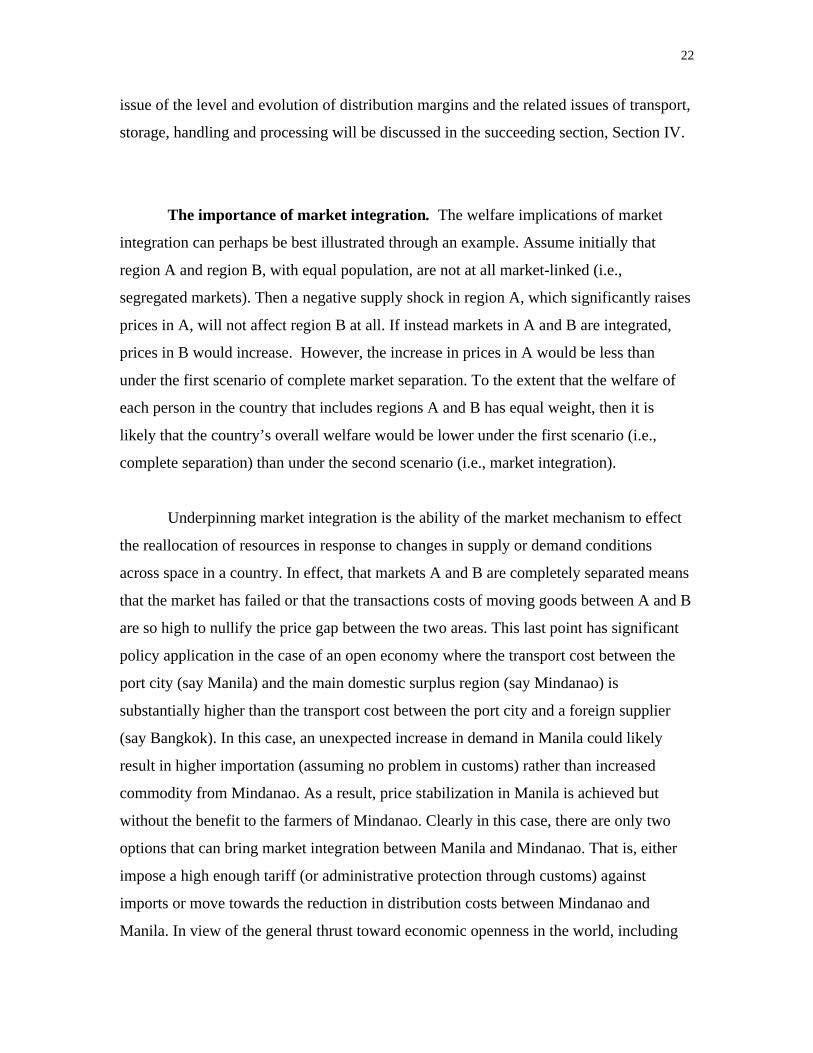
The importance of market integration. The welfare implications of market
integration can perhaps be best illustrated through an example. Assume initially that
region A and region B, with equal population, are not at all market-linked (i.e.,
segregated markets). Then a negative supply shock in region A, which significantly raises
prices in A, will not affect region B at all. If instead markets in A and B are integrated,
prices in B would increase. However, the increase in prices in A would be less than
under the first scenario of complete market separation. To the extent that the welfare of
each person in the country that includes regions A and B has equal weight, then it is
likely that the country’s overall welfare would be lower under the first scenario (i.e.,
complete separation) than under the second scenario (i.e., market integration).
Underpinning market integration is the ability of the market mechanism to effect
the reallocation of resources in response to changes in supply or demand conditions
across space in a country. In effect, that markets A and B are completely separated means
that the market has failed or that the transactions costs of moving goods between A and B
are so high to nullify the price gap between the two areas. This last point has significant
policy application in the case of an open economy where the transport cost between the
port city (say Manila) and the main domestic surplus region (say Mindanao) is
substantially higher than the transport cost between the port city and a foreign supplier
(say Bangkok). In this case, an unexpected increase in demand in Manila could likely
result in higher importation (assuming no problem in customs) rather than increased
commodity from Mindanao. As a result, price stabilization in Manila is achieved but
without the benefit to the farmers of Mindanao. Clearly in this case, there are only two
options that can bring market integration between Manila and Mindanao. That is, either
impose a high enough tariff (or administrative protection through customs) against
imports or move towards the reduction in distribution costs between Mindanao and
Manila. In view of the general thrust toward economic openness in the world, including

23
the implementation in the near future of free trade area in the ASEAN, the first best
policy option for the Philippines is to reduce distribution costs within the domestic
economy and thereby improve market integration domestically.
Understanding the extent of market integration among supply and demand areas
in the Philippines is the first step in examining the efficacy of the country’s agricultural
distribution system and in pinpointing possible sources of market imperfection or failure
among the various regions in the country. Although it is accepted that market integration
is not a sufficient condition for the Pareto optimality of a competitive equilibrium;
nonetheless, measurement of market integration is a basic data for an understanding of
how specific markets work (Ravallion, 1986, p. 103).
Market integration: methods of analysis. There are a number of measures of
market integration discussed in the economic literature. Among them are the following
(see e.g., Barrett, 1996; Goleti et al., 1996):
1. Correlation coefficients. The easiest measure to estimate is the
correlation of prices in different markets. This has intuitive appeal because
co-movement of prices is a hallmark of market integration. The traditional
tests of market integration used correlation coefficients or regression
coefficients on prices as arguments. For example, a regression model to
test for short run market integration can be of the form (Sexton, Kling and
Carman, 1991, p. 569):
tttt eTPP +++= 22101 ααα
Where 21 , PP are prices in regions 1 and 2 respectively and T is the
transactions cost to move a good between the two regions. Short run
market integration is indicated by:
24
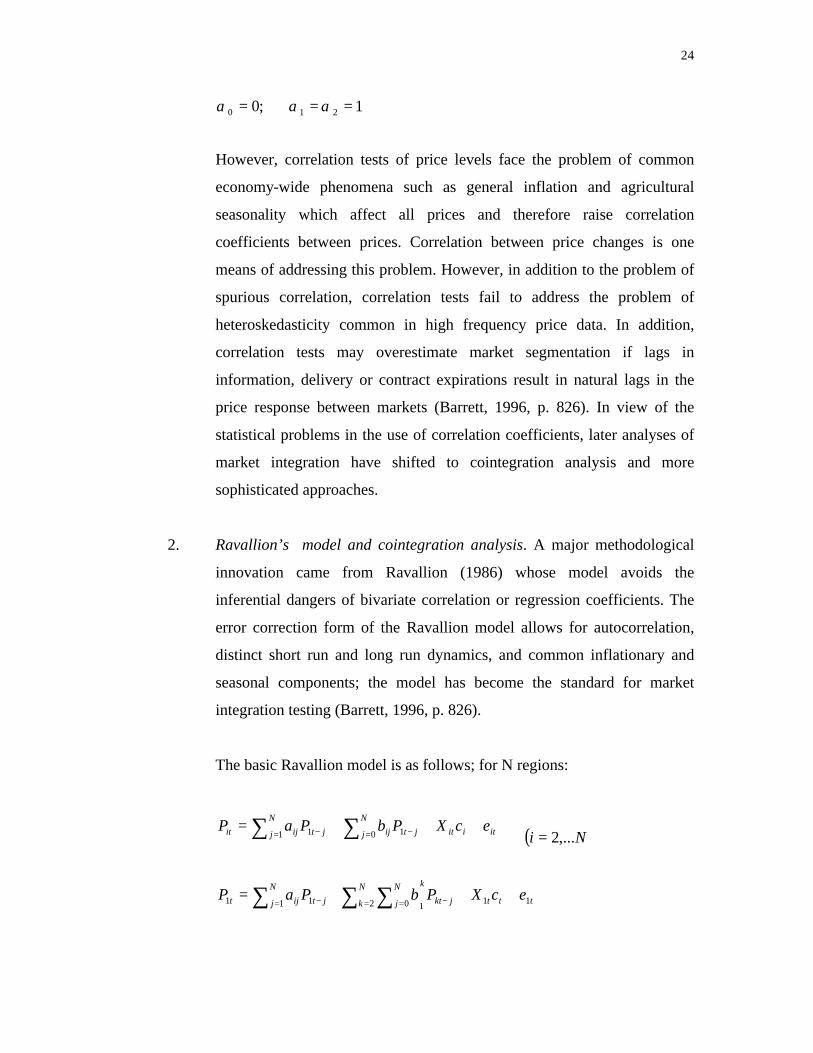
1 ;0 210 === ααα
However, correlation tests of price levels face the problem of common
economy-wide phenomena such as general inflation and agricultural
seasonality which affect all prices and therefore raise correlation
coefficients between prices. Correlation between price changes is one
means of addressing this problem. However, in addition to the problem of
spurious correlation, correlation tests fail to address the problem of
heteroskedasticity common in high frequency price data. In addition,
correlation tests may overestimate market segmentation if lags in
information, delivery or contract expirations result in natural lags in the
price response between markets (Barrett, 1996, p. 826). In view of the
statistical problems in the use of correlation coefficients, later analyses of
market integration have shifted to cointegration analysis and more
sophisticated approaches.
2. Ravallion’s model and cointegration analysis. A major methodological
innovation came from Ravallion (1986) whose model avoids the
inferential dangers of bivariate correlation or regression coefficients. The
error correction form of the Ravallion model allows for autocorrelation,
distinct short run and long run dynamics, and common inflationary and
seasonal components; the model has become the standard for market
integration testing (Barrett, 1996, p. 826).
The basic Ravallion model is as follows; for N regions:
itiit
N
j jtij
N
j jtijit ecXPbPaP +++= ∑∑ = −= − 0 11 1 ( )Ni ,...2=
tttjkt
N
k
kN
j
N
j jtijt ecXPbPaP 112 101 11 +++= −= == − ∑ ∑∑

25
Where 1P is the price in the central market, iP is the price in the ith
local market, X is a vector of other influences (e.g., inflation, seasonality
indices) and the e’s are error terms. Ravallion applied his model to
Bangladesh and concluded that the results suggest the existence of
substantial impediment to trade between Dhaka and its main rural supply
areas.
The Ravallion error-correction model allows the testing for market
segmentation between the central market and a given local market; i.e.,
0=ijb . It also allows for short run market integration; i.e., 10 =ib . It
also allows for market integration with the central market within one time
period; 10 =ib and 0== ijij ba ( j = 1, …., N). With some
reformulation, the model also allows for long run market integration.
The Ravallion model can be transformed into an error correction
representation of a cointegrated sytem (Barrett, 1996). Two stationary
price series are cointegrated if there exists a stable long run linear
relationship between them. The presence of cointegration in both
directions between the two price series is indicative of interdependence.
The absence of cointegration in both directions is indicative of market
segmentation.
However, the Ravallion model has its weaknesses. The model assumes
that price shocks originate from the central (urban) market, which is
plausible for demand shocks but not for supply shocks. The model and the
related cointegration analyses assume constant intermarket transfer costs
that are either additive or proportional. If in fact transfer costs are time
varying, then the Ravallion model’s inference is biased in favor of market
segmentation. In addition, where there are discontinuous trade flows and
strong seasonality patterns in agricultural demand, supply and transactions

26
costs (as is likely the case in developing countries like the Philippines),
then the findings of cointegration analyses become more suspect because
cointegraton tests impose a linear approximation to a non-linear function
(see Barrett, 1996, pp. 826-827).
3. Dynamic adjustment and speed of adjustment. It is usually not enough to
know whether or not markets are integrated. Excluding the rare extreme
cases of perfect market integration and total market segregation, it is
important to know the extent of market integration. An approach used is
by measuring the magnitude of price transmission, through estimates of
dynamic multipliers. In addition, it is useful to determine the speed of
adjustment. Given the same value of dynamic multiplier for two regions
vis-à-vis a third market, the faster the completion of the price adjustment,
the better integrated the market. The dynamic multipliers can be computed
from an estimate of a Ravallion-type model of market integration.
Similarly, the speed of adjustment can be computed from the estimates of
dynamic multipliers. (See Goleti et al., 1996, pp.228-229.)
4. More recent market integration models. A weakness of the Ravallion
model and cointegration test is that they do not explicitly consider actual
data on transactions or transfer costs in moving goods from supply areas to
demand areas. The more recent models; e.g., Parity Bounds Model
(Baulch, 1997), Sexton, Kling and Carman (1991), address this constraint.
Baulch used exogenous transactions cost data in order to estimate the
probability of attaining intermarket arbitrage conditions; the SKC model
assumes fixed transfer margins (Barrett, 1996, pp.827-828). Other newer
models and theoretical approaches are those of Acharya (2000), Goodwin
and Piggott (1999), J. R. Li and C. Barrett (1999) and Dercon and Van
Campenhout (1999).

27
The newer models bring out that price comparisons are not enough to establish
the optimality of market integration. More importantly, the newer models point
toward the integration of both price data and data on trading activities as the
appropriate way of analyzing the efficiency and optimality of market relationships
in the agricultural sector especially in developing countries. As Barrett (1996,
p.828) concludes, the challenge now is “…not so much statistical refinement of
existing methods as reorientation of data collection to pay greater attention to
trading activities.”
Empirical studies on market integration. Virtually all the methods of analysis
described above have been applied to real economy cases, mainly in developing
countries. The studies of particular interest to the Philippines are those for the
Vietnamese rice economy (Goleti et al., 1996), China’s rice and corn markets (Rozelle,
et.al., 1997), the application of the Ravallion-type model to the Philippine corn market
(de los Reyes, 1994) and the Indonesian rise market (Alexander and Wyeth, 1994), the
application of ARCH time series model to the Philippine corn market (Mendoza and
Rosegrant, 1995), the application of the Parity Bounds model to the Philippine rice
market (Baulch, 1997), and the reexamination of the Philippine rice market using the
Band-Threshold Autoregression model (Dercon and Van Campenhout, 1999).
It must be emphasized that, despite their weaknesses, simple bivariate price
correlations and coefficients of variation are useful first steps in analyses of market
integration. Careful analyses of them can provide important insights as well as leads for
further in- depth study using more sophisticated models and detailed data. The ready
availability of price data makes the estimation of bivariate price correlations and
coefficients of variation easy to undertake. Finally, such simple measures have intuitive
appeal.
The study of Rozelle, Park, Huang and Jin (1997) of China’s rice and corn
markets is a good example of an empirical application of market integration tests.

28
Specifically, the authors started with simple coefficients of price variation and then
moved to more sophisticated models to examine the issue of rural market integration in
China. The authors found falling coefficients of variation for provincial rice and corn
prices in China from 1988 to 1993. This is one sign of increasing grain market integration
in China. More formal analyses using cointegration analysis and parity bounds analysis
along the lines of Sexton, Kling and Carman confirm further the finding of increasing
rural integration in China during 1988-1993.
The IFPRI study (Goleti et al., 1996) on the Vietnamese rice market also used a
variety of measures to examine the extent of market integration of the Vietnamese rice
market. While correlation coefficients of rice price levels in Vietnam’s major rice
markets were almost uniformly united during 1986-1990, they dropped significantly
during 1991-1995. The high price correlations during 1986-1990, which suggest high
market integration, were caused by the highly inflationary macroeconomic environment
at that time. Correlation coefficients of price differences are significantly lower during
1986-1990 as well as 1991-1995. More formal analysis using cointegration analysis and
dynamic multipliers indicate mixed but improving market integration during the whole
period 1986-1995. There remained one-fifth of all market pairs that were segregated;
moreover, the estimates show that the speed of price adjustment slowed down in the
second half of the period, the early 1990s. The IFPRI report indicates significant
remaining challenges for the Vietnamese rice market. Indeed, the IFPRI report points out
that Vietnam’s indicator of market integration is comparable to Malawi (with its poor
infrastructure) and Pakistan and Egypt (with their restrictions on internal trade).
The Vietnam and China studies are noteworthy in that each used an array of
analytical and statistical tools to examine the state and evolution of market integration in
the two countries. The Vietnam study also includes some comparison of indicators with
selected countries for further insightful analysis. In short it is best to look at the various
tools as complementary and need to be used together as much as possible in order to have
more robust conclusions about the state and evolution of market integration.

29
It is interesting to note that the Philippines figured prominently in the empirical
application of some of the analytical and statistical models of market integration. Thus,
Baulch (1997) applied his parity bounds model to the Philippine rice market. He finds the
rice market to be integrated within a single period (i.e., month) almost 100 percent of the
time. According to Baulch, the finding using parity bounds analysis differ from findings
from granger causality and Ravallion-type models which show one to two month lags.
Baulch attributes the failure of the standard tests to detect high levels of market
integration because the earlier models did not take into account transfer cost and
discontinuity of trade flows between regions.
Dercon and Van Campenhout (1999) used a Band-Threshold Autoregression
Model and threshold cointegration analysis to reexamine the Philippine rice market
analyzed by Baulch. In contrast to Baulch’s finding, Dercon and Van Campenhout found
that there are a number of trade routes where price adjustment is sluggish reaching up to
2.5 months, although there is market integration in the long run. Moreover in the route
between Western Visayas and Central Visayas, there are indications that the slow pace of
price adjustment between the two regions may be attributed to monopoly in shipping.
The differing results between Dercon and Van Campenhout and Baulch suggests
the need to bring in more data on trading activities and intermarket transfer costs in
understanding further the state and evolution of agricultural market integration in the
Philippines. It is worth noting that the data used in the Baulch and Dercon-Van
Campenhout studies covered 1980-1993, which includes the period of significant
economic and political turmoil in the country during the mid-1980s. The economic and
political crisis may have disrupted rice trade flows between regions, thereby making it
more difficult to have analytically consistent results. It is useful to reexamine the issue
using more recent data in the 1990s.
Mendoza and Rosegrant (1995) applied a more sophisticated approach to
cointegration analysis using bivariate exponential autoregressive conditional

30
heteroskedasticity model (E-ARCH model) and dynamic multipliers to examine the
market integration of the Philippine corn market. The study found that:
a. Manila is the price leader in the country for yellow corn;
b. There is mixed granger causality between Central Visayas and Mindanao
with respect to white corn;
c. Limited spatial integration of the Philippine corn economy with long run
multipliers ranging 0.23 and 0.61; and
d. The market response to price changes in the central market (Manila for
yellow corn; Central Visayas for white corn) is sluggish with price
adjustments taking up to two months (for yellow corn traders in
Mindanao)
Mendoza and Rosegrant attribute the low long run multiplier and relatively
sluggish price adjustments to inadequate shipping and erratic shipping schedules, high
transport and storage costs, and other market barriers.
Similarly, De los Reyes (1994) used correlation analysis and a Ravallion-
type model to examine the market integration of the Philippine economy. She also found
a general lack of integration among the regional corn markets, with the exception of the
Metro Manila – Southern Tagalog link. Her estimates of market integration range from
0.17 to 0.43. Thus, her estimates are consistent with Mendoza and Rosegrant’s. De los
Reyes considered as factors for the low market integration infrastructural and
transportation bottlenecks within the country as well as “…the strategic location of
Manila relative to the international market…why its wholesale market were not
connected with rural markets.”
It is worth noting that despite the use of the Philippine examples in a
number of innovative methodologies on market integration, there is virtually no empirical
application of such models done in the Philippines except for the masteral thesis of De
los Reyes. Certainly, there is yet no intensive and extensive analysis of price correlations

31
and alternative measures of market integration over time similar to the Vietnam and
China studies. The Mendoza-Rosegrant study on the Philippine corn market is the closest
to the Vietnam and China studies but it lacks the detailed price correlations and
coefficients of variation that help provide the intuitive foundation for the in-depth and
sophisticated time series analyses. De los Reyes (1994) may have the price correlations
but lacks the use of the more recent and statistically robust time series models to help
validate the regression results of a Ravallion-type model. It is useful to undertake such
studies not just for the rice and corn markets but also for other commodities like coconut.
Clearly, in view of the mixed results of the studies on the Philippine food markets,
it is important that a comprehensive analysis of market integration for several key
commodities in the country be undertaken. The extensive and intensive analysis need to
use methodologies from the simple price correlations and coefficients of price variation
to the more sophisticated models like parity bounds analysis and band-threshold
autoregressive models.
32
IV. Marketing Margins and Distribution Services
More than the extent and pace of the transmission of price shocks which is the
focus of the previous section, it is the magnitude of marketing margins that is the main
concern of policy makers with respect to the distribution sector. As the quote from the
Report of the Congressional Commission on Agricultural Modernization reproduced in
Section II suggests, there remains a popular view that marketing margins are
unreasonably high in the country, primarily because of implicit market power of the
traders. As a result, farmers earn less than they should be and consumers pay more than
they should have.
A key function of markets is price formation. And an efficient price formation
matches the costs of storage, transportation, processing and other distribution services to
their respective price margins. The price margins influence private and government
decisions in their provision, and for the government regulation, of agricultural
distribution services (Timmer, 1987, p.294). When margins are too low, marketing
participants are being squeezed by government policy. When margins are too high, they
may indicate any or all of the following: (a) there are informal taxes (e.g., “lagay”) or
barriers to domestic trade; (b) the quality of roads and other infrastructure facilities as
well as domestic shipping services are so bad; or (c) traders have some monopoly
power. When processing margins are much higher than those of other countries known
to have technically efficient and competitive processing industries, there may be
indications of high processing losses and/or there may be barriers to entry in the
processing sector which result in high profit rates. (See Timmer, 1987, pp. 293-294;
301-302.)
Marketing margins determine the “competition contour” relative to imports in the
country (Timmer, 1987, p. 297). For a small, open economy, the landed cost of imports
including tariffs and other cost of moving the imported good to the port city (ies) (e.g.,
Manila, Cebu) is the reference price of the good. Then the cost of imports minus the
domestic distribution cost determines the regions in the country which are competitive
with imports. Thus, given the world price of imports and the domestic distribution costs,

33
the lower (higher) is the tariff, the nearer to (farther from) the port city (ies) are the
regions which are competitive with imports. Similarly, given the landed cost of imports,
the lower (higher) the domestic distribution costs (and margins) the farther from (nearer
to) the port city (ies) are the regions which are competitive with imports.
The discussion above is a useful framework for understanding to some extent why
Philippine agriculture has been losing competitiveness vis-à-vis imports over time
during the past two decades. On the demand side, the country’s high population growth
meant that the demand for food products has increased substantially during the period,
which can be supplied either by imports or by domestic production. On the supply side,
world prices of food products (e.g., grains) have declined; in addition, transport links
between Manila and the rest of the world have significantly improved, especially with
East Asia and North America. On the other hand, the rising population and urbanization
in the country centered in Metro Manila, in Central Luzon and Southern Tagalog. This
meant that the food needs of Metro Manila would have to be sourced farther and farther
from the metropolis. Thus, Central Luzon has ceased to be the country’s rice granary. As
a result, domestic sourcing of food for Manila has been increasingly sensitive to
domestic distribution costs and margins.
In short, in view of the declining world food prices and improving international
transport links, the country needs to have much greater improvement in its transportation
and distribution systems (and thereby reduce distribution costs) and/or sharp
improvement in agricultural productivity in order for domestic producers from, say
Mindanao, to be competitive with imports. However, agricultural productivity has been
sluggish and the quality of domestic infrastructure and inter-island shipping remains
unsatisfactory. As a result, the country has to raise the rate of agricultural protection
during the past one and a half decades in order for the domestic producers –increasingly
from Mindanao and Cagayan Valley---to be competitive with imports in the Manila
market.

34
Distribution margins. There are a number of studies that can provide us with
some idea about the order of magnitude of margins of in the agriculture distribution
industries. At the macro level, the PDFI report (2000) provides data on gross margin to
sales ratios of agriculture- related wholesalers and retailers in 1994. The FRLD studies
and the CRC report (2000) provide information on gross margins in selected trade
routes.
Table 6 presents the gross margin to sales ratios of small and large agriculture-
related industries and the average gross margin to sales ratio for all small and large
wholesale and retail establishments. At the most aggregative level, the table shows that
gross margins at the wholesale level are generally higher than the gross margins at the
retail level in the Philippines. As the PDFI study noted, this finding is the opposite in a
number of developed countries where the gross margin to sales ratio at the wholesale
ratio is lower than at the retail level.
Table 6 shows that the gross margin to sales ratios of agriculture related
wholesale and retail industries in 1988 and 1994 tend to be lower than the average for all
wholesale establishments or for all retail establishments. The noteworthy exceptions are
fruits, nuts and vegetables wholesaling and retailing, forest products dealing, livestock
and poultry dealing in 1988, and meat and poultry products retailing among large
enterprises. The above mentioned exceptions are probably not surprising especially for
fruits and vegetables, in part because of comparatively higher spoilage rate.
Table 6 seems to suggest that the marketing margin of agriculture-related
industries are not overly high especially at the wholesale level relative to the average for
all wholesale establishments. However, it must be noted that Table 6 is an average of
wholesalers' margins at the wholesale level and of retailers' margins at the retail level. It
does not capture the multilayer nature of agricultural marketing described earlier in the
paper. The impact of the multilayering of wholesale distribution is best exemplified by
the case of Japan’s wholesale sector. Japan’s gross margin to sales ratio at the wholesale
level is lower than those of the US, Germany, UK and France; in addition, Japan’s gross

35
margin ratio at the retail level is lower than those of the US and Germany and comparable
to those of UK and France. However, Japan’s gross margin for the whole distribution
sector (wholesale and retail) is the highest among the five developed countries because of
the much greater multilayering of wholesale trade in Japan (Intal, 1999).
As Section II of this paper emphasizes, agricultural distribution in the Philippines
generally relies on a hierarchy of traders from the farms to the consumers (who are
located primarily in the urban areas). Thus, it is likely that Table 6 underestimates the
overall wholesale margin for agricultural products. That is, assuming that wholesale
distribution is more multilayered for agricultural products than for other commodities,
then it is likely that overall wholesale gross margin for agricultural products is higher
than the average for all wholesale enterprises; this is the opposite of what Table 6
suggests.
A number of case studies provide indications of the distribution costs and margins
from the farm to the main demand areas. The studies, exemplified by the FRLD studies
on potatoes (1995 a), mungbeans (1995b), cutflowers (1993), the Malanab, et.al., study
on corn (1991), and by the Cabanilla study (1997), add up the components of the
distribution costs depending on the supply-demand route. For example, for corn from
Cagayan to Manila, the distribution costs include hauling, shelling and drying costs at the
farm level; loading and unloading, rebagging, hauling, sacks, and driver’s commission at
the municipal trader’s level; and loading and unloading, weighing, shrinkage, hauling and
agent’s commission at the provincial trader’s level (Malenab, et.al., p.79). Similarly, for
potatoes, the distribution costs of an assembler-wholesaler include sorting and grading,
packaging, storage, transport from the farm to the regional center (e.g., Cagayan de Oro)
and from the regional center to the main urban market (e.g., Cebu), interest on operating
capital, stall rental, depreciation and others (FRLD, 1995a). In addition to the adding up
of the components of the distribution costs, the FRLD studies and the Cabanilla study
also provide information on the total marketing costs and marketing margins of the
traders by type of traders and by major supply-demand routes (e.g., assembler-retailer or
wholesaler in the Iloilo to Manila route). The Cabanilla study also illustrates the

36
differences in the marketing costs depending on the route to a given demand area. Thus,
the distribution cots of moving grains from San Jose, Mindoro to Manila depends in part
on the route to Manila either via a direct sea transport (cheaper) or via Batangas (more
expensive). With limited shipping bottoms, only those with access to the San Jose to
Manila boats would be able to transport their grains more cheaply (generally the bigger
traders).
The case studies, while insightful because of the detailed information they provide
about the distribution system, provide information essentially at a point in time or within
a short period of time. However, the distribution system and the distribution costs are
strongly influenced by changes in the overall economy and in the other sectors of the
economy. Hence, significant changes in the rest of the economy have impacts on the
distribution system and on distribution costs. Thus, time series data is needed to analyze
the evolution of the distribution system and distribution costs and margins over time.
In view of the importance of the distribution system in expanding the
“competition contour” of the country given the government’s tariff and nontariff
measures against imports, it is very important to have in –depth information and analysis
on the country’s distribution system on a regular basis. Toward this end, the mass of price
data being collected currently by the government can provide the foundation and bridge
to the regular analysis on the performance and evolution of the agricultural distribution
system. Thus, it is useful to have the time series data on the ratios and/or margins
between the farm prices in the major supply areas and the wholesale and retail prices in
the main demand areas. The time series data on the price ratios or price margins between
markets can then be complemented by in-depth case studies or industry surveys on the
agricultural distribution system and intermarket distribution costs to be done on a regular
basis (say, every three years). A comparison of the price margins or ratios (between the
farm gate price in the supply area and the wholesale price in the demand area) and of the
distribution costs between the two supply and demand areas provides some indication of
whether or not the returns to marketing are particularly high in any of the trade routes.
Very large gaps between the price margins and the actual distribution costs between two

37
markets may be indicative of the existence of some monopoly or monopsony power of
traders, thereby calling for more in-depth investigation and analysis. Indeed, the
evolution of the price margins and distribution costs over time in the various supply-
demand routes provides a robust means of examining the evolution of the competitive
environment and efficiency of the agricultural distribution system.
Monopoly power in agricultural distribution. The view that agricultural
traders in the country wield monopsony and monopoly powers, usually expressed in
terms of the so-called “Binondo rice cartel” remains current. Indeed, the call for the
continuation of the National Food Authority is sometimes anchored on this perceived
monopsony and monopoly power of the Binondo-based Chinese Filipinos in food trading
in the Philippines. Corroborating is the view that Binondo-based traders are the ultimate
sources of informal agricultural credit given to farmers by the provincial, municipal and
`barangay-based traders. The informal credit is linked to either the purchase of inputs or
the sale of output by farmers.
Despite the currency of this view of the existence of monopsony and monopoly
power of big agricultural traders (usually presumed Binondo-based) in the media and
sometimes even discreetly stated in policy discussions, there is yet no rigorous test of the
existence and/or magnitude of monopoly power in agricultural trading. On the contrary,
the literature on market integration and agricultural marketing seems to suggest that
agricultural markets in the Philippines are competitive. The studies reviewed in Section
III of this paper suggest that markets are on the whole integrated (although as noted by
Barrett market integration can be consistent with non-competitive markets). Where the
markets fail, analysts have highlighted structural bottlenecks such as infrastructure
problems or, as in the case of the Iloilo-Cebu rice route, a shipping monopoly (Dercon
and Campenhout) rather than to monopoly behavior of traders. The FRLD case studies on
agricultural marketing paint a picture of intense competition among traders (whether
based locally or itinerant) during harvest. Thus, for example, itinerant traders offer
farmers prices higher than the prevailing prices in to fill up the trucks the traders bring
with them.

38
It may be argued that the big traders have locked in their supplies through the
tied-credit scheme. However, the findings of Yotopolous and Floro (1991) show that the
effective interest rate of linked loans tied to the sale of output is lower than for unlinked
loans in marginal production areas and only slightly higher than unlinked loans in
developed production areas. (The stipulated interest rate of linked loans is always lower
than the rate for unlinked loans. The effective rate includes the purchase price of output at
lower –than-prevailing prices.) This means that the underpricing of output by trader-
lenders was just about enough to bring the tied loan to market interest rate. In effect, the
trader-lenders did not have monopsony power over the farmers because they could not
significantly underprice farmers’ output (which would have resulted in much higher
effective interest rates on the linked loans than unlinked loans).
It is likely that the presence of itinerant traders provide the contestability---and
competitive pressure--- in the agricultural output market at the farm gate. It is also more
likely that the overriding concern of the trader-lenders is not to exact monopsony rent
from farmers but to have as much access to farmers' ’output as possible. It can be viewed
that in so doing trader-lenders would have “control” and “monopoly power” in the
distribution of agricultural produce in the main demand (urban) areas. Unfortunately,
there are no in-depth studies on trader behavior and performance in the demand markets
in the country. There are no rigorous studies on the issue of monopoly of traders.
Moreover, the study of monopoly behavior of traders would have to take into
consideration the government’s behavior on the importation, regulation and pricing of
imported agricultural produce (e.g., rice, corn). It must be noted that the Philippines is a
small player (either as importer or exporter) in the world agricultural market. Thus,
importation and exportation provide the contestability and competitive pressure to
traders, thereby preventing traders to reap significant monopoly rent from consumers if
the management of the country’s agricultural trade policy is managed well.
At present, an analysis on the monopoly power of traders would have to rely on
indirect indicators such as gross margins and net returns of traders. As indicated earlier
39
in the section, gross margins as a ratio of sales of agriculture-related wholesalers are on
the whole lower than the average for all wholesale establishments. Other things being
equal, this suggests that agricultural traders are not gouging consumers. Nonetheless, if
Table 7 is indicative of agriculture-related wholesalers, the net marketing margin seems
to be robust despite the less-than-average gross margin because the marketing cost is
significantly lower than the gross margin.
Clearly, what is needed is an intensive and extensive analysis of indicators of
traders’ behavior and performance. Thus, a regular comparison of the wholesale-farmgate
price margins with intermarket distribution costs for as many of the supply-demand
routes as possible would provide analysts sounder basis for examining the issue of
monopsony and monopoly power of agricultural traders. The price comparisons and
analyses would need to include the less well- traveled (i.e., secondary or tertiary) routes
because it is likely in these routes where monopsony/monopoly power could exist albeit
most probably only temporarily.
Transport and infrastructure. Transport cost forms the bulk of distribution
cost. Its share accounts for at least two-thirds in rice and corn based on NFA cost surveys
(CRC, 2000), potatoes (FRLD, 1995a), mungobeans (FRLD, 1995b), cutflowers (FRLD,
1993). As expected, the share of transport cost to the total distribution cost increases as
the travel distance increases. Thus, for example, the share of transport cost to the total
cost of marketing gladiola in Metro Manila is 52% for Laguna traders and 74% for
Benguet traders (FRLD, 1993, p. 166). Similarly, the share of transport cost to the total
distribution cost of assembler-wholesalers of mungo beans in Tarlac, Iloilo and Davao
del Sur selling mungo beans in Metro Manila is 64 percent, 65 percent and 78 percent
respectively (FRLD, 1995b, p. 140).
The heavy weight of transport cost in the total distribution costs makes transport
and infrastructure as a critical policy issue for the agricultural distribution system.
Inadequate and poor quality of infrastructure raises distribution costs considerably.
Vehicle operating costs are higher by at least 50 percent on bad roads and nearly double
40
on very bad roads (CRC, 2000, p. 18). Of particular concern is domestic shipping
because Mindanao is increasingly the country’s main source of agricultural produce. This
means that, unless domestic shipping is efficient, the marginal cost of domestic sourcing
of agriculture produce rises fast. However domestic port services are among the worst in
the region and domestic shipping leaves much to be desired. In a comparative analysis of
ASEAN port costs by Lantican (1997, summarized in CRC, 2000, pp. 10-11), the
Philippines has the highest port costs in the ASEAN in the late 1980s and early 1990s.
Moreover, domestic port operations are inefficient, such that domestic liner vessels spend
about 50%-70% of their operating time moored in ports (Nathan Associates, 1990, as
summarized in CRC, 2000, p. 9). Service hours in the North Harbor are very long,
ranging from 12 hours in Pier 2 up to 231 hours in Pier 18, or an average of 51 hours per
vessel (CRC, 2000, p. 11). The net effect of poor port services is that cargo handling
costs constitute an excessive share of total shipping costs, amounting to 47 percent for the
Manila-Cebu routes for example (CRC, 2000, p.11).
A number of studies have examined the issue of freight rates and port service;
these studies have been summarized in the CRC report (2000). Despite that some of the
studies debated on the freight rates in the Philippines vis-à-vis other countries, what is
clear from the studies is that the poor port services and poor infrastructure facilities have
contributed to the comparatively high domestic distribution costs in the country. In
addition, the transport of agriculture produce faces unnecessary additional costs: e.g.,
unauthorized police harassment and “tongs”. Thus, the key challenge is in the policy and
implementation arena. The studies have highlighted the policy agenda for the short run
and the long run. In the short run, the policy recommendation included the further
liberalization of the freight rates (esp. basic agricultural products) and the removal of the
10% share of the Philippine Port Authority of the cargo handlers gross income. For the
long run, the recommendations concern infrastructure investments and dispersal of agri-
based industries. (See CRC, 2000, pp. 16-171).
In view of the number of studies that have been undertaken to examine domestic
shipping and ports, it can be argued that there may be no need for further research and

41
what matters is one of implementation. There is a lot of merit to this view. Nonetheless,
researches that could help prod further the country’s policy makers towards deepening
further the reforms in domestic shipping, ports and infrastructure development and
management remain useful. For example, studies that look at a cost benefit analysis of
the Cabotage Law could ultimately encourage the policy makers to be more flexible and
strategic in the use cabotage law. (A strict implementation of the cabotage law may be
disadvantageous, ironically, to archipelagic countries like the Philippines as compared
with contiguous countries (eg. Thailand), because the latter can rely on the country’s road
and rail systems to move products domestically, with exports and imports coursed
through the international ports. This is because the Philippines, like with developing
archipelagic countries, is hamstrung by the inadequacy of shipping bottoms among liners,
thereby forcing producers with/or traders to use the more expensive trampers.) Similarly,
it is useful to undertake a cost-benefit analysis as well as an organizational analysis on
the ports authority to make the agency more facilitative rather than on a regulator and a
taxman.
Transport handling, technology and incentives. There is one major concern
that deserves more research and policy discussions. This is related to private and
government investment in the newer cargo handling and packaging technologies that can
reduce handling time and losses (from pilferage and others) as well as maintain product
quality. For fruits, vegetables and cutflowers, this means adopting cold chain technology.
That is, “… modern post-harvest shelf-life extensive treatments such as controlled
atmosphere or extended nitrogen storage facilities… (because) high postharvest losses for
fruits, vegetables and cutflower (stem from) high temperatures…” (CRC, 2000, pp. 18-
19).
Similarly, containerization of cargo would reduce domestically stevedoring work,
speed up loading and unloading of cargo, decrease time of ships moored in piers, and
improve turn around time of ships. The net result is an effective increase in the shipping
bottoms which will help address the shortage of shipping bottoms in domestic liners.
There will also be a much more efficient use of ships and ports, thereby likely reducing
42
overall shipping cost. According to the CRC Report (2000, p. 11), stevedoring charges
are higher than vessel operations in the financial statements of domestic shipping lines
and for the Manila-Cebu routes, cargo handling costs account for 47 percent of shipping
costs.
The main research issue is what is the nature of government intervention to
encourage the adoption of more efficient technologies in ports and post-harvest facilities.
There is, of course, greater likelihood that there are public interest and public good in
ports than in post-harvest facilities. Should the government impose technology standards
such as containerization when it bids out the operations of port facilities to the private
sector? Or should the government provide fiscal incentives or explicit subsidies to the
private sector? What are the implications on the whole post-harvest product packing and
handling as a result of the adoption of the newer cargo handling technology (e.g.,
containerization)? What are the overall costs and benefits to the various players in the
agricultural distribution system and to the consumers? Questions such as those
mentioned above need to be answered in order for the government to determine the
appropriate policies and programs to implement.
Food terminals and commodity exchanges. The government funded a
prefeasibility study on the development of an agricultural commodity futures exchange.
Underpinning this program is that given the perennial problems of Philippine agricultural
distribution of insufficient linkages and information, poor packaging, handling and
storage, and inefficient distribution, the Philippine government may need to be a catalyst
for the improvement in the country’s agricultural distribution system.
As part of the prefeasibility study on the commodity futures exchange,
Sikap/Strive Foundation (2000) examined the wholesale markets and/or commodity
exchanges in Thailand, Japan, Taiwan and South Korea in addition to the Philippine Food
Terminal, Inc. As note earlier in Section II of this paper, the Philippine FTI failed while
the others succeeded. The Sikap/Strive Foundation report (2000) examined the causes
for the failure of FTI. What has not been highlighted in the report is what is the common

43
element of the success of the food terminals in the other countries. That is, in virtually all
of them, the food terminals were not meant to supplant the private traders (although in
Thailand’s case the long run objective is to eliminate middlemen). In addition, the food
terminals or wholesale markets in Korea and Taiwan are joint public-private ventures
while in Thailand’s, totally private venture. In all of them, the key service of the food
terminal is to provide the modern area and physical facilities, efficient transportation
access and auction system for wholesalers and retailers to interact. It is apparent that
such facilities in the main demand market (e.g., Bangkok, Tokyo) are only workable if
they are integrated in the country’s distribution network. In the case of Taiwan, this is
assured because the Taiwan Agricultural Product Marketing Corporation is owned by
farmers cooperatives, wholesalers/dealers, fruits and vegetables cooperatives, and the city
and provincial governments with an island-wide marketing network (Sikap/Strive
Foundation, 2000 pp. 30-38). South Korea’s wholesale markets have also a strong
presence of cooperatives, under the National Agricultural Cooperative Federation
(NACF) at the Apex. NACF has a network of collection points, warehouses for cold
storage and packaging warehouses in the rural areas and cooperative marketing and
distribution centers in the urban areas ( Sikap/Strive Foundation, 2000, pp 4-6).
A review of the experiences of Taiwan, South Korea, Japan and Thailand brings
out why FTI failed: That is, FTI was a modern facility with virtually no link in the
country’s distribution network. It is also inconveniently physically located being far from
the port (for trade with Mindanao and the Visayas) and from the entry point from
Northern Luzon, in contrast to Divisoria. In addition, it was government -run that led to
politically motivated strategies, confused vision and mission and crippling financial and
bureaucratic problems.
Nonetheless, despite the failure of FTI, it is important to examine how the
government can help improve the physical distribution system of agricultural distribution
in the country. Clearly, not to supplant traders but to work with traders. The trading
institutions can expand to include produce marketing cooperatives as in Taiwan and
South Korea. What incentive structure would encourage private investments in putting

44
up more modern wholesale facilities similar to Talad Thai in Bangkok? Should the
government encourage joint venture arrangements with producers, cooperatives,
wholesalers and dealers, and local governments similar to Taiwan or South Korea? If so,
how---through fiscal incentives, setting rules and standards, or providing corollary
support infrastructure like roads? In some respect, therefore, the issue would need to be
reconciled with the overall public investment program of the national government and the
local governments. Despite the massive report on the prefeasibility study for the
development of agricultural commodity futures exchange in the country (see FRLD,
2000; Sikap/Strive Foundation, 2000), the issues raised above were not adequately
addressed in the study.
45
V. Other Research Concerns: Price Policy, Multimarket Analysis and Export
Marketing
There are other policy and research concerns of interest to agricultural
distribution. Two of them are price policy and external trade.
Price policy. Price policy, in its macroeconomic and sectoral senses, influences
very strongly the agricultural distribution system. Price ceilings and floors directly affect
private storage activities; they also encourage the private sector to concentrate their
marketing in the main urban areas, thereby influencing commodity flows and private
sector needs for transportation services. Interest rates affect storage costs and private
investments in transportation, warehousing and processing facilities because the more
technically efficient technologies tend to be more capital intensive. (See Timmer, 1987,
pp. 295-298.)
Thus price policy is central to agricultural distribution. There is a huge literature
on agricultural price policy. This paper will not undertake a review of this literature;
Peter Timmer’s book Getting Prices Right (1986) provides an excellent discussion of
the scope and limits of agricultural pricing policy.
Nonetheless, there remains an important research challenge with significant
implication on policy. That is, in addition to the detailed microlevel analyses and regular
surveys on the agricultural distribution system as suggested earlier in the paper, it would
be useful to develop agricultural policy models with a well articulated agricultural
distribution subsystem. These models would have to consider explicitly the spatial
dimension to bring out the transportation concerns (a national single market agricultural
distribution submodel is less insightful). The models would need to highlight also the
vertical linkages from the farm to processing and the consumers. The models may need
to be multi-commodity because policies affecting agricultural commodities differentially
would necessarily have different implications on the spatial network of the agricultural
distribution system. This is because the country’s regions have different comparative
advantages in the production of various agricultural commodities.
46
An example of a multi-commodity, multi-region agricultural policy model is the
Vietnam Agricultural Spatial Equilibrium Model (VASEM), developed by the
International Food Policy Research Institute (IFPRI) as part of its study on Vietnam’s
rice economy. The model has seven regions and several commodities. It takes into
account the regional differences in production and consumption of each of the
commodities as well as the cost of transporting goods from one region to another. The
specifications of the model allows for an analysis of alternative policy options on
Vietnam’s rice sector; e.g., elimination of restrictions on domestic rice trade, reduction
of interregional transport costs, imposition of variable levy for domestic stabilization,
imposition of export quota.5
A similar multi-commodity and multi-region model but with a more articulated
agricultural distribution submodel may need to be developed for the Philippines in order
to examine a number of important policy issues. These issues could include price
stabilization strategies such as the imposition of a variable levy for rice, impact of
reduction in tariffs especially in corn and sugar, changes in the distribution costs
between markets, and technical change in production. Changes in macroeconomic prices
such as interest rates, exchange rate and wage rate would have varying impacts on
agricultural commodities, regions and the agricultural distribution system. Policy
simulations using such multi-commodity multi-region models can provide valuable
policy insights at an economy wide, multi-regional perspective. The policy insights from
the model simulations together with the results of the more detailed micro-level analyses
and industry surveys discussed earlier in the paper would contribute to more robust
policy and institutional reform as well as program implementation decisions.
5 A less well-articulated model with marketing margins at the national level (without regional breakdown) is that of Arndt, et.al., on Mozambique (1999). The model essentially assumes fixed input-output relationships of distribution services with agriculture at the national level. Although simpler than the Vietnamese model, the Mozambique model is still useful for Mozambique because it highlights the importance of improving the distribution system since marketing margins are even three times higher than producer prices in some cases.

47
Export marketing and trade. An additional yet related research concern
involves export marketing and international trade. Although the Philippines is
increasingly a net food importer, the country has some areas of comparative advantage
in agriculture. The challenge is in building and strengthening the country’s niches in
agriculture and agri-based processed products. Certainly, the fundamental requirement
for maintaining comparative advantage is improving agricultural productivity.
Nonetheless, it is useful to examine how the country can go beyond price as basis for
export competitiveness. Specifically, how to strengthen the country’s export niches in
agriculture through “branding”, primarily through product differentiation, innovation
and quality control but also through improvement in trade- related services.
While the leeway for product differentiation is much more limited for agricultural
products than for manufactures, nonetheless, product branding is still possible to some
extent. Examples include Thai jasmine rice or Japanese rice, Australian wine or French
wine, Fuji apples or Washington apples. Successful product branding (which would
allow for some export premium) may require consistency of product quality and
distinctive product characteristics. Thus, product-based branding requires stringent
quality control, credibility of the product certification process, and product innovation
(e.g., development of new varieties with better product characteristics; intensive soil
analysis to determine impact of soil characteristics on product characteristics).
It is likely that it is far more difficult for the Philippines to develop product brands
on fresh produce given the very stringent phyto-sanitary standards of developed
countries. It is probably more realistic to develop product brands in processed foods,
relying initially on Filipinos residing abroad as the staging ground for the export market.
However, it appears that Filipino exporters are in fact losing out to exporters from other
countries like Thailand for even ethnic Filipino foods for export to Filipinos residing
abroad. The reasons for the losing competitiveness of Filipino exporters for the Filipino
export market abroad include poor packaging, poor quality control and more expensive
(because of high cost of inputs like sugar).

48
Considering that product branding or value adding through processing is one key
means for the Philippines to improve its export niches in agri-based industries, it is
useful to undertake more intensive analysis on how the country can strengthen product
development and value adding through food processing. What policy and institutional
measures can the government undertake to promote product innovation, quality control
and export niche market development among farmers and food processors? How can the
government R & D system be more oriented towards the needs for product development
and process innovation in the agri-based industries in order to meet the changing tastes
and demands in the export and domestic markets? What is the export market
environment in terms of foreign government rules and regulations, customer preferences
and competitor offerings? Pursuing the above mentioned questions require more
“action type research” with the strong involvement of the private sector and the
government agencies concerned with export market development, product standards,
food safety and R & D.

49
V. Concluding Remarks: Research Gaps and Suggestions for Research on the
Agricultural Distribution and Development
The previous sections of this review paper have included research gaps and
suggestions for research. This concluding section summarizes them. The following are
the major research gaps with the corresponding suggestions for research.
1. There are no regular analyses on the performance and evolution of the
Philippine agricultural distribution system.
• While the FRLD studies are a good start, they are essentially one-off
activities. In view of the importance of the agricultural distribution sector to
the overall performance and competitiveness of Philippine agriculture, it is
recommended that the government develop well-designed survey materials on
the agricultural distribution sector (e.g., performance, marketing costs, returns,
commodity flows, credit tie-ups). Surveys on the sector be undertaken on a
regular basis (say, every two years). Such surveys, together with the results of
the Annual Survey of Establishments in the Wholesale and Retail Sector
which is currently being undertaken by the National Statistics Office, provide
the foundation for analyses on the performance and evolution of the
agricultural distribution sector.
2. There is yet no intensive evaluation of the efficiency and competitiveness
of the agricultural distribution sector.
• In addressing this research gap, there are at least two key research
activities that can be undertaken. The first is the comparison of, on the one
hand, price margins between markets or between processed and unprocessed
forms of a commodity and, on the other hand, estimates of actual costs of
50
transport, storage and processing. The comparisons need to be for as many
supply-demand routes as possible in order to capture the transport factor well.
The inter-market price comparison with transport cost is useful in providing
some indications of the presence of monopoly/monopsony power of either the
traders or shippers. They would also be useful in the prioritization of
infrastructure projects. Specifically, where it is apparent that high price
margins in certain areas are caused primarily by high transport costs arising
from poor infrastructure facilities, then it is likely that the welfare benefits
from infrastructure investments would be better if the investment program of
the government gives priority to addressing such infrastructural bottlenecks
that lead to the high price margins.
The second research area is the comprehensive and intensive analysis of
market integration for several key agricultural products in the country. The
analysis preferably uses both simple and more sophisticated statistical and
analytical tools in order to have more robust conclusions.
While the focus of the analysis of market integration concerns the integration
of the domestic markets with one another, it is also useful to determine the
dynamics of the transmission of international price shocks (e.g., change in the
world commodity prices) on the domestic economy. Here it is useful to
compare the analysis for the Philippines with the experience of comparator
countries like Thailand, data and other information permitting. Such
comparative analyses can provide insights on the extent of insulation of
domestic markets from world market fluctuations.
3. The third research gap involves policy oriented studies on how the
government can facilitate or jumpstart private sector investment in
improving the physical distribution aspect of agricultural marketing.

51
• Such studies include encouraging private investments in more effective
technologies that contribute to the greater efficiency of distribution-related
services such as transport and port services, storage and even processing; e.g.,
cold chain technology, containerization, modern wholesale market facilities.
These studies form part of the broader research challenge of analyzing and
developing alternative institutional approaches and of undertaking regulatory
refinements in order to encourage the private sector to invest in agriculture
and the agricultural distribution sector; e.g., putting export-oriented product
innovative food processing firms on a “free trade status” similar to firms in
export zones.
4. There is a need for more intensive analysis of the export market
environment especially as it relates to developing export niches and
understanding better the regulatory environment in export markets.
• The important focus here is on the analysis of the demand patterns, marketing
practices and the regulatory regimes in major export markets. The important
corollary is the exploration of potentials for “branding” of Philippine
agricultural exports, at least in well-chosen niches. The results of such
analyses can help the country prepare and/or refine its export development
strategy for agriculture-based products.
5. It is time to have more multi-market, multi-regional agricultural policy
models with well-articulated agricultural distribution submodel. Such
models help provide quantitative and well-integrated evaluation of
alternative policy options of interest to the Philippines; e.g., improvements
in transport services, reduction in tariffs in corn, rice and sugar.
Finally, the research suggestions presented above ---the skeleton of a research
agenda for the Philippine agricultural distribution sector---could help the country develop
52
an efficient and dynamic agricultural distribution sector and, in the process, hopefully
becomes a catalyst for change and innovation in the Philippine agriculture sector.

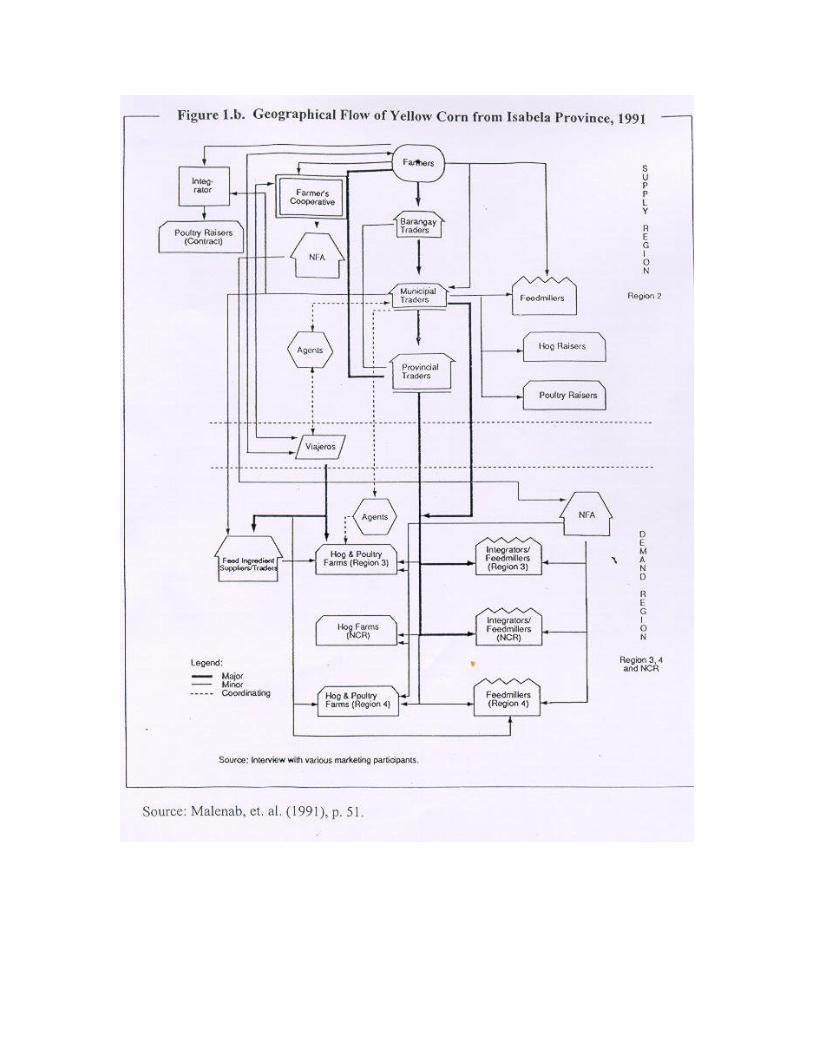


PSIC Code Industry DescriptionLevel Share*
Level Share*Level Share*
Level Share*
Total for All Industries 9,173 (%) 144,384 (%) 9,775 (%) 179,428 (%) Large Small
611 Farm, forest, and marine products, (WSAGL) 533 5.8 9,107 6.3 381 3.90 11,819 6.59 -28.5 29.8
6110 Farm, forest, and marine products, (WSAGL) 533 5.8 9,107 6.3 381 3.90 11,819 6.59 -28.5 29.8
61101 Palay,corn(unmilled), and other grains (WSAGL) 166 1.8 3,273 2.3 108 1.10 4,706 2.62 -34.9 43.8
61102 Abaca and other fibers, except synthetic fibers, WSAGL 21 0.2 162 0.1 18 0.18 134 0.07 -14.3 -17.3
61103 Coconut and coconut by-products, WSAGL 165 1.8 4,371 3.0 114 1.17 5,232 2.92 -30.9 19.7
61104 Fruits, nuts (except coconut) and vegetables, WSAGL 20 0.2 237 0.2 34 0.35 367 0.20 70.0 54.9
61105 Tobacco Leaf Dealing 53 0.6 49 0.0 30 0.31 61 0.03 -43.4 24.5
61106 Forest Products Dealing 19 0.2 94 0.1 8 0.08 59 0.03 -57.9 -37.2
61107 Livestock and poultry unprocessed animal products, dealing 11 0.1 127 0.1 19 0.19 282 0.16 72.7 122.0
61108 Fish and other seafood, WSAGL 60 0.7 691 0.5 41 0.42 897 0.50 -31.7 29.8
61109 Farm, forest, and marine products, (WSAGL), N.E.C. 18 0.2 103 0.1 11 0.11 85 0.05 -38.9 -17.5
62214 Rice, corn, and other cereals, and beans and pulses, RTLG 61 0.7 12,119 8.4 64 0.65 13,354 7.44 4.9 10.2
62215 Meat and poultry products, RTLG 10 0.1 680 0.5 44 0.45 1,426 0.79 340.0 109.7
62216 Fish and other seafood, (fresh and dried), RTLG 16 0.2 1,927 1.3 19 0.19 2,595 1.45 18.8 34.7
62217 Fruit and vegetables, RTLG 13 0.1 2,090 1.4 12 0.12 3,075 1.71 -7.7 47.1
**Percentage Change between 1988 and 1994.
Source of Raw Data: PDFI Retail Trade Policy and the Philippine Economy (2000)
* Share relative to total number of all wholesale and retail establishments.
Large Establishments Small Establishments
1988
Percentage Change**
Large Establishments Small Establishments
Table 1: Number of Agriculure Related Wholesale and Retail Establishments
1994
Change in No. of Establsihments

Table 2A: Employment, Gross Sales, and Value Added of Agriculure Related Wholesale and Retail Establishments, 1988
PSIC Code Industry Description
Level Sharea
Level Sharea
Level Sharea
(%) (In Thousands) (%) (In Thousands) (%)
217,067 175,057,474 21,821,776
61 Wholesale Trade 90,347 41.6 112,363,509 64.2 14,732,630 67.5
611 Farm, forest, and marine products, (WSAGL) 10,721 4.9 7,548,103 4.3 55,904 0.3
6110 Farm, forest, and marine products, (WSAGL) 10,721 4.9 7,548,103 4.3 55,904 0.3
61101 Palay,corn(unmilled), and other grains (WSAGL) 2,959 1.4 1,419,381 0.8 -366,192 -1.7
61102 Abaca and other fibers, except synthetic fibers, WSAGL 610 0.3 382,666 0.2 47,233 0.2
61103 Coconut and coconut by-products, WSAGL 2,260 1.0 1,952,933 1.1 116,177 0.5
61104 Fruits, nuts (except coconut) and vegetables, WSAGL 399 0.2 437,446 0.2 56,033 0.3
61105 Tobacco Leaf Dealing 2,409 1.1 949,182 0.5 20,490 0.1
61106 Forest Products Dealing 245 0.1 32,287 0.0 8,047 0.0
61107 Livestock and poultry unprocessed animal products, dealing 316 0.1 101,268 0.1 63,134 0.3
61108 Fish and other seafood, WSAGL 1,618 0.7 1,792,068 1.0 76,274 0.3
61109 Farm, forest, and marine products, (WSAGL), N.E.C. 269 0.1 543,873 0.3 34,708 0.2
62 Retail Trade 126,720 58.4 62,693,965 35.8 7,089,146 32.5
62214 Rice, corn, and other cereals, and beans and pulses, RTLG 564 0.3 181,345 0.1 18,540 0.1
62215 Meat and poultry products, RTLG 103 0.0 35,096 0.0 3,380 0.0
62216 Fish and other seafood, (fresh and dried), RTLG 181 0.1 55,283 0.0 4,718 0.0
62217 Fruit and vegetables, RTLG 70 0.0 3139 0.0 763 0.0
PSIC Code Industry Description
Level Sharea
Level Sharea
Level Sharea
(%) (In Thousands) (%) (In Thousands) (%)
450,512 58,292,940 10,549,529
61 Wholesale Trade 58,373 13.0 15,856,948 27.2 3,691,152 35.0
611 Farm, forest, and marine products, (WSAGL) 32,765 7.3 4,228,002 7.3 540,996 5.1
6110 Farm, forest, and marine products, (WSAGL) 32,765 7.3 4,228,002 7.3 540,996 5.1
61101 Palay,corn(unmilled), and other grains (WSAGL) 13,565 3.0 2,051,235 3.5 233,205 2.2
61102 Abaca and other fibers, except synthetic fibers, WSAGL 562 0.1 47,957 0.1 7,971 0.1
61103 Coconut and coconut by-products, WSAGL 13,544 3.0 136,188 0.2 182,280 1.7
61104 Fruits, nuts (except coconut) and vegetables, WSAGL 1,023 0.2 149,789 0.3 23,686 0.2
61105 Tobacco Leaf Dealing 162 0.0 91,286 0.2 5,717 0.1
61106 Forest Products Dealing 346 0.1 48,091 0.1 6,692 0.1
61107 Livestock and poultry unprocessed animal products, dealing 454 0.1 75,126 0.1 11,258 0.1
61108 Fish and other seafood, WSAGL 2,674 0.6 314,090 0.5 11,258 0.1
61109 Farm, forest, and marine products, (WSAGL), N.E.C. 435 0.1 88,541 0.2 11,583 0.1
62 Retail Trade 392,139 87.0 42,435,992 72.8 6,858,376 65.0
62214 Rice, corn, and other cereals, and beans and pulses, RTLG 28,883 6.4 2,235,141 3.8 375,482.00 3.6
62215 Meat and poultry products, RTLG 2,204 0.5 224,736 0.4 39,429.00 0.4
62216 Fish and other seafood, (fresh and dried), RTLG 4,715 1.0 297,372 0.5 63,014.00 0.6
62217 Fruit and vegetables, RTLG 3,817 0.8 330,372 0.6 59,245.000 0.6
a. Share to total for all wholesale and retail industries.
Source of Raw Data: PDFI Retail Trade Policy and the Philippine Economy (2000)
Employment Gross Sales Value Added
Employment Gross Sales Value Added
Total for all wholesale and retail industries
Total for all wholesale and retail industries
Large Establishments
Small Establishments

Table 2B: Employment, Gross Sales, and Value Added of Agriculure Related Wholesale and Retail Establishments, 1994
PSIC Code Industry Description
Level Sharea
Level Sharea
Level Sharea
(In Thousands) (%) (In Thousands) (%) (In Thousands) (%)
286,867 498,334,966 76,081,348
61 Wholesale Trade 105,225 36.7 260,677,903 52.3 50,929,603 66.9
611 Farm, forest, and marine products, (WSAGL) 10,641 3.7 8,952,020 1.8 1,541,206 2.0
6110 Farm, forest, and marine products, (WSAGL) 10,641 3.7 8,952,020 1.8 1,541,206 2.0
61101 Palay,corn(unmilled), and other grains (WSAGL) 2,539 0.9 2,110,362 0.4 246,501 0.3
61102 Abaca and other fibers, except synthetic fibers, WSAGL 582 0.2 545,664 0.1 47,915 0.1
61103 Coconut and coconut by-products, WSAGL 1,923 0.7 2,981,351 0.6 466,387 0.6
61104 Fruits, nuts (except coconut) and vegetables, WSAGL 1,490 0.5 603,127 0.1 301,931 0.4
61105 Tobacco Leaf Dealing 777 0.3 663,567 0.1 55,642 0.1
61106 Forest Products Dealing 259 0.1 14,362 0.0 24,381 0.0
61107 Livestock and poultry unprocessed animal products, dealing 604 0.2 659,923 0.1 250,097 0.3
61108 Fish and other seafood, WSAGL 1,964 0.7 809,094 0.2 96,257 0.1
61109 Farm, forest, and marine products, (WSAGL), N.E.C. 503 0.2 435,171 0.1 52,096 0.1
62 Retail Trade 181,642 63.3 237,657,063 47.7 25,151,745 33.1
62214 Rice, corn, and other cereals, and beans and pulses, RTLG 869 0.3 803,913 0.2 73,461 0.1
62215 Meat and poultry products, RTLG 6,223 2.2 1,017,102 0.2 133,506 0.2
62216 Fish and other seafood, (fresh and dried), RTLG 336 0.1 238,231 0.0 19,316 0.0
62217 Fruit and vegetables, RTLG 190 0.1 56,256 0.0 8,241 0.0
PSIC Code Industry Description
Level Sharea
Level Sharea
Level Sharea
(In Thousands) (%) (In Thousands) (%) (In Thousands) (%)
574,210 178,170,059 36,328,216
61 Wholesale Trade 66,920 11.7 39,324,768 22.1 7,520,566 20.7
611 Farm, forest, and marine products, (WSAGL) 37,972 6.6 9,059,198 5.1 1,445,860 4.0
6110 Farm, forest, and marine products, (WSAGL) 37,972 6.6 9,059,198 5.1 1,445,860 4.0
61101 Palay,corn(unmilled), and other grains (WSAGL) 15,938 2.8 4,525,761 2.5 713,804 2.0
61102 Abaca and other fibers, except synthetic fibers, WSAGL 413 0.1 97,269 0.1 12,859 0.0
61103 Coconut and coconut by-products, WSAGL 15,799 2.8 2,109,697 1.2 472,679 1.3
61104 Fruits, nuts (except coconut) and vegetables, WSAGL 1,064 0.2 211,829 0.1 38,397 0.1
61105 Tobacco Leaf Dealing 338 0.1 371,358 0.2 32,568 0.1
61106 Forest Products Dealing 165 0.0 34,363 0.0 7,964 0.0
61107 Livestock and poultry unprocessed animal products, dealing 620 0.1 364,192 0.2 43,021 0.1
61108 Fish and other seafood, WSAGL 3,335 0.6 1,273,946 0.7 103,156 0.3
61109 Farm, forest, and marine products, (WSAGL), N.E.C. 300 0.1 70,783 0.0 21,412 0.1
62 Retail Trade 507,290 88.3 138,845,292 77.9 28,807,648 79.3
62214 Rice, corn, and other cereals, and beans and pulses, RTLG 36,681 6.4 5,858,215 3.3 981,849 2.7
62215 Meat and poultry products, RTLG 4,603 0.8 1,687,461 0.9 303,629 0.8
62216 Fish and other seafood, (fresh and dried), RTLG 5,908 1.0 475,172 0.3 105,460 0.3
62217 Fruit and vegetables, RTLG 7,153 1.2 585,235 0.3 201,525 0.6
a. Share to total for all wholesale and retail industries.
Source of Raw Data: PDFI Retail Trade Policy and the Philippine Economy (2000)
Value Added
Large EstablishmentsEmployment Value Added
Total for all wholesale and retail industries
Employment
Gross Sales
Total for all wholesale and retail industries
Small EstablishmentsGross Sales

Table 3: Labor Productivity in Agriculture Related Wholesale and Retail Industries
Column 1 Column 2 Column 3 Column 4 Column 5 Column 6 Column 7 Column 8
PSIC Code Industry Description
Large Small Large Small Large Small Large Small
61 Wholesale Trade 163.1 63.2 484.0 112.4 196.8 77.7 14.8 -104.3611 Farm, forest, and marine products, (WSAGL) 5.2 16.5 144.8 38.1 2677.6 130.6 2495.6 -51.4
6110 Farm, forest, and marine products, (WSAGL) 5.2 16.5 144.8 38.1 2677.6 130.6 2495.6 -51.461101 Palay,corn(unmilled), and other grains (WSAGL) -123.8 17.2 97.1 44.8 -178.4 160.5 -360.5 -21.561102 Abaca and other fibers, except synthetic fibers, WSAGL 77.4 14.2 82.3 31.1 6.3 119.5 -175.7 -62.561103 Coconut and coconut by-products, WSAGL 51.4 13.5 242.5 29.9 371.8 122.3 189.8 -59.761104 Fruits, nuts (except coconut) and vegetables, WSAGL 140.4 23.2 202.6 36.1 44.3 55.9 -137.7 -126.261105 Tobacco Leaf Dealing 8.5 35.3 71.6 96.4 741.9 173.0 559.9 -9.061106 Forest Products Dealing 32.8 19.3 94.1 48.3 186.6 149.6 4.6 -32.561107 Livestock and poultry unprocessed animal products, dealing 199.8 24.8 414.1 69.4 107.3 179.8 -74.8 -2.261108 Fish and other seafood, WSAGL 47.1 4.2 49.0 30.9 4.0 634.7 -178.1 452.661109 Farm, forest, and marine products, (WSAGL), N.E.C. 129.0 26.6 103.6 71.4 -19.7 168.0 -201.8 -14.0
62 Retail Trade 55.9 17.5 138.5 56.8 147.5 224.7 -34.5 42.762214 Rice, corn, and other cereals, and beans and pulses, RTLG 32.9 13.0 84.5 26.8 157.2 105.9 -24.9 -76.162215 Meat and poultry products, RTLG 32.8 17.9 21.5 66.0 -34.6 268.7 -216.7 86.762216 Fish and other seafood, (fresh and dried), RTLG 26.1 13.4 57.5 17.9 120.5 33.6 -61.5 -148.562217 Fruit and vegetables, RTLG 10.9 15.5 43.4 28.2 297.9 81.5 115.9 -100.5
a. Change in labor productivity between 1988 and 1994.b. The general inflation rate (using GDP deflator) between 1988 and 1994 is 182.04%. Note:The estimates for 611and 6110 in columns 5 and 7 are questionable, please see text. Similarly, the estimates for 61101 in columns 1 and 7 are questionable, please see text. Source of Raw Data: PDFI Retail Trade Policy and the Philippine Economy (2000)
At Current Prices In Percent At Constant Prices In PercentbValue (P1,000) Value (P1,000)
1988 1994 Change in Labor Productivitya Change in Labor Productivitya
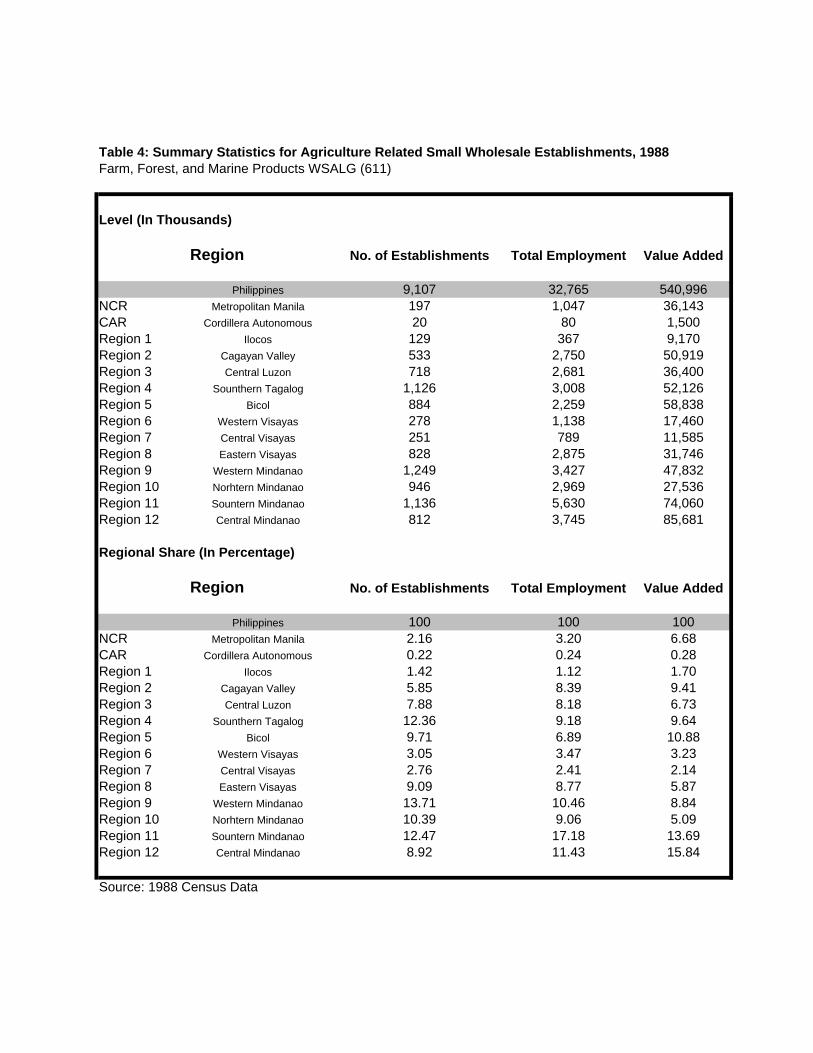
Table 4: Summary Statistics for Agriculture Related Small Wholesale Establishments, 1988Farm, Forest, and Marine Products WSALG (611)
Level (In Thousands)
No. of Establishments Total Employment Value Added
Philippines 9,107 32,765 540,996NCR Metropolitan Manila 197 1,047 36,143CAR Cordillera Autonomous 20 80 1,500Region 1 Ilocos 129 367 9,170Region 2 Cagayan Valley 533 2,750 50,919Region 3 Central Luzon 718 2,681 36,400Region 4 Sounthern Tagalog 1,126 3,008 52,126Region 5 Bicol 884 2,259 58,838Region 6 Western Visayas 278 1,138 17,460Region 7 Central Visayas 251 789 11,585Region 8 Eastern Visayas 828 2,875 31,746Region 9 Western Mindanao 1,249 3,427 47,832Region 10 Norhtern Mindanao 946 2,969 27,536Region 11 Sountern Mindanao 1,136 5,630 74,060Region 12 Central Mindanao 812 3,745 85,681
Regional Share (In Percentage)
No. of Establishments Total Employment Value Added
Philippines 100 100 100NCR Metropolitan Manila 2.16 3.20 6.68CAR Cordillera Autonomous 0.22 0.24 0.28Region 1 Ilocos 1.42 1.12 1.70Region 2 Cagayan Valley 5.85 8.39 9.41Region 3 Central Luzon 7.88 8.18 6.73Region 4 Sounthern Tagalog 12.36 9.18 9.64Region 5 Bicol 9.71 6.89 10.88Region 6 Western Visayas 3.05 3.47 3.23Region 7 Central Visayas 2.76 2.41 2.14Region 8 Eastern Visayas 9.09 8.77 5.87Region 9 Western Mindanao 13.71 10.46 8.84Region 10 Norhtern Mindanao 10.39 9.06 5.09Region 11 Sountern Mindanao 12.47 17.18 13.69Region 12 Central Mindanao 8.92 11.43 15.84
Source: 1988 Census Data
Region
Region

Table 5: Summary Statistics for Agriculture Related Wholesale Establishments, 1995Regional Share of Farm, Forest, and Marine Products WSAGL (611)In Percentage
Region No. of Establishments Employmenta Value Added
Level for Philippines (In thousands) 344 10,784 731,905,775
Philippines 100 100 100NCR 11.6 12.3 40.0
Cordillera Autonomous 8.1 7.0 8.0Ilocos 5.2 5.7 4.9
Cagayan Valley 2.3 2.8 7.5Central Luzon 7.6 6.6 -18.9
Sounthern Tagalog 4.9 11.8 7.9Bicol 2.9 1.3 4.8
Western Visayas 5.8 14.6 8.1Central Visayas 4.9 4.6 5.0Eastern Visayas 8.4 8.2 5.5
Western Mindanao 8.4 5.5 Norhtern Mindanao 18.0 15.6 16.0Southern Mindanao 5.8 1.1 2.6
Central Mindanao 1.5 0.8 0.9ARMM 1.5 0.8 0.7Caraga 2.9 1.4 0.6
Region No. of Establishments Employmentb Value Added
Level for Philippines (In thousands) 12,446 22,067 3,350,721,149
Philippines 100 100 100Metropolitan Manila 1.5 2.9 1.3
Cordillera Autonomous 0.4 0.2 0.0Ilocos 2.7 2.3 1.2
Cagayan Valley 6.3 16.3 6.0Central Luzon 8.4 5.4 10.9
Sounthern Tagalog 13.4 10.4 2.2Bicol 8.5 5.3 46.9
Western Visayas 2.8 2.1 1.0Central Visayas 2.1 2.1 1.5Eastern Visayas 9.3 3.1 2.2
Western Mindanao 13.6 10.5 7.1Norhtern Mindanao 6.7 3.4 2.3Sountern Mindanao 10.5 24.7 13.1Central Mindanao 6.0 1.7 1.2
ARMM 4.4 7.9 2.5Caraga 3.4 1.7 0.5
a. Employment refers to total paid employees.b. Employment refers to average total employees.Source: Data set for large establishments was obtained from the Annual Survey of Establishments.
Data set for small establishments was obtained from the PDFI Retail Trade Policy and the Philippine Economy (2000).
Small Establishments
Large Establishments
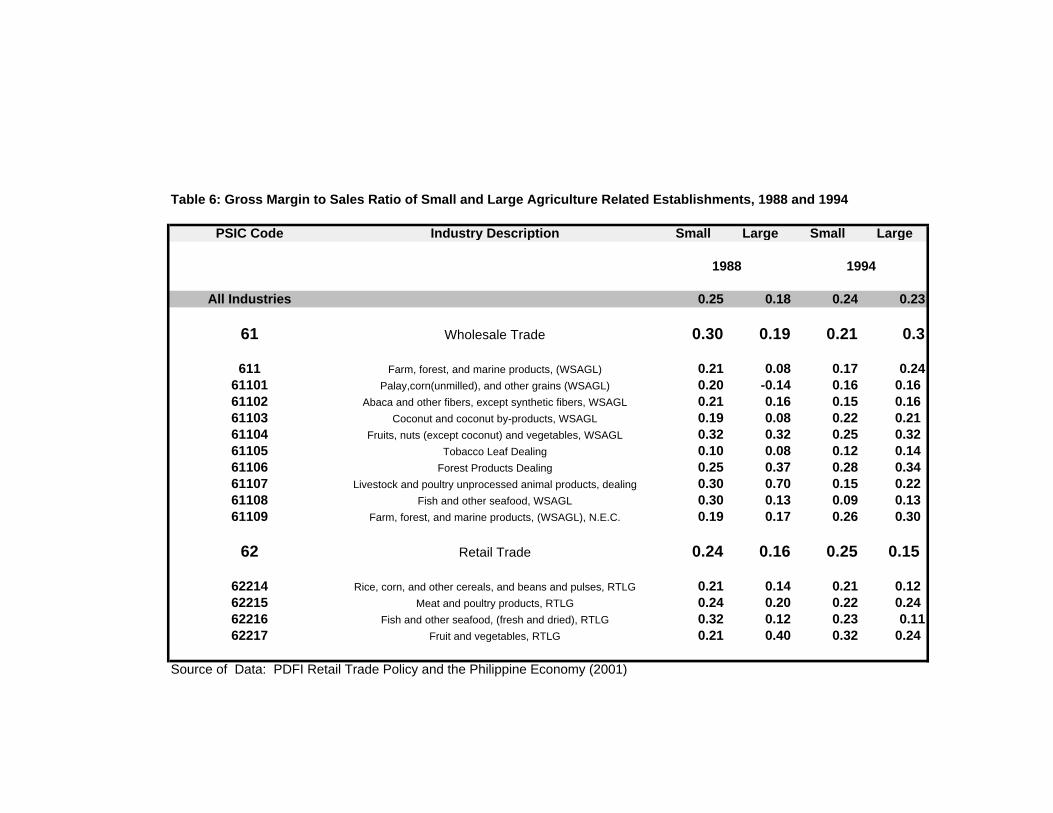
Table 6: Gross Margin to Sales Ratio of Small and Large Agriculture Related Establishments, 1988 and 1994
PSIC Code Industry Description Small Large Small Large
All Industries 0.25 0.18 0.24 0.23
61 Wholesale Trade 0.30 0.19 0.21 0.3
611 Farm, forest, and marine products, (WSAGL) 0.21 0.08 0.17 0.2461101 Palay,corn(unmilled), and other grains (WSAGL) 0.20 -0.14 0.16 0.16 61102 Abaca and other fibers, except synthetic fibers, WSAGL 0.21 0.16 0.15 0.16 61103 Coconut and coconut by-products, WSAGL 0.19 0.08 0.22 0.21 61104 Fruits, nuts (except coconut) and vegetables, WSAGL 0.32 0.32 0.25 0.32 61105 Tobacco Leaf Dealing 0.10 0.08 0.12 0.14 61106 Forest Products Dealing 0.25 0.37 0.28 0.34 61107 Livestock and poultry unprocessed animal products, dealing 0.30 0.70 0.15 0.22 61108 Fish and other seafood, WSAGL 0.30 0.13 0.09 0.13 61109 Farm, forest, and marine products, (WSAGL), N.E.C. 0.19 0.17 0.26 0.30
62 Retail Trade 0.24 0.16 0.25 0.15
62214 Rice, corn, and other cereals, and beans and pulses, RTLG 0.21 0.14 0.21 0.12 62215 Meat and poultry products, RTLG 0.24 0.20 0.22 0.24 62216 Fish and other seafood, (fresh and dried), RTLG 0.32 0.12 0.23 0.1162217 Fruit and vegetables, RTLG 0.21 0.40 0.32 0.24
Source of Data: PDFI Retail Trade Policy and the Philippine Economy (2001)
1988 1994

Table 7: Marketing Margin and Cost: Two Examples
Granola Potatoes From Benguet, Nov. 1993 - April 1994
Wholesale Price in Manila P13.85 /kg
Marketing Cost of Assembler-Wholesaler from Benguet Selling in Manila P1.10/kg
Marketing Margin of Assembler-Wholesaler from Benguet Selling in Manila P2.10/kg
Marketing Margin as Percentage of Manila Wholesale Price 15.2%
Marketing Cost as Percentage Share of Manila Wholesale Price 7.9%
Yellow Munbean From Iloilo, December 1993 - July 1994
Wholesale Price of Yellow Mungbean from Manila P24.33/kg
Marketing Cost of Assembler-Wholesaler from Iloilo Selling in Manila P1.01/kg
Marketing Margin of Assembler-Wholesaler from Iloilo Selling in Manila P2.89/kg
Marketing Margin as Percentage of Manila Wholesale Price 11.9%
Marketing Cost as Percentage Share of Manila Wholesale Price 4.2%
Source: FLRD 1995 A and B

B I B L I O G R A P H Y Acharya, R. (2000). Market Power and Asymmetry in Farm-Retail Price Transmission. Paper presented at AAEA Annual Meetings in Tampa, FL, August 2000. Alexander, Carol and JohnWyeth (1994). Cointegration and Market Integration: An Application to the Indonesia Rice Market. The Journal of Development Studies. London, Frank Cass: 1994. Arndt, Channing; Jensen, Henning, et al. (1999). Marketing Margins and Agricultural Technology In Mozambique. Discussion Paper No. 43. International Food Policy and Research Institute: 1999 http://www.ifpri.cgiar.org/divs/tmd/dp/dp43.htm Barret, C. (1996). Market Analysis Methods: Are Our Enriched Toolkits Well Suited to Enlivened Markets? American Journal of Agricultural Economics. August 1996. Baulch, B. (1997). Transfer Costs, Spatial Arbitrage, and Testing for Food Market Integration. American Journal of Agricultural Economics. May 1997. Cabanilla, L. S. (1997). Transport of Agri-Products: Importance of Government Policies in Agri-Transportation in the Philippines: The Case of Rice and Corn. NEDA/TDI Study Series. Pasig: NEDA, 1997. Center for Research and Communication (CRC) (2000). Global Competitiveness Strategies and Integrated Transportation Action Program Final Report. Manila: Department of
Agriculture (DA), July 2000 Congress of the Philippines (1997). Modern Agriculture: Report and Recommendation of the Congressional Commission on Agricultural Modernization. Manila: 1997 De Los Reyes, J. A. (1994). The Dynamics of Feed Corn Price Formation in the Philippines: A Market Integration Approach. Unpublished M. S. Thesis, UPLB College, Laguna. Dercon, Stefan and Bjorn Van Campenhout (1999). Dynamic Price Adjustment in Spatially Separated Food Markets with Transaction Costs. Oxford: Centre for the Study of African Economies, 1999. http://www.econ.kuleuven.ac.be/ew/admin/Publication/DPS99/a9909.htm. Foundation for Resource Linkage and Development, Inc. (FRLD). (1995 b). The Mungbean Marketing System in Major Production and Demand Areas in the Philippines. Manila: 1995 FRLD (1993). Cutflowers Marketing System in Production and Demand Areas in the Philippines. Manila: 1993 FRLD (2000). Global Competitiveness Strategies for Philippine Agribusiness: Pre-Feasibility Study In the Development of an Agricultural Commodity Futures Exchange. Draft of Final Report (Vol. II- Annexes). Manila, DA, February 29, 2000 FRLD (1994). The Mongo Marketing System in Major Production and Demand Areas in the Philippines. Prepared under ASAP-USAID Project FRLD (1995a). The Potato Marketing System in Major Production and Demand Areas in the Philippines. Manila: 1995 Fulton, M. and Gray, Richard (1999). The Provision of Rail Service: The Impact of Competition. Policy Issue Paper 7. Montana: Montana State University Department of Agriculture Economics and Economics, 1999. http://www.trc.montana.edu/publications/policypapers/pp7.htm

Galvez, M.A. (1998). Optimum Number Size and Location of Livestock Auction Market in Southern Tagalog and Western Visayas. Unpublished M. S. Thesis, UPLB College, Laguna. Goleti, Francesco; Ahmed, Raisuddin et al. (1996). Rice Market Monitoring and Policy Options. Final Donor Report Submitted to the Asian Development Bank. Washington D. C.: International Food Policy and Research Institute, 1996. http://www.ifpri.cgiar.org/themes/crossmp/vietnam/find01.htm Goodwin, Barry and Piggot, Nicholas. (1999). Spatial Market Integration in the Presence of Threshold Effects. Paper Presented at the 1999 AAEA Annual Meeting in Nashville. http://agecon.lib.umn.edu/cgi-bin/detailview.pl?paperid=1387 Intal, Pociano Jr. (1999). Retail Trade and Liberalization: Toward Retailing and Distribution Services for the 21st Century. Paper presented to the National Retailers' Convention, August 1999. Johnson, D. and Wilson, W. (1995). Canadian Rail Subsidies and Continental Barley Flows: A Spatial Analysis. Proceedings of a Symposium Sponsored by NC-179, "Agricultural and Rural Transportation Systems", held in Minneapolis, Minnesota Oct. 6-7, 1995. Proceedings Compiled by Jerry Fruin and Allan Mussell. http://agecon.lib.umn.edu/cgi-bin/pdf_view.pl?paperid=237 Lantican, F. (1992). Grains Marketing. A Report Progress for DANIDA. OIOCI - LBP. Malenab, Victor; Salacup, Salvador; Luis Ranit, Jr. et. al. (1991). Technical Report: The Corn Marketing System: A Repaid Marketing Appraisal in Cagayan Valley. Manila: Confederation of Grainers' Association, Inc. (CONFED), 1991 Manalaysay, Rachel; et. al. (1988). The Corn Marketing System: A Rapid Marketing Appraisal in the Southern Mindanao Region. Manila: 1988 Martinez, Elmer; Shively, Gerald; Masters, William (1998). Testing the Link Between Public Intervention and Food Price Variability: Evidence from Rice Markets in the Philippines. Selected Paper,
AAEA Annual Meeting, Salt Lake City, Utah, USA, August 2-5, 1998. http://agecon.lib.umn.edu/cgi-bin/detailview.pl?paperid=628
Mendoza, Meyra S. and Mark Rosegrant (1995). Pricing Behaviour in Philippine Corn Markets: Implications for Marketing Efficiency. Research Report 101. Washington D.C.: International Food Policy Research Institute, 1995. Policy and Development Foundation, Inc. (PDFI) (2000). Retail Trade and Policy and the Philippine Economy. A Report Prepared for Philiexport. Ravallion, Martin (1986). Testing Market Integration. American Journal of Agricultural Economics. February 1986. Rozelle, S.; Park, A.; Huang, J. and H. Jin (1997). Liberalization and Rural Market Integration in China.
American Journal of Agricultural Economics. May 1997.
Samarendu, E.; Peterson E. W. F.; Smith, D (1998). Price Integration in Mercusor Countries: A Fractional Cointegration Analysis. Selected Paper at the AAEA Annual Meeting in Salt Lake City, Utah, August 1998. http://agecon.lib.umn.edu/cgi-bin/detailview.pl?paperid=698 Sexton, R.; Kling, C. and H. Carman (1991). Market Integration, Efficiency of Arbitrage, and Imperfect Competition: Methodolocy and Application to U. S. Celery. American Journal of Agricultural
Economics. August 1991.

Sikap/ Strive Foundation (2000). Global Competitiveness Strategies for Philippine Agribusiness: Policy Analysis and Advocacy for High Value Agribusiness Products. Final Report. Manila: Sikap/ Strive Foundation, July 22, 2000 Sikap/ Strive Foundation (2000). Global Competitiveness Strategies for Philippine Agribusiness: Strategic Food and Agricultural Commodity Exchanges. Manila: DA, January 2000 Timmer, C. Peter (1986). Getting Prices Right: The Scope and Limits of Agricultural Price Policy. Ithaca: Cornell University Press, 1986 Timmer, C. Peter (1987). The Relationship Between Price Policy and Food Marketing in Journal of Price Competitiveness, J. Leslie and C. Hoisington. Baltimore: The John Hopkins University Press, 1986 Tolentino, Bruce, David, C., Balisacan, A. and Intal, P. (2001). Strategic Actions to Rapidly Ensure Food Security and Rural Growth in the Philippines. Paper Prepared for the Yellow II Report.

APPENDIX
SUMMARIES OF SELECTED PAPERS AND ARTICLES ON
AGRICULTURE DISTRIBUTION AND RELATED TOPICS
Maricar Paz M. Garde

Authors: Elmer Martinez, Gerald Shivley, William Masters
Title: Testing the Link Between Public Intervention and Food Price Variability: Evidence
Rice Markets in the Philippines
Selected Paper at the Annual Meeting of the American Agricultural Economics Association
2-5 August 1998, Salt Lake City, Utah
Source: http://agecon.lib.umn.edu/cgi-bin/detailview.pl?paperid=628
Monthly price and stock data are used to test the influence of Philippine government buffer stock
programs on seasonal and annual variability of producer and consumer rice prices. The period
examined is 1974-1990. NFA stock changes are shown to have had some stabilizing influence on
seasonal and annual price changes, but the magnitude is small and not statistically significant.
Objective:
To examine the relationship between the government buffer-stock programs and the level
and variability of rice prices in the Philippines.
Background of the Study:
Ø Philippine scenario:
- NFA established stocks and controlled imports in an effort to stabilize domestic
prices during the past two decades.
- When prices are falling during the wet-season harvests, NFA buys rice from
producers at a set price. When market supplies are low and prices are high during
the dry season, the NFA releases stocks to licensed outlets to be resold at the
established maximum retail prices.
- Previous studies show that government policies tend to raise rice prices (STAT-USA,
1996).
Ø The paper uses producer and consumer data to test whether government buffer stock
actions stabilized rice prices in the Philippines from 1974-1990.
Methodology:

Ø Estimate two econometric models to test the relationship between price changes and
government stock actions over the period 1974-1990.
- Investigate whether the NFA successfully stabilized seasonal price fluctuations
by estimating regressions for farmgate and retail prices.
- NFA actions might have reduced the sensitivity of prices to harvest size,
stabilizing inter-annual price fluctuations. To test this hypothesis, annual
regressions were utilized.
Results:
Ø Results show that there is a strong seasonal pattern in farmgate and retail prices.
Monthly farmgate prices were negatively correlated with NFA stock changes at a
statistically significant level over the given period.
Ø Monthly changes in retail were not correlated with NFA stock changes at standard
significant levels.
Ø NFA interventions affect monthly price changes in the desired way during the sample
period, but the magnitude of the effect was very small.
Ø Farmgate price changes were negatively correlated with production changes over the
period.
Ø NFA stock change variable is not significantly correlated with price changes.
Ø Adding the NFA stock change variable to the regression has a small impact on the
relationship between production and prices in the harvest period.
Ø NFA intervention seem to lower the sensitivity of price to harvest size by 10%, but the
differences are not statistically significant. This fails to support the hypothesis that post-
harvest NFA stock purchases were enough to stabilize prices inter-annually.
Conclusion:
Ø Arguments that NFA actions altered the seasonal pattern of prices or inter-annual
variability are valid but not compelling.
Ø The results put into doubt the effectiveness of NFA activities, especially with regard to
producer prices.

Authors: Barry Goodwin, Nicholas Piggot
Title: Spatial Market Integration in the Presence of Threshold Effects
Paper presented at the 1999 AAEA Meetings in Nashvile
Source: http://agecon.lib.umn.edu/cgi-bin/detailview.pl?paperid=1387
Threshold cointegration models are used to evaluate spatial price dynamics among the regional
corn and soybean markets in North Carolina. Thresholds, reflecting the influences of transaction
costs, are confirmed and spatial integration is strongly supported. Results indicate that
equilibrating adjustments to market shocks are generally complete in two weeks.
SPATIAL MARKET INTEGRATION IN THE PRESENCE OF THRESHOLD EFFECTS
BY: Barry K. Goodwin and Nicolas Piggot
Paper presented at AAEA meetings in Nashville, 1999
Objective:
To evaluate price linkages among several local corn and soybean markets in North California.
Background:
Ø Tests of market integration consider the extent to which shocks are transmitted among spatially
separate markets.
Ø Market integration is important because its absence may imply riskless profit opportunities for
spatial traders.
Ø Early studies used price correlation and regression-based tests.
Ø Recent studies conclude that the price data typically used to evaluate spatial integration are often
non-stationary.
Ø Regression and correlation tests have also been criticized for the ignorance of transaction costs.
Ø Failure to include transactions costs in the test result to a neutral band within which prices are
not linked to one another.
Methodology:
Ø Utilized model developed by Balke and Fomby (1997).
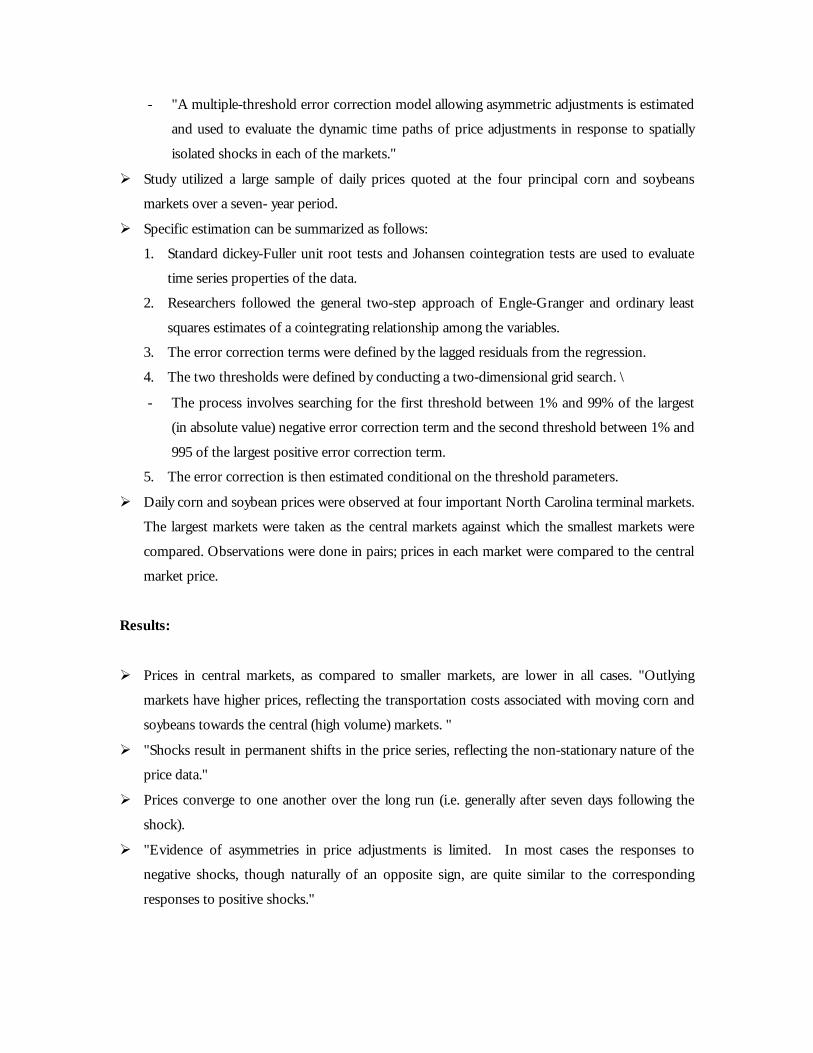
- "A multiple-threshold error correction model allowing asymmetric adjustments is estimated
and used to evaluate the dynamic time paths of price adjustments in response to spatially
isolated shocks in each of the markets."
Ø Study utilized a large sample of daily prices quoted at the four principal corn and soybeans
markets over a seven- year period.
Ø Specific estimation can be summarized as follows:
1. Standard dickey-Fuller unit root tests and Johansen cointegration tests are used to evaluate
time series properties of the data.
2. Researchers followed the general two-step approach of Engle-Granger and ordinary least
squares estimates of a cointegrating relationship among the variables.
3. The error correction terms were defined by the lagged residuals from the regression.
4. The two thresholds were defined by conducting a two-dimensional grid search. \
- The process involves searching for the first threshold between 1% and 99% of the largest
(in absolute value) negative error correction term and the second threshold between 1% and
995 of the largest positive error correction term.
5. The error correction is then estimated conditional on the threshold parameters.
Ø Daily corn and soybean prices were observed at four important North Carolina terminal markets.
The largest markets were taken as the central markets against which the smallest markets were
compared. Observations were done in pairs; prices in each market were compared to the central
market price.
Results:
Ø Prices in central markets, as compared to smaller markets, are lower in all cases. "Outlying
markets have higher prices, reflecting the transportation costs associated with moving corn and
soybeans towards the central (high volume) markets. "
Ø "Shocks result in permanent shifts in the price series, reflecting the non-stationary nature of the
price data."
Ø Prices converge to one another over the long run (i.e. generally after seven days following the
shock).
Ø "Evidence of asymmetries in price adjustments is limited. In most cases the responses to
negative shocks, though naturally of an opposite sign, are quite similar to the corresponding
responses to positive shocks."

Conclusion:
Ø Results confirm that the observed markets are integrated.
Ø Analysis confirms the significance of threshold effects and suggests that their presence may
significantly influence spatial price linkages.
Authors: Samarendu; E. W. F. Peterson, Darnell B. Smith
Title: Price Integration in MERCOSUR Countries: A Fractional Cointegration Analysis
Selected Paper at the Annual Meeting of the American Agricultural Economics Association
2-5 August 1998, Salt Lake City, Utah
Source: http://agecon.lib.umn.edu/cgi-bin/detailview.pl?paperid=698
This paper examines price integration in the MERCOSUR countries of Argentina and Brazil after
the creation of this regional economic agreement using a fractional cointegration analysis. The
results suggest that Argentine wheat and corn prices are fully cointegrated with the
corresponding world prices, whereas Brazilian wheat prices are not cointegrated with the world
price. These results support the idea that, for these markets, MERCOSUR is operating more like
a free trade area than a customs union with harmonized trade policies. In case of soybean,
neither soybean price is integrated with the world price, implying that both countries are
pursuing similar export strategies that have the effect of isolating these markets from the world
markets. Within MERCOSUR, Argentine and Brazilian wheat prices are fractionally
cointegrated, suggesting that the LOP holds within MERCOSUR although the restoration of
equilibria is slower than in the case of the fully cointegrated series. Similarly, Argentine and
Brazilian soybean prices are fully cointegrated, suggesting a quick restoration of the equilibrium
relationships. Based on the results, it appears that MERCOSUR has led to tightly agricultural
markets in Brazil and Argentina while the relationships between the markets in the two countries
and the corresponding world markets are subject to particular national policy interventions.
Objectives:
To examine the Law of One Price (LOP) in MERCOSUR countries, particularly Argentina
and Brazil, for major crops such as wheat, corn, and soybeans to test the hypothesis that the

LOP is more likely to hold during the post-unilateral reform period. The LOP will also be
examined between MERCOSUR and non-MERCOSUR countries.
Background:
Ø Most Latin American countries implemented unilateral reforms after the 1980s debt
crisis, often at the insistence of the IMF and the World Bank.
Ø Market oriented policies and trade liberalization were included in the reforms.
Ø Argentina and Brazil along with Uruguay and Paraguay formed a new organization
MERCOSUR with the signing of the treaty of Asuncion in 1991.
Ø "The effects of policy reforms by trade block members on the Law of One Price (LOP)
is an important and relevant market efficiency issue (Bierlen et al.). "
Methodology:
Ø This study uses the fractional cointegration analysis approach introduced by Granger and
Joeyux to test the LOP.
Ø "This approach combines the concept of integration introduced by Engle and Granger
and fractional differencing introduced by Hosking. Both cointegration and fractional
cointegration test for long-run relationships between economic variables or the mean
reverting behavior of equilibrium errors with few restrictions on the short-run dynamics,
but they differ in the manner the hypotheses are tested."
Ø "Fractional cointegration analysis allows the equilibrium errors to follow a fractionally
cointegrated process, such that the order of cointegration is a fraction between 0 and 1.
Ø "The advantage of fractional cointegration relative to standard cointegration methods is
that it is able to discern long-run price behavior despite the substantial short-run
deviations from the equilibrium.
Ø The study used monthly price data for the period of January 1990 to July 1996 to test the
price cointegration hypothesis through fractional cointegration.
Ø "Representative world prices for wheat, corn, and soybeans include the FOB Gulf price
for the hard red winter, the FOB Gulf price for yellow corn, and the CIF Rotterdam
price for soybeans respectively.

Results:
Ø Argentine wheat and corn prices are fully cointegrated with corresponding world
representative prices.
Ø No cointegration was found between Argentine soybean price and Rotterdam soybean
prices.
Ø "Argentina is a major exporter of wheat and corn in the world market and it is likely that
Argentina and Gulf prices respond to each other to restore equilibrium."
Ø Brazilian wheat and soybean prices are found to be not cointegrated or even fractionally
cointegrated with the corresponding world representative prices.
Ø Results indicate long-run relationships between Argentine and Brazilian prices. As a
member of MERCOSUR, internal tariffs were reduced every six months starting March
1991 and were finally eliminated by January 1995. The absence of internal tariffs most
likely results to long run relationships between prices in these two countries.
Ø Argentine and Brazilian wheat markets are fractionally cointegrated, and soybean prices
are fully cointegrated.
Ø The slow response of wheat prices in Brazil may be the result of stickiness in the
Brazilian marketing channel, where traders or importers do not allow domestic prices to
change immediately but eventually respond to it over a longer period.
Ø In the case of soybeans, where both Argentina and Brazil are exporters, without any
internal tariffs any discrepancy between prices will prompt traders to act quickly and
equilibrium will be restored quickly.
Authors: Murray Fulton; Richard S. Gray
Title: THE PROVISION OF RAIL SERVICE: THE IMPACT OF COMPETITION
Policy Issues Paper 7
Montana State University, Department of Agricultural Economics and Economics, Trade
Research Center, P.O. Box 172920, Bozeman, MT 59717-2920
Source: http://www.trc.montana.edu/publications/policypapers/pp7.htm

Grain transportation is one of the most important economic issues for grain producers in
the Northern Plains. The reliance on export markets and the long distances to port position
means that transportation costs have a significant effect on the price received by farmers. In the
prairie region of Canada, rail transportation is undergoing a major transformation that will
affect the competitive positions of agriculture in both the United States and Canada and influence
the direction of grain flows between the two countries. Rail rates are no longer legislated
although a cap is still in place), restrictions on branch line abandonment have been lifted, and
further deregulation of price and car allocation is being considered. Some parties, including the
railways, argue that a completely deregulated system, similar to the U.S. system, is the only way
to achieve transportation efficiencies. Other groups, supporting the status quo, argue that the
regulation of rates is essential to control the monopoly power of the railways.
There has been very little discussion of other policy options, with the exception of a
limited discussion of nationalized railbeds. The U.S. experience provides a stark view of the likely
outcome of deregulation. When railways are not faced with competition from other railways or
from other forms of transportation such as barges, the evidence suggests railways will price
freight services at or near truck competitive rates. Freight rates in Montana, where no effective
rail and/or barge competition exists, are approximately twice those at Kansas City and
Denver/Commerce City, where such competition exists. The current cost-based regulated rates in
Western Canada are similar to those at Kansas City and Denver/Commerce City. Given similar
distances to port and the existence of only two railways (and no likelihood of new entrants),
deregulation in Western Canada is likely to result in freight rates closer to those in Montana than
to the current regulated level. The increase in freight costs will result in transfers from producers
to the railways, distort production incentives, and create losses elsewhere in the economy.
While maintenance of a regulated freight rate structure would address the freight rate
issue, other problems would result. The lack of price signals reduces incentives for industry
participants to perform. Branch lines are less likely to be maintained in a regulated environment
because railways may be unable to charge the extra amount necessary to make them viable.
Railways may also disrupt the system—as a form of bargaining—to create pressure for
deregulation.
This report explores the option of the government encouraging entry into rail service
provision. Just as telecommunication companies are required to allow competitors to use their
phone lines, existing railways could be required to make their track and switching equipment

available to rail operators who wish to run train service on a line, on the condition that the
access price covers the infrastructure cost.
The paper examines the case of the British railway system where the ownership of the
track has been separated from the operation of the rail equipment and the provision of service,
and explores the applicability of this model to grain transportation on the Great Plains. In
Britain, ownership of the track rests with a company called Railtrack (although Railtrack was
government-owned, it has been privatized). Railtrack leases access to thirty train operators for
fees that are regulated by the Office of the Rail Regulator to cover maintenance costs and provide
a return on investment. The thirty rail operators then compete to provide service to customers.
This model and others similar to it need to be developed and articulated before they can be
considered in the public policy forum. Nevertheless, given the importance of rail transportation
to the grain industry in the Northern Plains, it is imperative that options such as these be
investigated to address the very thorny issue of freight rate and entry regulation.
Author: Demcey Johson and William Wilson
Title: Canadian Rail Subsidies and Continental Barley Flows: A Spatial Analysis
Proceedings of a Symposium Sponsored by NC-179, "Agricultural and Rural
Transportation Systems" held in Minneapolis, Minnesota Oct. 6-7, 1995. Proceedings
compiled by Jerry Fruin and Allan Mussel.
Source: http://agecon.lib.umn.edu/cgi-bin/pdf_view.pl?paperid=237
Rail subsidies provided under the Western Grain Transportation Act (WGTA) have been
controversial within Canada and an issue in recent trade disputes with the United States. A
detailed spatial equilibrium model of the North American barley market is used to assess the
effects of WGTA subsidies. Simulation results indicate that elimination of these subsidies would
induce a larger flow of barley from Canada to the United States.
Subsidies provided by the Canadian Government to rail shipments to Vancouver (for
offshore exports) and Thunder Bay (for eastern destinations) raise producer prices in the Prairie
Provinces. The issue of rail subsidies has been controversial since changes in the system would
affect producer prices and the flow of barley trade in North America. A mathematical
programming model was utilized to identify optimal trade flows under a liberalized barley trade

regime in Canada. The study considered two Canadian transportation regimes: the current rail
rate structure (base case) and compensatory rates. Barley was allowed to be shipped by truck to
shipping points in the US under each regime.
US barley imports from Canada reach about 1.6 mmt in the current rate structure. The
results show that under the compensatory rate regime, average producer decrease and the
equilibrium trade volume increases to 3.0 mmt. One significant change is higher Canadian barley
shipments to the California feed market.
If the Canadian Government stops the transport subsidies, there will be higher shipper
costs, which in turn will result to lower prices in the producing regions. Barley flows to the US
would increase, a big amount would comprise of shipment by truck to US shipping points for rail
shipment beyond. There will indeed be significant changes brought about by any reform in the
current transport regime. Trade flows, prices, and even transportation rates would be affected.
Rail operators would have to come up with competitive rates since producers might look for other
transportation modes when the subsidies are eliminated.
Author: Channing Arndt, Henning Tarp Jensen, Sherman Robinson, and Finn Tarp
Title: Technology In Mozambique
Discussion Paper No. 43, International Food Policy Research Institute, July 1999
Source: http://www.ifpri.cgiar.org/divs/tmd/dp/dp43.htm
Improvements in agricultural productivity and reductions in marketing costs in Mozambique are
analysed using a computable general equilibrium (CGE) model. The model incorporates detailed
marketing margins and separates household demand for marketed and home-produced goods.
Simulations improving agricultural technology and lowering marketing margins yield gains
across the economy, but with differential impacts on factor returns. A combined scenario reveals
significant synergy effects, as welfare gains exceed the sum of gains from the individual
scenarios. Factor returns increase in roughly equal proportions, an attractive feature when
assessing the political feasibility of policy initiatives.
The findings of the study highlight the large potential gains Mozambique could obtain
out of increasing agricultural productivity. However, doing so when marketing costs are high

leads to significant fall in prices. The study says that the decline in prices transmits most of the
gains in factor income to non-agricultural sectors and prices of production. Households in rural
areas benefit though out of greater food availability and lower producer prices, which decrease
the cost of home-consumed goods.
Meanwhile, decreasing marketing cost would bring the gap closer between producer and
purchaser prices in all markets. Agriculture benefits relatively more because of its higher
marketing margins. Lower marketing costs also boost exports and imports. The study reveals
that lower marketing margins yield higher returns to producers supplying to export markets. At
the same time, it also leads to lower domestic prices of imports.
The study reports that combined policies of increasing agricultural productivity and
decreasing marketing costs are beneficial and appealing. It should improve the welfare of poor
rural households without causing too much political strain. This paper is indeed helpful for
policy purposes.
Note: Paragraphs in italics were downloaded from the Internet. Please refer to the listed website.


