Literature Review of Data on the Incremental Costs to ... · Literature Review of Data on the...
45
PNNL-17502 Literature Review of Data on the Incremental Costs to Design and Build Low-Energy Buildings W.D. Hunt May 2008 Prepared for U.S. Department of Energy Building Technology Program under Contract DE-AC05-76RL01830
Transcript of Literature Review of Data on the Incremental Costs to ... · Literature Review of Data on the...

PNNL-17502
Literature Review of Data on the Incremental Costs to Design and Build Low-Energy Buildings W.D. Hunt May 2008 Prepared for U.S. Department of Energy Building Technology Program under Contract DE-AC05-76RL01830
DISCLAIMER This report was prepared as an account of work sponsored by an agency of the United States Government. Neither the United States Government nor any agency thereof, nor Battelle Memorial Institute, nor any of their employees, makes any warranty, express or implied, or assumes any legal liability or responsibility for the accuracy, completeness, or usefulness of any information, apparatus, product, or process disclosed, or represents that its use would not infringe privately owned rights. Reference herein to any specific commercial product, process, or service by trade name, trademark, manufacturer, or otherwise does not necessarily constitute or imply its endorsement, recommendation, or favoring by the United States Government or any agency thereof, or Battelle Memorial Institute. The views and opinions of authors expressed herein do not necessarily state or reflect those of the United States Government or any agency thereof.
PACIFIC NORTHWEST NATIONAL LABORATORY operated by BATTELLE
for the UNITED STATES DEPARTMENT OF ENERGY
under Contract DE-AC05-76RL01830
Printed in the United States of America
Available to DOE and DOE contractors from the Office of Science and Technical Information
P.O.Box 62, Oak Ridge, TN 37831-0062; ph: (865)-8401
fax: (865) 576-5728 email: [email protected]
Available to the public from the National Technical Information Service U.S. Department of Commerce, 5285 Port Royal Rd., Springfield, VA 22161
ph: (800) 553-6847 fax: (703) 605-6900
email: [email protected] online ordering: http://www.ntis.gov/ordering.htm
This document was printed on recycled paper. (9/2003)

Literature Review of Data on the Incremental Costs to Design and Build Low-Energy Buildings W.D. Hunt May 2008 Prepared for the U.S. Department of Energy Building Technology Program under Contract DE-AC05-76RL01830
Pacific Northwest National Laboratory Richland, Washington 99352

iii
Summary The purpose of this report is to summarize findings from a literature review into the incremental costs associated with low-energy buildings. The goal of this work is to help establish as firm an analytical foundation as possible for the Building Technologies Program’s (BT’s) cost-effective net-zero energy goal in the year 2025. This literature review was conducted between July 2007 and January 2008, and intended to focus on identifying the incremental cost associated with the design and construction of low-energy buildings. For purposes of this analysis, a “low-energy building” is a building that achieves 30% to 50% energy savings when compared to a building built to ASHRAE Standard 90.1-2004. A summary of the findings from these document reviews is presented in the body of the report, with more detailed summaries presented in the appendices. Key findings of this literature review are as follows:
1. Objectively-developed and verifiable data on the cost premium for low-energy (high-efficiency) buildings are very limited. Most of the literature focused on green or sustainable buildings, not on low-energy buildings.
2. In cases where energy efficiency cost data were available, the cost premiums ranged from
1% to 7%. In most cases, the cost premium was less than 4%.
3. Technology solutions are available right now to achieve savings on the order of 30% and more over ASHRAE Standard 90.1-2004; however, cost-effectiveness of these technology solutions is often not addressed.
4. Independent surveys administered to assess the perceptions of building owners and
designers regarding the costs to build and operate green/energy-efficient buildings, and the willingness of owners/developers to invest in green/energy-efficient buildings, reveal some interesting common threads.
i. There is a perception that energy-efficient/green buildings cost
significantly more to design (starting at a 5% premium) and represent a key barrier with decision makers
ii. There seems to be a potential willingness (as implied or measured
through survey responses) to build more energy-efficient buildings for cost premiums below 5%.
PNNL staff recommend that efforts be continued to seek and obtain cost data via a variety of potential sources including the Request for Information issued in the Federal Business Opportunities (FedBizOpps.gov), as well as selectively pursuing cost data for known low-energy buildings.

iv
Contents
Summary ........................................................................................................................................ iii Objective and Background .............................................................................................................. 1 Summary Findings and Recommendations ..................................................................................... 2 Specific Comments.......................................................................................................................... 4
Group 1 Costs of achieving low-energy performance................................................................. 4 Group 2 Commercial buildings that have or can achieve low-energy......................................... 5 Group 3 Market perceptions........................................................................................................ 6
APPENDIX A. Cost Premium Literature Review Summary .......................................................... 9 APPENDIX B. Summary Paper of the NAVFAC Energy Policy Act of 2005 Studies by Steven Winter Associates (2006) .............................................................................................................. 19 APPENDIX C. Estimated Incremental Costs and Cost Effectiveness for 50,000 ft2 Warehouse . 22 APPENDIX D. Summary Paper of the Steven Winter Associates, Inc. Report GSA LEED Cost Study (2004) .................................................................................................................................. 24 APPENDIX E. Summary Paper of the Building Design+Construction Green Buildings Research White Paper (October 2007).......................................................................................................... 28 APPENDIX F. Summary Paper of the McGraw Hill Construction SmartMarket Report on Green Buildings in Education (2007) ...................................................................................................... 32 APPENDIX G. Summary Paper of the Davis Langdon (Morris and Matthiessen) Report Cost of Green Revisited: Reexamining the Feasibility and Cost Impact of Sustainable Design in the Light of Increased Market Adoption (July 2007).................................................................................... 35 APPENDIX H. Summary Paper of the Johnson Controls Energy Efficiency Indicator Research Report (2007) ................................................................................................................................ 38
v
Tables
Table 1. Summary of Results from the NREL Building Design and Performance Evaluations ..... 6 Table A- 1. Literature Review Summaries ................................................................................... 10 Table A- 2. Series Document Review Summaries ....................................................................... 15 Table C- 1. Estimated Percentage Cost Increases for Energy-Efficient Warehouses based on 50,000 sf Prototype used for AEDG Energy Simulations ............................................................. 22 Table C- 2. Estimated Simple Payback for Energy-Efficient Warehouses based on ................... 22

vi
Abbreviations and Acronyms
AEDG Advanced Energy Design Guide ASHRAE American Society of Heating, Refrigerating and Air-Conditioning Engineers BEQ bachelor’s enlisted quarters BT Building Technologies Program CEFPI Council of Educational Facility Planners International DOE Department of Energy EEM energy efficiency measures GSA General Services Administration IFMA International Facility Management Association LEED Leadership in Energy and Environmental Design NAVFAC U.S. Naval Facilities Engineering Command NBI New Buildings Institute NREL National Renewable Energy Laboratory RFI request for information ROI return on investment TSD technical support document URLs uniform resource locator

1
Objective and Background The purpose of this report is to summarize findings from a literature review into the incremental costs associated with low-energy buildings. The goal of this work is to help establish as firm an analytical foundation as possible for the Building Technologies Program’s (BT’s) cost-effective net-zero energy goal in the year 2025. The balance of this report is divided into three sections: Summary Findings and Recommendations from the latest round of reviews; Specific Comments about the reviewed literature; and 8 appendices, which include summaries of the reports and articles reviewed, as well as a spreadsheet for characterizing this continuing inventory and capturing the URLs for the reports reviewed. This literature review was conducted between July 2007 and January 2008, and intended to focus on identifying the incremental cost associated with the design and construction of low-energy buildings. For purposes of this analysis, a “low-energy building” is a building that achieves 30% to 50% energy savings when compared to a building built to ASHRAE Standard 90.1-2004.1 Because of the elusive nature of cost data, the literature review was expanded to also include a variety of information sources addressing the feasibility of attaining low-energy performance, market perceptions on the cost of going green/low-energy, and other trends of interest to this activity.
1 The use of the term “low-energy building” is consistent with the terminology used in Figure 2-14, Hierarchy of Building Performance Levels, in BT’s 2007 – 2012 Multi-Year Program Plan: http://www.eere.energy.gov/buildings/about/pdfs/mypp_2007/mypreport_ch2.pdf

2
Summary Findings and Recommendations A summary of the findings from these document reviews is presented below. Appendix A contains tabular summaries of the documents reviewed, with published papers, technical reports, and articles, briefly summarized for key findings. More detailed individual document summaries are provided in Appendices B through H. Key findings:
1. Objectively-developed and verifiable data on the cost premium for low-energy (high-efficiency) buildings are very limited. Most of the literature focused on green or sustainable buildings, not low-energy buildings.
2. In cases where energy efficiency cost data were available, the cost premiums ranged from
1% to 7%. In most cases, the cost premium was less than 4%. A notable exception is small warehouses in cooler regions (climate zones 5 through 7), which carried estimated cost premiums of between 5.9% and 7%.
3. Technology solutions are available right now to achieve savings on the order of 30% and
more over ASHRAE Standard 90.1-2004; however, cost-effectiveness of these technology solutions is often not addressed.
4. Independent surveys administered to assess the perceptions of building owners and
designers regarding the costs to build and operate green/energy-efficient buildings, and the willingness of owners/developers to invest in green/energy-efficient buildings, reveal some interesting common threads.
a. The perception that energy-efficient /green buildings cost significantly more to
design (starting at a 5% premium) and represent a key barrier with decision makers
b. There seems to be a potential willingness (as implied or measured through survey
responses) to build more energy-efficient buildings for cost premiums below 5%. Recommendations:
1. Continue with the planned activity to obtain cost data via the Request for Information (RFI) issued in Federal Business Opportunities (FedBizOpps.gov), and a subsequent workshop to address findings, identify data needs, and determine how to present and promote results to the national building owner and developer market. The RFI was posted in FedBizOpps on March 3, 2008.2
2. Selectively pursue cost data for known low-energy buildings as opportunities are
identified. Examples might include the National Renewable Energy Laboratory (NREL)
2 http://e-center.doe.gov/doebiz.nsf/ d76fbc294818822885256d98006c63b6/50440445fe8c0ccd85257401004e0476?OpenDocument

3
Science and Technology Facility, the Federal Courthouse Building in San Francisco, and the Morse Courthouse in Portland, Oregon.
3. Continue to review literature as new reports and articles addressing low-energy and
sustainable buildings become available. Also, expand the review to address related subjects such as green building valuation and operational costs of low-energy and/or sustainable buildings.

4
Specific Comments The results from this round of reviews are separated into three groups: Group 1 for papers/articles that address the costs of achieving low-energy performance in commercial buildings; Group 2 for those with energy but not cost data on low-energy performance; and, Group 3 for those addressing market perceptions on the costs and performances of low-energy/green buildings. Group 1 Costs of achieving low-energy performance The documents summarized in this section provide data on the estimated cost increases attributed to incorporating energy-efficiency technologies.
- The NAVFAC Energy Policy Act of 2005 studies by Steven Winter Associates looked specifically at the estimated costs for typical new buildings at Navy installations to comply with the requirement to perform 30% better than ASHRAE Standard 90.1-1999. The three separate studies were completed and addressed the following: a 48,500 sf bachelor’s enlisted quarters; a 14,800 sf academic building and a 5,900 sf headquarters building; and a 37,461 sf multi-use (warehouse, machine shop, and offices) mission support facility. In each case, energy savings of more than 30% were identified. Corresponding increases in building construction costs were 2.22%, 1.07%, and 3.19%, respectively. (Soft costs increased by the same amount because the Navy design contract amounts are a percentage of the estimated construction cost.) Note that these studies have not been made publically available. A summary of the Steven Winter Associates NAVFAC studies is available in Appendix B, Summary Paper of the NAVFAC Energy Policy Act of 2005 Studies by Steven Winter Associates (2006).
- A series of four technical support documents (TSDs) describing the process and
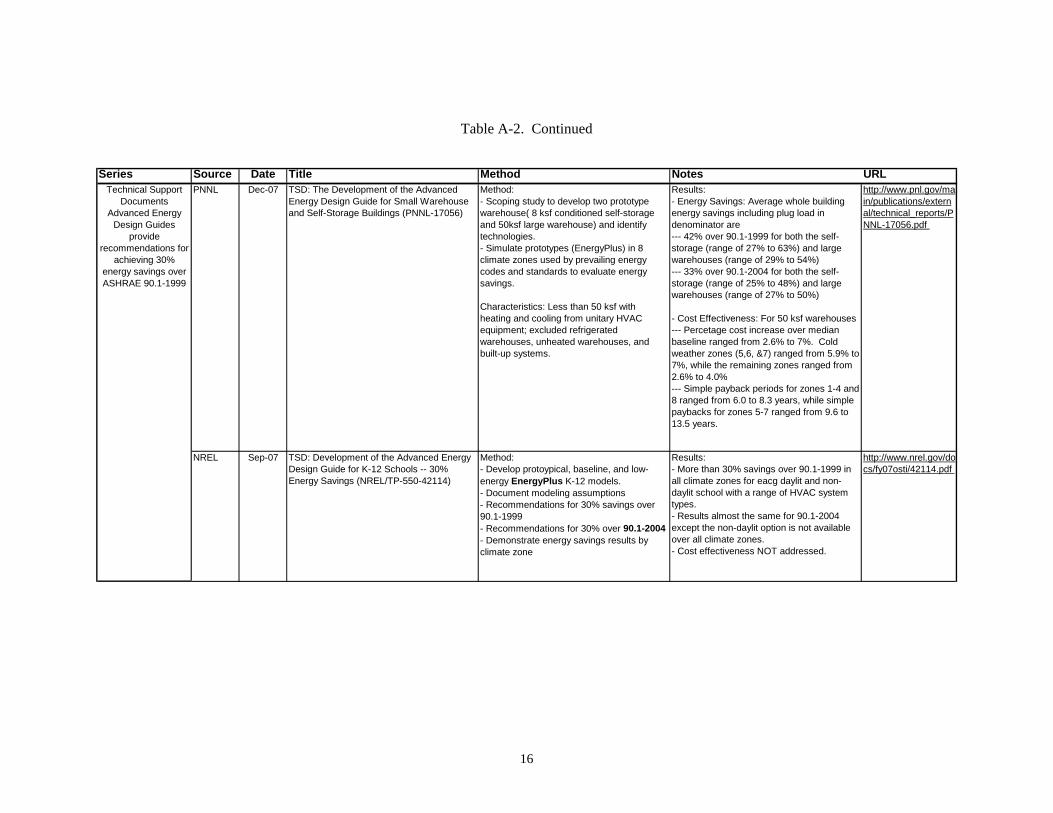
methodology for developing the Advanced Energy Design Guides (AEDGs) were issued in 2006 and 2007. Each AEDG developed prescriptive packages of recommendations by climate zone to achieve 30% or more energy savings over levels achieved by complying with ASHRAE Standard 90.1-1999. The TSD for small warehouses and self-storage buildings developed efficiency recommendations for each of the eight climate zones, which resulted in simulated average energy savings over all the climate zones of 42% over ASHRAE Standard 90.1-1999, and 33% over ASHRAE Standard 90.1-2004. The TSD for small warehouses and self-storage buildings was the only TSD that included explicit (projected) estimates for percent construction cost increase and simple payback period. These estimates, developed only for 50,000 sf warehouses, are summarized in Appendix C, Estimated Incremental Costs and Cost Effectiveness for 50,000 ft2 Warehouse. The estimated percentage cost increase varied by region. Cost increases for warehouses in the regions with hot/warm weather (climate zones 1 through 4) were in the range of 3.5% to 4%, with simple payback periods ranging from 6.0 to 8.3 years. Warehouses in the cooler regions (climate zones 5 through 7) realized estimated cost increases from 5.9% to 7.0%, with simple payback periods ranging from 9.6 to 13.5 years. Interestingly, climate zone 8 (inclusive of Fairbanks, Nome, and the North Slope) showed only a 2.6% cost increase and a resulting simple payback period of 6.9 years. An abbreviated summary of each of the TSDs is included in Appendix A, Cost Premium Literature Review, Table A.2 – Series Documents Review Summaries. Summary results of the three remaining TSDs are presented in the Group 2 section below.
5
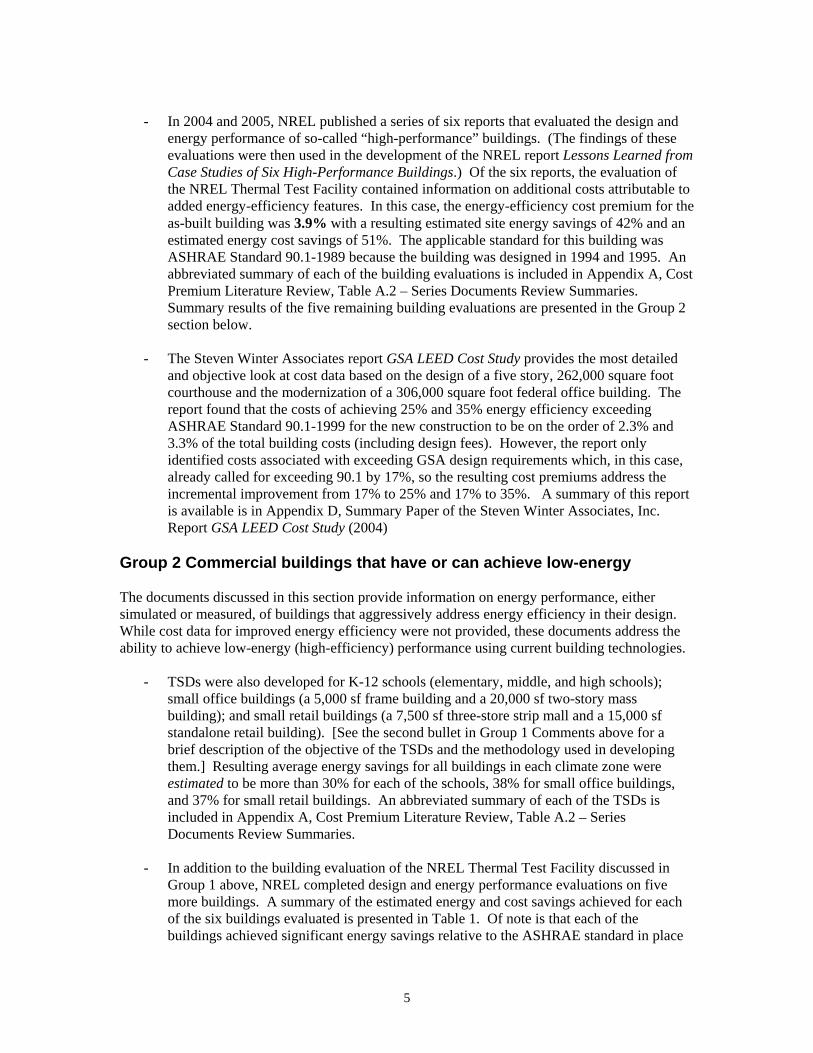
- In 2004 and 2005, NREL published a series of six reports that evaluated the design and
energy performance of so-called “high-performance” buildings. (The findings of these evaluations were then used in the development of the NREL report Lessons Learned from Case Studies of Six High-Performance Buildings.) Of the six reports, the evaluation of the NREL Thermal Test Facility contained information on additional costs attributable to added energy-efficiency features. In this case, the energy-efficiency cost premium for the as-built building was 3.9% with a resulting estimated site energy savings of 42% and an estimated energy cost savings of 51%. The applicable standard for this building was ASHRAE Standard 90.1-1989 because the building was designed in 1994 and 1995. An abbreviated summary of each of the building evaluations is included in Appendix A, Cost Premium Literature Review, Table A.2 – Series Documents Review Summaries. Summary results of the five remaining building evaluations are presented in the Group 2 section below.
- The Steven Winter Associates report GSA LEED Cost Study provides the most detailed
and objective look at cost data based on the design of a five story, 262,000 square foot courthouse and the modernization of a 306,000 square foot federal office building. The report found that the costs of achieving 25% and 35% energy efficiency exceeding ASHRAE Standard 90.1-1999 for the new construction to be on the order of 2.3% and 3.3% of the total building costs (including design fees). However, the report only identified costs associated with exceeding GSA design requirements which, in this case, already called for exceeding 90.1 by 17%, so the resulting cost premiums address the incremental improvement from 17% to 25% and 17% to 35%. A summary of this report is available is in Appendix D, Summary Paper of the Steven Winter Associates, Inc. Report GSA LEED Cost Study (2004)
Group 2 Commercial buildings that have or can achieve low-energy The documents discussed in this section provide information on energy performance, either simulated or measured, of buildings that aggressively address energy efficiency in their design. While cost data for improved energy efficiency were not provided, these documents address the ability to achieve low-energy (high-efficiency) performance using current building technologies.
- TSDs were also developed for K-12 schools (elementary, middle, and high schools); small office buildings (a 5,000 sf frame building and a 20,000 sf two-story mass building); and small retail buildings (a 7,500 sf three-store strip mall and a 15,000 sf standalone retail building). [See the second bullet in Group 1 Comments above for a brief description of the objective of the TSDs and the methodology used in developing them.] Resulting average energy savings for all buildings in each climate zone were estimated to be more than 30% for each of the schools, 38% for small office buildings, and 37% for small retail buildings. An abbreviated summary of each of the TSDs is included in Appendix A, Cost Premium Literature Review, Table A.2 – Series Documents Review Summaries.
- In addition to the building evaluation of the NREL Thermal Test Facility discussed in
Group 1 above, NREL completed design and energy performance evaluations on five more buildings. A summary of the estimated energy and cost savings achieved for each of the six buildings evaluated is presented in Table 1. Of note is that each of the buildings achieved significant energy savings relative to the ASHRAE standard in place

6
at the time of the design.3 While the energy-efficiency cost data are not provided in the reports for five of the six buildings, these case studies do help provide examples of what can be achieved with available technologies and design skills. An abbreviated summary of each of the building evaluations is included in Appendix A, Cost Premium Literature Review, Table A.2 – Series Documents Review Summaries.
Table 1. Summary of Results from the NREL Building Design and Performance Evaluations
Building Designation Metric
Adam Joseph Lewis Center at Oberlin College, OH
Zion National Park Visitors Center, UT
PA Dept. of Environmental Protection in Cambria, PA
Chesapeake Bay Foundation in MD
NREL Thermal Test Facility in Golden, CO
Big Horn Home Improvement Center in CO
ASHRAE Standard 90.1 Version Used
2001 10 CFR 435 based on
90.1-1989
2001 2001 10 CFR 435 based on
90.1-1989
2001
Estimated Site Energy Savings, %
47% 62% 40% 25% 42% 35%
Estimated Energy Cost Savings
35% 67% 43% 12% 51% 53%
Group 3 Market perceptions The documents summarized in this section address a variety of perceptions and issues of interest with regard to low-energy/green buildings costs and/or performance.
- The New Buildings Institute (NBI) recently issued the report Energy Performance of LEED for New Construction Buildings. This report provided some interesting insights into the energy performance of 121 LEED New Construction buildings across the country. One conclusion was that LEED buildings are on average or “typically” between 25 and 30% more efficient than non-LEED buildings. Further, higher LEED ratings resulted, on average, in greater energy savings. A key study finding was that the energy outcome for individual projects is highly variable. An abbreviated summary of this report is included in Appendix A, Cost Premium Literature Review, Table A.1 – Literature Review Summaries.
- The Building Design+Construction “Green Buildings Research White Paper” (2007)
annually reports on the results of 12 different surveys of building owners, facility directors, end users, and designers. Note that each survey targeted a different group or building sector. The objective of this annual assessment is to identify positions, perceptions, and trends with regard to green building design and construction. Two key trends seemed to emerge across the various surveyed groups in the 2500 responses:
o The majority of survey respondents felt that sustainable design features would
add significantly to the initial construction costs, and that this is the primary barrier to green construction.
3 Computer models were used to compare what the buildings actually used to what they would have used had they been built to the minimum standards of the energy.

7
o In many of the surveyed groups, about one-third to one-half of the respondents indicated a willingness to pay a cost premium of between 3 and 5%.
A summary of the white paper is available in Appendix E, Summary Paper of the Building Design+Construction Report Green Buildings Research White Paper (October 2007).
- The Green Building SmartMarket Report from McGraw-Hill Construction on the education the construction sector provides a brief summary of construction trends in the educational sector. Two surveys, one of school officials owning and operating LEED buildings, and a second survey of officials at non-LEED certified educational facilities, looked to identify the drivers for officials deciding whether or not to build green. It was found that lower operating costs are believed to offer the best justification to build green, while added first costs (design and construction) represent the most common barrier. A summary of this report is available in Appendix F, Summary Paper of the SmartMarket Report on Green Buildings in Education (2007).
- The Davis Langdon report Cost of Green Revisited: Reexamining the Feasibility and Cost
Impact of Sustainable Design in Light of Increased Market Adoption (2007) is an objective comparison of costs between LEED-seeking and non-LEED-seeking buildings. Data are recognized by the authors as limited and building uses (types) assessed were academic classroom buildings, laboratory buildings, libraries, community centers, and ambulatory care facilities. Overall finding is that the costs of seeking LEED certification are in the same cost range as buildings not seeking LEED certification. Key statement in the report: “Most notable, few projects attempt to reach higher levels of energy reduction beyond what is required by local ordinances, or beyond what can be achieved with a minimum cost impact.” A summary of the Davis Langdon report is available in Appendix G, Summary Paper of the Davis Langdon (Morris and Matthiessen) Report Cost of Green Revisited: Reexamining the Feasibility and Cost Impact of Sustainable Design in the Light of Increased Market Adoption (July 2007).
- Johnson Controls’ report Energy Efficiency Indicator (2007) summarizes the results of a
survey administered to 1,250 International Facility Management Association members. The report does not include a copy of the actual survey used and seems to be more focused on retrofits and repairs than on new construction. Of interest is the “finding” that the average tolerance for return on investment (ROI) in energy-efficiency projects is 4.3 years; however, another interpretation of the results might be that nearly half of the respondents have a ROI tolerance of less than 3 years. A summary of this report is available in Appendix H, Summary Paper of the Johnson Controls Energy Efficiency Indicator Research Report (2007)

8
APPENDIX A
Cost Premium Literature Review Summary
9
APPENDIX A. Cost Premium Literature Review Summary This appendix contains tabular summaries of the documents reviewed to date in support of the efforts to identify the incremental cost to design and build low-energy buildings. Published papers, technical reports, and articles are briefly summarized for key findings. When available, a URL is also included.

10
Table A- 1. Literature Review Summaries
SourceYear Published Title
Hard Costs (% +/-)
Soft Costs (% +/-)
Efficiency Improve-ment (%) Assessment Approach Notes Links
New Buildings Institute 2008 Energy Performance of LEED for New Construction Buildings
Reviewed energy performance of 121 LEED NC buildings.
Compared actual performance against modeled buildings.
Findings of interest:- LEED buildings achieve significant enerty savings, typically being 25-30% more energy efficient than non-LEED buildings.- Energy savings increase with LEED achievement level.- Energy models of buildings were on average good predictors of performance, but there is wide scatter among the individual results.
http://www.newbuildings.org/downloads/Energy_Performance_of_LEED-NC_Buildings-Final_3-4-08b.pdf
Building Design+Construction
2007 Green Buildings Research White Paper
NA. Survey of
subscibers representing US building community "addressing
opinions, perspectives
, and actions
relative to sustainable design and
green building."
NA NASubscibers to publications targeting design, construction, and operations were surveyed: general A&Es, contractors, and owners; real estate professionals; healthcare; higher education; K-12; hotels; restaurants; and residential.
Surveys results were not aggregated as surveys varied by sector. However, the following findings/perceptions generally occurred across nearly all the sectors:- First cost was identified as a barrier to green construction. - In many of the surveyed groups, about one-third to one-half of the respondents indicated a willingness to pay a cost premium of 3-5%.- Most frequently adopted energy efficiency measures appear to be daylighting, energy management systems, and automated lighting controls, with commissioning and modeling also being applied.
http://www.bdcnetwork.com/contents/pdfs/BDC_07_WhitePaper.pdf?nid=2073
World Business Council for Sustainable Development
2007 Energy Efficiency in Buildings: Business realities and opportunities
Literature review addressed variety of issues in the buildings sector to reach conclusions. Issues addressed include energy growth rates, fragmentation of the energy sector, barriers within the industry, policy changes and framework, financial information and mechanisms, and changing behavior.
Document not included in summary report. Cited Kats (2003) and Davis Langdon (2007) for estimated increased in costs.
Study was the developed by a consortium of companies in the building industry.
This report was the first year summary report for a 3 year effort. Track for BT as WBCSD moves f d
http://www.wbcsd.org/DocRoot/UZxMnH1c1poU0uEhAm4P/EEB_Facts_Trends.pdf
Not addressed.
Relied on Davis Langdon (2007) and Kats (2003) for cost and savings information.
11
Table A-1. Continued
SourceYear Published Title
Hard Costs (% +/-)
Soft Costs (% +/-)
Efficiency Improve-ment (%) Assessment Approach Notes Links
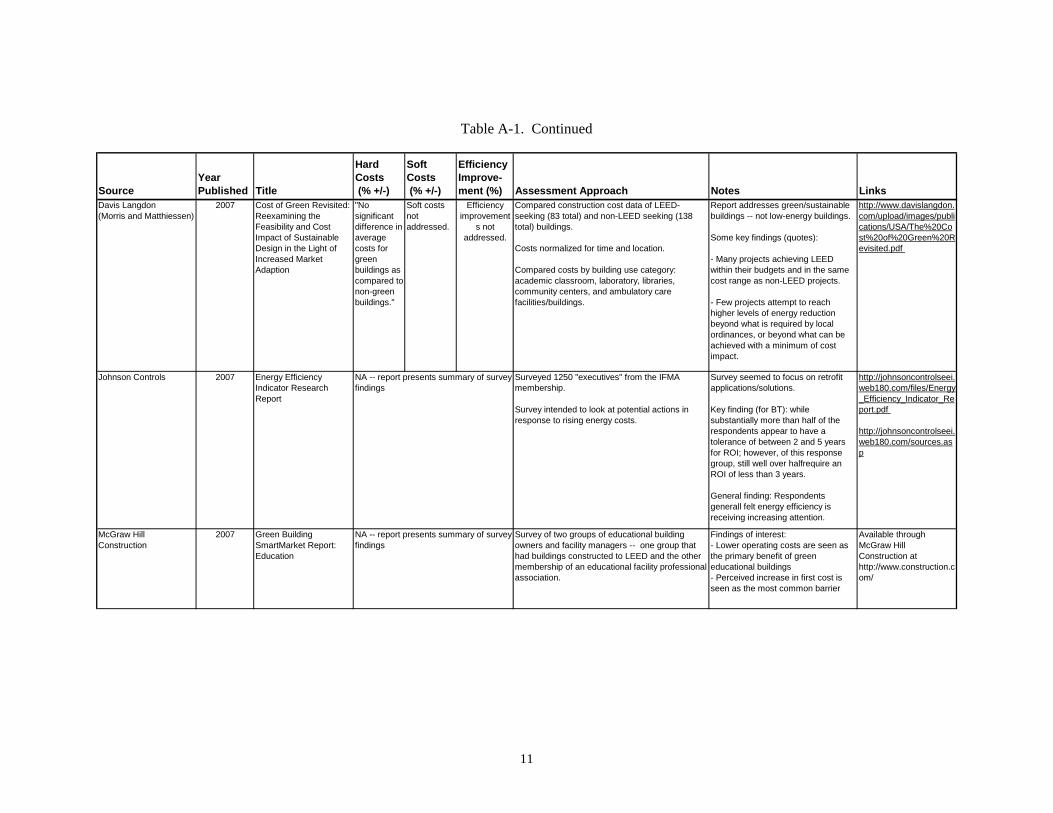
Davis Langdon(Morris and Matthiessen)
2007 Cost of Green Revisited: Reexamining the Feasibility and Cost Impact of Sustainable Design in the Light of Increased Market Adaption
"No significant difference in average costs for green buildings as compared to non-green buildings."
Soft costs not addressed.
Efficiency improvement
s not addressed.
Compared construction cost data of LEED-seeking (83 total) and non-LEED seeking (138 total) buildings.
Costs normalized for time and location.
Compared costs by building use category: academic classroom, laboratory, libraries, community centers, and ambulatory care facilities/buildings.
Report addresses green/sustainable buildings -- not low-energy buildings.
Some key findings (quotes):
- Many projects achieving LEED within their budgets and in the same cost range as non-LEED projects.
- Few projects attempt to reach higher levels of energy reduction beyond what is required by local ordinances, or beyond what can be achieved with a minimum of cost impact.
http://www.davislangdon.com/upload/images/publications/USA/The%20Cost%20of%20Green%20Revisited.pdf
Johnson Controls 2007 Energy Efficiency Indicator Research Report
Surveyed 1250 "executives" from the IFMA membership.
Survey intended to look at potential actions in response to rising energy costs.
Survey seemed to focus on retrofit applications/solutions.
Key finding (for BT): while substantially more than half of the respondents appear to have a tolerance of between 2 and 5 years for ROI; however, of this response group, still well over halfrequire an ROI of less than 3 years.
General finding: Respondents generall felt energy efficiency is receiving increasing attention.
http://johnsoncontrolseei.web180.com/files/Energy_Efficiency_Indicator_Report.pdf
http://johnsoncontrolseei.web180.com/sources.asp
McGraw Hill Construction
2007 Green Building SmartMarket Report: Education
Survey of two groups of educational building owners and facility managers -- one group that had buildings constructed to LEED and the other membership of an educational facility professional association.
Findings of interest:- Lower operating costs are seen as the primary benefit of green educational buildings- Perceived increase in first cost is seen as the most common barrier
Available through McGraw Hill Construction at http://www.construction.com/
NA -- report presents summary of survey findings
NA -- report presents summary of survey findings
12
Table A-1. Continued
SourceYear Published Title
Hard Costs (% +/-)
Soft Costs (% +/-)
Efficiency Improve-ment (%) Assessment Approach Notes Links
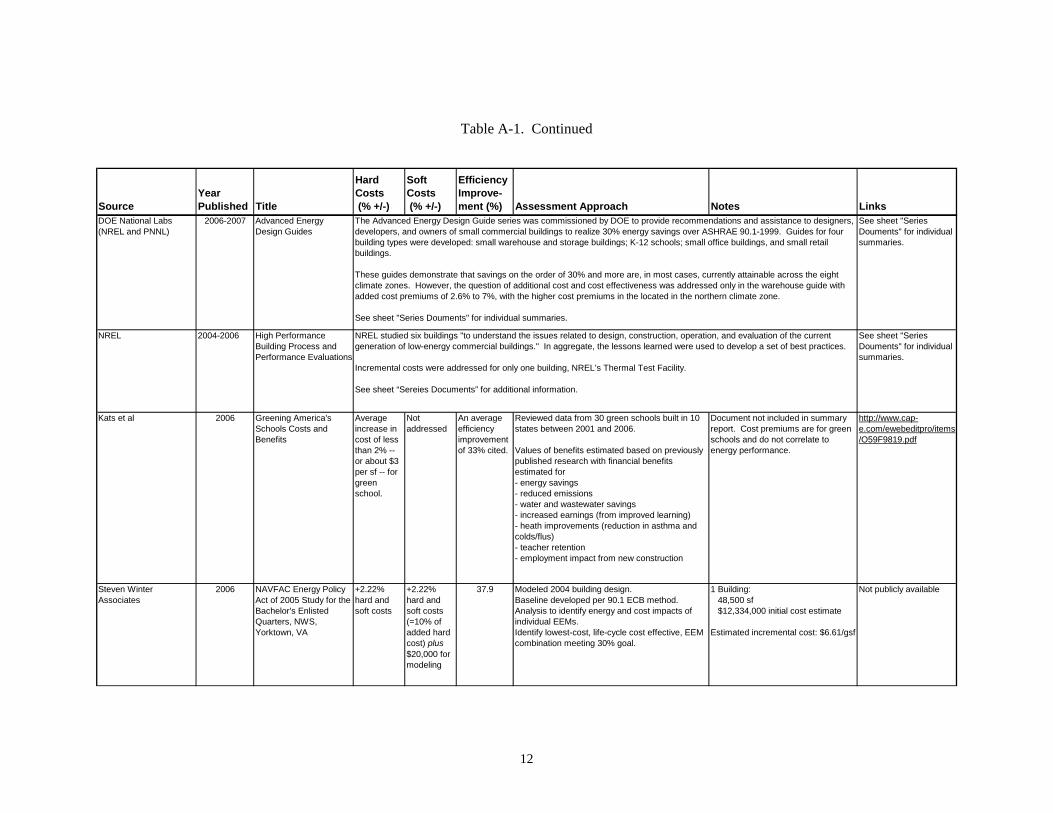
DOE National Labs (NREL and PNNL)
2006-2007 Advanced Energy Design Guides
See sheet "Series Douments" for individual summaries.
NREL 2004-2006 High Performance Building Process and Performance Evaluations
See sheet "Series Douments" for individual summaries.
Kats et al 2006 Greening America's Schools Costs and Benefits
Average increase in cost of less than 2% -- or about $3 per sf -- for green school.
Not addressed
An average efficiency improvement of 33% cited.
Reviewed data from 30 green schools built in 10 states between 2001 and 2006.
Values of benefits estimated based on previously published research with financial benefits estimated for - energy savings- reduced emissions- water and wastewater savings- increased earnings (from improved learning)- heath improvements (reduction in asthma and colds/flus)- teacher retention- employment impact from new construction
Document not included in summary report. Cost premiums are for green schools and do not correlate to energy performance.
http://www.cap-e.com/ewebeditpro/items/O59F9819.pdf
Steven Winter Associates
2006 NAVFAC Energy Policy Act of 2005 Study for the Bachelor's Enlisted Quarters, NWS, Yorktown, VA
+2.22% hard and soft costs
+2.22% hard and soft costs (=10% of added hard cost) plus $20,000 for modeling
37.9 Modeled 2004 building design.Baseline developed per 90.1 ECB method.Analysis to identify energy and cost impacts of individual EEMs.Identify lowest-cost, life-cycle cost effective, EEM combination meeting 30% goal.
1 Building: 48,500 sf $12,334,000 initial cost estimate
Estimated incremental cost: $6.61/gsf
Not publicly available
NREL studied six buildings "to understand the issues related to design, construction, operation, and evaluation of the current generation of low-energy commercial buildings." In aggregate, the lessons learned were used to develop a set of best practices.
Incremental costs were addressed for only one building, NREL’s Thermal Test Facility.
See sheet “Sereies Documents” for additional information.
The Advanced Energy Design Guide series was commissioned by DOE to provide recommendations and assistance to designers, developers, and owners of small commercial buildings to realize 30% energy savings over ASHRAE 90.1-1999. Guides for four building types were developed: small warehouse and storage buildings; K-12 schools; small office buildings, and small retail buildings.
These guides demonstrate that savings on the order of 30% and more are, in most cases, currently attainable across the eight climate zones. However, the question of additional cost and cost effectiveness was addressed only in the warehouse guide with added cost premiums of 2.6% to 7%, with the higher cost premiums in the located in the northern climate zone.
See sheet "Series Douments" for individual summaries.

13
Table A-1. Continued
SourceYear Published Title
Hard Costs (% +/-)
Soft Costs (% +/-)
Efficiency Improve-ment (%) Assessment Approach Notes Links
Steven Winter Associates
2006 NAVFAC Energy Policy Act of 2005 Study for the Academic and Headquarters Buildings, Norfolk, VA
+1.07% hard and soft costs
+1.07% hard and soft costs (=10% of added hard cost) plus $20,000 for modeling
32.6 Modeled 2004 building design.Baseline developed per 90.1 ECB method.Analysis to identify energy and cost impacts of individual EEMs.Identify lowest-cost, life-cycle cost effective, EEM combination meeting 30% goal.
Academic Building: 14,800 sfHeadquarters Building: 5,900 sf$6,092,810 combined initial cost estimate
Estimated incremental cost: $3.01/sf
Not publicly available
Steven Winter Associates
2006draft
NAVFAC Energy Policy Act of 2005 Study for the Mission Support Facility, Virginia Beach, VA
+3.19% hard and soft costs
+3.19% hard and soft costs (=10% of added hard cost) plus $20,000 for modeling
31.1 Modeled 2004 building design.Baseline developed per 90.1 ECB method.Analysis to identify energy and cost impacts of individual EEMs.Identify lowest-cost, life-cycle cost effective, EEM combination meeting 30% goal.
Warehouse, machine shop, and office spaces: 37,641 sf$5,456,000 cost estimate
$30.6k in annual energy savingsEstimated incremental cost: $4.62SIR = 1.94
Not publicly available
Steven Winter Associates
2004 GSA LEED Cost Study Final Report
Estimated cost impacts for the silver and gold energy scenarios ranged from 2.3% to 3.3%.
Overall estimated cost impact for silver and gold certifications ranged from 0.19% to 0.37% (average = 28%)
Ranged from 8% (3 points)
to 18% (5 points) over
GSA standard design
Study conducted for GSA to 'estimate the costs to develop "green" federal buildings unsing …' LEED 2.1.
Examined 2 building types: 1) new 5-story courthouse and 2) mid-rise federal office building modernization. BT assessment reviewed only the new building case.
Building evaluated: 262 ksf with base construction cost of $219.14/sf.
Potential measures limied to those considered above the GSA design standards.
Individual LEED credit assessments and cost estimates were completed for six scenarios, "low cost" and "high cost" scenarios (to create a cost range" for certified, silver, and gold rating levels.
Building designed to 90.1-1999(v)
Additional costs considered for measures exceeding GSA standards. In this case, the GSA assigned target of 45 kBtu/sf translated into 17% improvement over 90.1-1999, The resulting cost impact determined in this study was then based on an improvement of 8% to achieve 3 EA-1 points, and 18% more for 5 points.
Provides summary of energy measures and costs.
Overall cost of greening varied from -0.03% to 8.1% of the total construction cost.
http://www.wbdg.org/ccb/GSAMAN/gsaleed.pdf
14
Table A-1. Continued
SourceYear Published Title
Hard Costs (% +/-)
Soft Costs (% +/-)
Efficiency Improve-ment (%) Assessment Approach Notes Links
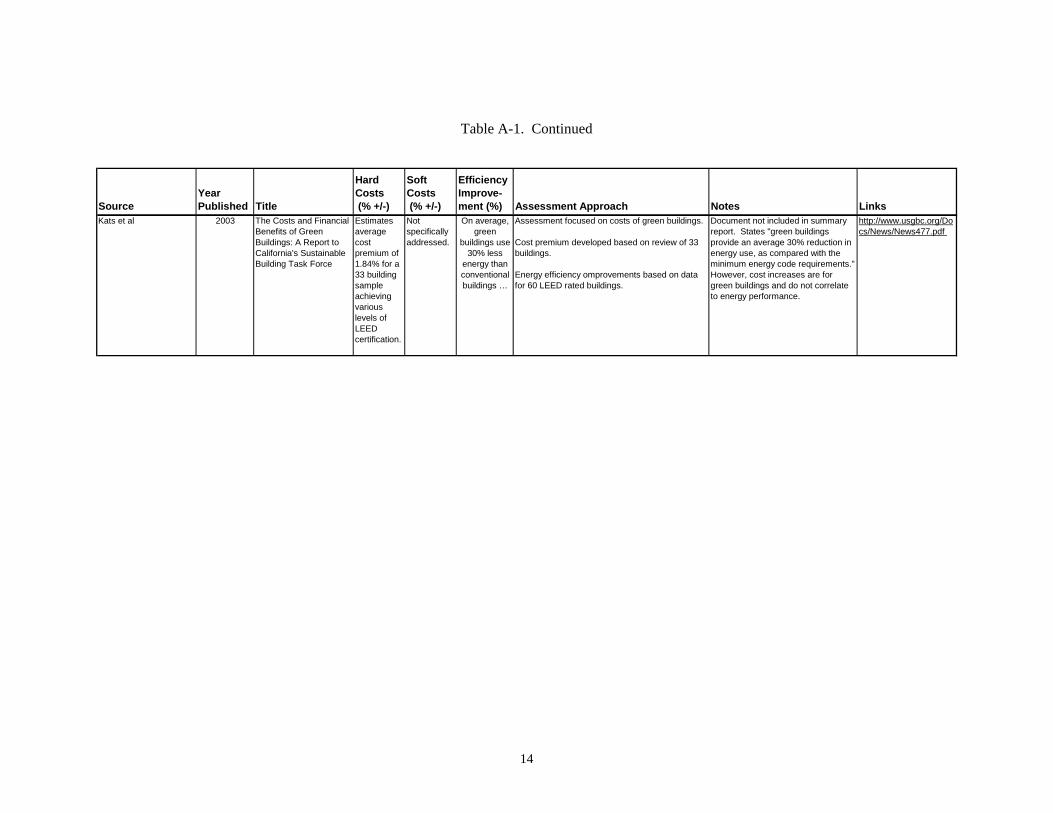
Kats et al 2003 The Costs and Financial Benefits of Green Buildings: A Report to California's Sustainable Building Task Force
Estimates average cost premium of 1.84% for a 33 building sample achieving various levels of LEED certification.
Not specifically addressed.
On average, green
buildings use 30% less
energy than conventional buildings …
Assessment focused on costs of green buildings.
Cost premium developed based on review of 33 buildings.
Energy efficiency omprovements based on data for 60 LEED rated buildings.
Document not included in summary report. States "green buildings provide an average 30% reduction in energy use, as compared with the minimum energy code requirements." However, cost increases are for green buildings and do not correlate to energy performance.
http://www.usgbc.org/Docs/News/News477.pdf

15
Table A- 2. Series Document Review Summaries Series Source Date Title Method Notes URL
NREL Jun-06 Lessons Learned from Case Studies of Six High Performance Buildings (NREL/TP-550-37542)
http://www.nrel.gov/docs/fy06osti/37542.pdf
NREL Apr-05 Analysis of the Energy Performance of the Chesapeake Bay Foundation's Philip Merrill Environmental Center
http://www.nrel.gov/docs/fy05osti/34830.pdf
NREL Mar-05 Analysis of the Design and Energy Performance of the Pennsylvania Department of Environmental Protection Cambria Office Building
http://www.nrel.gov/docs/fy05osti/34931.pdf
NREL Feb-05 Evaluation of the Low-Energy Design and Energy Performance of the Zion National Park Visitors Center
http://www.nrel.gov/docs/fy05osti/34607.pdf
NREL Feb-05 Evaluation of the Energy Performance and Design Process of the Thermal Test Facility at the National Renewable Energy Laboratory (NREL/TP-550-34832)
http://www.nrel.gov/docs/fy05osti/34832.pdf
NREL Jan-05 Energy Design and Performance Analysis of the BigHorn Home Improvement Center
http://www.nrel.gov/docs/fy05osti/34930.pdf
NREL Nov-04 Energy Performance Evaluation of an Educational Facility" The Adam Joseph Lewis Center for Environmental Studies, Oberlin College, Oberlin, Ohio
http://www.nrel.gov/docs/fy05osti/33180.pdf
NREL High Performance Building
Process and Performance Evaluations
NREL studied six buildings "to understand the issues related to design, costruction, operation, and evaluation of the current generation of low-energy commercial buildings." In aggregate, the lessons learned were used to develop a set of best practices.
Construction of all buildings studied was completed in 2000 with the exception of the NREL Thermal Test Facility being completed in 1996.
Results:- Site energy savings ranged from 25% to 62%- Energy cost savings ranged from 12% to 67%
The Thermal Test Facility evaluation identified a 3.9% increase in costs for energy efficiency improvements while realizing a site energy savings of 42% and an energy cost savings of 51%. Note the 1995 Federal Energy Code, based on ASHRAE 90.1-1989, was used for this building.
16
Table A-2. Continued Series Source Date Title Method Notes URL
PNNL Dec-07 TSD: The Development of the Advanced Energy Design Guide for Small Warehouse and Self-Storage Buildings (PNNL-17056)
Method:- Scoping study to develop two prototype warehouse( 8 ksf conditioned self-storage and 50ksf large warehouse) and identify technologies.- Simulate prototypes (EnergyPlus) in 8 climate zones used by prevailing energy codes and standards to evaluate energy savings.
Characteristics: Less than 50 ksf with heating and cooling from unitary HVAC equipment; excluded refrigerated warehouses, unheated warehouses, and built-up systems.
Results:- Energy Savings: Average whole building energy savings including plug load in denominator are --- 42% over 90.1-1999 for both the self-storage (range of 27% to 63%) and large warehouses (range of 29% to 54%)--- 33% over 90.1-2004 for both the self-storage (range of 25% to 48%) and large warehouses (range of 27% to 50%)
- Cost Effectiveness: For 50 ksf warehouses--- Percetage cost increase over median baseline ranged from 2.6% to 7%. Cold weather zones (5,6, &7) ranged from 5.9% to 7%, while the remaining zones ranged from 2.6% to 4.0%--- Simple payback periods for zones 1-4 and 8 ranged from 6.0 to 8.3 years, while simple paybacks for zones 5-7 ranged from 9.6 to 13.5 years.
http://www.pnl.gov/main/publications/external/technical_reports/PNNL-17056.pdf
NREL Sep-07 TSD: Development of the Advanced Energy Design Guide for K-12 Schools -- 30% Energy Savings (NREL/TP-550-42114)
Method:- Develop protoypical, baseline, and low-energy EnergyPlus K-12 models.- Document modeling assumptions- Recommendations for 30% savings over 90.1-1999- Recommendations for 30% over 90.1-2004- Demonstrate energy savings results by climate zone
Results:- More than 30% savings over 90.1-1999 in all climate zones for eacg daylit and non-daylit school with a range of HVAC system types.- Results almost the same for 90.1-2004 except the non-daylit option is not available over all climate zones.- Cost effectiveness NOT addressed.
http://www.nrel.gov/docs/fy07osti/42114.pdf
Technical Support Documents
Advanced Energy Design Guides
provide recommendations for
achieving 30% energy savings over ASHRAE 90.1-1999

17
Table A-2. Continued
Series Source Date Title Method Notes URLPNNL Nov-06 TSD: Development of the Advanced Energy
Design Guide for Small Office Buildings (PNNL-16250)
Method:- Scoping study to develop two prototype office buildings (5 ksf frame building and 20 ksf two-story mass building) and identify technologies.- Simulate prototypes (eQuest) in 8 climate zones used by prevailing energy codes and standards to evaluate energy savings.
Characteristics: 20,000 gsf or less; provide for new buildings, complete renovations to existing buildings systems within existing building under renovation; unitary HVAC; excludes built-up systems and hydronic heating or cooling systems.
Results:- Average energy savings over all buildings and climates ~38%- Both building prototypes met 30% savings goal in each climate for the case without plug loads in the denominator. Approximate ranges: 31-49% for 5 ksf prototype and 33-43% for 20 ksf prototype.- Approximate ranges with plug loads in the denominator: 26-44% for 5 ksf prototype and 27-38% for the 20 ksf prototype.- Cost effectiveness NOT addressed.
http://www.pnl.gov/main/publications/external/technical_reports/pnnl-16250.pdf
PNNL Sep-06 TSD: The Development of the Advanced Energy Design Guide for Small Retail Buildings (PNNL-16031)
Method:- Scoping study to develop two prototype retail buildings (7,500 sf strip mall and 15,000 sf standalone retail) and identify technologies.- Simulate prototypes (eQuest) in 8 climate zones used by prevailing energy codes and standards to evaluate energy savings.
Characteristics: 20,000 gsf or less; does not exceed one story; unitary HVAC; exclusions notes in guide.
Results: - Average energy savings over all buildings and climates ~37%- Strip mall and standalone prototypes met the 30% savings goal in all climates.- Cost effectiveness NOT addressed.
Challenges: 1) lighting 2) meeting ventilation reqs with conventional unity equipment 3) disconnect between original construction and fit-out by building tenant.
http://www.pnl.gov/main/publications/external/technical_reports/PNNL-16031.pdf
Technical Support Documents
Advanced Energy Design Guides
provide recommendations for
achieving 30% energy savings over ASHRAE 90.1-1999

18
APPENDIX B
Summary Paper of the NAVFAC Energy Policy Act of 2005 Studies by Steven Winter Associates (2006)

19
APPENDIX B. Summary Paper of the NAVFAC Energy Policy Act of 2005 Studies by Steven Winter Associates (2006)
- The U.S. Naval Facilities Engineering Command (NAVFAC) commissioned a series of studies to “estimate the hard and soft cost impacts” on several typical buildings to comply with EPAct 2005, Section 109, to achieve energy consumption levels 30% or more below ASHRAE Standard 90.1.4
- Buildings addressed in this series of studies:
o A 48,500 sf bachelor’s enlisted quarters (BEQ) with an estimated construction
cost of $12,334,000. o Academic and headquarters buildings (Admin) with gross areas of 14,800 sf and
5,900 sf, with an estimated construction cost for the admin facility of $6,092,810.
o A mission support (Mission) facility including warehouse, machine shop, and office spaces, totaling 37,641 sf with an estimated construction cost of $5,456,000.
- Methodology: Analysis procedure as described in the Executive Summary sections of the
NAVFAC reports:
Reference annual energy use, energy costs, and construction costs were estimated to reflect the “As-Built” condition derived from conversations with NAVFAC personnel and the aforementioned documents provided by NAVFAC. An analysis was performed to identify individual energy efficiency measures (EEMs) and their associated costs that would likely be implemented to meet the EPAct requirement (30% less energy consumption, based on cost, than ASHRAE Standard 90.1-2004). From those individual EEM [energy efficiency measures] assessments and a ranking based on simple payback, a combination of energy saving features was identified that provided the best value to the Navy, returning the targeted energy savings while being life-cycle cost effective. Overall project cost (construction costs and soft costs) were then developed for the “combined recommended measures.”
4 Note that these studies have not been publicly released and the mission support facility report reviewed was a draft version.

20
- Results
Building Square Footage
Resulting Energy Savings
Resulting Hard and Soft Cost Increase5
Incremental Cost-per-Square Foot Increase
Savings-to-Investment Ratio
BEQ 48,500 37.9% 2.22% $6.61 1.21 Admin 20,700 32.6% 1.07% $3.01 1.01 Mission 37,641 31.1% 3.19% $4.62 1.94
- General:
o Incremental cost increase observed to be low/modest. o Somewhat rigorous studies are well documented and include a list of considered
and recommended EEMs.
5 Soft costs equal the standard design fee of 10% of hard costs plus energy modeling fees.
21
APPENDIX C
Estimated Incremental Costs and Cost Effectiveness for 50,000 ft2 Warehouse

22
APPENDIX C. Estimated Incremental Costs and Cost Effectiveness for 50,000 ft2 Warehouse
Table C- 1. Estimated Percentage Cost Increases for Energy-Efficient Warehouses based on 50,000 sf Prototype used for AEDG Energy Simulations
Table C- 2. Estimated Simple Payback for Energy-Efficient Warehouses based on 50,000 sf Prototype used for AEDG Energy Simulations
23
APPENDIX D
Summary Paper of the Steven Winter Associates, Inc. Report GSA LEED Cost Study (2004)

24
APPENDIX D. Summary Paper of the Steven Winter Associates, Inc. Report GSA LEED Cost Study (2004)6
- This report developed for General Services Administration (GSA) estimates ‘the costs to
develop “green” federal facilities’ using LEED version 2.1. The study states “The cost impacts may not be directly transferable to other project types or building owners.”
- The data presented in this study include renovation of a federal office building and a new
five story federal Courthouse with a total square footage of 262,000 square feet, with a base construction cost of $219.14 per square foot (sf).7
- Methodology: The report examines potential measures and the estimated cost for each of
the LEED prerequisites and credits additional to the initial building base design. This approach allows for the identification of costs, both soft and hard, for the energy specific measures.
o Potential measures were limited to those that were considered above the GSA
standards. For example, EA Prerequisite 1 requires implementation of “fundamental best practice building commissioning procedures;” because GSA already requires total building commissioning, there were not LEED-related costs associated with this measure.
o Individual LEED credit assessments and cost estimates were completed for six scenarios, “low cost” and “high cost” scenarios (to create a cost range) for certified, silver, and gold rating levels.
- Results:
o Overall LEED construction cost impacts
Certified Silver Gold Low High Low High Low High
$/sf ($0.76) $2.18 ($0.07) $9.57 $2.97 $17.79 % change
in cost -0.4% 1.0% -0.03% 4.4% 1.4% 8.1%
6 http://www.wbdg.org/ccb/browse_doc.php?d=90 7 The report also examined the costs to renovate an existing nine-story, 306,000 sf building.

25
o Summary of hard costs for applicable energy prerequisites and credits
Total Construction
Cost ($)
Cost Impact ($/sf)
Cost Impact (%)
EA-1: Optimize Energy Performance - 3 points (exceed 90.1-1999 by 25%)
151,262 0.58 0.26
EA-1: Optimize Energy Performance - 5 points (exceed 90.1-1999 by 35%)
756,101 2.89 1.32
Commissioning at $0.75/sfa (price range in report of $0.75 to
$1.00/sf)
183,400 0.75 0.34
60kW PV arrayb 787,586 3.01 1.37 a While commissioning costs were recognized as a required cost by GSA, costs are identified in this table as a required cost element for high performance buildings. b The cost for the PV array is included as a cost premium because the resulting energy production was deducted from the building’s calculated energy use in EA-1
o Soft costs – detailed soft cost calculations are included in the report. Final estimated costs for silver and gold certifications range from $0.41/sf to $0.80/sf. This translates into a percent cost impact of 0.19% to 0.37% (average of 0.28%)
o Approximate overall cost impacts for specific scenarios:
EA-1 + commissioning + PV + design ~ 2.3% EA-3 + commissioning + PV + design ~ 3.3%
- Key findings:
o In this particular case, the cost premium of a high performance building is listed
in the range of 2.2% to 3.3% for the energy efficiency improvements beyond the new building base case, which was calculated to be 16.9% less than ASHRAE Standard 90.1-1999.
o The construction cost of greening a building can be very misleading when
speaking of high performance buildings. Here, the cost of a greening (silver minimum to gold) ranges from -0.03% of total costs, implying it saves on first costs to build green, to 8.1% of the total construction cost.
- Limitation:
o GSA design requirements impacted overall designs and the subsequent cost differentials. Previously mentioned was the LEED commissioning requirement (which GSA actually exceeds). Another example is the use of energy targets. The energy target for this building was 45,000 to 50,000 Btu/sf/year (very low), which translated into a 17% improvement over ASHRAE Standard 90.1-1999. The resulting cost impact was then based on improving performance by 8% more for 3 points under EA-1, and 18% more for 5 points.
26
- Other interesting items in this report:
o “Significantly different building types would likely develop a different overall profile of LEED credits, and might use significantly different approaches to achieve common credits.”
o “There is no correlation between the point value of a LEED credit and its cost.”
o (At the time of the study, GSA had allocated a 2.5% budget increase for green
building construction costs.) “With the revised budget allotments (which will likely vary between 2.5% and 4.0%, depending on the project), the study indicates that many Silver rated buildings should be possible, as well as occasional Gold rated projects.”
27
APPENDIX E
Summary Paper of the Building Design+Construction Green Buildings Research White Paper (October 2007)
28
APPENDIX E. Summary Paper of the Building Design+Construction Green Buildings Research White Paper
(October 2007)8
- This report summarizes a series of annual surveys of building owners, facility directors,
end users, and designers, with the objective of identifying positions, perceptions, and trends with regard to green buildings. In particular:
o What is the cost of green versus conventional construction? o How much more are owners and users willing to pay for a green building? o Are owners more willing to invest in green buildings today than they were 3 or 4
years ago?
- Surveys were administered in the following areas: architects, engineers, contractors, and building owners (Building Design+Construction subscribers); corporate real estate executives (CoreNet Global membership); healthcare facilities designers, builders, and operators (users of the Green Guide for Health Care self-certifying system and readers of Modern Healthcare magazine); higher education owners and designers (Society for University Planning, Association for the Advancement of Sustainability in Higher Education, and the Association of Higher Education Facilities Officers); K-12 schools (Council of Education Facility Planners International and the Association of School Building Officials); hotel industry (readers of HOTELS magazine); restaurant industry (readers of Restaurants & Institutions magazine); and residential construction (readers of Professional Builder). Responses for all surveys totaled more than 2,500.
- Notable findings by surveyed group:
o Architects, engineers, contractors, and owners: ‘“First cost” was a serious
roadblock for respondents. Nearly four in five (78%) said their clients thought sustainability added “significantly” to first costs. By an even greater margin (86%), respondents themselves said they thought green buildings more costly to build than conventional buildings.’
o Real estate professionals: 35% said “their company would be willing to spend
between 3 and 5% more for a green corporate building, and one in five said their company would spend between 6 and 10% more. Just 6% said they would not take on any extra costs for green.”
o Healthcare facilities: “The general perception that green adds significantly to the
cost of construction is seen as the biggest barrier to green hospitals, with nearly two-thirds of respondents (65%) citing cost as an obstacle to green.”
o Higher education:
“85% of respondents said their institutions have incorporated sustainable design and green buildings’ principles in recent building projects.”
8 http://www.bdcnetwork.com/contents/pdfs/BDC_07_WhitePaper.pdf?nid=2073

29
47% “said their institutions would be willing to pay up to 5% more for green, and about one-fifth said they would fork out an additional 6-10%. Just 9% … said a cost premium for green is not acceptable.”
o K-12: 34% would pay between 3 and 5% more for green/sustainable schools, but
67% said the biggest barrier in their district is that it “adds significantly to initial costs of construction.”
o Hotels:
“58% cited significant initial construction costs as the biggest obstacle
they face with regard to green building and sustainable design.”
“Energy use is a major concern for hotels, with energy management cited by 75% of respondents as the sustainable/green concept they have already incorporated, and 53% citing it as the concept they soon plan to incorporate.”
o Restaurants:
52% would pay between 3 and 10% extra in construction costs, while
18% would not spend additional money to go green.
60% said the perception of significant added costs is a barrier to greening restaurants.
o Residential:
38% said green features increase the price of a house by between 6 and 10%.
30% said buyers are unwilling to pay more for green features, while 29%
were willing to pay more.
- Overall findings: Results for each of the surveyed groups were not aggregated. (It’s not clear if aggregating results was possible because the individual survey forms may have varied.) Still, the following overall findings seem to emerge:
o Across almost each sector, first cost was identified as a barrier to green
construction.
o In many of the surveyed groups, about one-third to one-half of the respondents indicated a willingness to pay a cost premium of between 3 and 5%.
o Most frequently adopted energy-efficiency measures appear to be daylighting,
energy management systems, and automated lighting controls, with commissioning and modeling also being applied.
30
- Limitations:
o Survey responses were somewhat limited for some of the surveyed sectors. o Likely self-selection bias, given that the survey was not administered in a random
fashion, but instead completed by interested subscribers. o Surveys applied to green/sustainable building costs and practices. Energy cost
premiums were not addressed.

31
APPENDIX F
Summary Paper of the McGraw Hill Construction SmartMarket Report on Green Buildings in Education (2007)

32
APPENDIX F. Summary Paper of the McGraw Hill Construction SmartMarket Report on Green Buildings in Education (2007)
- This SmartMarket Report provides a brief summary of construction trends in the educational building sector, including the opinions of building owners, planners, and designers. Areas of interest to the DOE Building Technologies Program include the priorities and expectations of energy conservation in green school building construction and obstacles to green building sustainable school buildings.
- Methodology: In phase 1, 31 owners and facility managers of LEED-certified educational
buildings were interviewed. These owners/managers were selected from a list of 120 projects identified by the U.S. Green Building Council and Turner Construction. Of the selected schools, 16 were universities and 15 were K-12, of which 2 were private schools. In phase 2, the phase 1 interview guide was adapted for online data collection from members of the Council of Educational Facility Planners International (CEFPI). Members of the CEFPI, who number 3,300, are involved in school planning, design and construction. A total of 88 surveys were completed by CEFPI members.
- Key findings:
o Lower operating costs (primarily energy and utility cost savings) are the key
drivers in justifying green buildings. o Perceived added first cost is cited as the greatest obstacle to building green
educational facilities. o The educational building sector is currently the largest commercial construction
market. o Numerous state and local governments are mandating green construction of
schools, including Montgomery County (MD). Still, the most influential decision makers are considered to be the school facilities staff and the executive management entities (e.g., school boards and deans).
- Energy conservation:
o In phase 1, average expected reduction in operating costs of 11% versus actual utility cost savings of between 20% and 40% for new green schools.
o In phase 1, average expected energy reduction of 14% compared to actual energy
reductions of up to 40% and water reductions up to 30%.
o Energy conservation and operational cost savings ranked as the most important outcomes of green buildings.
o Lower energy use ranked as the top environmental reason for building green
schools.

33
- Identified barriers:
o First cost is the most common barrier. o Other barriers identified were approval costs and different budget accounting
(e.g., capital versus operating costs)
- Identified drivers for building green educational facilities:
o Operational cost savings is the top business reason. o Lower energy use is the top environmental reason.
o Greater student health and performance are the top social reasons.
- Construction trends in the education sector:
o The educational construction market is the largest commercial construction market sector, accounting for approximately 27% of all commercial construction.
o Enrollments in both the K-12 and colleges/universities are increasing as a result
of the “Echo Boom Generation.”
o In 2007, the most rapid growth took place in the Pacific Northwest and Mid-Atlantic regions.
o Green educational buildings account for approximately 20% of LEED-certified
buildings.
- Requirements for green construction:
o Several states have sustainable/green school programs in place. o Several school districts have committed to building green school facilities
including Los Angeles, San Francisco, New York City, and Montgomery County, MD.
- Limitations:
o Assessment looked at sustainable buildings, not energy-efficient buildings.
o Information on the added costs was not addressed except from the perspective of the perceptions of survey participants.

34
APPENDIX G
Summary Paper of the Davis Langdon (Morris and Matthiessen) Report Cost of Green Revisited: Reexamining the Feasibility
and Cost Impact of Sustainable Design in the Light of Increased Market Adoption (July 2007)
35
APPENDIX G. Summary Paper of the Davis Langdon (Morris and Matthiessen) Report Cost of Green Revisited: Reexamining the Feasibility and Cost Impact of Sustainable Design in the Light of
Increased Market Adoption (July 2007)9
- It isn’t clear who commissioned this assessment by Davis Langdon.10 In general, the paper presents data in an unbiased manner that acknowledges the limited building sample sizes.
- Key findings as presented in the paper:
o Many projects are achieving LEED within their budgets, and in the same cost
range as non-LEED projects. o Construction costs have risen dramatically, but projects are still achieving LEED.
o The idea that green is an added feature continues to be a problem. While there
appears to be a general perception that sustainable design features add to the overall cost of the building, the data did not show “significant difference in the average costs of LEED-seeking and non-LEED seeking buildings.”
- Methodology: Construction costs of buildings seeking LEED NC 2.1 and 2.2 certification
(83 total) were compared to new buildings not seeking LEED certification (138 total). Costs were normalized for time and location. Building costs were compared by building use category. Categories and sample sizes are listed below.
o Academic classroom buildings – 17 LEED seeking and 43 non-LEED seeking o Laboratory buildings – 26 LEED seeking and 44 non-LEED seeking o Libraries – 25 LEED seeking and 32 non-LEED-seeking o Community centers – 9 LEED seeking and 9 non-LEED seeking o Ambulatory care facilities – 9 LEED seeking and 8 non-LEED seeking.
- Limitations:
o Report looks at costs for sustainability, not high energy performance o Building categories represent a small percentage of overall building space per
Table 2.2.2 (Principal Commercial Building Types as of 2003) of the 2006 Buildings Energy Data Book
Academic (education) buildings represent 15% of total floorspace Laboratories are a subset of the “Other” category that accounts for 5% of
the total floorspace Ambulatory care facilities (outpatient health care) accounts for 2% of the
total floorspace
9http://www.dladamson.com/upload/images/publications/USA/The%20Cost%20of%20Green%20Revisited.pdf 10 Davis Langdon is a global construction and property consulting firm.

36
Libraries and community centers – not clear what building category these building uses come under: subsets of public assembly and/or other.
o As noted in the paper, there are typically wide variations in costs per square foot
between buildings on a regular basis, even when sustainability is not taken into account. Further, this normal variability “contributed to the lack of statistically significant building differences between the LEED-seeking and non-LEED seeking buildings.”
o It is not clear if both soft11 and hard costs were considered in the analysis.
- “Most notable, few projects attempt to reach higher levels of energy reduction beyond
what is required by local ordinances, or beyond what can be achieved with a minimum of cost impact.”
11 Soft costs are the costs attributed to the building design and development costs. The term “hard costs” refers to the costs of labor, material, supervision, and overhead associated with the building construction.
37
APPENDIX H
Summary Paper of the Johnson Controls Energy Efficiency Indicator Research Report (2007)

38
APPENDIX H. Summary Paper of the Johnson Controls Energy Efficiency Indicator Research Report (2007)12
- This report summarizes the findings of a survey of 1,250 executives, all members of the International Facility Management Association (IFMA). Respondents were identified with the assistance of the IFMA and represented “a wide range of facility types, sizes, and locations [in North America].”
- The survey intends to address actions in response to rising energy costs, expected
paybacks on efficiency investments, and motivations for investments. The original survey questions were not included in the report. However, it appears that the survey focused more on investments in existing buildings.
- Interesting findings/responses:
o General energy management findings:
15% said that energy management is extremely important to their company.
More than 60% believe their company is paying more attention to energy
efficiency than 5 years ago. Cost savings are a considerably stronger motivation for achieving energy
efficiency than is environmental responsibility.
o Most companies have a tolerance of between 2 and 5 years for a return on their energy efficiency investments.13 [Note the percentages add up to 90%]
o 77% with current or planned retrofit or new construction projects believe that energy efficiency is, or will be, a priority in the construction design.
- Limitation: While the survey captures a large number of respondents, the apparent focus
was on capital investments/retrofits.
- Key finding: While the tolerance for on return-on-investments varies across a wide range, 42% of the respondents have a tolerance of 3 years or less.
12 http://johnsoncontrolseei.web180.com/files/energy_efficiency_indicator_report.pdf