Literature Review Childhood Obesity
33
Childhood Obesity in the U.S. 1 A Literature Review of Childhood Obesity in the United States Jean Galiana
-
Upload
jean-galiana -
Category
Documents
-
view
911 -
download
0
Transcript of Literature Review Childhood Obesity

Childhood Obesity in the U.S. 1
A Literature Review of Childhood Obesity in the United States
Jean Galiana

Childhood Obesity in the U.S. 2
A Literature Review of the Childhood Epidemic in the United States
The World Health Organization (WHO) considers childhood obesity to be one of
the most serious public health challenges of the 21st Century. The United States Surgeon
General considers obesity to be a national epidemic (Satcher, 2001). The United States
Task Force on Childhood Obesity claims that obesity is a national health crisis. For the
first time in U.S. history, if the epidemic is not reversed, parents will be healthier and live
longer than the generations that follow (Olshansky, Passaro, Hershaw, Layden, Carnes,
Brody, Hayflick, Butler, Allison, & Ludwig, 2005).
The physical suffering and chronic diseases that obese children are likely to
experience are two of the negative outcomes of the obesity epidemic. . The healthcare
costs, and reduced economic productivity associated with obesity represent a major
economic cost for our nation. Older interventions of childhood obesity focused on
individual responsibility and education about the harmful physical effects of being obese.
Newer and more successful interventions involve collaboration of community, regional,
public, and private organizations with state and local governments. This collaboration
brings a united vision of changing the environments that lead to obesity and enacting
policy that supports healthy active lifestyles. This paper reviews the recent literature and
describes the repercussions of the prevalence of childhood obesity in the U.S. In addition,
this paper identifies and explores the main focus of interventions for childhood obesity.
Two case studies addressing these interventions will be presented.
A systematic literature search was conducted from February through April of
2015. The principle sources used include: Health Source: Nursing/Academic Medline
Complete, PubMed, and ProQuest Public Health were the databases used. Search terms

Childhood Obesity in the U.S. 3
included: childhood obesity, after-school nutrition, after-school physical exercise, school
meals, school physical education, built environment, food deserts, and social
determinants of childhood obesity. Medical journals were the predominant source used
for this paper; 19 were cited. Research institutions were a useful source of information
for this literature review. The Institute of Medicine, the Brookings Institution, the Milken
Institute, the Rand Corporation, the Robert Woods Johnson Foundation, the Pew
Charitable Trust, the California Endowment, the Center for Collaborative Solutions, and
the Central Valley Policy Institute were all referenced. Also referenced is one U.S.
government report and several governmental websites including the Department of
Health and Human Services, the United States Department of Agriculture, and the Center
for Disease Control; 8 were cited. Eleven independent research studies were cited as was
one independent data website, (Mayo Clinic), and two newspapers.
Childhood Obesity Facts
The rate of childhood obesity in the United States has more than tripled since
1980 (Ogden, Carroll, Kit, & Flegal, 2014). For adolescents, this rate has grown four
times (National Center for Health Statistics, 2012). Out of twenty-three million children
aged two to nineteen, (31.7%), are obese or overweight (Center for Disease Control;
Oldgen et al., 2014). Over one half of the children who are obese today were overweight
when they were two years old. One fifth, or 20%, of American children are obese or
overweight by the time they are six (Office of the Surgeon General, 2010). For youth
ages twelve to nineteen, the obesity rate is 20.5% (Skinner & Skelton, 2014).
Childhood obesity occurs when a child is far above the average weight for his or
her height and age. Obesity is defined as having an excessively high percent of body fat

Childhood Obesity in the U.S. 4
or adipose tissue in relation to lean body mass (Stunkard & Wadden, 1993). The body
mass index, (BMI), is a screening tool for determining whether a child is obese or
overweight. Height, weight, age, and gender are all factors in BMI calculations:
The Center for Disease Control and Prevention (CDC) considers a child
overweight if he or she ranks from the 85th to the 95th percentile of children his or
her age, and obese if he or she ranks equal to or greater than the 95th percentile
(CDC, 2015). A child over two years of age is considered severely obese when they
have a BMI at least 20% higher than 95% of children with the same age and gender.
Severe childhood obesity in the U.S. increased 300% from1976-‐2005 (Flores, 2005).
Childhood obesity rates grow with age. Between 2011-2002, the obesity rates
were as follows: children aged two to five, 8.4%, children six to eleven, 17.75% and
adolescents aged twelve to nineteen, 10.5% (Ogden, et al., 2014). Childhood obesity for
those aged two to nineteen is more prevalent among African Americans, and Mexican
Americans ethnic groups. From 2011-2012, obesity disparities among these population
segments were as follows: 42.5% of Hispanic youth were obese, 47.8% of non-Hispanic
black youth were obese, and 32.6% of white youth were obese.
BMI = ( !"#$%& !" !"#$%&(!"#$%& !" !"#$%&)!(!"#$%& !" !"#$%&)
) x 703

Childhood Obesity in the U.S. 5
Table 1. Obesity Rates Among Black, Hispanic, and White youths aged 2-19.
Year Black Hispanic White
1999 - 2002 34.9% 32.6% 29.4%
2003 -2004 45% 38.8% 30.6%
2011 - 2012 47.8% 42.5% 32.6%
Source: Wang & Beydoun, 2007.
There is a critical need for obesity interventions in childhood. Obese adolescents
are significantly more likely to be severely obese adults (Suchindran, North, Popkin, &
Gordon-Larsen, 2010). An adult is considered severely obese, also referred to as
morbidly obese, when he or she is 100 pounds or more overweight. Obese children are
more likely to be obese adults (Freedman, Kettel, Serdula, Dietz, Srinivasan, & Berenson,
2005). However, this likelihood is not uniform across ethnic groups. In the Bogalusa
Heart Study, 83% of obese Black children and 68% of obese White children became
obese adults (Freedman, et al., 2005).
Obesity among children aged two to four is more prevalent in households with an
income-to-poverty ratio of 100% or less. The income–to-poverty ratio reflects a family’s
income in relation to the poverty threshold (May, Freedman, Sherry, & Blanck, 2013).
Table 2 shows the prevalence of obesity for various levels of low-income households.
Table 2. Obesity Rates of Children Related to Poverty Level
Income-Poverty Level Measure Percentage of Obese Children
Less than or equal to 50% 14.2%
51-100% 14.5%

Childhood Obesity in the U.S. 6
101-130% 13.4%
131-150% 12.4%
151-185% 11.8%
Source: Wang & Beydoun , 2007
Finkelstein and Mr. Bilger (2012), found that childhood weights are not
positively affected until a household is five times below the federal poverty level, which
represents 18.9% of American youths. Their findings state that even if the income
quadrupled for those 18.9% children, they would not experience a substantial change in
obesity rates.
Obesity rates for children have remained the same for the past ten years, while
obesity among low-income children aged two to four declined for the first time in years
and extreme obesity decreased in all racial groups except American Indians (Pan, Blanck,
Sherry, Dalenius, & Grummer-Strawn, 2012). One possible explanation is that adults are
consuming less fast food. In 2007-2008 fast food consumption was 12.8% of total food
consumption and in 2009-2010 it declined to11.3% (Rehm, & Drewnowski, 2015). There
are no recent comparable data for children’s consumption of fast food.
Health Complications of Childhood Obesity Obese children and teens are at a higher risk for developing serious illnesses
including heart disease, Type 2 diabetes, osteoarthritis, and stroke (Office of the Surgeon
General, 2010), along with various types of cancer including breast, colon, gall bladder,
kidney, endometrium, pancreas, thyroid, endometrium, esophagus, Hodgkin’s lymphoma,
thyroid, ovary, myeloma, cervix, and prostate (Kushi, Byers, Doyle, Bandera,
McCullough, & Gansler, 2006). Other health complications include metabolic syndrome,

Childhood Obesity in the U.S. 7
high cholesterol and high blood pressure, asthma, sleep disorders, nonalcoholic fatty liver
disease, (NAFLD), and early puberty or menstruation. The social and emotional
complications of childhood obesity include low self- esteem and bullying, behavior and
learning problems, and depression (Mayo Clinic Staff).
Socioeconomic Implications
The physical suffering that obese people incur over a lifetime due to obesity
related illnesses is not the only price paid for the epidemic. The human and economic
costs of childhood obesity are significant and have wide-ranging socioeconomic
repercussions. Obesity drastically increases the occurrences of preventable chronic
diseases. Annual obesity-related healthcare direct costs are an estimated $192 billion
(Cawley & Meyerhoefer, 2012). The total cost of childhood obesity is estimated at
around $14 billion per year, which very likely will lead to higher lifetime healthcare costs
(Marder, Chang Wang, & Chyen, Lee, 2010). Research by the Milken Institute shows
that the leading risk factor of chronic disease is obesity (DeVol, Bedroussian, Charuworn,
Chatterjee, Kim, & Klowden, 2007). Their analysis concludes that if by 2030, the United
States could bring obesity rates back to 1998 levels, healthcare spending would decrease
by $60 billion and productivity would increase by $254 billion (DeVol, et al., 2007). One
half of the U.S. adult population suffers from at least one chronic disease (Nolte &
McKee, 2009). Obesity related chronic illnesses make up 75% of total annual healthcare
costs in the Untied States (Chatterjee, Kubendran, King, & Devol, 2014). By 2011, the
national obesity rate is forecasted to reach 29.9%, and the total healthcare costs
associated with obesity is expected to reach 20% of the U.S. gross domestic product
(Chatterjee et al., 2014).

Childhood Obesity in the U.S. 8
The costs of obesity driven chronic illnesses extend beyond human suffering and
healthcare costs. A healthy workforce is a more productive workforce, which is essential
to growth and a strong economy. An unhealthy workforce negatively affects labor
productivity (Chatterjee et al., 2014). Presenteesim (lower production while at work)
related to obesity costs U.S. employers on average $506 per obese person per year
(Gates, Succop, Brehm, Gillespie, & Sommers, 2008; Chapman, 2008). Obese men and
women miss more days of work than their non-obese counterparts (Aldana & Pronk,
2001). Obese employees have 21% higher health care costs (Anderson,Whitmer, &
Goetzel, 2000), and make a higher number of worker compensation claims (Østbye,
Dement, & Kraus, 2007). General Motors estimates that it pays $1,500 in healthcare costs
for employees and retirees for every car it manufactures. This is more than the cost of the
steel to produce one car. The buyer absorbs these additional costs by the price they pay
for the vehicle. For example, in 2005, General Motors claimed that their mounting
healthcare costs were an influence in their decision to cut 25,000 jobs. This job reduction
impacted 175,000 jobs in other sectors (Lazarus, 2005: Appleby & Carty, 2005). “ The
average fortune 500 company will spend as much on health care as they make in profit.
How can we possibly compete in the global economy with that kind of burden?” (Stern,
2006).
Research from the Brookings Institution found that the total societal lifetime cost,
in 2013 dollars at a discount rate of 3%, of an obese person to be $92,235.00 higher than
those of a non-obese person. They predict that if the 12.7 million children carry their
obesity into adulthood, the total societal costs of their combined lifetimes could exceed
$1.1 trillion. (Kasman, Hammond, Werman, Mac-Crane, & McKinnon, 2015). Obese

Childhood Obesity in the U.S. 9
people die up to 14 years earlier than non-obese people, (Fontaine, Redden, &Wang,
2010; Hammond & Levine, (2010); Printz, 2014). The Brookings Institution research
finds that lifetime costs of obesity are not nearly covered by shorter life expectancy
(Kasman et al., 2015).
The public health crisis of obesity causes human suffering in the form of disease
and social discomfort. The economic effects of obesity spill over to the rest of the
economy, primarily in the form of higher health care costs and reduced labor
productivity. While the epidemic seems to have stopped growing at the fast rates of the
past, our society and economy stand to gain significant socioeconomic benefits and cost
savings if we are able to reduce the prevalence of childhood obesity in the United States.
Areas of Intervention
A focused national effort is essential to successfully combat childhood obesity in
the United States. The initiatives in place are multi-sectored and cover a variety of
environments. Local and state governments, and non-profit organizations partner with
communities to create a healthier culture. Childhood anti-obesity incentive programs are
directed toward the major factors contributing to obesity. Interventions are focused on
areas where children live, work and play. This section examines selected cases that
address the areas of community access to healthy affordable foods, healthy school
environments, and built environments that facilitate access to safe physical activity as
strategies to reduce childhood obesity rates in the U.S.
Access to Healthy Foods
The 2010 White House Task Force Report on Childhood Obesity determined that
there is a positive relationship between a lack of access to healthy, affordable foods and

Childhood Obesity in the U.S. 10
higher levels of obesity. Neighborhoods and communities that lack availability of
affordable healthy food choices are referred to as food “deserts”. According to the Task
Force report, food deserts create food insecurity in some instances and that food insecure
children are hungry more often than children in food secure homes. The same report
claims that there is now research suggesting that hunger can lead to obesity (2010). In
food insecure homes, family members lack access to enough food to maintain an active,
healthy lifestyle. It is estimated that 14.3% of American households experienced food
insecurity in 2013, (Coleman-Jensen, Gregory, & Singh, 2014). An estimated 29.7
million lower-income people, representing 9.7% of the total U.S. population, live over a
mile away from a supermarket (Ploeg, Michele, Breeman, Dutko, Williams, Snyder,
Dicken, & Kaufman, 2010). People in communities that lack access to grocery stores tend
to rely on convenience stores or smaller stores that do not sell affordable, high quality,
fresh food (Plog, Brenman, Farrigan, Hamrick, Hopkins, Kaufman, Lin, Nord, Smith,
Williams, Kennison, Orlander, Singh, & Tuckermanty, 2009).
The availability of local grocery stores may contribute to a healthier diet and
healthier body weight (Lamichhane, Puett, Porter, Bottai, Mayer-Davis, & Liese, 2012;
Swinbrun, Egger, & Raza, 1999). Similarly, the close proximity of supermarkets is
associated with a lower prevalence of obesity (Lamichhane, et al.; Morland, Diez-Roux,
& Wing, 2006). Those who live closer to grocery stores have healthier diets including
more fruits and vegetables, (Larson, Story, & Nelson, 2009; Rose & Richards, 2004) and
a healthier diet may prevent obesity or lower its occurrence (Keener, Goodman, Lowry,
Zaro, Kettel, & Kahn, 2009). One study concluded that having supermarkets in close

Childhood Obesity in the U.S. 11
proximity to communities is an effective strategy to fight the obesity epidemic
(Drenowski, Aggarwl, Hurvitz, Monsivais, & Moudon, 2012).
However, a study by the Rand Corporation found that distance to a supermarket
had no affect on BMI because residents did their food shopping outside of their local
communities (Dubowitz, Zenk, Ghosh-Dastidar, Cohen, Beckman, Hunger, Steiner, &
Collins, 2014). Another study found that the price , rather than access, of foods was a
more important factor contributing to unhealthy body weight. Lear, Gasevic, and
Schuurman (2013), determined that there is a direct negative relationship between
grocery total prices at checkout and the shoppers BMI. This study suggests manipulating
food prices could be a more effective intervention than providing access to healthy
affordable foods The authors also indicate that interventions in a child’s school, outdoor,
or food access environment are not enough to combat the obesity epidemic without
thoughtful financial incentives (Lear, Gasevic, & Schuurman, 2013). . Finkelstein and
Bilger recommend a tax/subsidy policy aimed to incentivize families, schools and
governments, (Finkelstein & Bilger, 2012). A 2010 American Institute of Nutrition study
supports a tax/subsidy policy of taxing unhealthy, calorie-dense foods at a higher rate
healthier selections and lowering the price of healthy foods through government subsidies
(Powell, Han, & Chaloupka, 2010).
The School Environment
Because children and teens spend most of their day in school, it is important to
focus on that environment as a means to reduce obesity rates. Children and teens
consume close to 50% of their daily calorie intake in school (Briefel, Wilson, & Gleason,

Childhood Obesity in the U.S. 12
2009). Nutritious school meals are likely to reduce the prevalence of obesity. This is
more pronounced in children who receive free or reduced-priced school lunches (Taber,
Chriqui, Powell, & Chaloupka, 2013). This is particularly effective because children from
lower income households have a 2.3% higher rate of obesity (Ogden, et al., 2014). In the
2012-2013 school year, 30.7 million children participated in a daily school lunch
program; 21.5 million, or 70%, received free or reduced-priced lunches (Woo, Hewins,
Bruke, Fitzsimons, 2015). During that same year, 13.2 million children ate school
breakfast; 11.2 million, or 85%, received a free or reduced price (Woo, et al., 2015).
Research indicates that children and teens do not drink enough water and are
drinking higher calorie, beverages instead (Patel et al., 2011). Drinking sufficient
amounts of water can contribute to maintaining a healthier weight (Patel, & Hampton,
2011). The United States Department of Agriculture (USDA), requires that schools
participating in the National School Lunch Program (NSLP), provide free, unflavored
drinking water to schoolchildren wherever lunches are served.
Programs intended to increase physical activity in children are often focused in
schools. The Institute of Medicine studied school programs that aim to provide physical
activity and made recommendations on how to improve the outcomes of those programs.
In their report, Educating the Student Body. Taking Physical Activity and Physical
Education to School, the Institute of Medicine made 6 recommendations:
• Children should have 60 minutes of physical activity during school hours.
• When creating all school policy decisions, take into consideration the need
for physical exercise.
• Make physical education a core subject.

Childhood Obesity in the U.S. 13
• Monitor physical activity and create data for evaluation and examination.
• Train teachers to teach the benefits of physical exercise and education across
the curriculum.
• Insure there is no ethnic, gender, education level, or personal characteristics
disparities in access to physical activity and physical education (Institute of
Medicine Staff, 2013).
After-school programs are important contributors to physical activity in children
(Trost, Rosenkranz, & Dzewaltowski, 2008). After-school programs can lead children to
the path of more productive, healthier lives (Geishirt, Hinkle, Casey, Miller, Samuels,
Schwarte, & Stiffler, 2009).
The Built Environment
Built environments are man-made, socially constructed surroundings that provide
a setting for human activity. A report by the National Physical Activity Plan Alliance and
the American College of Sports Medicine found that only 42% of children ages 6-11 and
8% of children ages 12-15 meet the recommended amount of 60 minutes of physical
activity daily. This report finds that only 25% of children ages 6-15 meet the
recommended 60 minutes of daily exercise (National Physical Activity Plan staff, 2014).
Communities that do not have the spaces to safely walk around, ride bikes, and play
outside are contributing factors to sedentary lifestyles of children. Sedentary behavior
refers to activities that do not take energy expenditure. Sedentary behavior is defined as
any behavior with an energy expenditure ≤ 1.5 metabolic equivalents, (METs) while
being in a sitting or reclining posture (Pate, O’Neill, & Lobelo, 2008).
Policies that designate safe routes for cycling or sidewalks for walking to and

Childhood Obesity in the U.S. 14
from school offer children the opportunity for increased physical activity. The Safe
Routes National Center for Safe Routes to School has programs throughout the United
States. Parents, schools, and local, state and federal governments support their programs.
One study states that urban planning that encourages physical activity is an effective
method of addressing the obesity epidemic (Day, 2006).. In addition, the author
highlights the importance of active planning in areas where obesity rates are higher and
income levels are lower (Day, 2006). Some communities have made arrangements to
keep school playing fields and other recreational areas open for longer hours. In 2004 the
National Complete Streets Coalition was formed. This coalition supports the design of
safe communities that enable the residents to spend time outside walking, running,
biking, playing on playgrounds or relaxing in parks. Offering the opportunity for free and
local physical activity promotes a healthier lifestyle for children. The study, “Walking,
Obesity and Urban Design in Chinese Neighborhoods”, presented evidence that a built
environment, which is conducive to walking, increases the amount of walking time that
residents walk (Alfonzo, Guo, Lin, Day, (2014).
Case Study I
The first Case Study included in this report is the Healthy Eating, Active
Communities (HEAC) program. HEAC was a five-year initiative launched in 2005 by
The California Endowment Foundation. The mission of HEAC was to create
environments and policies that change the social determinants that contribute to
childhood obesity. HEAC combined the strength of community involvement, including

Childhood Obesity in the U.S. 15
youth ambassadors, with local institutions to work toward the common goal of lowering
obesity rates among children and increasing overall health of communities and regions.
HEAC worked in selected California neighborhoods that had the highest rates of
childhood obesity. Interventions were specific to each community’s needs. HEAC
maintained a strong focus on school and after school programs for school children
because after school programs in California serve almost one million low-income
children; creating the possibility for effective anti-obesity prevention (Fletcher, 2010).
Other areas of HEAC intervention included neighborhood design, healthcare and
marketing/advertising. The HEAC pilot project was located in six ethnically diverse, low-
income communities: Oakland, South Shasta, Baldwin Park, South Los Angeles, Santa
Ana, and Chula Vista. These communities span 4 school districts. The California
Endowment funding went equally to all six communities and was directed toward the
environments that affect childhood obesity rates: school/after-school,
marketing/advertising, and the built environment.
HEAC methods include:
• Encouraging schools to adopt healthier food selections in accordance. with the
state nutrition standards for schools, (SB12).
• Encouraging schools to adopt healthier beverages in accordance with the state
beverage standards, (SB965).
• Promoting the nutrition standards of California state for childcare programs.
• Supporting local policy that limits food and beverage marketing and
advertising to children.

Childhood Obesity in the U.S. 16
• Implementing sugary drink bans.
• Partnering with grass roots community groups.
• Educating communities on the benefits of breast-feeding.
• Implementing programs that enable better access to healthcare.
The HEAC initiative was independently evaluated at the midpoint and the
endpoint of the projects. The evaluation team included, Dr. Robert C. from University
California Berkeley, Samuels & Associates, University of California Los Angeles Kaiser
Permanente Center for Health Equity, Veronica Atkins Center for Weight and Health,
Field Research, Inc. and Abundantia Consulting. Their findings are presented next.
Participating school food and beverage outcomes:
• Adherence to the state competitive food standards increased by 38% by
the end of the program in 2010.
• Adherence to the state competitive beverage standard increased by 46%.
• Healthier food options in schools were offered to 885,000 students.
• The increase in food sales covered the loss of sales of less healthier food
and beverage options.
• All but four participating schools discontinued serving chips and cookies
with the prepared meals.
• Adherence to the state snack foods standard increasd by 26% by the end of
the program.
• Adherence to the state beverage food standard increased by 10%.
• Policy guidelines were amended to require all after school programs to
adhere to the state snack and beverage standards.

Childhood Obesity in the U.S. 17
HEAC communities added thirteen farmers’ markets and produce stands.
Residents were able to pay with Supplemental Nutrition Assistance Program, WIC
coupons and electronic benefits transfers (formerly Food Stamps) at some of the of the
participating farmers’ markets and produce stands, thereby giving lower-income residents
access to healthy fresh foods.
HEAC worked to influence local food stores in the inventory they carry and what
they advertise. From 2007-2009, the percent of healthy food advertising to unhealthy
food advertising increased from 15%-46%. Only minor improvements were shown in the
increase of healthy food offerings.
HEAC was successful at teaching physical education (PE) teachers to focus on the
importance of higher activity levels during PE class. The state education code and the
CDC recommend that 50% of PE class time be spent doing moderate to vigorous physical
activity (MVPE). Participating schools improved somewhat in this area moving from 6 to
10 schools in compliance. More improvement is needed. Community advocates, policy
makers and schools have now made MVPE in PE class their focus. After school
programs increased the time their students were active. The HEAC after schools add an
average of 42 minutes of physical activity daily.
Access to safe parks, mixed-use spaces and policy directed toward a healthier
built environment showed small improvement. These initiatives will likely take more
time to take hold and to show measurable change in residents’ physical activity related to
the improved access.
At the onset of the HEAC initiative, healthcare providers were hesitant to discuss
obesity with children and parents. The HEAC training gave healthcare providers the

Childhood Obesity in the U.S. 18
motivation and tools to have these necessary discussions. By the end of the HEAC
initiative, the percentage of healthcare providers taking BMI measurements in their
clinical practices increased from 43%-68%. All of the healthcare providers within the
HEAC communities reported higher rates of obesity prevention advocacy.
From the program outcomes, we can conclude that the HEAC initiative was
successful in making healthy affordable foods available, providing increased access to
areas that are conducive to physical activity, and increasing awareness of the benefits of a
healthy lifestyle in the communities it served. The HEAC initiatives lead to state policy
changes that facilitate urban planning to include safe available outdoor activity spaces
and the availability of affordable healthy food. HEAC was not able to become self-
sustaining after the pilot initiative but programs like Public Matters and Market
Makeover are active in the same areas of Los Angeles and are carrying on the HEAC
model of policy-driven community based approach to obesity prevention.
Case Study II
The second case study examined in this report is the Central California Regional
Obesity Prevention Program (CCROPP). The College of Health and Human Services at
California State University Fresno, teamed with the Central California Public Health
Partnership to identify the need for intervention in the obesity epidemic of the central
region of California. The California Endowment developed CCROPP in 2006. The $10
million regional pilot program ran from 2006-2010. CCROPP was administered by
California State University Fresno’s Central California Center for Health and Human
Services under the oversight of the Central California Public Health Partnerships.

Childhood Obesity in the U.S. 19
CCROPP is funded by The James Irvine Foundation, The Robert Wood Johnson
Foundation, and The California Endowment.
The Central California Regional Obesity Prevention Program was designed to
address the social determinants that contribute to the high rates of childhood obesity and
their related illnesses in the San Joaquin Valley region of California. The CCROPP
mission is to change the political and environmental constraints in underserved counties.
CCROPP has a central hub that coordinates efforts with regional and community public
health organizations. From this structure, relationships are formed with grassroots
community members, local and regional policy makers, parents, teachers, schools, local
merchants, farmers, city planners, local law enforcement, and local businesses. Their
mutual goal is to create sustainable regional and community infrastructures that support
physical activity and healthy eating.
In 2010, the California childhood obesity rate was 38%, which is 6% higher than
the national average (Babey, Wolstein, Diamant, Bloom, & Goldstein 2011; CDC).
CCROPP operated in eight counties within the San Joaquin Valley that had high rates of
childhood obesity. Table 3 presents the childhood obesity rates of the CCROPP counties.
Table 3. The 2010 Childhood Obesity Rates within the CCROPP Communities
County Fresno Kern Kings Madera Merced San Joaquin Stanislauss Tulare
% Obese 40.41 41.43 45.11 44.71 44.50 39.29 41.60 43.03
Source: Babey et al. 2011.
These agricultural counties are primarily inhabited by poor Hispanic immigrants
and migrant workers, (Bengiamin, Capitman, & Chang, 2010). Public health outcomes in
these counties are worse than in the others in California and in the United States as a

Childhood Obesity in the U.S. 20
whole (Bengiamin, Capitam, Paul, Riordan, Curtis, 2010). CCROPP has established
partnerships with public health departments, community organizations, and grassroots
leaders. CCROP uses a regional model of environmental and policy change. The areas of
intervention by CCROPP include community access to healthy foods, school foods and
beverages, and the built environment. CCROPP methods of fostering healthier
communities include:
• Encouraging small community stores to stock healthy food and beverage
selections.
• Expanding supplemental nutrition programs for infants, children and women
(WIC).
• Bringing Farmers markets, produce stands, community gardens and farm to
school programs into low-income communities.
• Shifting policies to enable residents to pay with food stamps at farmers
markets.
• Promoting the adaptation of universal school breakfast programs.
• Limiting access to sugary beverages in school environments.
• Supporting increased levels of physical education and physical activity in
schools and in after-school programs.
• Collaborating with school officials to keep schools open after hours and on
weekends so the community can use their amenities to stay active.
• Establishing better and safer walking and biking routes, walking trails, parks,
and other outdoor areas that encourage physical activity.
• Creating media campaigns that encourage healthy eating and exercise.

Childhood Obesity in the U.S. 21
At the end of the CCROPP initiative, community awareness of the need to focus
on the factors contributing to the high rates of childhood obesity was high. 53% of the
CCROPP community residents believe that policy measures supporting healthy food
environments is very important. The details community support can be seen in table 4.
Table 4. HEAC and CROPP
Resident Support of Policy Measures Supporting Healthy Eating and Physical Activity
Policy Focus Support
Making parks, streets, sidewalks, and playgrounds safe 96%
Keeping parks and public open spaces clean 97%
Improving access to walking and biking paths 89%
Requiring joint use of school facilities to the community for after hour
use of physical activity areas 86%
Changing infrastructure to reduce the need for a car 83%
Adding more farmers’ markets 76%
Creating community gardens 79%
Attracting supermarkets to smaller, low-income communities 72%
Using soda tax revenues to support childhood anti-obesity programs 69%
Source: Samuels & Associates, 2010
Local health providers in HEAC and CROPP sites are more committed to obesity
prevention. They have become powerful advocates of healthy food and built
environments on the local and regional level. Both HEAC and CROPP initiatives
recognize the importance of youth engagement in rebuilding and redirecting the health of

Childhood Obesity in the U.S. 22
their community. From the community level, information moved to the regional level,
which then had the power to influence state policy, and possibly federal policy. The
HEAC and CCROPP bottom-up development model can be replicated by grass roots
organizers in marginalized, low-income African American, Latino, and American Indian
communities with high rates of childhood obesity throughout the country. Their model
framework for using policy and environment to prevent childhood obesity includes:
• Engaging both public and private community, regional, and state sectors in
interventions.
• Maintaining a strong focus on community and youth engagement.
• Facilitating collaboration of community and institutional stakeholders to
create larger impact and sustainability.
• Implementing policy strategies on a local and state level.
CCROPP became self-sustaining after the funding and the initiative ended and
remains a vibrant powerful program.
Conclusion
In 2010, when the Healthy Eating Active Communities and the Central California
Regional Obeisty program initiative ended the U.S. Government created the Healthy,
Hunger-Free Kids Act of 2010 (Turner, Chaloupka, 2015). In the same year, the U.S.
Department of Agriculture updated the national nutrition standards for school meals and
required implementation during the 2012-2013 school year. These standards require
schools to offer more fruits and vegetables, whole grain products and low-fat or fat-free
milk. Since these updated standards went into place, more elementary are serving more
healthy foods and fewer unhealthy foods in their lunches (Turner, et al., 2015). The
Childhood Obesity in the U.S. 23
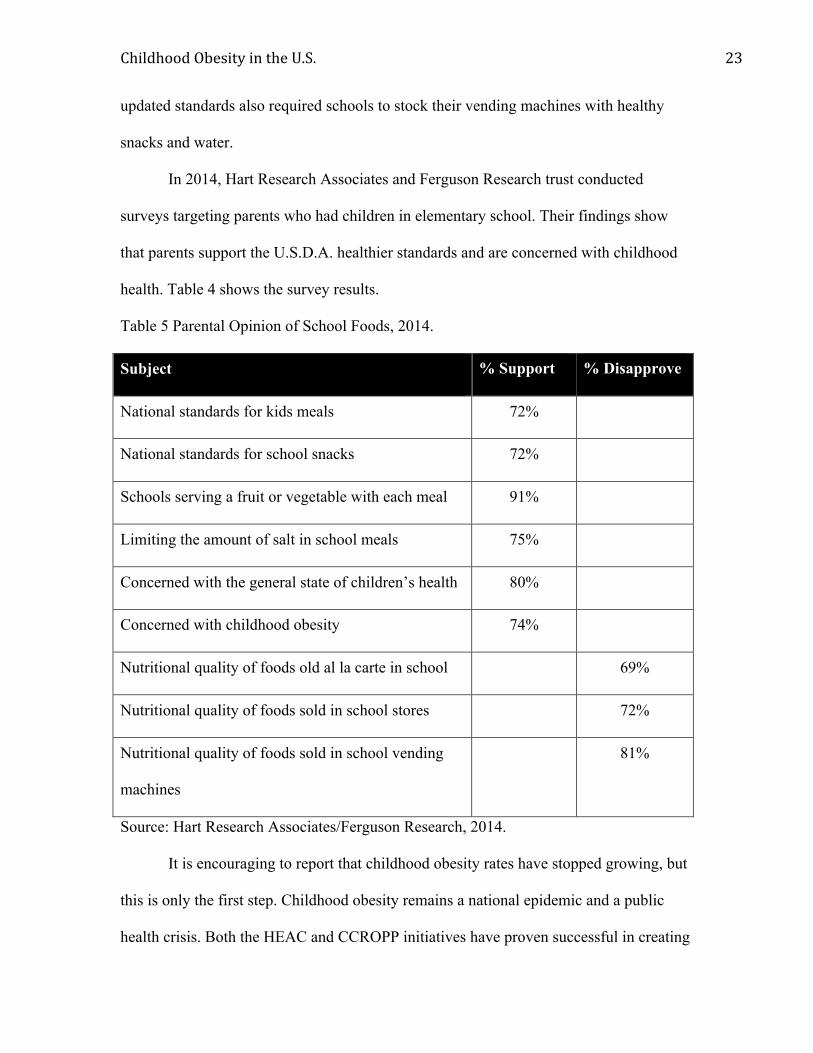
updated standards also required schools to stock their vending machines with healthy
snacks and water.
In 2014, Hart Research Associates and Ferguson Research trust conducted
surveys targeting parents who had children in elementary school. Their findings show
that parents support the U.S.D.A. healthier standards and are concerned with childhood
health. Table 4 shows the survey results.
Table 5 Parental Opinion of School Foods, 2014.
Subject % Support % Disapprove
National standards for kids meals 72%
National standards for school snacks 72%
Schools serving a fruit or vegetable with each meal 91%
Limiting the amount of salt in school meals 75%
Concerned with the general state of children’s health 80%
Concerned with childhood obesity 74%
Nutritional quality of foods old al la carte in school 69%
Nutritional quality of foods sold in school stores 72%
Nutritional quality of foods sold in school vending
machines
81%
Source: Hart Research Associates/Ferguson Research, 2014.
It is encouraging to report that childhood obesity rates have stopped growing, but
this is only the first step. Childhood obesity remains a national epidemic and a public
health crisis. Both the HEAC and CCROPP initiatives have proven successful in creating

Childhood Obesity in the U.S. 24
models that improve the quality of food served in school and in after school programs
and physical exercise, provide safe streets, parks, sidewalks, and mixed-use
environments, along with facilitating access to affordable healthy foods. Policy
leadership from the community, state, and federal level should acknowledge and support
the community-driven efforts to prevent childhood obesity. For profit and not for profit
organizations should support community-driven programs like HEAC and CCROPP.
When designing policy, local, state, and federal governments should consider creative
uses of financial incentives as a key tool to reduce the incidence of childhood obesity in
the United States.

Childhood Obesity in the U.S. 25
References
Aldana, S., & Pronk, N. (2001). Health promotion programs, modifiable health risks, and
employee absenteeism. Journal of Occupational Environmental Medicine, 43(1),
36-46.
Alfonzo, M., Guo, Z., Lin, L., Day, K. (2014). Walking, obesity and urban design in
Chinese neighborhoods. Journal of Preventive Medicine 69, s79-s85.
Appleby, J., & Silke Carty, S. (2005, June 24). Ailing GM looks to scale back generous
health benefits. USA Today.
Anderson, D., Whitmer, R., Goetzel, R., Ozminkowski, R., Dunn, R., Wasserman, J., &
Serxner, S. (2001). The relationship between modifiable health risks and group-
level health care expenditures. Health Enhancement Research Organization
(HERO) Research Committee. American Journal of Health Promotion, 15(1), 45-
52.
Babey, S., Wolstein, J., Diamant, A., Bloom, A., & Goldstein, H. (2011). A patchwork of
progress. Changes in overweight and obesity among California 5th, 7th, and 9th
graders, 2005-2010.
Bengiamin, M., Capitamna, J, Paul, C.M., Riordan, D.G., & Curtius, K.A. (2005).
Healthy People 2010, A 2005 Profile of Health Status in the San Joaquin Valley.
Central Valley Health Policy Institute, California State University Fresno.
Briefel, R., Wilson, A., Gleason, M., & Wilson, A. 2009). Consumption of low-
nutrient,energy-dense foods and beverages at school, home, and other locations
among school lunch participants and nonparticipants. Journal of the Academy of
Nutrition and Dietetics, 109(2), S79-S90.

Childhood Obesity in the U.S. 26
Cawley, J., & Meyerhoefer, C. (2012). The medical care costs of obesity: An instru-
mental variables approach. The Journal of Health Economics, 31(1), 219-230.
CDC (2012). Childhood obesity facts prevalence of childhood obesity in the United
States, 2011-2012. CDC.gov. Retrieved February, 5, 2015
CDC. (n.d.). Healthy weight – it’s not a diet, it’s a lifestyle! Retrieved February 12, 2015.
Chapman, L. (2005). Presenteeism and its role in worksite health promotion. American
Journal of Health Promotion, 19(4), 1-8.
Chatterjee, A., Kubendran, S., King, J., & Devol, R. (2104). Checkup time: chronic
disease and wellness in America – charting a new course to save lives and
increase productivity and economic growth. Milken Institute Review, 618, 7-15.
Coleman-Jensen, A., Gregory, C., & Singh, A. (2014). Household Food Insecurity in the
United States in 2013. United States Department of Agriculture, Economic
Research Service, ERR-173.
Day, K. (2006). Active living and social justice: Planning for physical activity in low
income and black and Latino communities. Journal of the American Planning
Association, 72(1): 88-99.
DeVol, R., Bedroussian, A., Charuworn, A., Chatterjee, A., Kim, K., Kim, S. &
Klowden, K. (2007). An unhealthy America: The economic burden of chronic
disease. Charting a new course to save lives and increase productivity and
economic growth. Milken Institute Publications, 2.
Drewnowski A., Aggarwal A., Hurvitz P.M., Monsivais P, & Moudon A.V. (2012).
Obesity and Supermarket Access: Proximity or Price? American Journal of Public
Health. 102(8), 74-80.

Childhood Obesity in the U.S. 27
Dubowitz, T., Zenk, S., Ghosh-Dastidar, B., Cohen, D., Beckman, R., Hunter, G.
Steiner, E., Collins, R., 2014. Public Health and Nutrition, DOI:
http://dx.doi.org/10.1017/S1368980014002742. Retrieved February, 2015.
Finkelstein, E., Bilger, M., (2012). Hard truths and a new strategy for addressing
childhood obesity. Childhood Obesity, 8(2), 106-108.
Fletcher, A.J. (2010). Combating the childhood obesity crisis: After school programs,
The socioecological model, and the health behaviors initiative. Three case
Studies. Sacramento: CA Center for Collaborative Solutions; California
Afterschool Network.
Flores, G. (2005). Factors predicting severe childhood obesity in kindergarteners.
International Journal of Obesity, 37(1), 31-39.
Fontaine K.R., Redden D.T., & Wang C., (2010). Years of life lost due to obesity.
Journal of the American Medical Association, 289(2):187–193.
Freedman D.S., Kettel L., Serdula M.K., Dietz W.H., Srinivasan S.R., & Berenson G.S.
(2005). The relation of childhood BMI to adult adiposity: the Bogalusa Heart
Study. Pediatrics, 115(1), 22-27.
Freedman, D.S., Khan, L., Serdula, M., Dietz, W. Srinivasan S., & Berenson, G.
(2005).Racial differences in the tracking of childhood BMI to adulthood. Obesity
Research, 13(5), 928-935.
Gates, D., Succop, P., Brehm, B., Gillespie, G., & Sommers, B. (2008). Obesity and
presenteeism: the impact of body mass index on workplace productivity. Journal
of Occupational Environmental Medicine 50(1), 39-45.

Childhood Obesity in the U.S. 28
Geishirt, B., Hinkle, A., Casey, M., Miller, J., Samuels, S.E., Schwarte, L., & Stiffler, K.
(2009). Promoting healthier after school environments: Opportunities and
challenges. Los Angeles: The California Endowment.
Guo, S., & Chumlea, W. (1999). Tracking of body mass index in children in relation to
Overweight in adulthood. American Journal of Clinical Nutrition, 70(1), 145-148.
Heart Research Associates, Ferguson Research (2014). Nationwide polling regarding
parents’ views of school meal and smart snack standards. The Pew Charitable
Trusts, the Robert Wood Johnson Foundation, & the American Heart Association.
Institute of Medicine Staff (2013). Educating the student body. Taking physical activity
and physical education to school. The Institute of Medicine of the National
Academies, 1-3.
Kasman, M., Hammond, R.A., Werman, A., Mac-Crane, A., & McKinnon, R.A., (2015).
An in-depth look at the economic cost of obesity. Brookings Institution, 1-29.
Keener, D., Kenneth, G., Kahn, K., L., Lowry, A. & Zaro S. (2009). Recommended
Community strategies and measurements to prevent obesity in the United States:
implementation and measurement guide. Department of Health and Human
Services, Centers for Disease Control and Prevention.
Kushi L., Byers T., Doyle C., Bandera E., McCullough M., & Gansler T. (2012).
American Cancer Society guidelines on nutrition and physical activity for cancer
prevention: reducing the risk of cancer with healthy food choices and physical
activity. CA: A Cancer Journal for Clinicians, 61(1), 30-67.

Childhood Obesity in the U.S. 29
Lamichhane, A.P., Puett, R., Porter, D.E., Bottai, M., Mayer-Davis, E.J., & Liese, A.D.,
(2012). Associations of built environment with body mass index and waist
circumference among youth with diabetes. International Journal of Behavioral
Nutrition and Physical Activity, 9(81), 217-224.
Larson, I., Story, T., & Nelson, C. (2009). Neighborhood environments: disparities in
Access to healthy foods in the U.S. American Journal of Preventative
Medicine,36(1), 74-81.
Lazarus, D. (2005). Costs of health dare drag America Down. The San Francisco
Chronicle. Retrieved April 1, 2015.
Lear, S., Gasevic, D. & Schuurman, N., (2013). Association of supermarkets with the
body mass index of their shoppers. Nutrition Journal, doi: 10.1186/1475-2891-
12-117. Accessed February 2015.
May, A., Freedman, D., Sherry, B., & Blanck, H. (2013). Obesity—United States, 1999-
2010. Morbidity and Mortality, 52(3), 120-128.
Mayo Clinic Staff (n.d.). Diseases and conditions childhood obesity complications.
Retrieved March 10, 2015.
Marder W., & Chang S. (2006). Childhood obesity: costs, treatment patterns, disparities
in dare, and prevalent medical conditions. Thomson Medstat Research Brief.
Morland, K., Diez-Roux, A.V., & Wing, S. (2006). Supermarkets, other food stores, and
obesity: the atherosclerosis risk in communities study. American Journal of
Prevantative Medicine, 30(4), 333-339.

Childhood Obesity in the U.S. 30
Nolte, E., & McKee, M. (2008). Measuring the health of nations: updating an earlier
analysis. Health Affairs, 27(1), 58-71.
Office of the Surgeon General (2010). The Surgeon General’s vision for a healthy and fit
nation. Rockville, MD, U.S. Department of Health and Human Services.
Ogden, C., Carroll, M., Kit, B., & Flegal, K. (2014). Prevalence of childhood and adult
obesity in the United States, 2011-2012. Jama, 311(8), 806-814.
Olshansky, J., Passaro, D., Hershow, R. Layden, J., Carnes, B., Brody, J., Hayflick,
L.,Butler, R., Allison, D., & Ludwig, S. (2005). A potential decline in life
expectancy in the United States in the 21st century. New England Journal of
Medicine, 352(11), 1138-1144.
Østbye, T., Dement, J., & Kraus, K. (2007). Obesity and worker's compensation. Results
from the Duke health and safety surveillance system. JAMA Internal Medicine,
167(8), 766-773.
Pang, L., Blanck, H., Sherry, B., Dalenius, K., & Grummer-Strawn, L. (2102). Trends in
the prevalence of extreme obesity among U.S. preschool-aged children living in
low-income families, 1998-2010. The Journal of the American Medical
Association, 308(24), 2563-2565.
Patel, I., & Hampton, E., 2011. Encouraging consumption of water in school and child
care settings: access, challenges, and strategies for improvement. American
Journal of Public Health,101(8),1370-1379.
Childhood Obesity in the U.S. 31
Plog, M.V., Breneman, V., Dutko, Williams R., Snyder, S., Dicken, C., & Kaufman,
P.(2010). Access to affordable and nutritious food: updated estimates of distance
to supermarkets using 2010 data, Err-143, U.S. Department of Agriculture,
Economic Research Service.
Plog,M.V., Breneman, V., Farrigan, T., Hamrick, K., Hopkins, D., Kaufman, P., Lin,
B.H., Nord, M., Smith, T., Williams, R., Kinnison, K., Olander, C., Singh,
A., & Tuckermanty, E. (2009). Access to affordable and nutritious food—
measuring and understanding food deserts and their consequences: Report to
Congress. ERR-036. United States Department of Agriculture, Economic
Research Service.
Powell, L.M., Han, E., & Chaloupka, F., (2010). Contextual factors, food consumption
and obesity among U.S. adolescents. The Journal of Nutrition, 140(6), 1175-
1180.
Printz, C. (2014). Extreme obesity may shorten life expectancy by up to 14 years.
Cancer, 120(23), 3591.
Rehm, C., & Drewnowski, A. (2105). Trends in energy intakes by type of fast food
Restaurant among U.S. children from 2003-2010. Journal of American Medicine
Pediatrics. Retrieved April 6, 2015.
Rose, D., & Richards, R. (2004). Food store access and household fruit and vegetable use
among participants in the U.S. Food Stamp Program. Public Health and
Nutrition7(8), 1081-1088.

Childhood Obesity in the U.S. 32
Samuels & Associates, 2010. Healthy Eating, Active Communities and Central
California Regional Obesity Prevention Program. Final Evaluation Synthesis
Report, 40-140.
Satcher, W. (2001). The Surgeon General’s call to action to prevent and decrease
Obesity. Washington, D.C.: U.S. government printing office.
Skinner, A., & Skelton, J. (2014). Prevalence and trends in obesity and severe obesity
among children in the United States, 1999-2012. Journal of American Medicine
Pediatrics, 561-566.
Stern, A. (2006). Horse-and-Buggy Health Coverage. Retrieved April 2, 2015.
Stunkard, A. & Wadden, T. (1993). Obesity: Theory and Therapy (Second ed.)
New York, New York: Raven Press.
Taber, D. R., Chriqui, J. F., Powell, L., & Chaloupka, F. J. 2013. Association between
state laws governing school meal nutrition content and student weight status:
implications for new USDA school meal standards. JAMA Pediatrics, 167(6),
513–519.
The, N., Suchindran, C., North, K., Popkin, B., & Gordon-Larson, P. (2010). The
association of adolescent obesity with risk of severe obesity in adulthood. Journal
of American Medicine, 304(18), 2042-2047.
Trost, S.G., Rosenkranz, R.R., Dzewaltowski, D. (2008). Physical activity levels among
children attending after-school programs, Medicine and Science in Sports and
Exercise, 40(4), 622-629.

Childhood Obesity in the U.S. 33
Turner, L., Chaloupka, F.J. (2015). Improvements In School Lunches Result in Healthier
Options for Millions of U.S. Children: Results from Public Elementary Schools
Between 2007-07 and 2013-14. A BIG Research Brief. Chicago IL: Bridging the
Gap Program, Health Policy Center, Institute for Health Research and Policy,
University of Illinois at Chicago.
U.S. Department of Agriculture and US Department of Health and Human Services
(2010). Dietary guidelines for Americans, 7th edition. Washington D.C. U.S.
government printing office. Retrieved January 25, 2015.
Wang, L., Chyen, D., & Lee, S. (2008). The association between body mass index in
adolescence and obesity in adulthood. Journal of adolescent health, 42(5),
512-518.
Wang, Y. & Beydoun, M.A. (2007). The obesity epidemic in the United States. Gender,
Age socioeconomic, racial/ethnic, and, geographic characteristics: A systematic
Review and meta-regression analysis. Epidemiology Review 29, 6-28.
White House Task Force on Childhood Obesity staff (2010). Solving the problem of
childhood obesity within a generation. White house task force on childhood
obesity, Report to the president,let’smove.gov. Retrieved January 28, 2015.
World Health Organization (WHO) staff. Global strategy on diet, physical activity, and
health. Childhood overweight and obesity. (n.d.). Retrieved February 20, 2015.
Woo, N., Hewins, J., Burke, M., &Fitzsimons, C., 2015. School breakfast scorecard:
2013-2014 school year. Food Research and Action Center.