List of Tables - nefsc.noaa.gov · List of Tables Table 1. Timeline of ... May. 2003 Framework 2...
30
List of Tables Table 1. Timeline of events influencing fishery management of monkfish. ....................................................... 24 Table 2. Management measures for monkfish, fishing years 2000-2013 ............................................................ 25 Table 3. Landings of monkfish as reported in NEFSC weighout data base (1964-1993) and vessel trip reports (1994-2009); General Canvas database, foreign landings from NAFO database areas 5 and 6. ........................ 26 Table 4. U.S. landings of monkfish (calculated live weight, mt) by gear type. .................................................. 27 Table 5. Landed weight of monkfish by market category for 1964-2011 for northern assessment area. ........... 28 Table 6. Landed weight of monkfish by market category for 1964-2011 for southern assessment area. .......... 29 Table 7. Revised discard estimates, monkfish live weight, northern management region. ................................ 30 Table 8. Revised discard estimates, monkfish live weight, southern management region.................................. 31 Table 9. Annual catch using (mt monks discarded / mt kept of all species) to estimate discards for dredges and shrimp trawls and (mt monks discarded / mt monks kept) to estimate discards for trawls and gillnets.............. 32 Table 10. Temporal stratification used in expanding landings and discard to length composition of the monkfish catch..................................................................................................................................................................... 33 Table 11. Survey results from NEFSC offshore autumn bottom trawl surveys in the northern management region (strata 20-30, 34-40) ................................................................................................................................. 34 Table 12. Survey results from NEFSC offshore spring bottom trawl surveys in the northern management region (strata 20-30, 34-40) ............................................................................................................................................ 35 Table 13. Survey results from ASMFC summer shrimp surveys in the northern management region (strata 1, 3, 5, 6-8) .................................................................................................................................................................. 36 Table 14. Monkfish indices from Maine-New Hampshire inshore surveys, strata 1-4, regions 1-5. ................. 37 Table 15. Survey results from NEFSC offshore autumn bottom trawl surveys in the southern management region (strata 1-19, 61-76) ................................................................................................................................... 38 Table 16. Survey results from NEFSC offshore spring bottom trawl surveys in the southern management region (strata 1-19, 61-76) .............................................................................................................................................. 39 Table 17. Survey results from NEFSC offshore winter bottom trawl surveys in the southern management region (strata 1-19, 61-76) .............................................................................................................................................. 40 Table 18. Survey results from NEFSC offshore scallop dredge surveys in the southern management region (shellfish strata 6, 7, 10, 11, 14, 15, 18, 19, 22-31, 33-35, 46, 47, 55, 58-61, 621, 631)..................................... 41 Table 19. Age length key used for estimating mean lengths at age and variation from ages in the spring, winter, 2001 & 2004 cooperative, and fall surveys. ........................................................................................................ 42 Table 20. Area swept expansions used for scaling the stratified number per tow indices for input to SCALE. . 43 Table 21. Northern area SCALE model runs summaries: residual sums of squares, input weights, effective sample sizes, and parameter estimates. ............................................................................................................... 44 v
Transcript of List of Tables - nefsc.noaa.gov · List of Tables Table 1. Timeline of ... May. 2003 Framework 2...

List of Tables Table 1. Timeline of events influencing fishery management of monkfish. ....................................................... 24
Table 2. Management measures for monkfish, fishing years 2000-2013 ............................................................ 25
Table 3. Landings of monkfish as reported in NEFSC weighout data base (1964-1993) and vessel trip reports (1994-2009); General Canvas database, foreign landings from NAFO database areas 5 and 6. ........................ 26
Table 4. U.S. landings of monkfish (calculated live weight, mt) by gear type. .................................................. 27
Table 5. Landed weight of monkfish by market category for 1964-2011 for northern assessment area. ........... 28
Table 6. Landed weight of monkfish by market category for 1964-2011 for southern assessment area. .......... 29
Table 7. Revised discard estimates, monkfish live weight, northern management region. ................................ 30
Table 8. Revised discard estimates, monkfish live weight, southern management region .................................. 31
Table 9. Annual catch using (mt monks discarded / mt kept of all species) to estimate discards for dredges and shrimp trawls and (mt monks discarded / mt monks kept) to estimate discards for trawls and gillnets .............. 32
Table 10. Temporal stratification used in expanding landings and discard to length composition of the monkfish catch ..................................................................................................................................................................... 33
Table 11. Survey results from NEFSC offshore autumn bottom trawl surveys in the northern management region (strata 20-30, 34-40) ................................................................................................................................. 34
Table 12. Survey results from NEFSC offshore spring bottom trawl surveys in the northern management region (strata 20-30, 34-40) ............................................................................................................................................ 35
Table 13. Survey results from ASMFC summer shrimp surveys in the northern management region (strata 1, 3, 5, 6-8) .................................................................................................................................................................. 36
Table 14. Monkfish indices from Maine-New Hampshire inshore surveys, strata 1-4, regions 1-5. ................. 37
Table 15. Survey results from NEFSC offshore autumn bottom trawl surveys in the southern management region (strata 1-19, 61-76) ................................................................................................................................... 38
Table 16. Survey results from NEFSC offshore spring bottom trawl surveys in the southern management region (strata 1-19, 61-76) .............................................................................................................................................. 39
Table 17. Survey results from NEFSC offshore winter bottom trawl surveys in the southern management region (strata 1-19, 61-76) .............................................................................................................................................. 40
Table 18. Survey results from NEFSC offshore scallop dredge surveys in the southern management region (shellfish strata 6, 7, 10, 11, 14, 15, 18, 19, 22-31, 33-35, 46, 47, 55, 58-61, 621, 631) ..................................... 41
Table 19. Age length key used for estimating mean lengths at age and variation from ages in the spring, winter, 2001 & 2004 cooperative, and fall surveys. ........................................................................................................ 42
Table 20. Area swept expansions used for scaling the stratified number per tow indices for input to SCALE. . 43
Table 21. Northern area SCALE model runs summaries: residual sums of squares, input weights, effective sample sizes, and parameter estimates. ............................................................................................................... 44
v

Table 22. Southern area SCALE model runs summaries: residual sums of squares, input weights, effective sample sizes, and parameter estimates. ............................................................................................................... 45
Table 23. Estimates of age-1 recruitment, biomass and fishing mortality rates from SCALE model final runs. 46
Table 24. (A). Mohn’s rho statistic for SCALE model retrospective patterns based on 7 peels. (B.) Adjustment factors for estimated population numbers at age based on age-specific retrospective patterns based on 7 peels. ............................................................................................................................................................................. 47
Table 25. Results of age-based yield-per-recruit analysis using M=0.3 and area-specific selectivity patterns estimated by SCALE model in 2007 (NEFSC 2007a), 2010 (NEFSC 2010), and 2013. .................................... 48
Table 26. Estimated biological reference points, biomass and F for monkfish in northern and southern management regions ............................................................................................................................................ 49
Table 27. Projected catch and biomass (mt) for the northern and southern monkfish management regions under A. Fthreshold, B. Fthreshold based on retrospective-adjusted SCALE model outputs, C. Fstatus quo (F2011 estimated by SCALE model, no retrospective adjustment) ...................................................................................................... 50
Table 28. Comparison of biomass projected under SAW 50 ACT scenario in 2010 with estimated biomass (2010, 2011) and projected biomass (2013-2016) from updated SCALE models (unadjusted for retrospective) under Fstatus quo scenarios. ...................................................................................................................................... 51
vi

Table 1. Timeline of events influencing fishery management of monkfish.
Month/Year Regulatory Action
Nov. 1999
FMP implemented - Included a multi-level limited access program; two management areas; target TACs; effort limitations (DAS); Year 3 default measures (0 DAS); trip limits for limited access vessels; bycatch allowances; minimum fish sizes; minimum mesh sizes; gear restrictions; spawning season restrictions; a framework adjustment process; annual review requirements; permitting and reporting requirements; and other measures for administration and enforcement.
Nov. 1999 Amendment 1 effective – EFH Omnibus Amendment
May. 2000 DAS implemented
Jul. 2000 SAW 31Spring 2001 Cooperative SurveyFall 2001 Hall v. Evans decision - trip limit on gillnet vessels set equal to trawls, based on permit category.Jan. 2002 SAW 34
Spring 2002Councils submit Framework 1 – Proposes to fix landings at existing levels and postpone default measures for 1 year while Councils develop Amendment 2.
May. 2002
Emergency Rule – Framework 1 disapproved for non-compliance with Fthreshold in the original plan (which was invalidated by SAW 31 and SAW 34). Implemented a revision to the OFD based on SAW 34 recommendations, and management measures in FW 1.
May. 2003
Framework 2 - Modified the OFD reference points recommended by SAW 34; established an index- and landings-based method for setting TACs to achieve annual rebuilding goals; contained a method for calculating DAS and trip limits; and eliminated the default measures.
Spring 2004 Cooperative Survey
May. 2005
Amendment 2 - Made minimum fish size in SFMA equivalent to that in NFMA (11-inch tail/17-inch whole); established a 6-inch roller gear restriction in the SFMA, implemented two canyon closure areas; removed the 20-day spawning block requirement; established a research set-aside program; established an Offshore Fishery Program in the SFMA; modified some incidental catch limits; and modified the monkfish limited entry program to include vessels that had historically fished off of VA and NC.
Spring 2007
Councils submit Framework 4 - Would establish target TACs, trip limits, and DAS requirements for final 3 years of rebuilding plan; would require use of DAS in NFMA; contains backstop measures if target TACs exceeded; would revise incidental catch limits for NFMA and scallop access areas; and would adjust boundary line applicable to Category H vessels.
May. 2007
Interim Rule - Tempoarily implemented target TAC, DAS, and trip limits recommended in Framework 4 for the NFMA (except does not include the at-sea declaration provision); continues FY 2006 target TAC, DAS, and trip limits for the SFMA; and prohibits the use of carryover DAS. Also temporarily implements other measures contained in Framework 4: Revision to border applicable to Category H vessels and revisions to incidental catch limits in NFMA and scallop access areas.
Autumn 2007 Framework 4 implemented.
Apr. 2008Framework 5 - Adopted DPWG (2007) reference point definitions, tightened loopholes (e.g. reduced DAS carryover days allowed, tightened effort accounting methods)
Oct. 2008 Framework 6 - removed backstop provision of Framework 4.
May, 2011Amendment 5 -implemented ACLs and AMs, and set specifications of DAS, trip limits and other management measures to replace those adopted in Framework 4.
Oct., 2011Framework 7- Revised the catch target, DAS and trip limits for the northern management area and management reference points for both areas in response to SARC 50
2010- presentAmendment 6 in development to consider modifications to the management system, including possible DAS leasing, sectors or ITQs
24

Table 2. Management measures for monkfish, fishing years 2000-2013 (note that regulations pertain to fishing years (May 1- April 30), and do not correspond to calendar year landings in Table 3.
NorthTarget TACs, trip limits, DAS restrictions, and landings for the Northern Fishery Management Area
Trip Limits* Trip Limits*
Fishing YearTarget TAC (lbs)
Target TAC/TAL (mt) Cat. A & C Cat. B & D
DAS Restrictions** Landings (lbs)
Landings (mt)
Percent of TAC
2000 12,507,000 5,673 n/a n/a 40 26,145,000 11,859 209%2001 12,507,000 5,673 n/a n/a 40 32,745,000 14,853 262%2002 25,737,000 11,674 n/a n/a 40 31,947,000 14,491 124%2003 39,039,000 17,708 n/a n/a 40 31,207,000 14,155 80%2004 37,408,000 16,968 n/a n/a 40 25,905,000 11,750 69%2005 29,012,834 13,160 n/a n/a 40 21,016,667 9,533 72%2006 17,057,165 7,737 n/a n/a 40 14,720,265 6,677 86%2007 11,023,100 5,000 1,250 470 31 11,133,344 5,050 101%2008 11,023,100 5,000 1,250 470 31 7,777,909 3,528 71%2009 11,023,100 5,000 1,250 470 31 7,372,258 3,344 67%2010 11,023,100 5,000 1,250 470 31 6,247,901 2,834 57%2011 12,905,845 5,854 1,250 600 40 8,153,433 3,699 63%2012 12,905,845 5,854 1,250 600 402013 12,905,845 5,854 1,250 600 40
* Trip limits in pounds tail weight per DAS** Excluding up to 10 DAS carryover, became 4 DAS carryover in FY2007In 2011, the target TAC became a target TAL
SouthTarget TACs, trip limits, DAS restrictions, and landings for the Southern Fishery Management Area
Trip Limits* Trip Limits*
Fishing YearTarget TAC (lbs)
Target TAC/TAL (mt) Cat. A & C Cat. B, D, H
DAS Restrictions** Landings (lbs)
Landings (mt)
Percent of TAC
2000 13,281,000 6,024 1,500 1,000 40 17,549,000 7,960 132%2001 13,281,000 6,024 1,500 1,000 40 24,404,000 11,069 184%2002 17,463,000 7,921 550 450 40 16,487,000 7,478 94%2003 22,511,000 10,211 1,250 1,000 40 26,891,000 12,198 119%2004 14,929,704 6,772 550 450 28 13,719,000 6,223 92%2005 21,325,315 9,673 700 600 39.3 21,287,811 9,656 100%2006 8,084,351 3,667 550 450 12 13,027,100 5,909 161%2007 11,243,562 5,100 550 450 23 15,829,172 7,180 141%2008 11,243,562 5,100 550 450 23 14,883,407 6,751 132%2009 11,243,562 5,100 550 450 23 10,582,189 4,800 94%2010 11,243,562 5,100 550 450 23 9,885,528 4,484 88%2011 19,676,234 8,925 550 450 28 12,789,016 5,801 65%2012 19,676,234 8,925 550 450 282013 19,676,234 8,925 550 450 28
* Trip limits in pounds tail weight per DAS** Excluding up to 10 DAS carryover, became 4 DAS carryover in FY2007In 2011, the target TAC became a target TAL
25

Table 3. Landings (calculated live weight, mt) of monkfish as reported in NEFSC weighout data base (1964-1993) and vessel trip reports (1994-2009) (North = SA 511-523, 561; South = SA 524-639 excluding 551-561 plus landings from North Carolina for years 1977-1995); General Canvas database (1964-1989, North = ME, NH, northern weigh out proportion of MA; South = Southern weigh out proportion of MA, RI-VA); Foreign landings from NAFO database areas 5 and 6. Shaded cells denote suggested source for landings which are used in the total column at the far right (see text for details).
Year US North US South US Total US North US South US Total Foreign Total1964 45 19 64 45 61 106 0 1061965 37 17 54 37 79 115 0 1151966 299 13 312 299 69 368 2,397 2,7651967 539 8 547 540 59 598 11 6091968 451 2 453 449 36 485 2,231 2,7161969 258 4 262 240 43 283 2,249 2,5321970 199 12 211 199 53 251 477 7281971 213 10 223 213 53 266 3,659 3,9251972 437 24 461 437 65 502 4,102 4,6041973 710 139 848 708 240 948 6,818 7,7661974 1,197 101 1,297 1,200 183 1,383 727 2,1101975 1,853 282 2,134 1,877 417 2,294 2,548 4,8421976 2,236 428 2,663 2,256 608 2,865 341 3,2061977 3,137 830 3,967 3,167 1,314 4,481 275 4,7561978 3,889 1,384 5,273 3,976 2,073 6,049 38 6,0871979 4,014 3,534 7,548 4,068 4,697 8,765 70 8,8351980 3,695 4,232 7,927 3,623 6,035 9,658 132 9,7901981 3,217 2,380 5,597 3,171 4,142 7,313 381 7,6941982 3,860 3,722 7,582 3,757 4,492 8,249 310 7,8921983 3,849 4,115 7,964 3,918 4,707 8,624 80 8,0441984 4,202 3,699 7,901 4,220 4,171 8,391 395 8,2961985 4,616 4,262 8,878 4,452 4,806 9,258 1,333 10,2111986 4,327 4,037 8,364 4,322 4,264 8,586 341 8,7051987 4,960 3,762 8,722 4,995 3,933 8,926 748 9,4701988 5,066 4,595 9,661 5,033 4,775 9,809 909 10,5701989 6,391 8,353 14,744 6,263 8,678 14,910 1,178 15,9221990 5,802 7,204 13,006 1,557 14,5631991 5,693 9,865 15,558 1,020 16,5781992 6,923 13,942 20,865 473 21,3381993 10,645 15,098 25,743 354 26,0971994 10,950 12,126 23,076 543 23,6191995 11,970 14,361 26,331 418 27,0751996 10,791 15,715 26,507 184 26,9781997 9,709 18,462 28,172 189 28,5171998 7,281 19,337 26,618 190 26,8661999 9,128 16,085 25,213 151 25,3642000 10,729 10,147 20,876 176 21,0522001 13,341 9,959 23,301 142 23,4502002 14,011 8,884 22,896 294 23,1892003 14,991 11,095 26,086 309 26,3752004 13,209 7,978 21,186 166 21,3522005 10,140 9,177 19,317 206 19,5232006 6,974 7,980 14,955 279 15,2342007 4,953 7,388 12,341 8 12,3492008 3,942 7,250 11,192 2 11,1942009 3,210 5,532 8,742 8,7422010 2,424 4,996 7,420 7,4202011 2,362 6,344 8,707 8,707
Weigh Out Plus NC General Canvas
26

Table 4. U.S. landings of monkfish (calculated live weight, mt) by gear type.
Year TrawlGill Net
Scallop Dredge Other Total Trawl Gill Net
Scallop Dredge Other Total Trawl
Gill Net
Scallop Dredge Other Total
1964 45 0 45 19 19 64 0 641965 36 0 37 17 17 53 0 531966 299 0 0 299 13 0 13 311 0 0 3121967 532 8 539 8 8 540 8 5471968 447 4 451 2 2 449 4 4531969 253 1 4 258 4 4 257 1 4 2621970 198 0 0 199 12 12 210 0 0 2111971 213 0 213 10 10 223 0 2231972 426 8 1 2 437 24 24 451 8 1 2 4611973 661 29 12 8 710 132 5 1 137 794 29 17 9 8481974 1,060 105 7 25 1,197 98 0 98 1,160 105 7 25 1,2971975 1,712 123 10 9 1,853 265 0 2 2 269 1,990 123 12 10 2,1351976 2,031 143 47 15 2,236 333 7 0 340 2,459 143 54 15 2,6701977 2,737 230 142 28 3,137 508 57 26 591 3,487 230 202 53 3,9731978 3,255 368 212 54 3,889 605 0 507 26 1,138 4,016 368 774 80 5,2381979 2,967 393 584 71 4,014 944 6 1,015 16 1,981 3,989 399 2,070 87 6,5451980 2,526 518 596 56 3,696 1,139 10 1,274 7 2,429 3,723 528 2,276 62 6,5891981 2,266 461 443 47 3,217 1,100 16 782 105 2,003 3,483 477 1,399 152 5,5121982 3,040 421 367 32 3,860 1,806 12 1,507 27 3,352 4,998 433 2,061 60 7,5511983 3,233 314 266 37 3,849 1,819 11 2,119 17 3,966 5,166 325 2,431 56 7,9771984 3,648 315 196 43 4,202 1,714 15 1,704 18 3,452 5,513 330 1,968 61 7,8711985 3,982 315 264 55 4,616 1,739 17 2,347 3 4,106 5,757 332 2,611 58 8,7581986 3,412 326 553 36 4,327 1,841 32 2,068 12 3,954 5,318 358 2,621 48 8,3451987 3,853 374 695 38 4,960 1,680 26 1,997 3 3,707 5,561 400 2,692 41 8,6941988 3,554 304 1,172 36 5,066 1,828 58 2,594 3 4,483 5,399 363 3,765 39 9,5671989 3,429 349 2,584 30 6,391 3,240 17 5,036 3 8,297 6,679 366 7,620 33 14,6981990 3,298 338 2,141 25 5,802 2,361 32 4,744 5 7,142 5,697 372 6,885 30 12,9841991 3,299 338 2,033 24 5,694 5,515 363 3,907 16 9,800 8,847 700 5,941 39 15,5281992 4,330 359 2,211 24 6,923 6,528 977 6,409 11 13,925 10,860 1,336 8,619 35 20,8501993 5,890 695 4,034 26 10,645 5,987 1,722 7,158 192 15,059 11,879 2,417 11,192 218 25,7071994 7,574 1,571 1,808 86 11,039 5,233 2,342 3,995 556 12,126 12,707 3,884 5,759 638 22,9881995 9,119 1,531 1,266 54 11,970 5,785 3,800 4,030 746 14,361 14,905 5,331 5,296 800 26,3311996 8,445 1,389 913 45 10,791 7,141 4,211 4,330 33 15,715 15,586 5,599 5,243 78 26,5071997 7,363 988 1,318 40 9,709 8,161 5,203 4,890 208 18,462 15,524 6,192 6,208 249 28,1721998 5,421 885 948 27 7,281 7,815 6,198 5,190 134 19,337 13,236 7,083 6,138 161 26,6181999 7,037 1,470 598 24 9,128 6,364 6,187 3,481 54 16,085 13,401 7,656 4,079 78 25,2132000 8,234 2,102 316 76 10,729 4,018 4,005 1,975 150 10,147 12,252 6,107 2,291 226 20,8762001 9,990 2,959 381 11 13,341 3,091 5,119 1,719 30 9,959 13,081 8,078 2,100 41 23,3012002 10,839 2,978 181 13 14,011 1,584 5,410 1,847 43 8,884 12,423 8,389 2,028 56 22,8962003 12,028 2,488 222 254 14,991 2,034 7,262 1,717 83 11,095 14,062 9,750 1,939 336 26,0862004 9,918 2,866 14 411 13,209 1,228 4,605 671 1,474 7,978 11,145 7,471 685 1,885 21,1862005 6,876 2,567 99 598 10,140 1,706 4,673 1,581 1,216 9,177 8,582 7,241 1,680 1,814 19,3172006 5,054 1,573 185 162 6,974 1,457 3,970 1,532 1,022 7,980 6,511 5,542 1,717 1,184 14,9552007 3,482 1,172 243 56 4,953 1,084 3,782 1,594 928 7,388 4,566 4,954 1,837 984 12,3412008 3,055 802 52 34 3,942 1,041 4,098 1,370 741 7,250 4,095 4,900 1,422 775 11,1922009 2,491 651 21 47 3,210 721 3,117 826 868 5,532 3,212 3,768 847 915 8,7422010 1,947 460 12 6 2,424 590 2,738 579 1,089 4,996 2,537 3,198 590 1,094 7,4202011 1,790 516 26 30 2,362 776 3,269 468 1,831 6,344 2,566 3,785 494 1,861 8,707
North South Regions Combined
27

Table 5. Landed weight (mt) of monkfish by market category for 1964-2011 for northern assessment area.
Belly Head on, Tails Tails Tails Tails AllYear Flaps Cheeks Livers Gutted Round Dressed Heads Unc. Large Small Peewee Tails1964 0.0 0.0 0.0 0.0 0.0 0.0 0.0 13.5 0.0 0.0 0.0 13.51965 0.0 0.0 0.0 0.0 0.0 0.0 0.0 11.0 0.0 0.0 0.0 11.01966 0.0 0.0 0.0 0.0 0.0 0.0 0.0 90.1 0.0 0.0 0.0 90.11967 0.0 0.0 0.0 0.0 0.0 0.0 0.0 162.5 0.0 0.0 0.0 162.51968 0.0 0.0 0.0 0.0 0.0 0.0 0.0 135.9 0.0 0.0 0.0 135.91969 0.0 0.0 0.0 0.0 0.0 0.0 0.0 77.8 0.0 0.0 0.0 77.81970 0.0 0.0 0.0 0.0 0.0 0.0 0.0 59.8 0.0 0.0 0.0 59.81971 0.0 0.0 0.0 0.0 0.0 0.0 0.0 64.1 0.0 0.0 0.0 64.11972 0.0 0.0 0.0 0.0 0.0 0.0 0.0 131.6 0.0 0.0 0.0 131.61973 0.0 0.0 0.0 0.0 0.0 0.0 0.0 213.8 0.0 0.0 0.0 213.81974 0.0 0.0 0.0 0.0 0.0 0.0 0.0 360.4 0.0 0.0 0.0 360.41975 0.0 0.0 0.0 0.0 0.0 0.0 0.0 558.0 0.0 0.0 0.0 558.01976 0.0 0.0 0.0 0.0 0.0 0.0 0.0 673.4 0.0 0.0 0.0 673.41977 0.0 0.0 0.0 0.0 0.0 0.0 0.0 944.7 0.0 0.0 0.0 944.71978 0.0 0.0 0.0 0.0 0.0 0.0 0.0 1171.4 0.0 0.0 0.0 1171.41979 0.0 0.0 0.0 0.0 0.0 0.0 0.0 1209.1 0.0 0.0 0.0 1209.11980 0.0 0.0 0.0 0.0 0.0 0.0 0.0 1113.1 0.0 0.0 0.0 1113.11981 0.0 0.0 0.0 0.0 0.0 0.0 0.0 969.0 0.0 0.0 0.0 969.01982 0.0 0.0 10.0 0.0 0.0 0.0 0.0 1145.6 15.0 2.0 0.0 1162.61983 0.0 0.0 9.3 0.0 0.0 0.0 0.0 1152.3 4.8 2.4 0.0 1159.41984 0.0 0.0 14.7 0.0 0.0 0.0 0.0 1261.9 3.7 0.0 0.0 1265.61985 0.0 0.0 11.4 0.0 0.0 0.0 0.0 1385.9 1.6 2.6 0.0 1390.21986 0.0 0.0 13.7 0.0 0.0 0.0 0.0 1302.7 0.3 0.2 0.0 1303.21987 0.0 0.0 24.0 0.0 0.0 0.0 0.0 1491.5 1.7 0.7 0.0 1493.91988 0.0 0.0 47.4 0.0 0.0 0.0 0.0 1516.9 5.6 3.3 0.0 1525.81989 0.0 0.0 58.7 0.0 11.2 0.0 0.0 1464.5 327.0 130.2 0.0 1921.61990 0.0 0.0 77.9 0.0 30.3 0.0 0.0 1173.7 410.7 154.0 0.0 1738.41991 0.0 3.3 70.0 0.0 0.3 0.0 0.0 1013.9 538.6 153.2 9.1 1714.81992 0.0 0.7 83.0 0.0 0.1 0.0 0.0 910.5 589.9 505.4 79.4 2085.31993 0.0 0.6 208.3 98.2 350.6 0.0 0.0 1034.3 867.9 1061.8 102.9 3067.01994 0.0 1.4 207.6 532.7 981.3 0.0 0.0 403.0 1205.7 1074.8 136.2 2819.71995 0.0 0.7 45.7 1223.7 1113.3 0.0 0.0 361.7 1180.4 1003.3 304.4 2849.91996 0.3 0.2 65.1 1115.7 745.4 0.0 0.0 89.8 930.4 1398.6 223.9 2642.71997 0.0 0.1 50.9 634.3 244.3 0.0 0.0 26.4 1126.1 1361.5 119.1 2633.11998 0.0 0.0 24.0 550.9 143.9 0.0 0.0 16.3 1054.9 810.1 79.2 1960.51999 0.0 0.1 39.8 1700.8 510.6 0.0 0.0 28.3 995.5 848.4 139.4 2011.62000 0.0 0.0 93.9 3213.4 912.1 0.0 0.0 17.5 782.9 1050.4 2.7 1853.42001 0.0 0.0 93.5 3084.2 231.1 0.0 0.0 128.5 1114.6 1646.7 0.0 2889.82002 0.0 0.1 75.3 3788.7 24.1 0.0 0.0 79.6 1055.3 1777.2 0.0 2912.02003 0.0 0.0 60.6 2363.9 13.7 0.0 0.0 94.7 1572.5 2032.2 0.0 3699.52004 0.0 0.0 55.8 646.7 959.9 0.0 0.0 3.0 1882.5 1580.3 1.4 3467.32005 0.0 0.0 41.8 1705.6 22.0 0.1 0.0 3.3 1440.1 1017.0 1.6 2462.02006 0.0 0.0 22.5 1621.9 19.6 0.0 0.0 8.9 899.3 626.9 2.6 1537.82007 0.0 0.1 13.2 682.0 0.0 0.1 0.6 8.9 869.6 378.4 0.8 1257.72008 0.0 0.0 4.5 390.7 0.0 3.9 0.0 1.4 738.9 310.6 0.0 1050.92009 0.0 0.0 1.8 289.6 0.0 10.7 0.0 1.9 560.0 299.0 0.0 860.92010 0.0 0.0 1.1 208.3 0.0 0.5 0.0 2.2 395.6 260.6 0.0 658.32011 0.0 0.0 2.4 249.0 0.0 0.0 0.0 3.4 375.4 247.2 0.0 626.0
28

Table 6. Landed weight (mt) of monkfish by market category for 1964-2011 for southern assessment area.
Belly Head on, Tails Tails Tails Tails AllYear Flaps Cheeks Livers Gutted Round Dressed Heads Unc. Large Small Peewee Tails1964 0.0 0.0 0.0 0.0 0.0 0.0 0.0 5.7 0.0 0.0 0.0 5.71965 0.0 0.0 0.0 0.0 0.0 0.0 0.0 5.0 0.0 0.0 0.0 5.01966 0.0 0.0 0.0 0.0 0.0 0.0 0.0 3.9 0.0 0.0 0.0 3.81967 0.0 0.0 0.0 0.0 0.0 0.0 0.0 2.3 0.0 0.0 0.0 2.31968 0.0 0.0 0.0 0.0 0.0 0.0 0.0 0.6 0.0 0.0 0.0 0.61969 0.0 0.0 0.0 0.0 0.0 0.0 0.0 1.2 0.0 0.0 0.0 1.21970 0.0 0.0 0.0 0.0 0.0 0.0 0.0 3.7 0.0 0.0 0.0 3.71971 0.0 0.0 0.0 0.0 0.0 0.0 0.0 3.0 0.0 0.0 0.0 3.01972 0.0 0.0 0.0 0.0 0.0 0.0 0.0 7.4 0.0 0.0 0.0 7.41973 0.0 0.0 0.0 0.0 0.0 0.0 0.0 41.7 0.0 0.0 0.0 41.71974 0.0 0.0 0.0 0.0 0.0 0.0 0.0 30.3 0.0 0.0 0.0 30.31975 0.0 0.0 0.0 0.0 0.0 0.0 0.0 84.8 0.0 0.0 0.0 84.81976 0.0 0.0 0.0 0.0 0.0 0.0 0.0 128.8 0.0 0.0 0.0 128.81977 0.0 0.0 0.0 0.0 0.0 0.0 0.0 249.6 0.0 0.0 0.0 249.61978 0.0 0.0 0.0 0.0 0.0 0.0 0.0 403.1 0.0 0.0 0.0 403.11979 0.0 0.0 0.0 0.0 0.0 0.0 0.0 1015.6 0.0 0.0 0.0 1015.61980 0.0 0.0 0.0 0.0 0.0 0.0 0.0 1189.3 0.0 0.0 0.0 1189.31981 0.0 0.0 0.0 0.0 0.0 0.0 0.0 685.0 0.0 0.0 0.0 685.01982 0.0 0.0 0.2 0.0 0.0 0.0 0.0 912.4 138.1 51.3 0.0 1101.81983 0.0 0.0 2.3 0.0 0.0 0.0 0.0 857.7 236.6 136.2 0.0 1230.51984 0.0 0.0 10.3 0.0 0.0 0.0 0.0 859.7 183.1 44.5 0.0 1087.31985 0.0 0.0 16.7 0.0 0.0 0.0 0.0 1081.1 85.1 70.8 0.0 1236.91986 0.0 0.0 22.6 0.0 0.0 0.0 0.0 1062.6 76.1 52.0 0.0 1190.81987 0.0 0.0 330.2 0.0 0.0 0.0 0.0 972.2 138.2 6.0 0.0 1116.41988 0.0 0.0 65.4 0.0 0.0 0.0 0.0 1129.3 189.5 31.5 0.0 1350.41989 0.0 0.0 87.6 0.0 4.5 0.0 0.0 2037.4 230.4 229.8 0.0 2497.51990 0.0 0.0 101.8 0.0 187.3 0.0 0.0 1428.1 443.4 223.4 0.0 2094.91991 0.0 5.2 200.2 0.0 415.1 0.0 0.0 1215.2 1123.3 460.9 27.5 2826.81992 0.2 3.0 238.5 0.0 385.9 0.0 0.0 1868.2 1318.3 787.6 103.9 4077.91993 0.0 1.1 251.5 0.0 178.1 0.0 0.0 2468.9 1065.1 789.3 159.4 4482.81994 0.0 3.8 250.5 921.0 1063.5 0.0 0.0 853.9 1025.0 988.5 121.8 2989.21995 2.3 0.3 451.3 1528.7 1539.1 0.0 0.0 518.0 1341.0 1419.3 58.9 3337.21996 0.4 0.5 504.4 2352.1 317.6 0.0 0.0 996.3 1159.7 1628.6 45.6 3830.21997 0.1 0.0 577.1 2559.4 550.9 0.0 0.0 647.2 1924.0 1912.6 32.4 4516.21998 0.0 0.5 581.9 3036.0 438.0 0.0 0.0 841.9 1952.0 1839.7 16.3 4649.91999 0.1 0.1 557.6 4047.4 620.9 0.0 0.0 508.9 1392.8 1352.4 14.1 3268.12000 0.0 3.7 530.1 3700.7 178.9 0.0 0.0 276.2 797.1 656.9 1.6 1731.82001 0.5 0.0 465.9 3944.0 300.3 0.0 0.0 216.8 844.3 493.6 0.4 1555.12002 0.2 0.0 433.3 4012.9 551.3 0.0 0.0 167.0 628.6 336.1 0.2 1132.02003 0.0 0.9 425.7 4958.8 667.2 0.0 0.0 242.4 790.1 405.1 0.7 1438.32004 0.3 2.1 354.9 2758.0 1066.1 7.8 0.0 185.6 670.8 273.6 0.1 1130.12005 0.3 54.9 330.1 3694.7 187.4 17.7 0.0 105.1 770.6 550.5 2.1 1428.32006 0.2 108.4 293.2 3350.8 26.6 20.4 4.8 68.5 658.1 505.6 0.7 1232.82007 0.2 43.6 258.0 3030.2 107.1 12.2 0.1 88.4 726.9 328.9 0.9 1145.12008 0.2 4.8 252.6 3007.5 43.5 13.4 1.1 61.2 768.2 300.3 0.0 1129.72009 0.8 0.0 198.9 2539.5 3.9 8.7 11.4 47.1 505.2 235.2 0.3 787.82010 0.4 0.0 188.2 2116.9 9.4 4.3 27.4 61.4 476.0 234.9 0.0 772.32011 0.1 16.9 224.1 2693.0 2.3 5.8 38.9 44.4 574.5 363.1 0.0 982.0
29

Table 7. Revised discard estimates, monkfish live weight, northern management region. Dredge and shrimp trawl are based on SBRM d/k all species, live weight; trawl and gillnet based on d/k monk.
NorthTrawl Gillnet Scallop Dredge Shrimp Trawl
Year HalfNo.
trips D/K ratio CVDlr monk
(mt)Discard
(mt)No.
trips D/K ratio CVDlr monk
(mt)Discard
(mt)No.
trips D/K ratio CVDlr all spp
(mt)Discard
(mt)No.
trips D/K ratio CVDlr all spp
(mt)Discard
(mt)1989 1 30 0.037 0.58 1,550 58 1 0.036 84 3 0.001 18,213 17 31 0.002 0.33 3,412 5.5
2 63 0.141 0.44 1,830 257 103 0.027 0.32 265 7 0.008 24,053 185 9 0.001 0.62 931 1.21990 1 16 0.082 0.60 1,562 128 73 0.036 0.41 121 4 0.001 9,864 9 27 0.002 0.34 4,494 8.1
2 36 0.039 0.45 1,690 66 65 0.029 0.37 219 6 0.008 19,293 149 4 0.058 1.01 620 35.81991 1 27 0.042 0.45 1,233 52 191 0.030 0.47 120 4 0.001 16,608 16 46 0.004 0.19 3,536 12.8
2 81 0.167 0.25 1,999 334 758 0.036 0.10 213 8 1 0.002 21,312 40 7 0.046 0.40 340 15.71992 1 51 0.122 0.30 1,674 203 403 0.065 0.16 105 7 3 0.000 0.98 14,179 1 76 0.003 0.23 3,285 9.6
2 35 0.224 0.43 2,624 587 618 0.040 0.24 248 10 6 0.001 0.41 20,033 26 6 0.003 0.28 161 0.41993 1 19 0.067 0.30 2,821 189 271 0.086 0.21 119 10 7 0.002 0.26 13,702 25 78 0.001 0.26 1,890 2.5
2 19 0.084 0.26 3,032 254 338 0.032 0.24 560 18 4 0.018 0.45 12,674 230 4 0.001 0.70 316 0.31994 1 18 0.035 0.29 3,273 115 65 0.065 0.29 270 18 2 0.001 1.21 5,486 5 71 0.002 0.38 2,443 5.9
2 6 0.024 0.59 4,385 107 44 0.055 0.19 779 43 5 0.010 0.38 6,230 59 6 0.001 0.44 906 0.71995 1 30 0.164 0.36 4,643 762 38 0.141 0.30 469 66 1 0.014 2,318 32 64 0.000 0.23 4,452 1.8
2 48 0.090 0.31 4,478 403 69 0.088 0.23 1,023 90 5 0.018 0.50 6,544 119 9 0.001 0.43 1,377 0.71996 1 21 0.190 0.23 4,294 814 28 0.137 0.43 340 47 8 0.003 0.94 5,338 14 30 0.000 0.34 7,580 0.8
2 49 0.132 0.57 4,057 534 34 0.132 0.19 934 123 5 0.022 0.40 11,375 246 5 0.000 0.79 1,418 0.41997 1 13 0.100 0.49 3,795 378 19 0.036 0.32 329 12 4 0.004 0.48 10,567 42 17 0.000 0.61 5,416 0.9
2 7 0.076 0.23 3,225 244 26 0.194 0.84 742 144 4 0.020 0.76 9,148 180 0.001 649 0.41998 1 7 0.124 0.37 3,150 392 39 0.028 0.41 238 7 2 0.004 0.32 7,482 28 0.001 3,095 2.7
2 3 0.093 0.10 2,398 223 72 0.043 0.28 606 26 7 0.014 0.16 6,400 90 0.001 168 0.11999 1 3 0.098 0.04 3,947 388 36 0.067 0.65 282 19 2 0.004 0.65 8,347 29 0.001 1,407 1.2
2 42 0.069 0.21 3,011 207 66 0.036 0.51 1,051 38 6 0.004 0.44 6,797 30 0.001 33 0.02000 1 80 0.069 0.32 3,916 271 58 0.041 0.30 501 21 0.004 6,993 31 0.001 2,068 1.8
2 61 0.088 0.31 3,798 333 65 0.077 0.24 2,033 157 95 0.004 0.13 13,019 56 0.001 35 0.02001 1 61 0.102 0.20 5,088 518 41 0.061 0.69 880 53 17 0.003 0.42 14,926 41 3 0.000 0.14 813 0.1
2 113 0.066 0.10 4,588 303 33 0.108 0.93 2,208 238 0.005 11,525 60 0.001 0.02002 1 47 0.076 0.25 5,634 428 33 0.045 0.39 760 34 0.005 8,712 45 0.001 308 0.3
2 274 0.100 0.10 4,532 455 67 0.053 0.27 2,230 118 10 0.008 0.97 11,533 88 0.001 0.02003 1 206 0.101 0.14 6,642 671 112 0.037 0.24 628 23 5 0.001 0.89 16,053 9 15 0.000 1.01 855 0.0
2 218 0.055 0.12 4,721 261 273 0.058 0.13 1,570 91 8 0.015 0.41 10,361 157 0.001 0.02004 1 163 0.042 0.12 5,307 225 212 0.021 0.22 739 16 3 0.000 0.69 5,633 0 12 0.000 0.25 1,069 0.1
2 377 0.036 0.10 4,039 147 728 0.059 0.09 1,788 105 19 0.096 0.48 3,705 355 0.001 44 0.02005 1 500 0.047 0.07 3,971 187 153 0.098 0.26 516 51 20 0.001 0.57 5,745 6 17 0.000 0.52 836 0.1
2 601 0.057 0.10 3,038 174 660 0.074 0.12 1,450 108 39 0.008 0.21 23,131 184 0.001 40 0.02006 1 292 0.055 0.08 2,852 158 93 0.063 0.41 262 17 5 0.001 0.42 20,833 14 17 0.000 0.56 847 0.0
2 201 0.071 0.11 2,285 162 80 0.080 0.17 1,025 82 39 0.021 0.32 14,291 305 3 0.000 0.10 449 0.22007 1 221 0.050 0.10 2,075 104 42 0.061 0.32 228 14 28 0.002 0.22 11,600 26 14 0.001 0.72 1,899 1.0
2 303 0.072 0.10 1,448 104 190 0.062 0.16 693 43 68 0.021 0.18 23,644 487 0.001 333 0.22008 1 277 0.088 0.10 1,821 160 61 0.076 0.28 141 11 25 0.001 0.22 7,065 11 16 0.000 0.77 1,834 0.9
2 383 0.082 0.10 1,045 86 156 0.051 0.22 541 28 22 0.011 0.34 3,696 42 3 0.001 0.90 167 0.12009 1 351 0.166 0.13 1,666 276 129 0.209 0.46 149 31 7 0.001 0.47 1,960 3 7 0.001 0.61 998 0.8
2 408 0.079 0.11 832 66 195 0.119 0.27 467 55 22 0.003 0.26 11,642 34 5 0.000 0.92 347 0.02010 1 339 0.097 0.08 1,537 149 305 0.056 0.15 112 6 16 0.001 0.80 3,350 4 11 0.000 1.00 2,911 0.1
2 671 0.090 0.07 857 77 1364 0.102 0.07 303 31 25 0.003 0.31 15,930 50 4 0.000 0.91 780 0.02011 1 671 0.120 0.07 1,461 175 554 0.050 0.10 120 6 23 0.002 0.80 6,660 16 1 0.000 3,745 0.0
2 743 0.058 0.08 1,174 69 1244 0.080 0.10 361 29 81 0.004 0.13 35,600 158 0.001 78 0.0
30

Table 8. Revised discard estimates, monkfish live weight, southern management region. Dredge and shrimp trawl are based on SBRM d/k all species, live weight; trawl and gillnet based on d/k monk.
South Trawl Gillnet Scallop Dredge
Year HalfNo.
trips D/K ratio CVDlr monk
(mt)Discard
(mt)No.
trips D/K ratio CVDlr monk
(mt)Discard
(mt)No.
trips D/K ratio CVDlr all spp
(mt)Discard
(mt)1989 1 46 0.709 0.50 2,195 1,556 0.031 12 0 0.010 0.010 59,696 577
2 53 0.169 0.59 733 124 3 0.054 5 0 0.015 0.015 35,498 5281990 1 50 0.064 0.26 1,567 100 1 0.031 14 0 0.010 64,314 622
2 35 0.118 0.32 759 90 13 0.054 18 0 0.015 53,040 7891991 1 73 0.258 0.30 1,257 324 3 0.031 209 2 0.010 67,829 656
2 77 0.020 0.39 3,831 78 8 0.000 154 0 2 0.001 0.07 36,015 191992 1 62 0.061 0.38 3,947 239 94 0.011 0.31 786 8 7 0.001 0.69 48,686 29
2 41 0.028 0.83 2,135 60 72 0.020 0.20 176 3 7 0.012 0.50 39,126 4601993 1 40 0.092 0.68 2,598 238 78 0.034 0.70 1,306 44 12 0.008 0.30 23,971 197
2 34 0.028 0.49 1,301 36 87 0.061 0.20 341 21 4 0.032 0.53 18,379 5871994 1 43 0.095 0.29 2,925 277 124 0.079 0.33 1,565 124 10 0.020 0.26 26,657 538
2 30 0.323 0.56 2,027 655 173 0.056 0.18 967 55 10 0.015 0.29 24,222 3701995 1 61 0.175 0.55 2,789 488 260 0.044 0.20 2,758 121 14 0.030 0.17 34,108 1,011
2 103 0.115 0.57 2,946 340 170 0.050 0.34 1,172 59 9 0.050 0.45 18,456 9171996 1 56 0.164 0.36 3,187 523 226 0.077 0.27 2,615 202 19 0.020 0.23 27,505 547
2 85 0.095 0.18 4,021 380 134 0.052 0.28 1,434 75 15 0.029 0.26 19,621 5621997 1 60 0.025 0.47 4,130 102 238 0.067 0.34 3,089 206 16 0.028 0.18 19,067 543
2 29 0.089 0.15 4,215 374 106 0.015 0.34 1,313 20 8 0.041 0.39 14,997 6121998 1 31 0.108 0.33 3,991 431 228 0.070 0.20 3,606 252 8 0.008 0.24 17,094 136
2 28 0.027 0.52 3,946 108 64 0.062 0.44 2,053 128 15 0.012 0.57 15,300 1771999 1 39 0.045 0.30 4,370 195 52 0.052 0.34 4,207 220 13 0.010 0.26 30,059 291
2 34 0.214 0.57 2,306 494 35 0.046 0.57 1,917 88 56 0.004 0.16 34,102 1502000 1 67 0.786 0.32 2,255 1,773 60 0.063 0.30 2,683 170 38 0.014 0.16 47,847 666
2 47 0.107 0.62 1,709 182 44 0.051 0.81 1,157 59 133 0.009 0.16 43,879 3822001 1 61 0.946 0.47 1,703 1,611 57 0.030 0.42 2,248 67 42 0.015 0.11 64,029 972
2 96 0.404 0.73 1,348 545 35 0.033 0.38 2,788 92 48 0.014 0.15 70,044 9732002 1 50 0.338 0.38 1,123 379 34 0.017 0.80 3,590 61 34 0.019 0.09 83,888 1,571
2 94 0.327 0.39 566 185 40 0.063 0.44 1,967 124 61 0.018 0.10 81,620 1,4752003 1 120 0.331 0.36 1,172 388 50 0.016 0.35 4,452 69 46 0.014 0.15 82,660 1,192
2 99 0.406 0.45 1,177 478 56 0.070 0.31 2,849 199 71 0.017 0.12 91,638 1,5422004 1 237 0.240 0.44 1,012 243 78 0.073 0.22 3,441 252 82 0.014 0.08 107,728 1,543
2 436 0.300 0.31 733 220 74 0.089 0.22 1,043 93 193 0.015 0.10 95,117 1,4322005 1 534 0.175 0.14 945 165 100 0.104 0.22 3,217 334 108 0.014 0.18 99,628 1,419
2 654 0.064 0.11 1,588 102 82 0.081 0.20 1,372 111 174 0.019 0.19 67,548 1,2902006 1 327 0.180 0.19 1,008 181 43 0.054 0.19 2,865 155 43 0.009 0.31 87,842 767
2 277 0.055 0.15 1,010 56 35 0.082 0.32 967 79 166 0.022 0.14 99,456 2,2102007 1 335 0.125 0.25 741 93 59 0.220 0.37 2,139 471 138 0.010 0.14 103,992 1,083
2 420 0.159 0.40 657 104 45 0.054 0.33 1,569 84 156 0.013 0.15 68,914 9202008 1 343 0.098 0.19 744 73 54 0.108 0.25 2,882 311 374 0.006 0.11 106,134 686
2 316 0.017 0.31 594 10 39 0.104 0.29 993 104 245 0.010 0.13 74,506 7172009 1 414 0.080 0.30 646 52 62 0.052 0.19 2,438 128 370 0.006 0.08 122,576 725
2 529 0.088 0.31 280 25 32 0.074 0.24 610 45 103 0.009 0.15 73,175 6522010 1 569 0.248 0.24 474 118 114 0.060 0.21 2,034 122 132 0.010 0.11 108,617 1,098
2 545 0.190 0.51 369 70 95 0.077 0.18 695 54 174 0.008 0.12 81,139 6482011 1 573 0.123 0.13 634 78 178 0.078 0.12 2,357 185 156 0.010 0.13 107,870 1,132
2 601 0.088 0.11 598 53 84 0.122 0.19 1,066 130 150 0.010 0.12 62,873 623
31

Table 9. Annual catch using (mt monks discarded / mt kept of all species) to estimate discards for dredges and shrimp trawls and (mt monks discarded / mt monks kept) to estimate discards for trawls and gillnets.
North South Areas CombinedYear Landings Discard Total (mt) Landings Discard Total (mt) Landings Discard Total (mt) Foreign Total (mt)1980 3,623 635 4258 6,035 563 6598 9,658 1,197 10,855 132 10,9871981 3,171 754 3925 4,142 451 4593 7,313 1,204 8,517 381 8,8981982 3,860 699 4559 3,722 586 4308 7,582 1,285 8,867 310 9,1771983 3,849 664 4513 4,115 659 4774 7,964 1,323 9,287 80 9,3671984 4,202 616 4818 3,699 684 4383 7,901 1,301 9,202 395 9,5971985 4,616 640 5256 4,262 636 4898 8,878 1,276 10,154 1,333 11,4871986 4,327 548 4875 4,037 618 4655 8,364 1,166 9,530 341 9,8711987 4,960 766 5726 3,762 1039 4801 8,722 1,805 10,527 748 11,2751988 5,066 784 5850 4,595 1030 5625 9,661 1,814 11,475 909 12,3841989 6,391 534 6925 8,353 2,786 11139 14,744 3,320 18,064 1,178 19,2421990 5,802 406 6208 7,204 1,602 8806 13,006 2,008 15,014 1,557 16,5711991 5,693 481 6174 9,865 1,080 10945 15,558 1,561 17,119 1,020 18,1391992 6,923 844 7767 13,942 801 14743 20,865 1,644 22,509 473 22,9821993 10,645 730 11375 15,098 1,123 16221 25,743 1,853 27,596 354 27,9501994 10,950 353 11303 12,126 2,019 14145 23,076 2,372 25,448 543 25,9911995 11,970 1475 13445 14,361 2,935 17297 26,331 4,410 30,741 418 31,1591996 10,791 1780 12572 15,715 2,289 18004 26,507 4,069 30,576 184 30,7601997 9,709 1002 10712 18,462 1,856 20318 28,172 2,858 31,030 189 31,2191998 7,281 769 8050 19,337 1,231 20568 26,618 2,000 28,618 190 28,8081999 9,128 713 9841 16,085 1,438 17523 25,213 2,151 27,364 151 27,5152000 10,729 871 11599 10,147 3,232 13379 20,876 4,103 24,979 176 25,1552001 13,341 1213 14554 9,959 4,260 14219 23,301 5,473 28,773 142 28,9152002 14,011 1169 15180 8,884 3,796 12680 22,896 4,964 27,860 294 28,1542003 14,991 1212 16203 11,095 3,869 14964 26,086 5,080 31,167 309 31,4762004 13,209 847 14056 7,978 3,782 11760 21,186 4,629 25,816 166 25,9822005 10,140 711 10851 9,177 3,421 12597 19,317 4,132 23,449 206 23,6552006 6,974 738 7712 7,980 3,448 11428 14,955 4,186 19,140 279 19,4192007 4,953 778 5732 7,388 2,755 10143 12,341 3,533 15,875 8 15,8832008 3,942 338 4280 7,250 1,901 9151 11,192 2,240 13,432 2 13,4342009 3,210 465 3675 5,532 1,626 7158 8,742 2,092 10,833 10,8332010 2,424 317 2741 4,996 2,109 7105 7,420 2,426 9,846 9,8462011 2,362 452 2814 6,344 2,200 8545 8,707 2,652 11,359 11,359
32

Table 10. Temporal stratification used in expanding landings and discard to length composition of the monkfish catch. Unless otherwise indicated, sampling was expanded within gear type and area.
Trawl Gillnet DredgeNorth Kept Discarded Kept Discarded Kept Discarded1994 annual annual 1994-1999 1994-1999 1994-1999 1994-19991995 annual annual 1994-1999 1994-1999 1994-1999 1994-19991996 annual annual 1994-1999 1994-1999 1994-1999 1994-19991997 annual annual 1994-1999 1994-1999 1994-1999 1994-19991998 annual annual 1994-1999 1994-1999 1994-1999 1994-19991999 annual annual 1994-1999 1994-1999 1994-1999 1994-19992000 annual annual annual 2000-2002 N+S annual N+S annual N+S2001 annual annual annual 2000-2002 N+S annual N+S annual N+S2002 annual annual annual 2000-2002 N+S annual N+S annual N+S2003 half-year half-year annual annual N+S annual N+S annual N+S2004 half-year half-year annual annual N+S annual N+S annual N+S2005 half-year half-year annual annual N+S annual N+S annual N+S2006 half-year half-year annual 2006-2008 N+S annual N+S annual N+S2007 half-year half-year annual 2006-2008 N+S annual N+S annual N+S2008 half-year half-year annual 2006-2008 N+S annual N+S annual N+S2009 half-year half-year annual 2009-2011 N+S annual N+S annual N+S2010 half-year half-year annual 2009-2011 N+S annual N+S annual N+S2011 half-year half-year annual 2009-2011 N+S annual N+S annual N+SSouth1994 annual annual annual annual annual1995 annual annual annual annual annual1996 annual annual annual annual annual1997 annual annual annual annual annual1998 annual annual annual annual annual1999 annual annual annual annual annual2000 annual N+S annual N+S annual 2000-2002 N+S annual annual2001 annual N+S annual N+S annual 2000-2002 N+S 2000-2002 2000-20022002 annual N+S annual N+S annual 2000-2002 N+S 2000-2002 2000-20022003 annual half-year annual annual N+S annual annual2004 annual half-year annual annual N+S annual annual2005 annual half-year annual annual N+S annual annual2006 annual half-year annual 2006-2008 N+S annual annual2007 annual half-year annual 2006-2008 N+S annual annual2008 annual half-year annual 2006-2008 N+S annual annual2009 annual half-year annual 2009-2011 N+S annual annual2010 annual half-year annual 2009-2011 N+S annual annual2011 annual half-year annual 2009-2011 N+S annual annual
33

Table 11. Survey results from NEFSC offshore autumn bottom trawl surveys in the northern management region (strata 20-30, 34-40). Indices are delta distribution stratified means.
Number Number ofMean of Number Non-zero Proportion
Mean CV L95% U95% Mean CV L95% U95% Ind wt Min 5% 50% Mean 95% Max Fish of Tows Tows Non-zero1963 3.82 27.3 2.34 5.30 0.80 18.4 0.51 1.09 4.7 11 14 59 58.3 103 111 86 90 39 0.431964 1.89 23.2 1.03 2.75 0.39 22.5 0.22 0.56 4.8 21 21 58 59.4 92 102 32 87 23 0.261965 2.54 22.7 1.41 3.67 0.35 17.1 0.23 0.46 7.3 28 36 70 71.6 96 110 40 88 30 0.341966 3.38 18.4 2.16 4.60 0.51 16.7 0.34 0.68 6.5 37 48 73 73.1 90 96 55 86 33 0.381967 1.23 34.2 0.40 2.05 0.19 26.7 0.09 0.29 6.5 48 48 69 70.3 91 92 18 86 14 0.161968 2.05 37.8 0.53 3.57 0.29 30.5 0.12 0.46 7.2 11 26 72 71.4 105 106 32 86 16 0.191969 3.76 26.3 1.82 5.69 0.42 17.2 0.28 0.56 8.8 13 41 78 78.8 101 110 39 88 30 0.341970 2.28 29.1 0.98 3.58 0.40 22.4 0.22 0.57 5.8 22 36 67 67.2 90 98 41 92 21 0.231971 2.93 25.9 1.45 4.41 0.49 18.6 0.31 0.67 5.9 15 22 69 67.0 97 101 44 94 27 0.291972 1.42 27.3 0.67 2.17 0.32 19.8 0.19 0.44 4.4 21 21 61 56.9 97 99 29 94 22 0.231973 3.18 26.7 1.77 4.59 0.51 19.3 0.32 0.71 6.0 16 16 58 65.2 109 112 63 92 29 0.321974 2.06 23.5 1.11 3.01 0.31 20.1 0.19 0.44 6.4 13 13 69 64.9 109 111 37 97 23 0.241975 1.73 21.1 1.02 2.43 0.30 20.5 0.18 0.42 5.7 11 11 60 62.9 97 102 40 106 27 0.251976 3.39 27.6 1.55 5.22 0.42 21.6 0.24 0.60 7.6 29 30 71 72.1 106 121 32 87 24 0.281977 5.57 19.0 3.49 7.65 0.63 13.7 0.46 0.79 7.2 21 35 73 71.1 107 119 112 126 56 0.441978 5.11 16.1 3.50 6.72 0.58 13.2 0.43 0.73 6.7 10 24 70 67.6 104 116 146 201 78 0.391979 5.12 16.9 3.57 6.67 0.47 12.0 0.36 0.58 8.9 15 19 77 73.5 103 115 125 211 78 0.371980 4.46 25.5 2.23 6.68 0.53 16.0 0.37 0.70 6.3 6 16 66 63.9 101 111 65 97 39 0.401981 2.00 27.8 0.34 1.53 0.41 15.4 0.07 0.22 4.4 9 13 55 57.5 93 101 46 93 30 0.321982 0.94 30.3 0.38 1.49 0.14 25.7 0.07 0.21 6.6 29 29 71 68.9 97 100 17 95 14 0.151983 1.62 21.8 0.93 2.31 0.47 20.2 0.28 0.66 3.4 13 17 54 53.0 88 96 38 82 27 0.331984 3.01 27.1 1.41 4.61 0.48 13.7 0.35 0.61 5.8 11 26 63 62.7 102 106 36 88 29 0.331985 1.44 36.2 0.42 2.46 0.37 24.6 0.19 0.55 4.0 12 15 55 53.1 101 102 32 88 23 0.261986 2.35 27.2 1.10 3.61 0.60 18.9 0.38 0.83 3.7 19 23 52 53.8 82 100 46 90 26 0.291987 0.87 36.1 0.26 1.49 0.26 28.6 0.12 0.41 3.3 15 15 53 52.2 92 96 22 87 15 0.171988 1.52 34.8 0.48 2.57 0.31 29.7 0.13 0.50 4.9 11 11 53 57.1 92 93 26 89 17 0.191989 1.40 40.2 0.50 2.31 0.43 19.3 0.27 0.59 2.6 9 9 39 40.8 93 96 39 87 25 0.291990 1.06 28.7 0.50 1.62 0.59 18.1 0.38 0.80 1.4 9 10 25 32.3 72 89 55 89 35 0.391991 1.25 29.4 0.60 1.91 0.58 17.1 0.38 0.77 1.7 9 10 31 38.3 83 95 62 88 33 0.381992 1.12 28.6 0.57 1.66 0.94 18.3 0.60 1.27 1.2 9 9 26 33.0 79 86 78 86 37 0.431993 1.13 44.1 0.51 1.75 0.99 15.4 0.69 1.29 0.9 6 9 20 27.1 71 94 103 86 45 0.521994 1.05 31.3 0.45 1.65 1.35 14.4 0.97 1.73 0.7 9 9 19 24.9 55 98 110 87 51 0.591995 1.71 31.2 0.66 2.76 0.92 12.9 0.69 1.16 1.7 10 12 34 39.6 84 91 87 93 40 0.431996 1.09 27.3 0.52 1.67 0.63 18.1 0.41 0.85 1.7 8 11 38 40.3 63 95 51 88 30 0.341997 0.75 26.6 0.40 1.10 0.50 19.9 0.30 0.69 1.3 8 9 35 35.4 70 86 39 90 27 0.301998 1.02 23.7 0.57 1.47 0.61 17.7 0.40 0.82 1.5 10 10 30 35.5 68 77 56 104 38 0.371999 0.90 32.2 0.37 1.42 1.08 16.3 0.74 1.43 0.7 8 8 22 25.7 58 81 111 106 44 0.422000 2.53 25.1 1.32 3.74 2.40 17.7 1.56 3.23 1.0 9 11 25 30.3 70 88 165 87 43 0.492001 2.07 23.0 1.14 3.01 1.62 12.8 1.21 2.03 1.1 8 12 31 34.7 65 93 145 90 50 0.562002 2.32 27.1 1.09 3.55 1.28 14.4 0.92 1.64 1.4 9 9 34 35.1 65 93 114 86 45 0.522003 2.72 31.3 1.05 4.39 1.07 13.8 0.78 1.36 1.7 8 8 40 37.8 73 88 90 88 39 0.442004 0.63 29.6 0.26 0.99 0.52 20.1 0.31 0.72 1.2 8 8 21 29.8 68 89 36 85 24 0.282005 1.62 46.2 0.15 3.09 0.59 20.2 0.36 0.83 1.7 8 8 24 34.3 79 88 46 87 29 0.332006 1.04 25.2 0.53 1.56 0.76 16.4 0.52 1.01 1.3 6 7 33 33.2 69 86 56 94 37 0.392007 1.20 32.7 0.43 1.97 0.64 16.5 0.43 0.84 1.7 9 17 31 37.5 77 81 63 90 32 0.362008 0.99 31.8 0.37 1.61 0.78 22.7 0.43 1.13 1.2 9 9 27 31.6 68 85 60 90 27 0.30
Bigelow, no calibration coefficient applied:2009 4.33 21.4 2.51 6.15 2.97 11.6 2.29 3.64 1.4 9 9 32 34.4 69 101 255 90 61 0.682010 7.12 30.1 2.91 11.32 3.53 12.4 2.68 4.39 1.4 7 8 36 37.3 66 95 313 88 62 0.702011 6.58 19.1 3.35 5.21 4.28 11.1 3.35 5.21 1.5 7 8 37 35.4 69 91 295 80 59 0.742012 8.86 29.8 3.691 14.02 4.73 9.2 3.882 5.58 1.3 6 8 33 34.3 65.0 97 433 101 80 0.79
Bigelow, calibration coefficient applied:2009 0.54 0.422010 0.88 0.502011 0.82 0.602012 1.10 0.66
LengthBiomass Index Abundance Index
34

Table 12. Survey results from NEFSC offshore spring bottom trawl surveys in the northern management region (strata 20-30, 34-40). Indices are delta distribution stratified means.
Number Number ofBiomass Index Abundance Index Length of Number Nonzero Proportion
Mean CV L95% U95% Mean CV L95% U95% Ind wt Min 5% 50% Mean 95% Max Fish of Tows Tows Non-zero1968 1.01 35.9 0.30 1.72 0.17 31.3 0.07 0.27 6.0 50 51 68 70.4 89 90 13 86 11 0.131969 1.34 44.9 0.16 2.52 0.18 38.3 0.05 0.32 7.5 33 33 71 71.5 99 100 15 87 10 0.111970 2.02 30.9 0.80 3.25 0.34 19.0 0.22 0.47 5.9 30 30 62 65.4 98 99 32 90 22 0.241971 1.04 29.4 0.44 1.64 0.16 27.9 0.07 0.24 6.5 45 53 69 72.6 99 100 20 96 15 0.161972 4.68 18.1 3.05 6.31 0.64 15.0 0.45 0.83 7.1 13 39 74 72.7 100 105 59 96 38 0.401973 1.91 25.5 0.96 2.86 0.43 29.5 0.18 0.69 4.3 17 26 68 65.7 99 106 91 87 36 0.411974 1.48 21.2 0.86 2.09 0.44 14.4 0.31 0.56 3.4 20 23 58 58.3 97 111 86 83 41 0.491975 0.94 18.6 0.60 1.28 0.34 16.7 0.23 0.45 2.8 16 19 53 54.0 87 109 73 87 36 0.411976 2.83 20.5 1.69 3.96 0.67 15.5 0.47 0.88 3.8 14 20 60 61.5 95 106 158 99 52 0.531977 1.03 22.7 0.58 1.48 0.26 19.7 0.16 0.36 3.6 10 31 66 63.4 93 106 61 107 37 0.351978 0.63 23.3 0.34 0.91 0.14 16.4 0.10 0.19 4.0 15 19 73 65.5 89 92 37 113 30 0.271979 0.90 36.8 0.28 1.52 0.14 14.5 0.10 0.19 4.7 12 14 67 62.5 100 118 48 139 40 0.291980 1.62 26.3 0.79 2.46 0.38 14.9 0.27 0.49 3.7 17 22 43 53.3 98 107 84 85 38 0.451981 1.74 24.3 0.91 2.58 0.38 12.8 0.28 0.47 4.4 11 21 52 57.7 95 120 95 87 42 0.481982 3.02 29.5 1.27 4.76 0.35 28.1 0.16 0.54 8.6 25 36 61 68.8 105 108 33 92 22 0.241983 1.59 34.0 0.53 2.64 0.42 27.7 0.19 0.64 3.7 12 13 49 49.9 96 112 34 90 22 0.241984 1.70 33.1 0.60 2.80 0.33 22.9 0.18 0.47 4.7 17 19 62 60.8 93 100 26 86 19 0.221985 2.11 24.6 1.09 3.13 0.35 21.6 0.20 0.49 6.1 13 13 68 66.9 104 108 25 81 21 0.261986 2.16 29.5 0.96 3.37 0.34 21.1 0.20 0.48 6.2 11 14 63 65.4 109 121 30 90 22 0.241987 1.73 29.6 0.73 2.73 0.24 22.1 0.14 0.35 7.1 16 16 66 64.2 99 100 21 83 16 0.191988 2.11 29.1 0.91 3.31 0.61 17.8 0.40 0.82 3.3 10 20 49 49.8 89 110 43 90 26 0.291989 1.64 32.0 0.64 2.63 0.62 24.8 0.32 0.93 2.6 10 11 40 43.2 80 94 48 85 24 0.281990 1.00 32.4 0.37 1.64 0.28 22.6 0.16 0.41 3.6 15 18 47 49.1 106 107 25 90 17 0.191991 1.83 37.7 0.48 3.18 0.59 18.8 0.37 0.81 2.7 12 15 35 42.3 78 100 48 86 28 0.331992 0.91 63.3 -0.19 2.01 0.49 34.6 0.16 0.83 1.8 16 17 35 40.6 82 101 36 83 20 0.241993 1.20 22.7 0.74 1.67 0.68 15.6 0.48 0.89 1.7 10 11 44 41.0 71 90 59 87 27 0.311994 0.95 34.1 0.40 1.50 0.45 20.0 0.28 0.63 2.2 10 13 40 41.0 83 89 45 88 24 0.271995 1.75 37.7 0.81 2.70 0.98 16.7 0.66 1.31 1.8 15 16 33 39.9 73 97 83 88 39 0.441996 1.01 28.2 0.45 1.56 0.67 24.7 0.34 0.99 1.5 15 17 41 43.0 60 70 49 82 20 0.241997 0.56 37.0 0.17 0.95 0.34 27.2 0.16 0.52 1.6 9 9 36 39.4 75 89 34 89 19 0.211998 0.49 29.3 0.23 0.74 0.41 15.5 0.29 0.54 1.1 11 11 19 31.3 67 78 46 115 33 0.291999 1.22 24.5 0.65 1.80 0.82 17.2 0.55 1.10 1.4 9 14 31 35.5 71 97 62 87 33 0.382000 1.44 21.1 0.85 2.03 1.13 12.9 0.84 1.41 1.2 15 17 29 34.5 75 87 99 89 42 0.472001 1.97 33.1 0.69 3.25 1.69 14.1 1.22 2.15 1.1 9 11 24 31.4 75 86 151 89 50 0.562002 2.00 16.8 1.34 2.66 1.76 12.3 1.33 2.18 1.1 12 15 34 36.6 60 73 155 91 50 0.552003 2.38 33.5 0.82 3.95 0.81 20.9 0.48 1.14 2.3 10 13 42 44.2 69 95 79 86 30 0.352004 2.29 30.7 0.91 3.66 0.91 18.7 0.58 1.24 2.5 9 11 48 46.7 81 85 69 88 36 0.412005 2.06 38.5 0.51 3.61 0.71 15.9 0.49 0.93 2.1 11 13 48 45.1 68 75 52 87 31 0.362006 0.93 40.9 0.18 1.67 0.37 28.7 0.16 0.57 2.5 15 13 43 44.8 72 105 33 95 23 0.242007 1.65 70.1 -0.61 3.91 0.56 28.3 0.25 0.86 1.9 11 10 32 36.8 78 85 43 86 19 0.222008 1.78 45.8 0.18 3.38 0.68 21.7 0.39 0.97 1.9 8 16 35 40.8 73 85 61 86 24 0.28
Bigelow, no calibration coefficient applied:2009 4.26 17.3 2.82 5.71 2.27 11.6 1.75 2.78 1.7 11 12 36 39.4 77 93 245 116 63 0.542010 4.96 18.2 3.19 6.73 2.48 12.5 1.87 3.09 1.9 10 14 40 42.3 70 115 222 104 54 0.522011 6.77 18.2 4.35 9.19 3.12 13.5 2.29 3.95 2.1 10 13 44 45.6 75 91 250 91 58 0.642012 5.84 23.7 3.13 8.55 3.58 13.9 2.61 4.56 1.5 10 13 36 38.5 66 97 360 110 72 0.65
Bigelow, calibration coefficient applied:2009 0.53 0.322010 0.61 0.352011 0.84 0.442012 0.72 0.50
35

Table 13. Survey results from ASMFC summer shrimp surveys in the northern management region (strata 1, 3, 5, 6-8). Indices are delta distribution stratified means.
Number Number of Proportion ofBiomass Index Abundance Index Length of Number Nonzero Nonzero
Mean CV L95% U95% Mean CV L95% U95% Ind wt Min 5% 50% Mean 95% Max Fish of Tows Tows Tows1991 1.96 20.6 1.17 2.75 2.90 11.2 2.27 3.54 0.65 11 15 24 27.5 59 96 125 43 39 0.911992 2.92 26.5 1.40 4.43 2.91 11.2 2.27 3.54 0.93 11 13 28 31.5 56 78 135 45 40 0.891993 3.34 31.7 1.39 5.30 3.76 14.4 2.70 4.81 0.83 7 9 23 27.6 59 102 170 46 42 0.911994 1.64 25.5 0.84 2.45 3.48 15.3 2.43 4.52 0.48 5 10 19 24.1 48 95 166 43 37 0.861995 1.64 28.3 0.73 2.54 2.09 21.3 1.22 2.96 0.75 11 19 26 31.2 67 76 83 35 24 0.691996 3.43 31.2 1.33 5.53 2.97 14.8 2.11 3.83 1.12 13 14 34 34.4 63 90 107 32 30 0.941997 2.08 25.5 1.04 3.12 1.58 16.5 1.07 2.09 1.32 11 16 32 37.7 62 73 72 40 31 0.781998 2.30 35.2 0.71 3.89 2.12 14.9 1.50 2.74 1.07 12 16 23 31.3 61 77 84 35 31 0.891999 6.35 19.8 4.77 7.93 7.02 12.4 5.31 8.73 0.93 8 9 28 30.9 65 82 301 42 39 0.932000 4.12 25.1 2.09 6.15 5.76 14.7 4.10 7.41 0.67 11 15 28 30.2 51 82 215 35 30 0.862001 8.55 24.5 4.44 12.66 11.12 12.2 8.46 13.79 0.67 11 13 26 29.5 51 85 442 36 36 1.002002 12.86 14.6 9.18 16.54 11.79 10.4 9.38 14.20 1.07 11 17 32 35.3 59 94 493 38 38 1.002003 8.24 30.2 4.47 12.02 5.86 14.6 4.17 7.54 1.27 3 13 38 37.4 63 87 236 37 36 0.972004 4.60 12.6 3.46 5.74 3.39 10.9 2.66 4.11 1.32 11 11 34 35.7 66 75 142 35 33 0.942005 7.60 16.6 5.13 10.06 5.25 10.4 4.19 6.32 1.38 9 14 34 37.4 66 89 271 46 44 0.962006 7.36 22.2 3.81 10.91 4.34 8.8 3.09 5.60 1.52 7 11 30 37.2 70 89 143 29 29 1.002007 5.13 32.7 1.84 8.42 4.39 13.0 3.26 5.51 0.92 9 11 19 28.2 64 79 218 43 36 0.842008 3.90 23.3 2.12 5.67 2.85 13.8 2.08 3.62 1.35 10 14 32 36.1 67 82 116 37 31 0.842009 4.23 32.7 1.52 6.94 3.10 12.1 2.36 3.84 1.03 11 13 30 32.7 60 80 159 49 45 0.922010 3.11 24.8 1.60 4.62 2.57 15.9 1.77 3.37 1.09 9 16 33 35.1 58 90 132 49 43 0.882011 2.71 18.5 1.72 3.69 2.25 10.3 1.80 2.71 1.18 13 13 37 36.2 59 77 124 47 38 0.812012 3.71 23.4 2.01 5.41 3.65 14.5 2.61 4.68 0.89 4 10 26 30.8 56 92 192 49 41 0.84
36

Table 14. Monkfish indices from Maine-New Hampshire inshore surveys, strata 1-4, regions 1-5.
YearFall Stratified Mean Number SE
Fall Stratified
Mean Weight SE
2000 4.8 0.61 1.6 0.282001 11.1 1.56 4.8 0.502002 4.1 1.13 3.5 1.142003 3.7 0.64 3.6 0.802004 3.0 0.52 3.6 0.842005 1.8 0.25 2.0 0.472006 2.9 0.31 1.8 0.202007 3.1 0.43 2.1 0.352008 4.1 0.70 3.0 0.412009 2.0 0.41 1.9 0.522010 1.1 0.17 0.7 0.132011 1.0 0.17 1.1 0.202012
Year
Spring Stratified
Mean Number SE
Spring Stratified
Mean Weight SE
2001 6.0 0.91 1.0 0.152002 2.4 0.33 1.1 0.172003 1.0 0.14 0.6 0.182004 1.4 0.17 0.4 0.122005 1.1 0.16 0.8 0.152006 0.3 0.06 0.1 0.032007 1.1 0.18 0.4 0.102008 1.4 0.19 0.5 0.082009 0.8 0.11 0.2 0.042010 0.6 0.10 0.2 0.042011 0.3 0.05 0.2 0.072012 0.4 0.06 0.3 0.11
37

Table 15. Survey results from NEFSC offshore autumn bottom trawl surveys in the southern management region (strata 1-19, 61-76). Indices are delta distribution stratified means.
Number Number of Proportionof Number Nonzero Nonzero
Mean CV L95% U95% Mean CV L95% U95% Ind wt Min 5% 50% Mean 95% Max Fish of Tows Tows Tows1963 3.64 26.5 1.82 5.47 1.20 19.6 0.74 1.66 3.0 7 17 53 50.4 91 97 102 73 36 0.491964 6.14 57.2 2.67 9.61 1.64 22.7 0.91 2.37 3.5 14 21 53 52.0 86 101 132 83 34 0.411965 5.09 22.8 2.91 7.28 1.15 16.4 0.78 1.52 4.2 10 15 59 56.3 91 104 83 85 39 0.461966 7.06 14.5 5.06 9.06 1.93 14.9 1.36 2.49 3.6 7 7 51 49.6 87 98 101 87 56 0.641967 1.15 26.3 0.62 1.68 0.52 19.2 0.32 0.71 2.2 14 19 31 40.6 83 100 98 163 42 0.261968 0.90 25.7 0.46 1.35 0.40 24.2 0.21 0.59 2.2 12 17 45 46.3 75 86 77 164 39 0.241969 1.36 32.3 0.51 2.21 0.54 21.8 0.31 0.77 2.5 10 14 41 45.4 88 96 101 163 43 0.261970 1.34 27.2 0.64 2.04 0.35 16.8 0.23 0.47 3.6 4 13 55 53.3 84 104 58 161 35 0.221971 0.71 32.8 0.28 1.14 0.28 23.8 0.15 0.41 2.8 5 8 39 42.3 95 98 55 168 28 0.171972 5.05 18.6 3.37 6.72 4.11 35.1 1.28 6.94 1.3 12 16 23 31.8 74 99 604 161 85 0.531973 2.03 25.5 1.04 3.02 1.18 13.8 0.86 1.49 1.6 13 14 32 37.7 77 93 280 154 70 0.451974 0.71 27.8 0.32 1.10 0.22 23.8 0.12 0.32 3.3 14 16 54 52.9 81 101 56 153 26 0.171975 2.05 17.9 1.33 2.77 0.65 17.2 0.43 0.87 2.7 8 17 45 46.3 87 105 127 158 51 0.321976 1.09 25.7 0.55 1.64 0.31 20.2 0.19 0.44 3.2 11 11 51 50.7 77 95 60 165 34 0.211977 1.88 18.5 1.20 2.56 0.37 14.6 0.27 0.48 4.2 5 16 55 53.1 95 106 94 172 50 0.291978 1.39 18.7 0.88 1.91 0.26 16.0 0.18 0.34 4.5 13 17 61 56.5 87 101 68 219 39 0.181979 2.28 22.4 1.28 3.27 0.69 15.5 0.48 0.90 2.3 7 16 34 40.5 84 109 182 205 70 0.341980 1.88 19.2 1.18 2.58 0.73 21.0 0.43 1.02 2.2 3 16 34 41.6 85 104 113 159 42 0.261981 2.86 34.5 0.89 4.84 0.97 20.4 0.58 1.35 2.0 6 17 38 40.7 71 99 176 146 59 0.401982 0.66 23.3 0.36 0.95 0.61 19.8 0.37 0.85 1.1 13 15 26 32.5 66 73 98 143 42 0.291983 2.16 34.6 0.70 3.61 0.78 20.1 0.47 1.08 2.3 7 16 45 44.4 72 100 109 146 49 0.341984 0.75 40.8 0.16 1.34 0.31 32.4 0.11 0.51 2.4 5 13 47 45.7 68 93 42 146 25 0.171985 1.33 21.9 0.76 1.89 0.52 16.5 0.36 0.69 2.1 17 17 40 42.0 72 96 100 145 46 0.321986 0.56 29.1 0.24 0.88 0.33 23.6 0.17 0.48 1.5 7 14 34 37.6 68 78 60 146 33 0.231987 0.28 29.3 0.12 0.43 0.48 18.5 0.31 0.66 0.6 12 13 20 25.0 56 61 67 132 27 0.201988 0.55 31.7 0.21 0.90 0.23 29.4 0.10 0.36 2.4 19 27 36 45.1 87 91 27 129 19 0.151989 0.64 42.0 0.30 0.98 0.38 26.7 0.18 0.58 1.4 7 7 42 38.0 57 77 57 129 23 0.181990 0.45 47.5 0.05 0.84 0.29 31.0 0.12 0.47 1.1 9 13 24 33.1 61 81 47 136 22 0.161991 0.80 35.9 0.24 1.35 0.69 32.7 0.25 1.13 0.9 14 15 23 30.8 57 81 106 131 27 0.211992 0.32 34.5 0.19 0.44 0.34 17.7 0.22 0.46 0.9 8 11 30 32.2 54 74 46 129 21 0.161993 0.29 41.2 0.06 0.53 0.29 27.0 0.14 0.44 0.8 10 13 32 30.4 52 68 46 130 24 0.181994 0.62 35.9 0.19 1.05 0.60 20.9 0.35 0.84 0.9 8 12 25 29.2 59 83 85 135 31 0.231995 0.41 29.7 0.19 0.64 0.49 24.2 0.26 0.73 0.8 11 13 25 29.4 54 66 72 129 29 0.221996 0.39 22.4 0.22 0.56 0.23 22.4 0.13 0.34 1.6 18 19 42 42.3 62 68 31 131 21 0.161997 0.59 20.5 0.35 0.83 0.31 18.2 0.20 0.42 1.9 9 9 49 44.6 70 71 43 131 24 0.181998 0.50 26.1 0.24 0.76 0.33 28.0 0.15 0.51 1.5 11 11 36 37.0 68 87 45 131 20 0.151999 0.30 18.2 0.20 0.41 0.45 14.9 0.32 0.58 0.7 12 14 27 29.2 52 55 109 106 44 0.422000 0.48 62.2 0.27 0.70 0.42 18.4 0.27 0.57 1.1 5 15 33 34.3 63 70 64 132 30 0.232001 0.71 24.3 0.37 1.05 0.38 18.8 0.24 0.52 1.7 4 11 39 41.7 70 80 51 130 30 0.232002 1.32 20.6 0.78 1.85 0.83 16.2 0.57 1.09 1.5 6 14 41 39.1 61 81 110 130 47 0.362003 0.83 17.6 0.54 1.11 0.95 17.4 0.63 1.28 0.9 6 7 18 28.3 59 70 128 130 41 0.322004 0.97 33.5 0.33 1.61 0.47 24.5 0.25 0.70 1.6 7 15 45 40.4 64 78 67 133 32 0.242005 0.80 25.0 0.41 1.20 0.58 20.9 0.34 0.81 1.3 7 13 42 38.5 57 67 76 123 34 0.282006 0.83 27.8 0.38 1.29 0.45 19.5 0.28 0.62 1.7 6 12 44 40.6 65 77 83 151 36 0.242007 0.51 26.1 0.25 0.76 0.20 23.2 0.11 0.28 2.6 25 25 51 50.1 68 69 27 142 19 0.132008 0.41 37.2 0.11 0.71 0.20 26.4 0.10 0.30 2.1 4 4 45 38.6 69 88 39 142 20 0.14
Bigelow, no calibration coefficient applied:2009 1.87 15.2 1.32 2.43 1.57 13.9 1.14 2.00 1.2 6 7 26 33.3 62 77 346 177 84 0.472010 3.52 24.6 1.83 5.22 2.71 20.9 1.60 3.83 1.1 5 9 23 32.0 61 80 492 183 91 0.502011 2.65 24.0 1.40 3.89 3.23 16.2 2.20 4.25 0.6 4 7 19 26.1 53 76 575 170 96 0.562012 2.83 15.9 1.95 3.71 1.77 16.1 1.21 2.3 1.6 4 23 39 41.6 62 82 340 173 80 0.46
Bigelow, calibration coefficient applied:2009 0.23 0.222010 0.44 0.382011 0.33 0.452012 0.35 0.25
LengthBiomass Index Abundance Index
38

Table 16. Survey results from NEFSC offshore spring bottom trawl surveys in the southern management region (strata 1-19, 61-76). Indices are delta distribution stratified means.
Number Number ofBiomass Index Abundance Index Length of Nonzero Number
Mean CV L95% U95% Mean CV L95% U95% Ind wt Min 5% 50% Mean 95% Max Fish Tows of Tows1968 1.16 26.0 0.57 1.75 0.21 20.6 0.13 0.30 5.41 21 23 63 62.5 94 95 65 31 1501969 0.96 27.6 0.44 1.47 0.22 19.2 0.14 0.30 4.10 7 25 47 54.3 91 111 41 31 1551970 1.01 27.6 0.46 1.55 0.18 20.9 0.10 0.25 5.65 22 22 65 63.9 102 108 40 31 1661971 0.77 30.0 0.32 1.22 0.20 24.8 0.10 0.30 3.68 13 16 50 53.3 101 115 42 24 1601972 1.89 19.5 1.17 2.61 0.36 13.7 0.27 0.46 5.17 14 22 59 59.1 103 123 79 48 1651973 1.90 13.8 1.54 2.25 1.05 9.3 0.85 1.25 2.17 11 19 32 41.1 80 110 589 128 1871974 1.16 18.1 0.77 1.56 0.49 12.3 0.37 0.60 3.24 14 21 44 49.1 93 117 201 70 1321975 0.95 20.4 0.57 1.32 0.45 13.8 0.33 0.57 2.80 10 22 44 47.6 87 107 169 61 1341976 1.21 15.9 0.83 1.59 0.40 12.0 0.31 0.50 3.34 13 22 48 51.5 91 110 259 78 1621977 1.21 18.2 0.77 1.64 0.30 11.3 0.23 0.37 4.61 16 21 51 56.8 95 116 173 75 1601978 0.75 16.9 0.52 0.97 0.33 10.7 0.26 0.40 2.99 11 17 39 45.9 90 104 196 66 1611979 0.76 26.2 0.46 1.05 0.28 21.2 0.16 0.40 2.94 10 14 37 44.4 98 124 125 50 1941980 0.80 19.5 0.49 1.10 0.45 10.8 0.35 0.55 1.93 18 21 34 40.8 83 106 346 99 2041981 1.82 18.5 1.16 2.47 0.78 15.8 0.54 1.03 2.56 12 22 40 44.6 89 113 345 74 1411982 2.81 22.2 1.59 4.03 0.94 15.4 0.66 1.23 2.32 11 14 38 42.4 89 104 251 68 1501983 0.95 28.5 0.42 1.49 0.27 17.8 0.18 0.36 3.51 24 24 47 51.8 97 112 55 36 1471984 0.75 35.8 0.22 1.27 0.18 25.9 0.09 0.27 4.07 21 21 47 50.9 96 97 35 22 1491985 0.33 36.9 0.09 0.57 0.16 28.0 0.07 0.25 2.05 22 22 39 42.3 85 90 31 21 1471986 0.83 29.7 0.35 1.31 0.28 28.5 0.12 0.44 2.92 15 24 43 48.7 90 102 65 36 1491987 0.50 52.4 -0.01 1.01 0.11 25.6 0.05 0.16 4.61 15 15 59 52.7 102 103 30 21 1501988 0.43 15.0 0.30 0.55 0.44 17.9 0.29 0.60 0.97 17 18 30 34.0 61 82 67 33 1321989 0.36 17.9 0.24 0.49 0.20 25.3 0.10 0.30 1.50 15 24 41 41.4 69 79 36 18 1291990 1.00 22.3 0.57 1.44 0.21 13.2 0.15 0.26 4.03 16 21 53 56.5 86 93 39 23 1281991 0.59 29.2 0.32 0.86 0.32 28.0 0.14 0.49 1.51 15 23 33 37.6 69 101 61 31 1321992 0.21 34.1 0.07 0.35 0.18 25.5 0.09 0.27 1.24 14 19 28 35.0 69 85 28 17 1281993 0.26 32.1 0.10 0.43 0.20 25.1 0.10 0.29 1.32 17 19 38 38.6 56 72 29 18 1281994 0.32 29.1 0.14 0.50 0.11 24.9 0.06 0.17 2.38 13 13 41 44 91 93 24 18 1311995 0.53 47.9 0.03 1.02 0.20 22.6 0.11 0.28 2.64 18 19 38 46 80 81 32 20 1291996 0.29 25.1 0.15 0.43 0.14 22.9 0.07 0.20 2.08 9 9 44 44 80 81 27 20 1431997 0.13 23.6 0.07 0.19 0.12 22.1 0.07 0.18 1.06 18 18 37 36 58 75 38 14 1301998 0.28 16.7 0.19 0.37 0.25 15.9 0.17 0.33 1.11 12 16 35 36 64 77 40 30 1311999 0.63 20.6 0.37 0.88 0.33 16.1 0.23 0.44 1.90 16 19 41 43 74 94 63 32 1312000 0.29 19.8 0.18 0.41 0.24 18.3 0.15 0.33 1.22 14 14 38 38 61 78 32 25 1312001 0.24 31.3 0.09 0.39 0.23 21.4 0.14 0.33 1.09 11 15 34 36 57 68 44 50 892002 0.37 32.8 0.13 0.62 0.32 35.6 0.10 0.54 1.18 22 23 37 39 53 62 50 50 912003 1.42 19.0 0.89 1.95 0.31 17.8 0.20 0.42 3.72 15 29 57 57 80 87 65 30 862004 0.19 34.9 0.06 0.32 0.12 27.1 0.05 0.18 1.57 22 21 37 40 61 62 24 36 882005 0.37 18.7 0.23 0.50 0.26 29.1 0.11 0.41 1.42 20 20 36 39 61 68 41 26 1312006 0.54 30.6 0.22 0.86 0.17 22.3 0.10 0.25 3.14 24 15 37 53 80 80 28 20 1322007 0.56 24.1 0.29 0.82 0.26 17.0 0.17 0.34 2.14 20 23 48 46 69 75 77 30 1582008 0.39 32.9 0.14 0.64 0.19 31.3 0.07 0.30 2.06 17 17 41 46 64 84 32 19 140
Bigelow, no calibration coefficient applied:2009 2.97 26.8 1.41 4.53 1.15 16.5 0.78 1.532010 1.80 21.3 1.05 2.55 1.08 21.0 0.63 1.522011 3.27 14.7 2.33 4.21 1.83 16.0 1.26 2.412012 2.97 12.6 2.24 3.70 2.17 11.0 1.70 2.64
Bigelow, calibration coefficient applied:2009 0.37 0.162010 0.22 0.152011 0.41 0.262012 0.37 0.30
39

Table 17. Survey results from NEFSC offshore winter bottom trawl surveys in the southern management region (strata 1-19, 61-76). Indices are delta distribution stratified means. The winter survey was discontinued after 2007.
Biomass Abundance Number Number ofRaw Index Raw Index Length of Number Nonzero
Mean L95% U95% Mean L95% U95% Ind wt Min 5% 50% Mean 95% Max Fish of Tows Tows1992 6.314 4.160 8.468 5.234 3.854 6.614 1.139 11 22 33 36.0 51 95 582 100 661993 6.357 4.563 8.150 4.952 3.898 6.005 1.193 9 21 36 37.7 53 98 555 108 771994 3.321 2.372 4.270 2.484 1.870 3.097 1.298 8 16 31 35.1 61 78 278 77 561995 3.774 2.472 5.076 3.137 2.104 4.170 1.209 19 21 35 37.4 57 101 365 106 761996 4.496 3.435 5.557 3.438 2.662 4.213 1.294 10 22 37 39.1 57 100 456 119 871997 4.460 3.190 5.731 2.976 2.323 3.629 1.456 10 18 39 39.8 59 82 359 107 891998 2.849 1.997 3.701 1.494 1.150 1.838 1.876 10 20 41 44.1 69 103 203 114 771999 4.090 3.066 5.114 3.068 2.370 3.767 1.319 10 17 34 37.8 61 87 362 115 832000 5.690 4.023 7.356 4.428 3.166 5.689 1.265 11 24 103 39.2 103 96 616 118 932001 7.182 4.501 9.863 4.380 2.997 5.762 1.383 8 24 103 39.3 103 84 729 142 1152002 6.235 4.794 7.675 3.474 2.737 4.212 1.744 15 30 103 44.5 103 86 550 143 1132003 5.482 3.491 7.473 2.258 1.580 2.937 2.418 12 25 103 45.5 103 85 316 86 722004 7.171 4.308 10.034 4.397 2.836 5.957 1.568 13 23 103 41.2 103 88 682 123 1032005 4.531 2.657 6.405 2.972 2.043 3.902 1.497 13 23 103 40.0 103 90 313 91 592006 5.481 4.022 6.939 3.082 2.327 3.837 1.743 22 31 103 44.7 103 92 430 114 782007 3.395 2.586 4.205 1.472 1.212 1.732 2.251 14 23 42 48.3 103 91 217 118 83
40

Table 18. Survey results from NEFSC offshore scallop dredge surveys in the southern management region (shellfish strata 6, 7, 10, 11, 14, 15, 18, 19, 22-31, 33-35, 46, 47, 55, 58-61, 621, 631). Indices are delta distribution stratified means.
Number Number of ProportionAbundance Index Length of Number Nonzero NonzeroMean CV L95% U95% Min 5% 50% Mean 95% Max Fish of Tows Tows Tows
1984 1.29 7.0 1.11 1.46 6 11 28 29.5 54 82 410 254 165 0.651985 1.52 8.9 1.26 1.79 7 9 25 28.7 53 84 493 282 183 0.651986 1.25 8.2 1.05 1.45 8 10 15 22.9 54 95 431 296 183 0.621987 3.15 6.2 2.77 3.54 8 9 13 18.6 51 90 1253 315 255 0.811988 1.67 8.6 1.39 1.95 7 12 28 29.8 49 97 572 316 187 0.591989 1.00 8.3 0.83 1.16 6 10 31 31.9 53 101 303 304 147 0.481990 1.53 6.5 1.34 1.73 6 10 18 24.4 54 94 563 303 205 0.681991 2.28 6.5 1.99 2.57 7 9 14 21.0 45 94 808 315 241 0.771992 1.94 7.3 1.66 2.22 5 9 25 27.3 52 97 644 316 235 0.741993 2.85 5.0 2.57 3.12 8 10 15 21.8 48 73 995 301 258 0.861994 3.40 5.9 3.01 3.80 8 10 15 22.2 51 87 1145 314 265 0.841995 2.26 6.6 1.97 2.56 7 9 27 29.6 57 92 764 314 243 0.771996 2.01 6.6 1.75 2.27 7 9 23 29.9 59 81 638 298 226 0.761997 1.11 7.2 0.95 1.27 7 13 33 36.7 65 76 388 313 196 0.631998 1.01 7.0 0.88 1.15 6 11 20 30.2 61 79 371 319 183 0.571999 2.59 8.5 2.16 3.02 6 10 16 23.5 55 84 856 306 248 0.812000 2.24 6.1 1.97 2.51 8 9 18 27.3 54 87 832 315 240 0.762001 1.71 6.7 1.48 1.94 7 8 35 36.0 64 77 549 334 233 0.702002 1.71 6.6 1.49 1.93 7 11 35 34.2 60 86 598 310 203 0.652003 2.78 7.1 2.39 3.17 6 9 15 24.4 58 87 819 294 211 0.722004 2.88 6.5 2.51 3.24 9 11 26 29.8 61 83 860 348 290 0.832005 2.01 6.6 1.75 2.27 8 10 28 31.3 56 83 859 344 265 0.772006 1.45 6.1 1.27 1.62 7 7 29 31.1 61 83 571 327 230 0.702007 0.83 8.2 0.69 0.96 7 12 39 40.2 69 84 366 336 183 0.542008 1.00 8.9 0.83 1.18 7 7 26 31.3 68 75 350 285 162 0.572009 0.79 9.8 0.64 0.94 6 10 25 30.9 65 80 248 269 133 0.492010 0.74 9.9 0.59 0.88 7 8 35 35.9 59 77 213 275 135 0.492011 0.93 12.5 0.70 1.16 8 10 29 32.6 57 75 204 203 112 0.552012 1.32 8.4 1.10 1.54 6 8 32 33.0 55 70 170 132 84 0.64
41

Table 19. Age length key used for estimating mean lengths at age and variation from ages in the spring, winter, 2001 & 2004 cooperative, and fall surveys.
agelength 1 2 3 4 5 6 7 8 9 10 total
8 1 19 4 4
10 19 1911 25 3 2812 26 9 3513 23 21 4414 24 18 4215 27 28 5516 15 48 6317 22 43 6518 26 56 2 8419 8 54 16 7820 4 50 34 8821 25 72 9722 29 82 11123 32 81 1 11424 22 120 14225 23 127 15026 27 149 17627 22 174 5 20128 20 140 53 21329 6 89 130 22530 4 46 163 21331 3 26 178 20732 26 183 20933 22 154 17634 1 19 192 21235 23 203 22636 25 184 20937 20 197 6 22338 20 173 31 22439 11 104 84 19940 8 63 140 21141 3 29 171 20342 26 200 22643 1 22 209 23244 26 197 22345 19 200 21946 24 179 20347 28 184 4 21648 17 197 32 24649 12 123 81 21650 13 98 141 25251 2 33 157 19252 1 28 186 21553 24 186 21054 20 184 20455 19 198 21756 15 191 1 20757 12 179 1 19258 20 143 3 16659 19 117 25 16160 8 68 87 16361 2 37 99 13862 19 113 13263 1 13 81 9564 9 101 11065 12 86 9866 7 60 6767 5 63 6868 3 66 6969 8 53 2 6370 3 38 23 6471 3 27 32 6272 16 52 6873 2 52 5474 4 51 5575 1 38 3976 4 42 4677 4 31 3578 2 41 4379 1 26 2780 3 40 9 5281 2 18 9 2982 1 18 20 3983 5 20 2584 2 25 2785 2 18 2086 3 10 1 1487 1 15 1688 4 12 1689 2 7 990 2 1 391 7 792 3 2 593 4 494 2 295 1 2 2 596 1 2 397 2 298 1 1 2
102 2 2103 1 1105 2 2107 1 1110 1 1total 224 544 1336 2202 2220 1986 944 486 169 16 10127
42

Table 20. Area swept expansions used for scaling the stratified number per tow indices for input to SCALE. Nm2 represents the square nautical miles covered by the survey.
Survey nm2 footprint expansionsShrimp North 6,147 0.00350 1,756,286Winter South 30,014 0.01270 2,363,307Scallop South 13,204 0.00110 12,003,636Fall & Spring North 26,265 0.01120 2,345,089Fall & Spring South 37,081 0.01120 3,310,804Fall and spring combine albatross 63,346 0.01120 5,655,893Fall and spring combine Bigelow 63,346 0.00700 9,049,429ME/NH Fall North 4,517 0.00462 977,324MDMF Fall North 1,055 0.00385 274,311
43
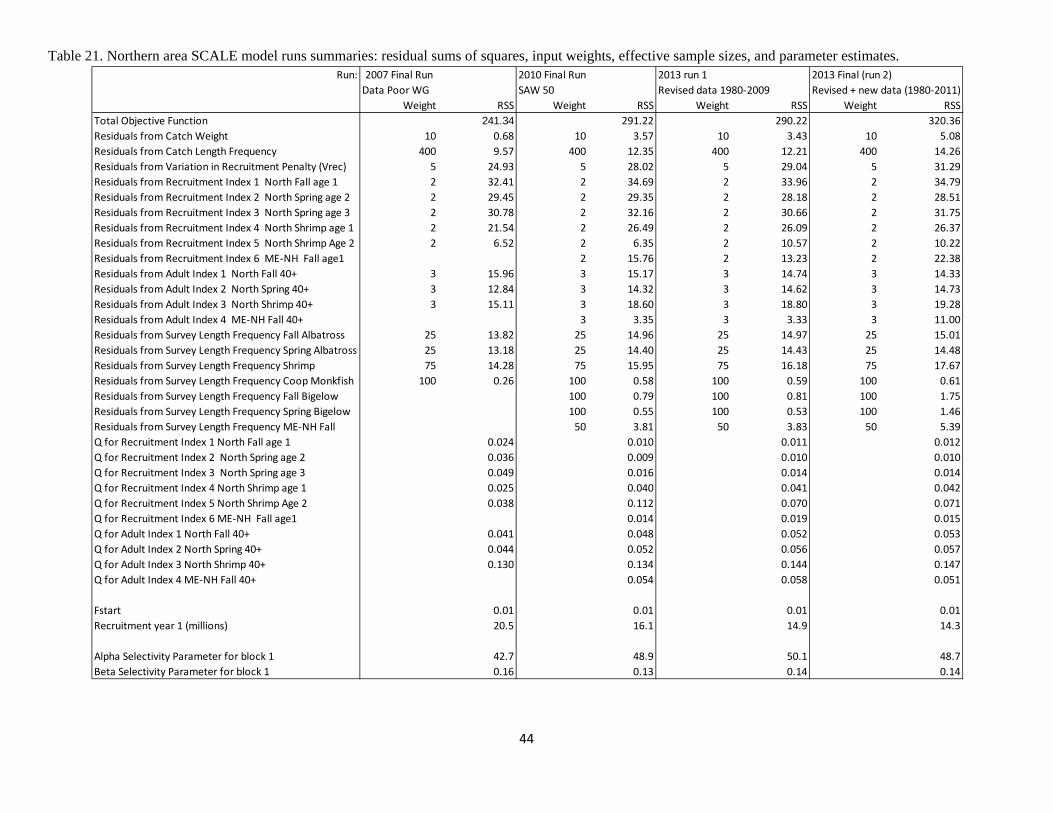
Table 21. Northern area SCALE model runs summaries: residual sums of squares, input weights, effective sample sizes, and parameter estimates.
Run: 2007 Final Run 2010 Final Run 2013 run 1 2013 Final (run 2)Data Poor WG SAW 50 Revised data 1980-2009 Revised + new data (1980-2011)
Weight RSS Weight RSS Weight RSS Weight RSSTotal Objective Function 241.34 291.22 290.22 320.36Residuals from Catch Weight 10 0.68 10 3.57 10 3.43 10 5.08Residuals from Catch Length Frequency 400 9.57 400 12.35 400 12.21 400 14.26Residuals from Variation in Recruitment Penalty (Vrec) 5 24.93 5 28.02 5 29.04 5 31.29Residuals from Recruitment Index 1 North Fall age 1 2 32.41 2 34.69 2 33.96 2 34.79Residuals from Recruitment Index 2 North Spring age 2 2 29.45 2 29.35 2 28.18 2 28.51Residuals from Recruitment Index 3 North Spring age 3 2 30.78 2 32.16 2 30.66 2 31.75Residuals from Recruitment Index 4 North Shrimp age 1 2 21.54 2 26.49 2 26.09 2 26.37Residuals from Recruitment Index 5 North Shrimp Age 2 2 6.52 2 6.35 2 10.57 2 10.22Residuals from Recruitment Index 6 ME-NH Fall age1 2 15.76 2 13.23 2 22.38Residuals from Adult Index 1 North Fall 40+ 3 15.96 3 15.17 3 14.74 3 14.33Residuals from Adult Index 2 North Spring 40+ 3 12.84 3 14.32 3 14.62 3 14.73Residuals from Adult Index 3 North Shrimp 40+ 3 15.11 3 18.60 3 18.80 3 19.28Residuals from Adult Index 4 ME-NH Fall 40+ 3 3.35 3 3.33 3 11.00Residuals from Survey Length Frequency Fall Albatross 25 13.82 25 14.96 25 14.97 25 15.01Residuals from Survey Length Frequency Spring Albatross 25 13.18 25 14.40 25 14.43 25 14.48Residuals from Survey Length Frequency Shrimp 75 14.28 75 15.95 75 16.18 75 17.67Residuals from Survey Length Frequency Coop Monkfish 100 0.26 100 0.58 100 0.59 100 0.61Residuals from Survey Length Frequency Fall Bigelow 100 0.79 100 0.81 100 1.75Residuals from Survey Length Frequency Spring Bigelow 100 0.55 100 0.53 100 1.46Residuals from Survey Length Frequency ME-NH Fall 50 3.81 50 3.83 50 5.39Q for Recruitment Index 1 North Fall age 1 0.024 0.010 0.011 0.012Q for Recruitment Index 2 North Spring age 2 0.036 0.009 0.010 0.010Q for Recruitment Index 3 North Spring age 3 0.049 0.016 0.014 0.014Q for Recruitment Index 4 North Shrimp age 1 0.025 0.040 0.041 0.042Q for Recruitment Index 5 North Shrimp Age 2 0.038 0.112 0.070 0.071Q for Recruitment Index 6 ME-NH Fall age1 0.014 0.019 0.015Q for Adult Index 1 North Fall 40+ 0.041 0.048 0.052 0.053Q for Adult Index 2 North Spring 40+ 0.044 0.052 0.056 0.057Q for Adult Index 3 North Shrimp 40+ 0.130 0.134 0.144 0.147Q for Adult Index 4 ME-NH Fall 40+ 0.054 0.058 0.051
Fstart 0.01 0.01 0.01 0.01Recruitment year 1 (millions) 20.5 16.1 14.9 14.3
Alpha Selectivity Parameter for block 1 42.7 48.9 50.1 48.7Beta Selectivity Parameter for block 1 0.16 0.13 0.14 0.14
44

Table 22. Southern area SCALE model runs summaries: residual sums of squares, input weights, effective sample sizes, and parameter estimates. Run: DPWG Final Run (2007) SAW 50 Final Run (2010) 2013 run 1 2013 run 2 2013 run 3 - Final run
Revised data 1980-2009 Revised+new data (1980-2011) 1 Selectivity block 1980-2011Weight RSS Weight RSS Weight RSS Weight RSS Weight RSS
Total Objective Function 287.71 358.8 383.4 419.88 420.1Resid from Catch Weight 10 0.93 10 0.91 10 0.96 10 1.22 10 1.26Resid from Catch LF 400 9.22 400 12.09 400 11.79 400 13.86 400 13.58Resid from Var in Recruit Penalty (Vrec) 5 13.59 5 22.00 5 24.48 5 26.64 5 26.59Resid from South Fall age 1 2 29.50 2 49.34 2 49.11 2 55.76 2 55.76Resid from South Spring age 2 2 16.95 2 33.79 2 34.02 2 37.90 2 37.91Resid from South Spring Age 3 2 36.32 2 40.00 2 58.45 2 59.62 2 59.55Resid from South Winter age 2 2 6.85 2 6.67 2 6.66 2 6.64 2 6.62Resid from South Winter Age 3 2 12.27 2 13.03 2 12.17 2 12.11 2 12.08Resid from South Scallop age 1 3 29.31 3 32.55 3 43.71 3 53.61 3 53.61Resid from South Scallop age 2 3 13.56 3 15.95 3 9.89 3 14.44 3 14.42Resid from Adult South Fall 40+ 3 20.74 3 24.44 3 24.28 3 24.39 3 24.73Resid from Adult South Spring 40+ 3 27.87 3 28.82 3 29.13 3 31.03 3 31.19Resid from Adult South Winter 40+ 3 4.08 3 5.25 3 5.14 3 5.07 3 5.11Resid from Adult South Scallop 40+ 3 16.66 3 17.36 3 17.22 3 16.91 3 17.04Resid from Survey LF Fall Albatross 25 12.60 25 13.91 25 13.89 25 13.89 25 13.89Resid from Survey LF Spring Albatross 25 16.84 25 17.97 25 17.93 25 17.95 25 17.95Resid from Survey LF Winter 75 5.64 75 6.43 75 6.44 75 6.42 75 6.41Resid from Survey LF Coop Monkfish 100 0.33 100 0.72 100 0.71 100 0.72 100 0.71Resid from Survey LF Scallop 75 14.46 75 16.40 75 16.34 75 17.85 75 17.84Resid from Survey LF Fall Bigelow 100 0.70 100 0.69 100 2.09 100 2.09Resid from Survey LF Spring Bigelow 100 0.43 100 0.40 100 1.77 100 1.77Q for Recruit Idx 1 Fall age 1 0.024 0.006 0.006 0.007 0.007Q for Recruit Idx 2 Spring age 2 0.045 0.002 0.002 0.002 0.002Q for Recruit Idx 3 Spring age 3 0.045 0.009 0.007 0.007 0.007Q for Recruit Idx 4 Winter age 2 0.038 0.010 0.009 0.009 0.009Q for Recruit Idx 5 Winter age 3 0.046 0.083 0.069 0.072 0.072Q for Recruit Idx 6 Scallop age 1 0.026 0.281 0.193 0.184 0.182Q for Recruit Idx 7 Scallop age 2 0.040 0.168 0.200 0.199 0.198Q for Adult Idx 1 Fall 40+ 0.027 0.023 0.022 0.023 0.023Q for Adult Idx 2 Spring 40+ 0.018 0.016 0.015 0.016 0.016Q for Adult Idx 3 Winter 40+ 0.249 0.155 0.143 0.153 0.152Q for Adult Idx 4 Scallop 40+ 0.510 0.187 0.174 0.186 0.184
Fstart 0.2 0.2 0.2 0.2 0.2 Recruitment year 1 (millions) 31.1 28.1 30.4 28.2 28.5
Alpha Selectivity Parameter for Block 1 1980-1995 40.24 1980-2001 45.59 1980-2001 43.47 1980-2001 44.11 1980-2011 42.59Beta Selectivity Parameter for Block 1 0.13 0.15 0.15 0.15 0.15
Alpha Selectivity Parameter for Block 2 1996-2003 48.32 2002-2009 50.69 2002-2009 44.06 2002-2011 40.83Beta Selectivity Parameter for Block 2 0.15 0.13 0.13 0.15
Alpha Selectivity Parameter for Block 3 2004-2007 50.98Beta Selectivity Parameter for Block 3 0.13
45

Table 23. Estimates of age-1 recruitment, biomass and fishing mortality rates from SCALE model final runs.
North
Year
Age-1 Recruitment
(millions)
Exploitable Biomass
(kt)
Total Biomass
(kt) F1980 14.29 73.37 89.11 0.071981 10.24 69.73 85.10 0.071982 11.45 66.84 81.79 0.081983 10.49 63.83 78.10 0.081984 9.31 61.34 74.63 0.091985 7.10 58.59 70.69 0.111986 11.09 55.20 66.46 0.111987 9.62 51.91 62.52 0.131988 12.68 47.49 57.74 0.151989 14.90 42.70 53.23 0.201990 19.62 36.96 48.61 0.211991 16.17 32.80 45.92 0.231992 16.68 30.12 44.92 0.321993 26.93 28.46 45.16 0.551994 25.46 24.78 42.77 0.581995 10.96 23.46 41.98 0.741996 14.89 21.13 39.91 0.891997 26.46 19.36 38.20 0.711998 30.94 21.18 39.70 0.431999 39.27 25.47 45.31 0.432000 42.06 27.74 51.52 0.472001 27.46 29.31 57.87 0.642002 17.96 30.00 61.08 0.822003 15.99 30.60 60.77 1.212004 17.42 26.79 51.74 1.122005 12.27 24.32 43.66 0.882006 18.59 22.92 39.11 0.582007 16.33 23.78 39.14 0.372008 15.68 26.74 42.26 0.232009 13.67 31.41 47.34 0.162010 8.36 37.33 53.46 0.092011 11.72 44.73 60.48 0.08
South
Year
Age-1 Recruitment
(millions)
Exploitable Biomass
(kt)
Total Biomass
(kt) F1980 28.49 81.94 103.62 0.091981 31.25 89.48 111.69 0.061982 24.05 99.01 121.44 0.051983 18.52 108.43 130.46 0.051984 22.53 116.36 137.51 0.051985 22.83 123.47 143.18 0.051986 29.15 127.28 145.83 0.051987 36.13 127.80 146.82 0.051988 9.22 125.77 145.32 0.051989 27.80 121.70 142.07 0.121990 35.08 112.10 132.75 0.101991 40.42 107.43 128.09 0.131992 36.23 99.85 121.91 0.201993 45.67 88.64 114.14 0.261994 30.55 81.53 109.24 0.231995 30.91 82.05 110.42 0.271996 22.53 81.96 109.07 0.281997 25.51 83.33 107.95 0.291998 45.07 82.38 105.14 0.281999 44.11 80.31 103.08 0.242000 33.88 81.79 106.32 0.182001 17.24 84.17 110.81 0.192002 35.10 87.59 114.86 0.172003 39.99 93.89 119.77 0.202004 25.67 97.07 120.76 0.152005 18.65 99.98 123.17 0.162006 15.39 102.32 124.95 0.152007 14.17 105.34 125.26 0.122008 17.08 109.01 125.39 0.112009 16.01 109.91 123.76 0.082010 13.12 105.80 118.42 0.082011 23.32 98.43 111.10 0.11
46

Table 24. (A). Mohn’s rho statistic for SCALE model retrospective patterns based on 7 peels. (B.) Adjustment factors for estimated population numbers at age based on age-specific retrospective patterns based on 7 peels.
A. North South
B.
Relative Change in EstimateTerminal Year F Total B Age 1 Rcrt
2010 -0.03 0.03 -0.032009 -0.25 0.21 0.042008 -0.44 0.43 0.132007 -0.57 0.65 0.242006 -0.77 1.36 0.302005 -0.84 1.77 0.272004 -0.85 1.62 0.65
Mohn's Rho -0.54 0.87 0.23
Relative Change in EstimateTerminal Year F Total B Age 1 Rcrt
2010 -0.03 0.03 0.292009 -0.10 0.10 0.332008 -0.21 0.20 0.082007 -0.27 0.27 0.212006 -0.36 0.41 1.492005 -0.34 0.42 0.602004 -0.27 0.33 0.70
Mohn's Rho -0.23 0.25 0.53
Age North South1 0.81 0.652 0.77 0.843 0.79 0.874 0.76 0.885 0.76 0.886 0.66 0.857 0.48 0.828 0.31 0.809 0.20 0.78
10 0.14 0.7511 0.11 0.7212 0.09 0.69
47

Table 25. Results of age-based yield-per-recruit analysis using M=0.3 and area-specific selectivity patterns estimated by SCALE model in 2007 (NEFSC 2007a), 2010 (NEFSC 2010), and 2013.
NorthDPWG (2007) SAW50 (2010) 2013 Update
Reference Point F YPR SSBR Total B / R F YPR SSBR Total B / R F YPR SSBR Total B / RFzero 0.00 0.00 7.97 9.94 0.00 0.00 5.39 6.41 0.00 0.00 5.39 6.41F-01 0.18 0.56 3.22 4.81 0.27 0.51 2.55 3.46 0.27 0.51 2.55 3.46F-Max 0.31 0.60 2.06 3.51 0.43 0.54 1.85 2.69 0.44 0.54 1.84 2.68F at 40% MSP 0.18 0.56 3.19 4.77 0.35 0.54 2.15 3.03 0.35 0.54 2.15 3.03
South DPWG (2007) SAW50 (2010) 2013 Update
Reference Point F YPR SSBR Total B / R F YPR SSBR Total B / R F YPR SSBR Total B / RFzero 0.00 0.00 5.32 6.41 0.00 0.00 5.39 6.41 0.00 0.00 5.39 6.41F-01 0.25 0.50 2.43 3.39 0.28 0.52 2.59 3.51 0.24 0.48 2.45 3.33F-Max 0.40 0.53 1.72 2.61 0.46 0.55 1.88 2.73 0.37 0.51 1.76 2.56F at 40% MSP 0.31 0.52 2.13 3.06 0.38 0.55 2.15 3.04 0.29 0.50 2.15 3.00
48

Table 26. Estimated biological reference points, biomass and F for monkfish in northern and southern management regions. Biomass BRPs in metric tons. Reference points for DPWG (2007) are provided for historical reference only; reference points were re-defined in Framework 7 (2012) based on methodology accepted at the SAW 50 review.
North BRP Basis DPWG (2007) SAW 50 (2010) 2013 UpdateFmax YPR 0.31 0.43 0.44
Bthreshold Bloss (1980-final yr) 65,200 41,238 38,196Bthreshold 0.5*Bmax Proj 26,465 23,037
Btarget Bavg (1980-final yr) 92,200 61,991 55,009Btarget Bmax Proj 52,930 46,074
MSY Fmax Proj 10,745 9,383
SouthFmax YPR 0.40 0.46 0.37
Bthreshold Bloss (1980-final yr) 96,400 99,181 103,082Bthreshold 0.5*Bmax Proj 37,245 35,834
Btarget Bavg (1980-final yr) 122,500 121,313 121,696Btarget Bmax Proj 74,490 71,667
MSY Fmax Proj 15,279 14,328
49

Table 27. Projected catch and biomass (mt) for the northern and southern monkfish management regions under A. Fthreshold, B. Fthreshold based on retrospective-adjusted SCALE model outputs, C. Fstatus quo (F2011 estimated by SCALE model, no retrospective adjustment). Catch and biomass in mt; annual P is relative to BRPs.
North A. Fthreshold
Year F Total Catch Total Biomass P < Bthreshold P > Fmax
2012 0.44 16,385 66,605 0% 0%2013 0.44 13,768 56,660 0% 0%2014 0.44 11,336 48,970 0% 0%2015 0.44 9,481 44,003 0% 0%2016 0.44 8,449 41,848 0% 0%
B. Fthreshold, retro adjustedYear F Total Catch Total Biomass P < Bthreshold P > Fmax
2012 0.44 6,770 32,152 0% 0%2013 0.44 6,869 32,243 0% 0%2014 0.44 6,567 31,973 0% 0%2015 0.44 6,187 32,412 0% 0%2016 0.44 6,196 34,236 0% 0%
C. Fstatus quo
Year F Total Catch Total Biomass P < Bthreshold P > Fmax
2012 0.08 3,274 66,605 0% 0%2013 0.08 3,685 72,275 0% 0%2014 0.08 3,929 76,450 0% 0%2015 0.08 4,041 79,597 0% 0%2016 0.08 4,123 82,262 0% 0%
South A. Fthreshold
Year F Total Catch Total Biomass P < Bthreshold P > Fmax
2012 0.37 25,751 108,139 0% 0%2013 0.37 19,748 86,915 0% 0%2014 0.37 15,453 72,803 0% 0%2015 0.37 13,054 65,778 0% 0%2016 0.37 12,267 63,756 0% 0%
B. Fthreshold, retro adjustedYear F Total Catch Total Biomass P < Bthreshold P > Fmax
2012 0.37 19,786 84,003 0% 0%2013 0.37 15,530 69,136 0% 0%2014 0.37 12,370 59,430 0% 0%2015 0.37 10,540 55,299 0% 0%2016 0.37 10,219 55,791 0% 0%
C. Fstatus quo
Year F Total Catch Total Biomass P < Bthreshold P > Fmax
2012 0.11 8,258 108,139 0% 0%2013 0.11 7,984 106,639 0% 0%2014 0.11 7,632 104,601 0% 0%2015 0.11 7,399 104,201 0% 0%2016 0.11 7,467 106,145 0% 0%
50
Table 28. Comparison of biomass projected under SAW 50 ACT scenario in 2010 with estimated biomass (2010, 2011) and projected biomass (2013-2016) from updated SCALE models (unadjusted for retrospective) under Fstatus quo scenarios.
FINPUT BPROJ Fstatus quo BEST BPROJ Δ% Over-
estimated2010 0.10 74.1 0.08 53.5 20.6 38.5%2011 0.22 81.9 0.08 60.5 21.4 35.4%2012 0.22 81.2 0.08 66.6 14.62013 0.22 80.2 0.08 72.4 7.82014 0.23 79 0.08 76.6 2.42015 0.24 77.5 0.08 79.7 -2.22016 0.24 76.4 0.08 82.6 -6.2
FINPUT BPROJ Fstatus quo BEST BPROJ Δ% Over-
estimated2010 0.07 131.3 0.11 118.4 12.9 10.9%2011 0.13 132.2 0.11 111.1 21.1 19.0%2012 0.14 126.3 0.11 108.1 18.22013 0.15 121.1 0.11 106.6 14.52014 0.16 116.7 0.11 104.6 12.12015 0.17 114.0 0.11 104.2 9.82016 0.17 113.8 0.11 106.1 7.7
North SAW 50 (2010) 2013 Assessment Update
South SAW 50 (2010) 2013 Assessment Update
51