List of tables › english › › res_e › statis_e › its...List of tables III. Trade in...
40
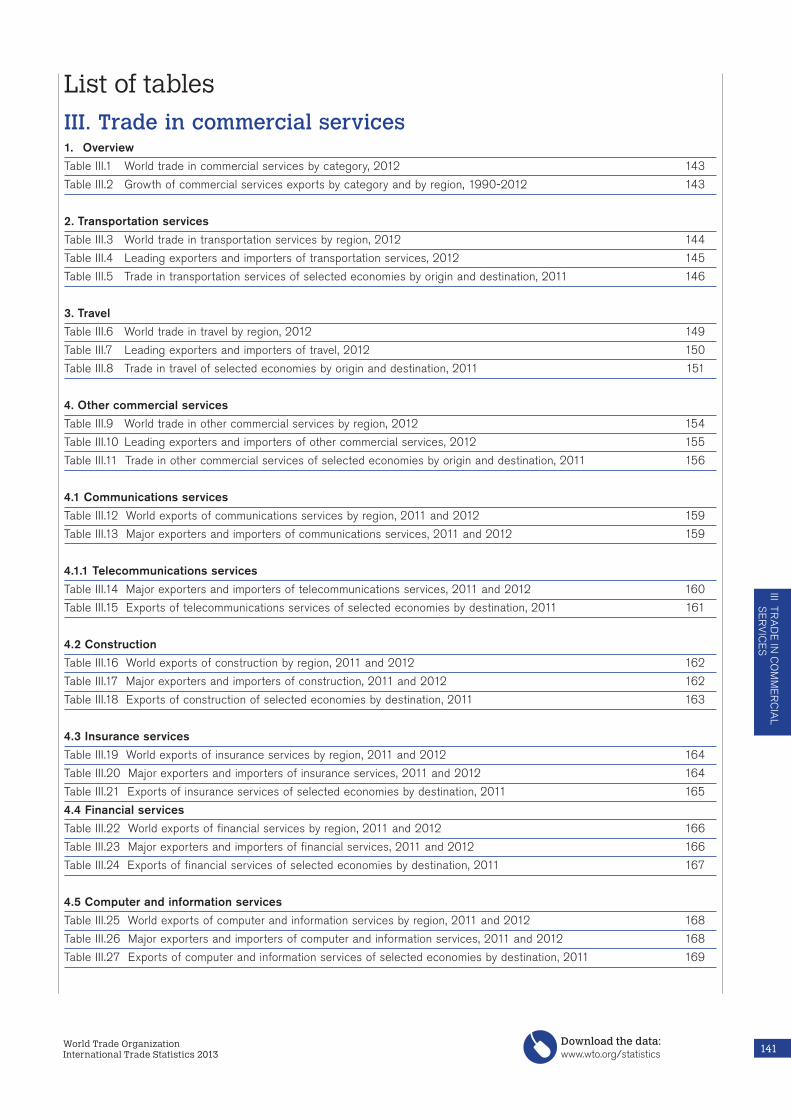
List of tables III. Trade in commercial services 1. Overview Table III.1 World trade in commercial services by category, 2012 143 Table III.2 Growth of commercial services exports by category and by region, 1990-2012 143 2. Transportation services Table III.3 World trade in transportation services by region, 2012 144 Table III.4 Leading exporters and importers of transportation services, 2012 145 Table III.5 Trade in transportation services of selected economies by origin and destination, 2011 146 3. Travel Table III.6 World trade in travel by region, 2012 149 Table III.7 Leading exporters and importers of travel, 2012 150 Table III.8 Trade in travel of selected economies by origin and destination, 2011 151 4. Other commercial services Table III.9 World trade in other commercial services by region, 2012 154 Table III.10 Leading exporters and importers of other commercial services, 2012 155 Table III.11 Trade in other commercial services of selected economies by origin and destination, 2011 156 4.1 Communications services Table III.12 World exports of communications services by region, 2011 and 2012 159 Table III.13 Major exporters and importers of communications services, 2011 and 2012 159 4.1.1 Telecommunications services Table III.14 Major exporters and importers of telecommunications services, 2011 and 2012 160 Table III.15 Exports of telecommunications services of selected economies by destination, 2011 161 4.2 Construction Table III.16 World exports of construction by region, 2011 and 2012 162 Table III.17 Major exporters and importers of construction, 2011 and 2012 162 Table III.18 Exports of construction of selected economies by destination, 2011 163 4.3 Insurance services Table III.19 World exports of insurance services by region, 2011 and 2012 164 Table III.20 Major exporters and importers of insurance services, 2011 and 2012 164 Table III.21 Exports of insurance services of selected economies by destination, 2011 165 4.4 Financial services Table III.22 World exports of financial services by region, 2011 and 2012 166 Table III.23 Major exporters and importers of financial services, 2011 and 2012 166 Table III.24 Exports of financial services of selected economies by destination, 2011 167 4.5 Computer and information services Table III.25 World exports of computer and information services by region, 2011 and 2012 168 Table III.26 Major exporters and importers of computer and information services, 2011 and 2012 168 Table III.27 Exports of computer and information services of selected economies by destination, 2011 169 141 World Trade Organization International Trade Statistics 2013 Download the data: www.wto.org/statistics III TRADE IN COMMERCIAL SERVICES
Transcript of List of tables › english › › res_e › statis_e › its...List of tables III. Trade in...
List of tables
III. Trade in commercial services 1. Overview
Table III.1 World trade in commercial services by category, 2012 143
Table III.2 Growth of commercial services exports by category and by region, 1990-2012 143
2. Transportation services
Table III.3 World trade in transportation services by region, 2012 144
Table III.4 Leading exporters and importers of transportation services, 2012 145
Table III.5 Trade in transportation services of selected economies by origin and destination, 2011 146
3. Travel
Table III.6 World trade in travel by region, 2012 149
Table III.7 Leading exporters and importers of travel, 2012 150
Table III.8 Trade in travel of selected economies by origin and destination, 2011 151
4. Other commercial services
Table III.9 World trade in other commercial services by region, 2012 154
Table III.10 Leading exporters and importers of other commercial services, 2012 155
Table III.11 Trade in other commercial services of selected economies by origin and destination, 2011 156
4.1 Communications services
Table III.12 World exports of communications services by region, 2011 and 2012 159
Table III.13 Major exporters and importers of communications services, 2011 and 2012 159
4.1.1 Telecommunications services
Table III.14 Major exporters and importers of telecommunications services, 2011 and 2012 160
Table III.15 Exports of telecommunications services of selected economies by destination, 2011 161
4.2 Construction
Table III.16 World exports of construction by region, 2011 and 2012 162
Table III.17 Major exporters and importers of construction, 2011 and 2012 162
Table III.18 Exports of construction of selected economies by destination, 2011 163
4.3 Insurance services
Table III.19 World exports of insurance services by region, 2011 and 2012 164
Table III.20 Major exporters and importers of insurance services, 2011 and 2012 164
Table III.21 Exports of insurance services of selected economies by destination, 2011 165
4.4 Financial services
Table III.22 World exports of financial services by region, 2011 and 2012 166
Table III.23 Major exporters and importers of financial services, 2011 and 2012 166
Table III.24 Exports of financial services of selected economies by destination, 2011 167
4.5 Computer and information services
Table III.25 World exports of computer and information services by region, 2011 and 2012 168
Table III.26 Major exporters and importers of computer and information services, 2011 and 2012 168
Table III.27 Exports of computer and information services of selected economies by destination, 2011 169
141World Trade OrganizationInternational Trade Statistics 2013
Download the data:www.wto.org/statistics
III TRA
DE
IN C
OM
ME
RC
IAL
SE
RV
ICE
S

4.5.1 Computer services
Table III.28 Major exporters and importers of computer services, 2011 and 2012 170
Table III.29 Exports of computer services of selected economies by destination, 2011 171
4.6 Royalties and licence fees
Table III.30 World receipts of royalties and licence fees by region, 2011 and 2012 172
Table III.31 Major economies for receipts and payments of royalties and licence fees, 2011 and 2012 172
Table III.32 Receipts of royalties and licence fees of selected economies by origin, 2011 173
4.7 Other business services
Table III.33 World exports of other business services by region, 2011 and 2012 174
Table III.34 Major exporters and importers of other business services, 2011 and 2012 174
Table III.35 Exports of other business services of selected economies by destination, 2011 175
Table III.36 Trade in other business services by category in selected economies, 2011 176
4.8 Personal, cultural and recreational services
Table III.37 World exports of personal, cultural and recreational services by region, 2011 and 2012 177
Table III.38 Major exporters and importers of personal, cultural and recreational services, 2011 and 2012 177
Table III.39 Exports of personal, cultural and recreational services of selected economies by destination, 2011 178
4.8.1 Audiovisual services
Table III.40 Major exporters and importers of audio-visual and related services, 2011 and 2012 179
Table III.41 Exports of audio-visual and related services of selected economies by destination, 2011 180
142 World Trade OrganizationInternational Trade Statistics 2013
Download the data:www.wto.org/statistics

Table III.1
(Billion dollars and percentage)
2012 2000 2005 2010 2011 2012
ExportsAll commercial services 4350 100.0 100.0 100.0 100.0 100.0
Transportation services 890 23.2 22.6 21.1 20.6 20.5Travel 1110 31.9 27.9 24.9 25.1 25.5Other commercial services 2345 44.8 49.5 53.7 54.1 53.9
ImportsAll commercial services 4150 100.0 100.0 100.0 100.0 100.0
Transportation services 1145 28.6 28.6 27.1 27.7 27.5Travel 995 30.1 27.4 23.8 23.4 24.0Other commercial services 1965 41.2 44.0 47.6 47.8 47.3
Share
World trade in commercial services by category, 2012
Value
: Total commercial services do not add up to the sum of components due to unallocated services, accounting for 0.1 per cent of world exports and 0.2 per cent of world imports in 2012. For more information on asymmetries, see the Metadata.
1. Overview
Table III.2
Growth of commercial services exports by category and by region, 1990-2012
(Annual percentage change)
World North America
South and Central America Europe CIS Africa Middle East Asia
Commercial services1990-95 8 8 9 - - 7 ... 141995-00 5 7 6 4 ... 4 ... 42000-05 11 5 8 13 18 ... ... ...2005-10 9 8 10 7 14 9 ... 12
2011 11 9 19 12 20 0 11 122012 2 5 4 -2 9 6 13 6
Transportation services1990-95 6 4 7 - - 6 ... 111995-00 3 1 1 3 ... -1 ... 32000-05 10 3 11 11 15 14 ... 112005-10 7 6 9 6 13 9 9 9
2011 9 11 17 10 16 6 22 42012 1 3 -1 -2 5 9 13 4
Travel1990-95 9 7 10 - - 8 ... 141995-00 4 6 7 2 ... 6 ... 32000-05 8 2 6 9 18 15 12 112005-10 6 4 7 3 9 8 15 13
2011 12 10 8 13 28 -4 2 182012 4 8 5 -2 12 6 6 10
Other commercial services1990-95 9 11 10 - - 5 ... 161995-00 7 10 9 6 ... 6 ... 52000-05 13 8 11 15 25 ... 13 ...2005-10 11 10 16 10 19 11 ... 13
2011 12 8 30 12 20 3 14 142012 2 4 6 -2 11 4 20 6
143World Trade OrganizationInternational Trade Statistics 2013
Download the data:www.wto.org/statistics
III TRA
DE
IN C
OM
ME
RC
IAL
SE
RV
ICE
S
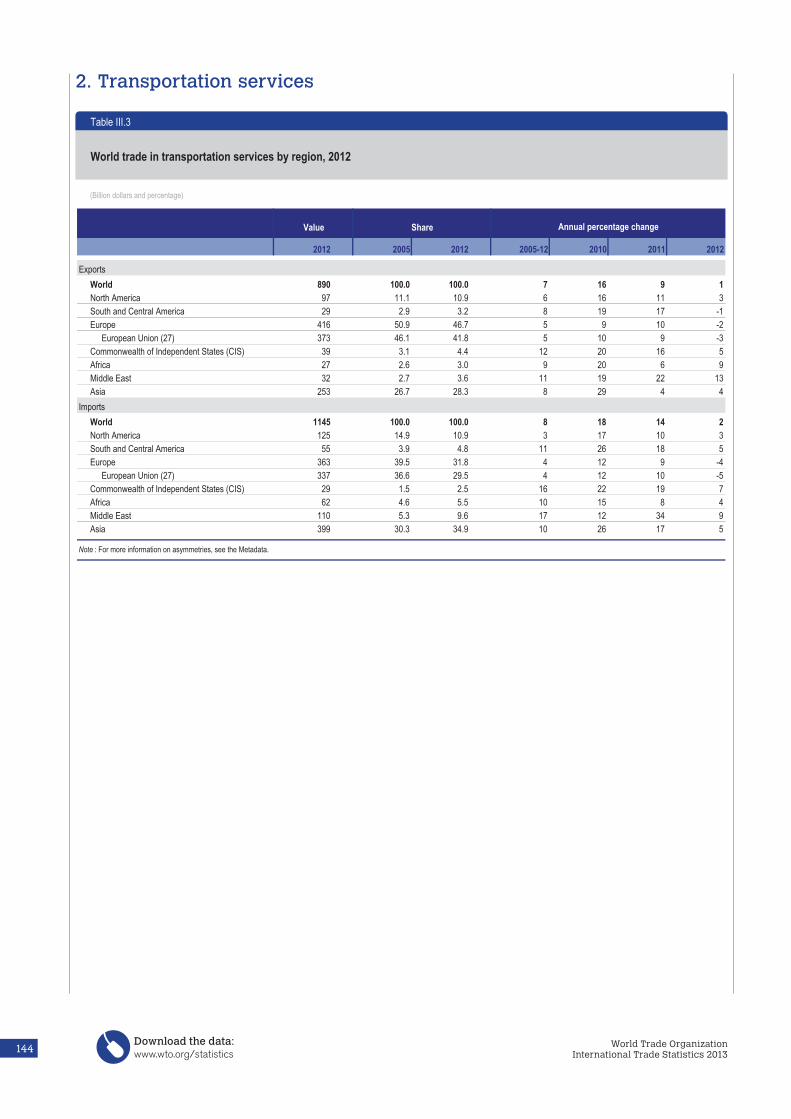
(Billion dollars and percentage)
2012 2005 2012 2005-12 2010 2011 2012
ExportsWorld 890 100.0 100.0 7 16 9 1North America 97 11.1 10.9 6 16 11 3South and Central America 29 2.9 3.2 8 19 17 -1Europe 416 50.9 46.7 5 9 10 -2
European Union (27) 373 46.1 41.8 5 10 9 -3Commonwealth of Independent States (CIS) 39 3.1 4.4 12 20 16 5Africa 27 2.6 3.0 9 20 6 9Middle East 32 2.7 3.6 11 19 22 13Asia 253 26.7 28.3 8 29 4 4
ImportsWorld 1145 100.0 100.0 8 18 14 2North America 125 14.9 10.9 3 17 10 3South and Central America 55 3.9 4.8 11 26 18 5Europe 363 39.5 31.8 4 12 9 -4
European Union (27) 337 36.6 29.5 4 12 10 -5Commonwealth of Independent States (CIS) 29 1.5 2.5 16 22 19 7Africa 62 4.6 5.5 10 15 8 4Middle East 110 5.3 9.6 17 12 34 9Asia 399 30.3 34.9 10 26 17 5
: For more information on asymmetries, see the Metadata.
Table III.3
World trade in transportation services by region, 2012
Annual percentage changeValue Share
2. Transportation services
144 World Trade OrganizationInternational Trade Statistics 2013
Download the data:www.wto.org/statistics

(Billion dollars and percentage)
2012 2005 2012 2005-12 2010 2011 2012
ExportersEuropean Union (27) 373.3 46.1 41.8 5 10 9 -3 Extra-EU (27) exports 184.7 22.8 20.7 5 14 8 -2United States 82.8 9.2 9.3 7 16 11 4Singapore 42.5 3.4 4.8 12 29 7 3Korea, Republic of 40.7 4.2 4.6 8 36 -5 10Japan 40.1 6.3 4.5 2 23 -1 5China 38.9 2.7 4.4 14 45 4 9Hong Kong, China 31.9 3.6 3.6 7 26 8 0Russian Federation 19.0 1.6 2.1 11 20 17 10Norway 18.0 ... 2.0 ... ... 11 3India 17.1 1.0 1.9 17 18 32 -2Turkey 13.2 0.9 1.5 15 16 12 24Canada 13.2 1.7 1.5 4 24 16 -1Chinese Taipei 10.0 1.0 1.1 8 54 -1 3Egypt 8.9 0.8 1.0 9 18 4 8Ukraine 8.5 0.8 1.0 10 25 16 -6
Above 15 760.0 ... 85.0 - - - -Importers
European Union (27) 337.2 36.6 29.5 4 12 10 -5 Extra-EU (27) imports 153.8 16.4 13.5 5 17 9 -3United States 89.8 11.6 7.9 2 16 9 5China 85.9 4.2 7.5 17 36 27 7India 58.9 3.0 5.2 16 30 23 4Japan 55.3 5.9 4.8 5 15 6 12United Arab Emirates 47.7 1.6 4.2 23 12 63 14Singapore 35.3 3.0 3.1 8 17 16 3Korea, Republic of 30.1 3.0 2.6 6 27 0 2Thailand 28.5 2.1 2.5 10 32 19 7Canada 23.2 2.1 2.0 7 23 13 -1Saudi Arabia, Kingdom of 17.9 0.7 1.6 21 12 21 16Australia 17.2 1.6 1.5 7 29 16 11Hong Kong, China 16.4 1.5 1.4 7 19 14 -1Russian Federation 16.4 0.8 1.4 18 27 30 7Brazil 14.2 0.7 1.2 16 42 25 0
Above 15 875.0 78.4 76.5 - - - -
Annual percentage change
Leading exporters and importers of transportation services, 2012
Table III.4
Value Share
145World Trade OrganizationInternational Trade Statistics 2013
Download the data:www.wto.org/statistics
III TRA
DE
IN C
OM
ME
RC
IAL
SE
RV
ICE
S

Table III.5
(Million dollars and percentage)
Value Share Value Share
2011 2011 2005-11 2010 2011 2011 2011 2005-11 2010 2011
European Union (27) World 384147 100.0 7 10 9 World 353266 100.0 6 12 10European Union (27) 196385 51.1 7 6 10 European Union (27) 194458 55.0 6 7 11United States 41836 10.9 1 10 7 United States 29284 8.3 3 10 11Switzerland 18059 4.7 13 8 15 China 12301 3.5 13 27 6China 11310 2.9 13 29 7 Switzerland 10654 3.0 7 17 10Russian Federation 7589 2.0 11 25 20 Russian Federation 9489 2.7 10 38 6
Above 5 275178 71.6 - - - Above 5 256186 72.5 - - -Japan 7574 2.0 2 14 9 Japan 6571 1.9 1 23 -6Australia 6169 1.6 12 21 13 Singapore 5816 1.6 12 20 19Norway 5938 1.5 7 15 7 Turkey 5482 1.6 7 20 13India 5305 1.4 12 44 10 Norway 5292 1.5 4 7 14Canada 5302 1.4 10 15 14 Hong Kong, China 3875 1.1 3 18 -1Hong Kong, China 5259 1.4 4 24 10 Brazil 3871 1.1 15 52 14Brazil 4965 1.3 11 20 18 Canada 3271 0.9 7 12 9Singapore 4745 1.2 7 6 9 Korea, Republic of 2921 0.8 0 34 -2Korea, Republic of 4271 1.1 6 20 3 Egypt 2588 0.7 5 15 0Turkey 3106 0.8 9 20 12 India 2523 0.7 7 19 2
Above 15 327813 85.3 - - - Above 15 298396 84.5 - - -United States a
World 79458 100.0 7 16 11 World 85453 100.0 1 16 9European Union (27) 23644 29.8 ... 9 8 European Union (27) 30615 35.8 ... 13 9Japan 8154 10.3 2 17 3 Japan 7590 8.9 4 21 8Canada 7759 9.8 7 22 7 Korea, Republic of 5484 6.4 4 22 9China 4409 5.5 18 36 21 Canada 5383 6.3 3 21 10Mexico 4067 5.1 7 23 5 Chinese Taipei 4446 5.2 -2 22 9
Above 5 48033 60.5 - - - Above 5 53518 62.6 - - -Brazil 3707 4.7 21 33 33 China 3695 4.3 3 35 8Korea, Republic of 2251 2.8 6 13 7 Hong Kong, China 3453 4.0 8 15 9Hong Kong, China 1890 2.4 19 10 17 Switzerland 2298 2.7 2 20 7Chinese Taipei 1878 2.4 2 13 15 Mexico 1573 1.8 -2 8 -2Switzerland 1779 2.2 11 10 15 Australia 1229 1.4 2 10 13India 1690 2.1 33 15 12 Israel 1229 1.4 4 15 10Venezuela, Bolivarian Rep. of 1196 1.5 15 5 24 Norway 1196 1.4 5 29 6Australia 1192 1.5 5 12 23 Singapore 1186 1.4 -2 18 9Israel 1094 1.4 12 17 12 Bermuda 1043 1.2 26 13 7Argentina 1072 1.3 18 30 30 Brazil 868 1.0 7 19 16
Above 15 65783 82.8 - - - Above 15 71288 83.4 - - -China b
World 35570 100.0 15 45 4 World 80445 100.0 19 36 27Hong Kong, China 12015 33.8 ... ... 3 European Union (27) 11246 14.0 ... ... 30United States 4322 12.2 ... ... 23 Hong Kong, China 6492 8.1 ... ... 8European Union (27) 3498 9.8 ... ... -8 Japan 5911 7.3 ... ... 8Japan 2822 7.9 ... ... 21 Korea, Republic of 5570 6.9 ... ... 19Korea, Republic of 1647 4.6 ... ... 8 United States 3685 4.6 ... ... 7
Above 5 24303 68.3 - - - Above 5 32904 40.9 - - -Singapore 1167 3.3 ... ... 6 Australia 3300 4.1 ... ... 38Chinese Taipei 965 2.7 ... ... -4 Singapore 1169 1.5 ... ... 19Australia 510 1.4 ... ... 11 Chinese Taipei 227 0.3 ... ... 42Macao, China 94 0.3 ... ... -8 Macao, China 131 0.2 ... ... 274
Above 9 27040 76.0 - - - Above 9 37731 46.9 - - -
Trade in transportation services of selected economies by origin and destination, 2011
Annual percentage change
Annual percentage change
Exports Imports
a Bilateral data include transactions in postal and courier services. b ASEAN countries accounted for 5 per cent of transportation services exports and 11 per cent of imports.
146 World Trade OrganizationInternational Trade Statistics 2013
Download the data:www.wto.org/statistics

Table III.5
(Million dollars and percentage)
Value Share Value Share
2011 2011 2005-11 2010 2011 2011 2011 2005-11 2010 2011
Japan World 38319 100.0 1 23 -1 World 49447 100.0 3 15 6United States 7003 18.3 -1 30 -9 European Union (27) 9021 18.2 ... 14 -4European Union (27) 6900 18.0 ... 19 -5 United States 6516 13.2 2 22 18China 4451 11.6 8 31 2 Singapore 3763 7.6 5 23 6Chinese Taipei 3306 8.6 10 36 18 Hong Kong, China 3029 6.1 -1 12 5Singapore 2626 6.9 6 30 -9 Korea, Republic of 2736 5.5 1 10 1
Above 5 24287 63.4 - - - Above 5 25064 50.7 - - -Korea, Republic of 2605 6.8 1 21 -4 China 2468 5.0 1 12 18Hong Kong, China 2034 5.3 -5 8 -8 Chinese Taipei 2105 4.3 10 38 8Thailand 1096 2.9 3 29 7 Cayman Islands 2068 4.2 108 … 86Australia 612 1.6 -4 5 6 Australia 872 1.8 -3 16 -6Malaysia 572 1.5 5 46 -12 Thailand 748 1.5 7 41 19Indonesia 485 1.3 -3 24 10 Philippines 464 0.9 -3 10 -25Switzerland 402 1.0 1 14 -24 Switzerland 411 0.8 0 4 -1Philippines 374 1.0 -2 25 -8 Canada 363 0.7 -2 16 13India 365 1.0 15 48 6 United Arab Emirates 353 0.7 13 -4 7Canada 331 0.9 -5 7 -21 Malaysia 326 0.7 -3 44 -22
Above 15 33163 86.5 - - - Above 15 35242 71.3 - - -Singapore c, d
World 41273 100.0 13 29 7 World 34392 100.0 9 17 16European Union (27) 6261 15.2 ... 23 2 European Union (27) 4980 14.5 ... 19 15United States 4670 11.3 ... 48 0 United States 4411 12.8 ... 32 2Australia 3269 7.9 ... 15 7 Japan 2496 7.3 ... 23 33China 3083 7.5 ... 169 -17 China 2031 5.9 ... 44 14Japan 2806 6.8 ... 30 13 Australia 1266 3.7 ... 23 63
Above 5 20089 48.7 - - - Above 5 15183 44.1 - - -India 1227 3.0 ... 27 -7 Hong Kong, China 1140 3.3 ... 25 4Korea, Republic of 1067 2.6 ... 25 9 Korea, Republic of 835 2.4 ... 22 26Hong Kong, China 1067 2.6 ... 40 3 India 683 2.0 ... 17 21
Above 8 23451 56.8 - - - Above 8 17841 51.9 - - -Korea, Republic of
World 36938 100.0 8 36 -5 World 29537 100.0 7 27 0China 7324 19.8 10 40 -14 European Union (27) 6692 22.7 7 20 -9Japan 4828 13.1 12 46 19 United States 5891 19.9 5 33 2United States 4678 12.7 -3 38 -11 Japan 3082 10.4 2 15 0European Union (27) 4576 12.4 5 28 -3 China 2381 8.1 6 27 1Hong Kong, China 2347 6.4 4 23 -7 Hong Kong, China 1752 5.9 5 45 -16
Above 5 23753 64.3 - - - Above 5 19798 67.0 - - -Singapore 1409 3.8 15 23 2 Singapore 1744 5.9 8 32 -7Chinese Taipei 949 2.6 6 62 -6 Australia 622 2.1 18 21 22Viet Nam 804 2.2 21 48 9 United Arab Emirates 600 2.0 16 21 31Indonesia 704 1.9 14 51 14 Saudi Arabia, Kingdom of 516 1.7 13 3 25Russian Federation 700 1.9 15 72 0 Indonesia 487 1.6 14 42 18India 651 1.8 14 45 -16 Panama 462 1.6 37 130 -16Brazil 595 1.6 25 58 10 Philippines 443 1.5 17 251 16Thailand 579 1.6 9 46 -3 Russian Federation 381 1.3 11 25 3Mexico 458 1.2 13 34 -17 Chinese Taipei 370 1.3 5 12 -6Australia 453 1.2 10 35 0 Viet Nam 339 1.1 17 61 15
Above 15 31056 84.1 - - - Above 15 25761 87.2 - - -Hong Kong, China
World 31804 100.0 8 26 8 World 16624 100.0 8 19 14China 5710 18.0 ... 34 16 China 3341 20.1 ... 8 4United States 5400 17.0 ... 30 -1 United States 2607 15.7 ... 23 22Chinese Taipei 3127 9.8 ... 24 9 Japan 1580 9.5 ... 40 21Japan 3061 9.6 ... 17 -3 Chinese Taipei 759 4.6 ... 32 17
Above 4 17299 54.4 - - - Above 4 8288 49.9 - - -
Trade in transportation services of selected economies by origin and destination, 2011
Annual percentage change
Annual percentage change
Exports Imports
c Imports of transportation freight services on goods imports are not allocated geographically. d In 2011, ASEAN countries accounted for 10 per cent of transportation services exports and 6 per cent of imports.
147World Trade OrganizationInternational Trade Statistics 2013
Download the data:www.wto.org/statistics
III TRA
DE
IN C
OM
ME
RC
IAL
SE
RV
ICE
S

Table III.5
(Million dollars and percentage)
Value Share Value Share
2011 2011 2005-11 2010 2011 2011 2011 2005-11 2010 2011
CanadaWorld 13266 100.0 5 24 16 World 23369 100.0 8 23 13United States 6490 48.9 7 20 12 United States 8852 37.9 8 24 10European Union (27) 3692 27.8 ... 14 23 European Union (27) 5237 22.4 ... 13 14Japan 586 4.4 4 23 17 Japan 533 2.3 1 17 -3
Above 3 10768 81.2 - - - Above 3 14621 62.6 - - -Russian Federation e
World 17226 100.0 11 20 17 World 15398 100.0 20 27 30European Union (27) 5416 31.4 10 21 20 European Union (27) 2292 14.9 12 31 14Switzerland 899 5.2 5 13 17 Belarus 489 3.2 22 49 8Ukraine 894 5.2 35 22 12 Ukraine 447 2.9 15 17 16British Virgin Islands 549 3.2 12 9 -20 Switzerland 434 2.8 20 12 31China 437 2.5 6 33 29 China 251 1.6 25 19 97
Above 5 8195 47.6 - - - Above 5 3912 25.4 - - -United States 379 2.2 -3 35 3 Kazakhstan 167 1.1 13 -3 26Kazakhstan 325 1.9 19 3 26 Turkey 154 1.0 15 38 8United Arab Emirates 307 1.8 30 7 49 Uzbekistan 148 1.0 16 -10 25Turkey 295 1.7 10 26 -9 United States 147 1.0 5 0 48Korea, Republic of 221 1.3 1 22 7 Tajikistan 138 0.9 29 14 21Tajikistan 177 1.0 43 28 32 United Arab Emirates 118 0.8 14 35 6Belarus 176 1.0 16 58 2 Korea, Republic of 112 0.7 12 11 -8Japan 164 1.0 -9 12 16 British Virgin Islands 99 0.6 14 -17 7Panama 155 0.9 12 -20 1 Hong Kong, China 67 0.4 3 49 24Uzbekistan 139 0.8 18 11 23 Azerbaijan 64 0.4 12 -17 14
Above 15 10532 61.1 - - - Above 15 5125 33.3 - - -Norway
World 17433 100.0 ... ... 11 World 8461 100.0 ... ... -28European Union (27) 8257 47.4 ... ... -25 European Union (27) 4953 58.5 ... ... -34United States 904 5.2 ... ... 18 United States 352 4.2 ... ... -46Brazil 510 2.9 ... ... 75 Japan 299 3.5 ... ... 121China 318 1.8 ... ... 43 Brazil 171 2.0 ... ... -10Japan 242 1.4 ... ... 27 China 156 1.8 ... ... -30
Above 5 10232 58.7 - - - Above 5 5931 70.1 - - -Canada 185 1.1 ... ... 28 Switzerland 99 1.2 ... ... -24India 129 0.7 ... ... 40 Canada 83 1.0 ... ... 13Russian Federation 117 0.7 ... ... 47 Russian Federation 56 0.7 ... ... 11Switzerland 54 0.3 ... ... 32 India 36 0.4 ... ... -45Hong Kong, China 6 0.0 ... ... 110 Hong Kong, China 31 0.4 ... ... 189
Above 10 10722 61.5 - - - Above 10 6235 73.7 - - -Chile f
World 7652 100.0 10 35 20 World 7721 100.0 11 38 17China 1482 19.4 ... 200 4 Germany 1541 20.0 ... 30 18United States 1198 15.7 ... 11 23 United States 1120 14.5 ... 31 22Japan 398 5.2 ... -13 34 Japan 405 5.2 ... 28 22Germany 375 4.9 ... 3 18 Switzerland 291 3.8 ... 107 28Peru 274 3.6 ... -1 13 China 253 3.3 ... 69 39
Above 5 3727 48.7 - - - Above 5 3610 46.7 - - -Switzerland 253 3.3 ... 24 55 France 215 2.8 ... 93 -12France 190 2.5 ... 64 31 Korea, Republic of 213 2.8 ... 137 6Mexico 171 2.2 ... 105 22 Mexico 155 2.0 ... 37 55Korea, Republic of 149 2.0 ... 97 26 Netherlands 150 1.9 ... 43 49Greece 73 1.0 ... 108 237 United Kingdom 118 1.5 ... -3 78Netherlands 69 0.9 ... -1 53 Peru 116 1.5 ... 24 18Belgium 56 0.7 ... 59 … Singapore 76 1.0 ... -24 88India 51 0.7 ... 98 13 Canada 65 0.8 ... … 54Norway 38 0.5 ... -27 203 Norway 24 0.3 ... 98 -4Italy 37 0.5 ... 18 3 Chinese Taipei 16 0.2 ... 47 10
Above 15 4813 62.9 - - - Above 15 4759 61.6 - - -
Trade in transportation services of selected economies by origin and destination, 2011
Annual percentage change
Annual percentage change
Exports Imports
e In 2011, trade in transportation services not allocated geographically accounted for 29 per cent of exports and 62 per cent of imports. f Individual members of the European Union (27) are shown as partners, as the EU (27) aggregate is not reported. In 2011, trade in transportation services not allocated geographically accounted for 15 per cent of exports and imports. Note: For more information on asymmetries, see the Metadata.
148 World Trade OrganizationInternational Trade Statistics 2013
Download the data:www.wto.org/statistics

3. Travel
(Billion dollars and percentage)
2012 2005 2012 2005-12 2010 2011 2012
ExportsWorld 1110 100.0 100.0 7 9 12 4North America 193 18.8 17.4 6 9 10 8South and Central America 48 4.4 4.4 7 8 8 5Europe 428 48.1 38.6 3 -1 13 -2
European Union (27) 369 42.1 33.2 3 -1 13 -2Commonwealth of Independent States (CIS) 24 1.6 2.2 12 1 28 12Africa 43 4.1 3.8 6 10 -4 6Middle East 51 3.3 4.6 12 25 2 6Asia 322 19.7 29.0 13 25 18 10
ImportsWorld 995 100.0 100.0 6 9 10 5North America 136 15.4 13.6 4 7 7 6South and Central America 44 2.5 4.4 15 26 22 7Europe 379 49.4 38.1 2 -1 9 -4
European Union (27) 340 45.5 34.1 2 -2 8 -4Commonwealth of Independent States (CIS) 56 3.4 5.6 14 24 25 28Africa 26 1.9 2.6 11 14 6 -4Middle East 67 5.2 6.8 10 18 -11 9Asia 287 ... 28.8 ... 20 17 15
: For more information on asymmetries, see the Metadata.
Table III.6
World trade in travel by region, 2012
Annual percentage changeValue Share
149World Trade OrganizationInternational Trade Statistics 2013
Download the data:www.wto.org/statistics
III TRA
DE
IN C
OM
ME
RC
IAL
SE
RV
ICE
S

(Billion dollars and percentage)
2012 2005 2012 2005-12 2010 2011 2012
ExportersEuropean Union (27) 368.6 42.1 33.2 3 -1 13 -2 Extra-EU (27) exports 124.7 11.7 11.2 6 5 18 4United States 162.8 15.2 14.7 6 9 11 9China 50.0 4.2 4.5 8 15 6 3Macao, China 43.9 1.1 4.0 28 53 38 14Thailand 33.6 1.4 3.0 20 25 35 24Hong Kong, China 32.1 1.5 2.9 18 35 25 16Australia 31.6 2.4 2.8 9 16 8 0Turkey 23.8 2.6 2.1 4 -2 11 3Malaysia 20.2 1.3 1.8 13 15 9 3Singapore 19.3 0.9 1.7 18 51 28 7India 17.8 1.1 1.6 13 27 24 2Canada 17.4 2.0 1.6 3 16 7 3Switzerland 16.5 1.4 1.5 7 6 18 -6Japan 14.5 ... 1.3 ... 28 -17 33Korea, Republic of 14.2 0.8 1.3 14 6 21 14
Above 15 865.0 ... 78.0 - - - -Importers
European Union (27) 339.6 45.5 34.1 2 -2 8 -4 Extra-EU (27) imports 121.7 16.2 12.2 2 0 6 -4China 102.0 3.3 10.3 25 26 32 41United States 91.8 11.5 9.2 3 2 4 7Russian Federation 42.8 2.7 4.3 14 27 23 30Canada 35.2 2.8 3.5 10 23 13 6Japan 27.8 ... 2.8 ... 11 -2 2Australia 27.5 1.7 2.8 14 24 20 3Singapore 22.4 1.5 2.3 12 19 15 5Brazil 22.2 0.7 2.2 25 51 29 5Hong Kong, China 20.2 2.0 2.0 6 12 10 6Korea, Republic of 20.1 2.4 2.0 4 25 6 1Saudi Arabia, Kingdom of 17.0 1.4 1.7 9 4 -18 -1Norway 16.9 ... 1.7 ... ... 15 5Switzerland 14.2 1.4 1.4 7 3 25 2Iran a 12.4 0.6 1.3 ... 56 ... ...
Above 15 810.0 ... 81.7 - - - -
Annual percentage change
Leading exporters and importers of travel, 2012
Table III.7
Value Share
a Secretariat estimate.
150 World Trade OrganizationInternational Trade Statistics 2013
Download the data:www.wto.org/statistics

Table III.8
(Million dollars and percentage)
Value Share Value Share
2011 2011 2005-11 2010 2011 2011 2011 2005-11 2010 2011
European Union (27) World 377854 100.0 4 -1 13 World 354625 100.0 3 -2 8European Union (27) 258348 68.4 3 -3 10 European Union (27) 227837 64.2 3 -3 9United States 22165 5.9 -1 2 11 United States 23580 6.6 2 -1 12Switzerland 16498 4.4 4 -4 17 Turkey 11947 3.4 5 14 11Russian Federation 10865 2.9 21 31 35 Switzerland 10203 2.9 3 3 0Norway 10846 2.9 9 10 23 Croatia 5306 1.5 5 -9 15
Above 5 318722 84.4 - - - Above 5 278872 78.6 - - -Australia 5170 1.4 9 5 13 Thailand 4019 1.1 7 -4 7Canada 4830 1.3 7 14 3 Australia 3758 1.1 2 -2 15China 4368 1.2 15 9 33 Egypt 3519 1.0 -1 0 -29Brazil 4198 1.1 24 24 36 Norway 3395 1.0 5 -2 17Japan 3025 0.8 0 -4 9 China 3067 0.9 1 9 8Turkey 2210 0.6 12 35 4 Canada 3045 0.9 1 5 -5Mexico 1755 0.5 7 3 21 India 2774 0.8 5 8 26India 1734 0.5 12 33 6 Russian Federation 2600 0.7 1 -3 10Israel 1329 0.4 6 6 11 Morocco 2512 0.7 5 14 -4Croatia 986 0.3 3 -9 0 Brazil 2061 0.6 3 -2 15
Above 15 348326 92.2 - - - Above 15 309623 87.3 - - -United States a
World 149256 100.0 6 9 11 World 86184 100.0 2 2 4European Union (27) 30991 20.8 ... -1 9 European Union (27) 23658 27.5 ... 2 6Canada 20291 13.6 13 27 16 Mexico 8910 10.3 -2 0 -3Japan 10824 7.3 -4 5 0 Canada 7215 8.4 0 12 6China 10646 7.1 26 38 33 Japan 3556 4.1 4 -8 5Mexico 6858 4.6 -1 2 5 China 2942 3.4 5 12 5
Above 5 79610 53.3 - - - Above 5 46281 53.7 - - -India 6396 4.3 10 8 5 India 2267 2.6 7 -12 5Brazil 6140 4.1 23 33 30 Australia 1832 2.1 5 4 5Korea, Republic of 5969 4.0 7 18 8 Korea, Republic of 1717 2.0 9 12 5Australia 4379 2.9 11 19 19 Israel 1289 1.5 21 9 10Venezuela, Bolivarian Rep. of 2163 1.4 9 -3 18 Hong Kong, China 1136 1.3 1 -5 5Argentina 1958 1.3 24 25 22 Brazil 1121 1.3 8 13 5Chinese Taipei 1896 1.3 4 10 3 Chinese Taipei 1038 1.2 3 10 5Saudi Arabia, Kingdom of 1670 1.1 35 31 49 Philippines 980 1.1 12 1 22Switzerland 1406 0.9 12 2 27 South Africa 903 1.0 20 14 5Israel 1331 0.9 5 8 3 New Zealand 782 0.9 4 1 -5
Above 15 112918 75.7 - - - Above 15 59346 68.9 - - -China b
World 48464 100.0 9 15 6 World 72585 100.0 22 26 32Hong Kong, China 11064 22.8 ... ... 4 Hong Kong, China 18632 25.7 ... ... 21Chinese Taipei 5985 12.3 ... ... 4 Australia 4826 6.6 ... ... 2United States 5644 11.6 ... ... 49 Macao, China 4766 6.6 ... ... -5Korea, Republic of 4423 9.1 ... ... 6 European Union (27) 3897 5.4 ... ... 13Japan 4253 8.8 ... ... 1 Japan 3278 4.5 ... ... -17
Above 5 31369 64.7 - - - Above 5 35400 48.8 - - -European Union (27) 3842 7.9 ... ... 5 Chinese Taipei 2891 4.0 ... ... 11Macao, China 2763 5.7 ... ... 4 United States 2691 3.7 ... ... 5Singapore 1011 2.1 ... ... 9 Korea, Republic of 1680 2.3 ... ... 20Australia 767 1.6 ... ... 13 Singapore 1115 1.5 ... ... 23
Above 9 39752 82.0 - - - Above 9 43777 60.3 - - -
Trade in travel of selected economies by origin and destination, 2011
Annual percentage change
Annual percentage change
Exports Imports
151World Trade OrganizationInternational Trade Statistics 2013
Download the data:www.wto.org/statistics
III TRA
DE
IN C
OM
ME
RC
IAL
SE
RV
ICE
S

Table III.8
(Million dollars and percentage)
Value Share Value Share
2011 2011 2005-11 2010 2011 2011 2011 2005-11 2010 2011
Australia World 31486 100.0 11 16 8 World 26597 100.0 15 24 20European Union (27) 5388 17.1 7 14 8 European Union (27) 6167 23.2 12 26 18China 5230 16.6 17 27 13 United States 4144 15.6 18 28 25New Zealand 2072 6.6 6 23 13 New Zealand 2107 7.9 13 12 18India 2070 6.6 18 1 -22 Indonesia 1950 7.3 26 58 35Korea, Republic of 1644 5.2 11 20 6 Thailand 1494 5.6 24 24 29
Above 5 16404 52.1 - - - Above 5 15861 59.6 - - -United States 1544 4.9 8 11 19 Fiji 1138 4.3 17 45 18Malaysia 1339 4.3 11 22 11 China 1086 4.1 15 33 22Singapore 1123 3.6 11 27 29 Hong Kong, China 700 2.6 14 3 23Japan 1049 3.3 -5 27 -5 Singapore 689 2.6 15 31 26Indonesia 981 3.1 12 28 24 Viet Nam 643 2.4 18 36 26Hong Kong, China 945 3.0 4 15 12 Malaysia 616 2.3 15 26 24Viet Nam 866 2.8 34 32 12 India 584 2.2 22 25 31Thailand 824 2.6 13 12 12 Canada 550 2.1 9 16 5Canada 561 1.8 10 14 12 Philippines 457 1.7 19 20 35Chinese Taipei 516 1.6 8 12 14 Japan 416 1.6 11 23 -14
Above 15 26153 83.1 - - - Above 15 22739 85.5 - - -Canada
World 16800 100.0 3 16 7 World 33323 100.0 11 23 13United States 7146 42.5 -1 13 2 United States 20416 61.3 13 29 16European Union (27) 3097 18.4 ... 12 4 European Union (27) 4595 13.8 ... 9 4Japan 345 2.1 -6 31 -3 Japan 205 0.6 1 21 7
Above 3 10588 63.0 - - - Above 3 25216 75.7 - - -Hong Kong, China
World 27665 100.0 18 35 25 World 19172 100.0 6 12 10China 19624 70.9 ... 34 29 China 5976 31.2 ... 12 4United States 864 3.1 ... 38 18 United States 1982 10.3 ... 5 7Chinese Taipei 746 2.7 ... 17 16 Chinese Taipei 1299 6.8 ... 18 16Japan 637 2.3 ... 34 7 Japan 1241 6.5 ... 22 -11
Above 4 21871 79.1 - - - Above 4 10498 54.8 - - -Russian Federation c
World 11328 100.0 12 -6 28 World 32902 100.0 11 27 23European Union (27) 3762 33.2 7 -4 27 European Union (27) 14989 45.6 11 22 39Ukraine 1207 10.7 9 -19 37 Turkey 3744 11.4 10 24 20Uzbekistan 1058 9.3 43 -10 42 Ukraine 1928 5.9 4 16 3Kazakhstan 642 5.7 12 9 14 Thailand 1842 5.6 55 108 92China 638 5.6 16 11 26 Egypt 1473 4.5 8 50 -49
Above 5 7306 64.5 - - - Above 5 23976 72.9 - - -Tajikistan 542 4.8 32 -5 21 China 1162 3.5 5 31 30United States 427 3.8 4 -10 19 United Arab Emirates 1042 3.2 20 33 56Moldova 405 3.6 26 -11 32 United States 786 2.4 13 13 17Azerbaijan 359 3.2 15 19 18 Switzerland 622 1.9 12 4 22Kyrgyz Republic 333 2.9 38 7 25 Israel 615 1.9 13 11 21Turkey 310 2.7 5 -14 51 Kazakhstan 410 1.2 3 5 -2Armenia 272 2.4 19 11 35 Norway 378 1.1 18 45 55Belarus 166 1.5 16 -11 12 Montenegro 367 1.1 ... 43 18Israel 142 1.3 11 -14 30 Croatia 280 0.8 18 33 24Japan 106 0.9 1 1 5 Tunisia 247 0.7 12 56 -15
Above 15 10368 91.5 - - - Above 15 29884 90.8 - - -
Trade in travel of selected economies by origin and destination, 2011
Annual percentage change
Annual percentage change
Exports Imports
152 World Trade OrganizationInternational Trade Statistics 2013
Download the data:www.wto.org/statistics

Table III.8
(Million dollars and percentage)
Value Share Value Share
2011 2011 2005-11 2010 2011 2011 2011 2005-11 2010 2011
Korea, Republic ofWorld 12525 100.0 14 6 21 World 19934 100.0 4 25 6China 2769 22.1 23 54 26 United States 5436 27.3 5 7 7Japan 1727 13.8 -4 1 -50 China 2833 14.2 3 27 9Philippines 1474 11.8 67 -28 475 Japan 2097 10.5 -4 44 -19United States 992 7.9 3 2 -17 European Union (27) 1693 8.5 4 10 15Canada 826 6.6 35 -16 408 Thailand 1156 5.8 8 42 39
Above 5 7789 62.2 - - - Above 5 13215 66.3 - - -European Union (27) 813 6.5 10 -14 57 Australia 1148 5.8 3 25 -5Russian Federation 765 6.1 44 -3 318 Hong Kong, China 974 4.9 24 22 31Thailand 390 3.1 27 42 33 Canada 935 4.7 4 19 -3India 292 2.3 32 -13 218 Singapore 604 3.0 7 15 36Indonesia 277 2.2 37 -14 209 Viet Nam 449 2.3 16 54 24Hong Kong, China 241 1.9 -5 6 -25 Philippines 343 1.7 -7 436 -42Singapore 230 1.8 11 2 8 Indonesia 323 1.6 14 25 22Malaysia 195 1.6 9 20 45 Chinese Taipei 319 1.6 2 13 32Chinese Taipei 166 1.3 -18 -15 -56 Malaysia 206 1.0 16 40 11Viet Nam 146 1.2 25 -11 74 New Zealand 181 0.9 -8 -2 -33
Above 15 11305 90.3 - - - Above 15 18698 93.8 - - -Japan
World 10967 100.0 ... 28 -17 World 27210 100.0 ... 11 -2China 3414 31.1 ... 32 2 United States 8096 29.8 ... 15 22Korea, Republic of 1831 16.7 ... 55 -25 European Union (27) 4786 17.6 ... 4 -10Chinese Taipei 1354 12.3 ... 31 -34 China 3518 12.9 ... 0 -5United States 951 8.7 ... 9 -6 Korea, Republic of 3285 12.1 ... 35 41European Union (27) 880 8.0 ... 12 -24 Thailand 1388 5.1 ... -6 -2
Above 5 8430 76.9 - - - Above 5 21072 77.4 - - -Hong Kong, China 506 4.6 ... 21 -47 Chinese Taipei 854 3.1 ... 13 -41Australia 283 2.6 ... 14 10 Hong Kong, China 665 2.4 ... 29 -30Thailand 269 2.5 ... 25 -10 Canada 634 2.3 ... 5 60Canada 179 1.6 ... 7 -22 Singapore 487 1.8 ... 32 -21Singapore 160 1.5 ... 31 -38 Indonesia 378 1.4 ... 13 -33Malaysia 158 1.4 ... 30 -13 Viet Nam 365 1.3 ... 35 4Indonesia 123 1.1 ... 36 -8 Australia 345 1.3 ... -1 -64Viet Nam 117 1.1 ... 23 16 Philippines 340 1.2 ... 12 -18India 94 0.9 ... 28 1 Malaysia 244 0.9 ... 21 -10Philippines 82 0.8 ... 17 -17 Switzerland 200 0.7 ... 40 -23
Above 15 10401 94.8 - - - Above 15 25583 94.0 - - -Turkey
World 23020 100.0 4 -2 11European Union (27) 11183 48.6 ... -2 32Russian Federation 2174 9.4 ... -2 36United States 708 3.1 ... -2 125Switzerland 293 1.3 ... -2 77Japan 217 0.9 ... -2 81
Above 5 14575 63.3 - - -Australia 180 0.8 ... -2 65Canada 156 0.7 ... -2 160Israel 79 0.3 ... -2 -57
Above 8 14990 65.1 - - -
b ASEAN countries accounted for 8 per cent of travel exports and 6 per cent of imports.c In 2011, trade in travel not allocated geographically accounted for 2 per cent of exports and 3 per cent of imports.
For more information on asymmetries, see the Metadata.
Trade in travel of selected economies by origin and destination, 2011
Annual percentage change
Annual percentage change
Exports Imports
a Health-related expenditure and expenditure by seasonal and border workers are not allocated geographically. In 2011, they accounted for 7 per cent of travel exports and 2 per cent of imports.
153World Trade OrganizationInternational Trade Statistics 2013
Download the data:www.wto.org/statistics
III TRA
DE
IN C
OM
ME
RC
IAL
SE
RV
ICE
S

4. Other commercial services
(Billion dollars and percentage)
2012 2005 2012 2005-12 2010 2011 2012
ExportsWorld 2345 100.0 100.0 9 7 12 2North America 426 19.2 18.2 9 8 8 4South and Central America 63 1.8 2.7 16 17 30 6Europe 1187 54.4 50.7 8 4 12 -2
European Union (27) 1089 50.2 46.4 8 3 13 -2Commonwealth of Independent States (CIS) 41 1.1 1.7 18 9 20 11Africa 22 1.0 0.9 9 8 3 4Middle East 46 ... 2.0 ... -9 14 20Asia 558 20.5 23.8 12 16 14 6
ImportsWorld 1965 100.0 100.0 9 6 12 2North America 282 15.0 14.3 9 4 7 2South and Central America 86 2.7 4.4 17 21 27 7Europe 911 52.6 46.4 7 1 12 -2
European Union (27) 848 50.0 43.1 7 1 11 -2Commonwealth of Independent States (CIS) 67 2.5 3.4 14 12 13 16Africa 70 2.6 3.6 14 7 19 1Middle East 60 ... 3.0 ... 6 20 -3Asia 489 22.0 24.9 11 14 13 6
Table III.9
World trade in other commercial services by region, 2012
: For more information on asymmetries, see the Metadata.
Annual percentage changeValue Share
154 World Trade OrganizationInternational Trade Statistics 2013
Download the data:www.wto.org/statistics

(Billion dollars and percentage)
2012 2005 2012 2005-12 2010 2011 2012
ExportersEuropean Union (27) 1088.7 50.2 46.4 8 3 13 -2 Extra-EU (27) exports 520.9 22.7 22.2 9 3 12 0United States 375.6 16.5 16.0 9 8 8 4India 103.8 3.1 4.4 15 26 11 9China 101.5 2.3 4.3 19 24 13 11Japan 87.8 4.8 3.7 6 3 8 -6Switzerland 66.8 2.8 2.8 10 11 14 -4Hong Kong, China 59.4 2.7 2.5 9 17 12 1Korea, Republic of 54.5 1.5 2.3 17 9 20 23Singapore a 50.2 ... 2.1 ... 15 19 2Canada 47.0 2.5 2.0 6 10 8 -2Russian Federation 28.1 0.8 1.2 16 3 24 8Chinese Taipei 27.1 1.2 1.2 9 18 15 9Brazil 26.1 0.6 1.1 19 15 24 8Norway 20.5 0.8 0.9 10 3 3 4Israel 20.0 0.8 0.9 10 5 14 14
Above 15 2155.0 ... 92.0 - - - -Importers
European Union (27) 847.6 50.0 43.1 7 1 11 -2 Extra-EU (27) imports 351.5 20.3 17.9 7 -1 11 -2United States 229.5 11.4 11.7 10 3 7 3China 92.3 3.2 4.7 16 9 13 10Japan 91.7 5.2 4.7 8 0 10 3Singapore 60.0 ... 3.1 ... 19 20 2Korea, Republic of 56.8 2.2 2.9 14 13 9 12India 51.1 1.9 2.6 14 43 5 8Canada 46.8 3.1 2.4 5 12 6 -2Russian Federation 44.9 1.5 2.3 17 11 19 15Brazil 41.3 1.2 2.1 18 27 17 10Switzerland 27.8 1.0 1.4 14 10 26 5Norway 23.0 0.9 1.2 14 15 28 8Chinese Taipei 21.0 1.4 1.1 6 32 17 0Hong Kong, China 20.6 1.0 1.0 11 21 7 0Angola b 20.0 0.5 1.0 ... -8 45 ...
Above 15 1675.0 ... 85.2 - - - -
Annual percentage change
Leading exporters and importers of other commercial services, 2012
Table III.10
Value Share
b Secretariat estimate.a Does not include merchanting.
155World Trade OrganizationInternational Trade Statistics 2013
Download the data:www.wto.org/statistics
III TRA
DE
IN C
OM
ME
RC
IAL
SE
RV
ICE
S

Table III.11
(Million dollars and percentage)
Value Share Value Share
2011 2011 2005-11 2010 2011 2011 2011 2005-11 2010 2011
European Union (27) World 1110740 100.0 10 3 13 World 864762 100.0 9 1 11European Union (27) 588752 53.0 10 4 13 European Union (27) 507057 58.6 8 2 10United States 136056 12.2 8 2 11 United States 136707 15.8 6 -2 8Switzerland 76524 6.9 11 3 13 Switzerland 44187 5.1 6 -1 9China 20569 1.9 17 17 17 Japan 14283 1.7 9 1 21Japan 19646 1.8 4 -2 19 China 9937 1.1 20 7 21
Above 5 841548 75.8 - - - Above 5 712171 82.4 - - -Singapore 16980 1.5 15 15 26 India 9670 1.1 25 17 32Russian Federation 14758 1.3 12 18 -14 Singapore 9436 1.1 16 17 32Norway 12322 1.1 8 -10 16 Canada 7602 0.9 11 16 17Canada 11860 1.1 15 7 23 Russian Federation 7573 0.9 11 -2 11Australia 10684 1.0 16 11 9 Norway 7127 0.8 7 -10 13India 8606 0.8 20 -3 10 Hong Kong, China 7022 0.8 15 2 26Turkey 7669 0.7 18 11 28 Australia 4051 0.5 9 18 12Hong Kong, China 7555 0.7 4 14 12 Brazil 3912 0.5 17 -27 20Korea, Republic of 7369 0.7 11 25 20 Korea, Republic of 3133 0.4 11 6 6Brazil 6692 0.6 21 -24 18 Turkey 2951 0.3 10 9 7
Above 15 946043 85.2 - - - Above 15 774647 89.6 - - -United States a
World 359907 100.0 10 8 8 World 223210 100.0 11 3 7European Union (27) 134166 37.3 ... -1 8 European Union (27) 82534 37.0 ... -2 10Canada 28026 7.8 8 13 8 Bermuda 28108 12.6 15 -6 -9Japan 25416 7.1 4 13 -3 Switzerland 16277 7.3 9 2 -2Switzerland 20271 5.6 13 10 12 Canada 15429 6.9 7 15 7Mexico 14282 4.0 2 2 4 India 14185 6.4 29 20 22
Above 5 222161 61.7 - - - Above 5 156533 70.1 - - -Brazil 11856 3.3 27 25 27 Japan 13627 6.1 3 14 5China 11648 3.2 19 32 18 Brazil 4940 2.2 39 6 33Australia 10517 2.9 16 6 21 China 4692 2.1 33 18 26Bermuda 10504 2.9 15 3 -4 Mexico 3262 1.5 6 -7 18Singapore 8881 2.5 12 46 2 Australia 3254 1.5 8 5 13Korea, Republic of 8342 2.3 13 20 12 Singapore 2892 1.3 10 1 32Chinese Taipei 6671 1.9 17 75 13 Israel 2423 1.1 16 1 25Hong Kong, China 3495 1.0 6 -11 4 Hong Kong, China 2297 1.0 5 18 -1Saudi Arabia, Kingdom of 3424 1.0 16 12 3 Philippines 1450 0.6 22 12 11India 2933 0.8 15 -7 8 Chinese Taipei 1277 0.6 19 18 38
Above 15 300431 83.5 - - - Above 15 196647 88.1 - - -Japan
World 93266 100.0 8 3 8 World 89069 100.0 8 0 10European Union (27) 25657 27.5 ... -5 3 United States 35556 39.9 6 3 10United States 25149 27.0 4 0 -9 European Union (27) 19290 21.7 ... -3 9Singapore 11911 12.8 19 21 23 Singapore 4786 5.4 13 9 22Chinese Taipei 8850 9.5 16 42 102 China 3758 4.2 14 -2 20China 4733 5.1 7 21 94 Switzerland 2468 2.8 11 2 17
Above 5 76301 81.8 - - - Above 5 65858 73.9 - - -Indonesia 2714 2.9 18 113 -6 Korea, Republic of 1967 2.2 10 -5 23Switzerland 1956 2.1 17 25 16 Hong Kong, China 1906 2.1 9 10 17Australia 1880 2.0 13 -10 6 Chinese Taipei 1845 2.1 4 17 46India 1672 1.8 26 64 2 Australia 1697 1.9 19 5 -2Thailand 1638 1.8 -1 6 1 Russian Federation 1383 1.6 38 60 20Canada 1314 1.4 -5 2 -10 Indonesia 1275 1.4 9 3 8Malaysia 1209 1.3 ... … 415 Thailand 1233 1.4 8 8 23Hong Kong, China 996 1.1 29 -69 … United Arab Emirates 1029 1.2 12 -52 -33Brazil 986 1.1 26 29 8 Saudi Arabia, Kingdom of 771 0.9 23 -5 7Viet Nam 614 0.7 20 -8 24 Canada 747 0.8 8 28 -23
Above 15 91279 97.9 - - - Above 15 79711 89.5 - - -
Trade in other commercial services of selected economies by origin and destination, 2011
Annual percentage change
Annual percentage change
Exports Imports
156 World Trade OrganizationInternational Trade Statistics 2013
Download the data:www.wto.org/statistics

Table III.11
(Million dollars and percentage)
Value Share Value Share
2011 2011 2005-11 2010 2011 2011 2011 2005-11 2010 2011
China b, cWorld 91636 100.0 21 24 13 World 83973 100.0 17 9 13Hong Kong, China 50261 54.8 ... ... 86 European Union (27) 20859 24.8 ... ... 27United States 17115 18.7 ... ... … Hong Kong, China 13743 16.4 ... ... 11European Union (27) 13127 14.3 ... ... 19 Japan 11142 13.3 ... ... 26Japan 6366 6.9 ... ... 30 Korea, Republic of 8375 10.0 ... ... 62Singapore 5681 6.2 ... ... 37 Singapore 6981 8.3 ... ... 139
Above 5 92550 101.0 - - - Above 5 61100 72.8 - - -Korea, Republic of 1626 1.8 ... ... 41 United States 5194 6.2 ... ... -66Chinese Taipei 947 1.0 ... ... 16 Australia 3419 4.1 ... ... 227Australia 860 0.9 ... ... 109 Chinese Taipei 2793 3.3 ... ... 20Macao, China 252 0.3 ... ... 46 Macao, China 799 1.0 ... ... 206
Above 9 96236 105.0 - - - Above 9 73306 87.3 - - -Canada
World 48151 100.0 8 10 8 World 47668 100.0 7 12 6United States 28685 59.6 7 11 7 United States 31485 66.1 6 9 7European Union (27) 7478 15.5 ... 6 15 European Union (27) 6758 14.2 ... 12 2
Above 2 36163 75.1 - - - Above 2 38244 80.2 - - -Korea, Republic of
World 44369 100.0 16 9 20 World 50471 100.0 14 13 9United States 7730 17.4 11 5 37 United States 13739 27.2 11 18 1China 3405 7.7 27 43 23 European Union (27) 8263 16.4 11 6 2European Union (27) 3292 7.4 7 48 4 China 6648 13.2 20 22 21Japan 3015 6.8 9 42 1 Japan 3458 6.9 12 12 9Hong Kong, China 1117 2.5 12 79 -7 Hong Kong, China 1474 2.9 10 14 -7
Above 5 18559 41.8 - - - Above 5 33582 66.5 - - -Singapore 1047 2.4 11 59 -29 Viet Nam 1407 2.8 23 13 14Chinese Taipei 472 1.1 18 227 -12 Singapore 1306 2.6 5 37 6India 363 0.8 31 -9 43 Chinese Taipei 1043 2.1 28 68 47United Arab Emirates 334 0.8 42 -21 -8 Indonesia 983 1.9 22 26 18Viet Nam 310 0.7 36 -36 103 United Arab Emirates 702 1.4 28 18 2Australia 276 0.6 19 22 23 India 558 1.1 21 1 33Russian Federation 273 0.6 34 405 -31 Switzerland 463 0.9 7 -1 7Malaysia 245 0.6 13 25 50 Australia 457 0.9 14 173 -27Iran 244 0.6 66 -71 … Philippines 398 0.8 20 -24 42Thailand 234 0.5 19 87 -39 Canada 268 0.5 15 6 -3
Above 15 22355 50.4 - - - Above 15 41165 81.6 - - -Singapore d, e, f
World 49007 100.0 ... 15 19 World 58697 100.0 ... 19 20European Union (27) 8425 17.2 ... 11 27 European Union (27) 13667 23.3 ... 32 13United States 6154 12.6 ... 12 13 United States 12968 22.1 ... 8 -3Australia 4159 8.5 ... 59 38 China 3086 5.3 ... 15 42Japan 2782 5.7 ... 39 23 Japan 3080 5.2 ... 17 34Hong Kong, China 2725 5.6 ... 34 12 Hong Kong, China 2024 3.4 ... 29 0
Above 5 24245 49.5 - - - Above 5 34826 59.3 - - -China 1851 3.8 ... 20 8 Australia 1943 3.3 ... 58 29India 1820 3.7 ... 7 14 India 1592 2.7 ... 33 5Korea, Republic of 764 1.6 ... 10 -5 Korea, Republic of 790 1.3 ... 25 16
Above 8 28680 58.5 - - - Above 8 39151 66.7 - - -
Trade in other commercial services of selected economies by origin and destination, 2011
Annual percentage change
Annual percentage change
Exports Imports
157World Trade OrganizationInternational Trade Statistics 2013
Download the data:www.wto.org/statistics
III TRA
DE
IN C
OM
ME
RC
IAL
SE
RV
ICE
S

Table III.11
(Million dollars and percentage)
Value Share Value Share
2011 2011 2005-11 2010 2011 2011 2011 2005-11 2010 2011
Hong Kong, China gWorld 58581 100.0 10 17 12 World 20478 100.0 13 21 7United States 8314 14.2 ... 14 0 China 5029 24.6 ... 30 11China 3924 6.7 ... 27 4 United States 3660 17.9 ... 17 1Japan 1097 1.9 ... 6 -1 Japan 1333 6.5 ... 8 -7Chinese Taipei 651 1.1 ... 17 23 Chinese Taipei 485 2.4 ... 18 9
Above 4 13986 23.9 - - - Above 4 10507 51.3 - - -Russian Federation h
World 25979 100.0 18 3 24 World 39006 100.0 17 11 19European Union (27) 11476 44.2 17 1 23 European Union (27) 22908 58.7 20 12 25United States 3512 13.5 17 1 14 United States 3856 9.9 18 2 24Turkey 1448 5.6 18 0 25 Turkey 1642 4.2 4 -5 4Switzerland 1410 5.4 23 21 42 Switzerland 1533 3.9 20 23 13Kazakhstan 744 2.9 19 12 11 Panama 1140 2.9 11 5 10
Above 5 18589 71.6 - - - Above 5 31078 79.7 - - -British Virgin Islands 539 2.1 15 19 3 Ukraine 1035 2.7 19 66 -4Ukraine 516 2.0 13 22 18 British Virgin Islands 571 1.5 30 106 3Panama 374 1.4 36 25 20 China 545 1.4 51 70 54Turkmenistan 354 1.4 93 83 164 Belarus 517 1.3 18 24 23Belarus 329 1.3 14 23 14 Hong Kong, China 397 1.0 66 254 75China 317 1.2 26 22 48 Korea, Republic of 331 0.8 27 5 -5Japan 221 0.9 9 1 17 Kazakhstan 268 0.7 18 -10 23Norway 218 0.8 28 95 26 Serbia 258 0.7 ... -52 94United Arab Emirates 190 0.7 44 -63 141 Japan 211 0.5 25 -1 54Serbia 185 0.7 ... -43 35 Canada 187 0.5 23 61 6
Above 15 21834 84.0 - - - Above 15 35399 90.8 - - -Norway
World 19715 100.0 11 3 3 World 21391 100.0 15 15 28European Union (27) 9670 49.0 ... ... -5 European Union (27) 13677 63.9 ... ... 20United States 1702 8.6 ... ... -4 United States 1852 8.7 ... ... -4Switzerland 495 2.5 ... ... 73 Switzerland 659 3.1 ... ... 57China 434 2.2 ... ... 64 China 193 0.9 ... ... 135Brazil 432 2.2 ... ... -25 Canada 125 0.6 ... ... 69
Above 5 12733 64.6 - - - Above 5 16507 77.2 - - -Russian Federation 221 1.1 ... ... 33 Brazil 120 0.6 ... ... 56Japan 168 0.9 ... ... -42 India 118 0.6 ... ... 65Canada 161 0.8 ... ... -60 Russian Federation 106 0.5 ... ... 9India 120 0.6 ... ... -72 Japan 103 0.5 ... ... -40Hong Kong, China 32 0.2 ... ... 34 Hong Kong, China 82 0.4 ... ... 100
Above 10 13435 68.1 - - - Above 10 17035 79.6 - - -
c The sum of bilateral exports exceeds the world total due to the different way of computing merchanting between bilateral statistics and China as a whole.b In 2011, ASEAN countries accounted for 8 per cent of other commercial services exports and 12 per cent of imports.
g Financial intermediation services indirectly measured (FISIM) are not allocated geographically. In 2011, they accounted for 2 per cent of other commercial services exports and 1 per cent of imports.h In 2011, trade not allocated geographically represented 2 per cent of other commercial services exports and 5 per cent of imports.
For more information on asymmetries, see the Metadata.
Trade in other commercial services of selected economies by origin and destination, 2011
Annual percentage change
Annual percentage change
Exports Imports
a Bilateral data exclude transactions in postal and courier services, which are recorded under transportation services.
d Does not include merchanting. e The following transactions are not allocated geographically: financial services exports related to foreign exchange trading; imports of insurance on goods imports; financial intermediation services indirectly measured (FISIM). f In 2011, ASEAN countries accounted for 11 per cent of other commercial services exports and 7 per cent of imports.
158 World Trade OrganizationInternational Trade Statistics 2013
Download the data:www.wto.org/statistics

2011 2012 2011 2005-11 2010 2011 2012
ExportersEuropean Union (27) 54380 58266 65.2 9 6 12 7 Extra-EU (27) exports 23951 29119 28.7 17 16 16 22United States 12886 14047 15.5 ... 10 14 9Kuwait a 3601 3447 4.3 19 -48 1 -4Canada 3156 ... 3.8 8 10 16 ...China 1726 1793 2.1 24 2 41 4India 1672 1647 2.0 1 -9 8 -1Hong Kong, China 1568 ... 1.9 9 39 26 ...Russian Federation 1473 1550 1.8 14 1 9 5Indonesia 1450 1090 1.7 6 9 29 -25Switzerland 1448 882 1.7 3 8 1 -39
Above 10 83360 ... 100.0 - - - -Importers
European Union (27) 50035 52165 68.6 8 2 5 4 Extra-EU (27) imports 21222 23902 29.1 14 7 9 13United States 8057 8280 11.1 ... 5 -4 3Saudi Arabia, Kingdom of a 2599 2027 3.6 40 18 18 -22Russian Federation 2530 3085 3.5 23 11 21 22Canada 2359 ... 3.2 8 25 -2 ...Hong Kong, China 2002 ... 2.7 10 45 20 ...Korea, Republic of 1540 1613 2.1 12 19 5 5India 1406 1019 1.9 22 -3 21 -28China 1191 1647 1.6 12 -6 5 38Malaysia a 1169 1294 1.6 9 19 27 11
Above 10 72885 ... 100.0 - - - -
Annual percentage change
a Telecommunications services.: Based on information available to the Secretariat. See the Metadata.
Table III.13
Major exporters and importers of communications services, 2011 and 2012
(Million dollars and percentage)
ValueShare in 10 economies
Table III.12
World exports of communications services by region, 2011 and 2012
(Billion dollars and percentage)
2011 2012 2005 2012 2005-12 2011 2012
ExportsWorld 105 110 100.0 100.0 9 11 5North America 16 17 ... 15.6 ... 14 7South and Central America 4 4 4.5 3.6 6 -5 11Europe 59 62 57.9 55.3 9 12 5
European Union (27) 54 58 53.6 52.2 9 12 7Commonwealth of Independent States (CIS) 3 3 2.1 2.7 14 7 5Africa 4 4 3.2 3.9 13 4 5Middle East 6 6 4.9 5.3 11 -3 1Asia 15 15 14.7 13.6 8 15 3
Annual percentage changeShareValue
4.1 Communications services
159World Trade OrganizationInternational Trade Statistics 2013
Download the data:www.wto.org/statistics
III TRA
DE
IN C
OM
ME
RC
IAL
SE
RV
ICE
S
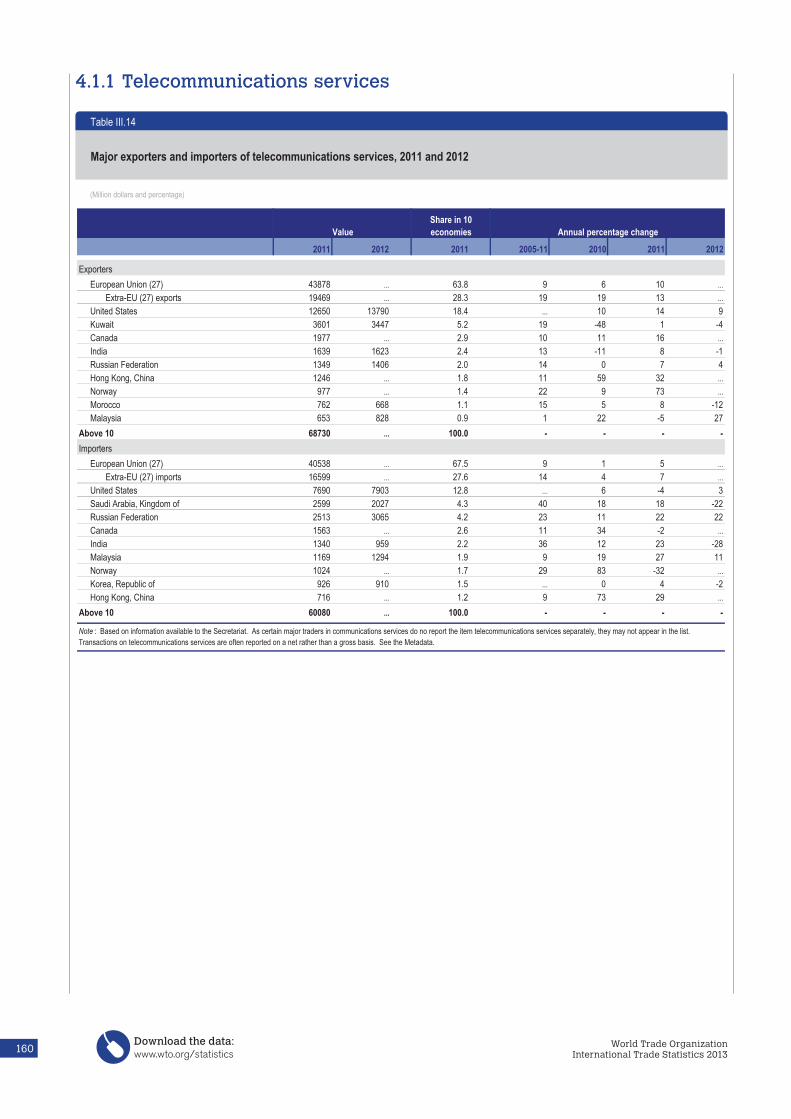
4.1.1 Telecommunications services
2011 2012 2011 2005-11 2010 2011 2012
ExportersEuropean Union (27) 43878 ... 63.8 9 6 10 ... Extra-EU (27) exports 19469 ... 28.3 19 19 13 ...United States 12650 13790 18.4 ... 10 14 9Kuwait 3601 3447 5.2 19 -48 1 -4Canada 1977 ... 2.9 10 11 16 ...India 1639 1623 2.4 13 -11 8 -1Russian Federation 1349 1406 2.0 14 0 7 4Hong Kong, China 1246 ... 1.8 11 59 32 ...Norway 977 ... 1.4 22 9 73 ...Morocco 762 668 1.1 15 5 8 -12Malaysia 653 828 0.9 1 22 -5 27
Above 10 68730 ... 100.0 - - - -Importers
European Union (27) 40538 ... 67.5 9 1 5 ... Extra-EU (27) imports 16599 ... 27.6 14 4 7 ...United States 7690 7903 12.8 ... 6 -4 3Saudi Arabia, Kingdom of 2599 2027 4.3 40 18 18 -22Russian Federation 2513 3065 4.2 23 11 22 22Canada 1563 ... 2.6 11 34 -2 ...India 1340 959 2.2 36 12 23 -28Malaysia 1169 1294 1.9 9 19 27 11Norway 1024 ... 1.7 29 83 -32 ...Korea, Republic of 926 910 1.5 ... 0 4 -2Hong Kong, China 716 ... 1.2 9 73 29 ...
Above 10 60080 ... 100.0 - - - -
Share in 10 economies Annual percentage change
: Based on information available to the Secretariat. As certain major traders in communications services do no report the item telecommunications services separately, they may not appear in the list. Transactions on telecommunications services are often reported on a net rather than a gross basis. See the Metadata.
Table III.14
Major exporters and importers of telecommunications services, 2011 and 2012
(Million dollars and percentage)
Value
160 World Trade OrganizationInternational Trade Statistics 2013
Download the data:www.wto.org/statistics

Table III.15
(Million dollars and percentage)
Value Share Value Share
2011 2011 2005-11 2010 2011 2011 2011 2005-11 2010 2011
European Union (27) United StatesWorld 43878 100.0 9 6 10 World 12650 100.0 ... 10 14European Union (27) 24414 55.6 4 -2 7 European Union (27) 3681 29.1 ... 2 2United States 3934 9.0 9 7 10 Brazil 3196 25.3 ... 40 48Switzerland 2443 5.6 23 66 5 Canada 795 6.3 ... 3 10Russian Federation 771 1.8 26 25 10 Venezuela, Bolivarian Rep. of 780 6.2 ... -21 29South Africa 731 1.7 45 127 30 Argentina 737 5.8 ... 30 36
Above 5 32293 73.6 - - - Above 5 9189 72.6 - - -Norway 594 1.4 8 -7 12 Japan 266 2.1 ... 0 -2Turkey 413 0.9 25 35 6 India 237 1.9 ... -7 27Brazil 370 0.8 30 28 -16 Mexico 213 1.7 ... 31 -47Singapore 340 0.8 34 33 17 Chile 171 1.4 ... 24 27Morocco 336 0.8 30 -6 9 Australia 132 1.0 ... 13 4Canada 321 0.7 11 81 -33 Philippines 106 0.8 ... 22 -20India 289 0.7 23 -19 16 Switzerland 104 0.8 ... -12 -9Nigeria 270 0.6 35 31 20 Hong Kong, China 93 0.7 ... 10 22Australia 266 0.6 7 4 7 China 91 0.7 ... -17 14Japan 233 0.5 -7 4 10 Korea, Republic of 90 0.7 ... -2 14
Above 15 35726 81.4 - - - Above 15 10692 84.5 - - -
Exports of telecommunication services of selected economies by destination, 2011
Annual percentage change
Annual percentage change
161World Trade OrganizationInternational Trade Statistics 2013
Download the data:www.wto.org/statistics
III TRA
DE
IN C
OM
ME
RC
IAL
SE
RV
ICE
S

Table III.16
World exports of construction by region, 2011 and 2012
(Billion dollars and percentage)
2011 2012 2005 2012 2005-12 2011 2012
ExportsWorld 110 115 100.0 100.0 11 9 2North America 4 4 2.7 3.2 13 16 1South and Central America 0 0 0.2 0.1 3 -17 -8Europe 49 45 55.6 40.0 5 6 -8
European Union (27) 45 41 52.2 36.6 5 6 -9Commonwealth of Independent States (CIS) 6 6 4.5 5.5 14 25 13Africa 2 2 2.0 1.6 8 -9 4Middle East 3 3 3.4 2.4 6 7 5Asia 48 53 31.5 47.1 17 12 12
Annual percentage changeShareValue
4.2 Construction
2011 2012 2011 2005-11 2010 2011 2012
ExportersEuropean Union (27) 45312 41322 45.8 8 -8 6 -9 Extra-EU (27) exports 26727 24846 27.0 10 -9 8 -7Korea, Republic of 15478 21905 15.7 22 -18 29 42China 14724 12246 14.9 34 53 2 -17Japan 10955 11552 11.1 7 -15 3 5Russian Federation 4408 4751 4.5 12 -15 26 8United States 3084 ... 3.1 15 -34 17 ...Singapore 1543 1681 1.6 19 -3 50 9Turkey 1245 1343 1.3 6 -12 11 8Malaysia 1103 1311 1.1 5 14 7 19Israel 1004 1332 1.0 19 7 20 33
Above 10 98855 ... 100.0 - - - -Importers
European Union (27) 30854 29985 45.0 8 -8 5 -3 Extra-EU (27) imports 11459 11300 16.7 7 -22 7 -1Angola 7932 ... 11.6 35 -1 71 ...Japan 7702 7735 11.2 8 -31 -2 0Russian Federation 5600 7424 8.2 6 -1 22 33Korea, Republic of 3795 5153 5.5 28 -18 65 36China 3728 3619 5.4 15 -14 -26 -3Saudi Arabia, Kingdom of 2578 2729 3.8 11 15 -32 6United States 2412 ... 3.5 13 -33 1 ...Algeria 1988 ... 2.9 24 -15 -22 ...Kazakhstan 1900 2757 2.8 0 -19 14 45
Above 10 68490 ... 100.0 - - - -
: Based on information available to the Secretariat. As certain economies do not report this item separately, they may not appear in the list (e.g., Switzerland, United Arab Emirates). See the Metadata.
ValueShare in 10 economies Annual percentage change
Table III.17
Major exporters and importers of construction, 2011 and 2012
(Million dollars and percentage)
162 World Trade OrganizationInternational Trade Statistics 2013
Download the data:www.wto.org/statistics

Table III.18
(Million dollars and percentage)
Value Share Value Share
2011 2011 2005-11 2010 2011 2011 2011 2005-11 2010 2011
European Union (27) JapanWorld 45312 100.0 8 -8 6 World 10955 100.0 7 -15 3European Union (27) 18584 41.0 5 -5 4 Saudi Arabia, Kingdom of 1590 14.5 21 24 31Russian Federation 1732 3.8 9 29 -25 European Union (27) 1369 12.5 ... 22 28China 1617 3.6 11 64 3 Indonesia 1360 12.4 22 85 19United States 1385 3.1 0 -11 12 Thailand 658 6.0 7 -5 85Brazil 1080 2.4 23 21 -1 United Arab Emirates 583 5.3 -11 -54 -28
Above 5 24398 53.8 - - - Above 5 5560 50.8 - - -Switzerland 910 2.0 4 0 -1 Australia 559 5.1 70 -16 2Norway 875 1.9 -2 -24 36 United States 393 3.6 15 53 34Australia 840 1.9 26 33 64 Singapore 369 3.4 11 -39 19Nigeria 832 1.8 -4 -58 70 Viet Nam 351 3.2 7 -37 63Venezuela, Bolivarian Rep. of 789 1.7 19 6 85 Philippines 304 2.8 20 -39 109India 564 1.2 10 -6 -12 Chinese Taipei 262 2.4 -18 -15 10Turkey 555 1.2 23 19 78 Malaysia 124 1.1 0 88 -52Mexico 305 0.7 9 23 13 China 123 1.1 -12 -12 67South Africa 296 0.7 9 -76 54 Canada 109 1.0 18 -38 …Korea, Republic of 269 0.6 -2 -28 7 India 40 0.4 -3 -18 -72
Above 15 30635 67.6 - - - Above 15 8196 74.8 - - -Russian Federation a Singapore b
World 4408 100.0 12 -15 26 World 1543 100.0 19 -3 50European Union (27) 1445 32.8 11 -10 20 India 145 9.4 ... 3 12Turkey 1267 28.7 19 4 25 United States 96 6.2 ... 9 30Turkmenistan 318 7.2 353 115 171 European Union (27) 89 5.7 ... -64 62United States 165 3.7 -8 49 -39 China 43 2.8 ... -24 -21Serbia 158 3.6 ... -50 50
Above 5 3353 76.1 - - - Above 4 373 24.2 - - -
Exports of construction of selected economies by destination, 2011
Annual percentage change
Annual percentage change
a In 2011, construction not allocated geographically represented 3 per cent of exports.b In 2011, ASEAN countries accounted for 29 per cent of construction exports.
163World Trade OrganizationInternational Trade Statistics 2013
Download the data:www.wto.org/statistics
III TRA
DE
IN C
OM
ME
RC
IAL
SE
RV
ICE
S

Table III.19
World exports of insurance services by region, 2011 and 2012
(Billion dollars and percentage)
2011 2012 2005 2012 2005-12 2011 2012
ExportsWorld 100 100 100.0 100.0 11 1 2North America 20 21 ... 20.7 ... 8 5South and Central America 2 2 2.1 2.2 11 15 12Europe 60 62 54.5 61.7 13 -4 4
European Union (27) 53 55 46.1 54.6 13 -7 4Commonwealth of Independent States (CIS) 1 1 0.8 0.6 6 -13 2Africa 1 1 2.4 1.1 0 15 -9Middle East 1 2 3.8 1.7 -1 -34 27Asia 14 12 11.5 11.9 11 19 -12
Annual percentage changeShareValue
4.3 Insurance services
2011 2012 2011 2005-11 2010 2011 2012
ExportersEuropean Union (27) 52594 54727 59.0 15 -2 -7 4 Extra-EU (27) exports 25495 27012 28.6 23 -3 -16 6United States 15477 16626 17.4 13 0 7 7Switzerland 5743 5811 6.4 9 -12 17 1China 3018 3329 3.4 33 8 75 10Singapore 2967 2983 3.3 15 42 -21 1India 2573 2228 2.9 18 18 44 -13Mexico 2262 2215 2.5 7 15 24 -2Canada 1980 1848 2.2 ... 49 5 -7Japan 1658 -378 1.9 11 47 30 …Turkey 869 988 1.0 18 6 21 14
Above 10 89140 90375 100.0 - - - -Importers
United States 56620 53340 39.4 12 -4 -7 -6European Union (27) 36627 33034 25.5 6 -2 0 -10 Extra-EU (27) imports 15313 13263 10.6 7 -2 4 -13China 19738 20600 13.7 18 39 25 4Japan 6806 7406 4.7 23 32 0 9India 6052 6260 4.2 17 24 21 3Canada 4728 4400 3.3 ... 47 8 -7Singapore 4473 4473 3.1 15 39 16 0Mexico 4086 4086 2.8 10 -18 56 0Thailand 2753 3050 1.9 12 32 27 11Saudi Arabia, Kingdom of 1949 2300 1.4 26 11 17 18
Above 10 143835 138950 100.0 - - - -
: Based on information available to the Secretariat. For more information on asymmetries, see the Metadata.
ValueShare in 10 economies Annual percentage change
Table III.20
Major exporters and importers of insurance services, 2011 and 2012
(Million dollars and percentage)
164 World Trade OrganizationInternational Trade Statistics 2013
Download the data:www.wto.org/statistics

Table III.21
(Million dollars and percentage)
Value Share Value Share
2011 2011 2005-11 2010 2011 2011 2011 2005-11 2010 2011
European Union (27) United StatesWorld 52594 100.0 15 -2 -7 World 15477 100.0 13 0 7European Union (27) 27097 51.5 10 -1 4 European Union (27) 3498 22.6 ... -1 1United States 11276 21.4 73 -7 -20 Canada 2835 18.3 9 0 8Switzerland 1927 3.7 15 14 11 Bermuda 2785 18.0 28 3 5Canada 1641 3.1 12 1 -20 Japan 1589 10.3 12 5 13Australia 996 1.9 11 35 -34 Australia 565 3.7 18 -3 35
Above 5 42937 81.6 - - - Above 5 11272 72.8 - - -Brazil 433 0.8 50 10 19 Mexico 484 3.1 21 -1 -13Japan 427 0.8 5 16 -67 Brazil 273 1.8 30 37 3South Africa 413 0.8 3 -7 -11 Korea, Republic of 272 1.8 25 0 2Norway 408 0.8 22 -9 -12 Chile 144 0.9 21 12 7Mexico 360 0.7 12 15 -30 Argentina 143 0.9 26 4 24China 345 0.7 36 50 4 Israel 137 0.9 26 18 6Russian Federation 337 0.6 22 -34 56 Venezuela, Bolivarian Rep. of 87 0.6 27 -18 24Singapore 332 0.6 26 -2 -6 China 80 0.5 13 -6 19Turkey 266 0.5 13 10 -4 Chinese Taipei 78 0.5 6 14 -12India 190 0.4 33 -1 7 Hong Kong, China 58 0.4 -23 -1 -25
Above 15 46450 88.3 - - - Above 15 13028 84.2 - - -Singapore a Japan
World 2967 100.0 15 42 -21 World 1658 100.0 11 47 30Australia 485 16.3 ... -1 70 European Union (27) 542 32.7 ... 34 -19Japan 281 9.5 ... 50 -14 United States 267 16.1 21 349 …European Union (27) 267 9.0 ... 31 104 Hong Kong, China 124 7.5 8 61 2China 176 5.9 ... 12 -47 China 123 7.4 13 85 40Korea, Republic of 119 4.0 ... 21 -45 Switzerland 77 4.6 1 -28 325
Above 5 1328 44.7 - - - Above 5 1134 68.4 - - -Hong Kong, China Korea, Republic of
World 849 100.0 13 38 -1 World 518 100.0 21 51 1China 328 38.6 ... 50 28 United States 163 31.5 36 … …Japan 120 14.1 ... 31 1 European Union (27) 132 25.4 2 … -60Chinese Taipei 97 11.4 ... 94 -20 Hong Kong, China 44 8.5 ... … 235United States 40 4.7 ... 35 -8 Singapore 39 7.6 -6 … -85
China 29 5.5 11 …. -46Above 4 584 68.8 - - - Above 5 407 78.5 - - -
Exports of insurance services of selected economies by destination, 2011
Annual percentage change
Annual percentage change
a In 2011, ASEAN countries accounted for 19 per cent of insurance services exports.
165World Trade OrganizationInternational Trade Statistics 2013
Download the data:www.wto.org/statistics
III TRA
DE
IN C
OM
ME
RC
IAL
SE
RV
ICE
S

Table III.22
World exports of financial services by region, 2011 and 2012
(Billion dollars and percentage)
2011 2012 2005 2012 2005-12 2011 2012
ExportsWorld 315 305 100.0 100.0 8 12 -4North America 78 76 23.2 25.2 9 6 -2South and Central America 5 5 0.7 1.7 23 34 9Europe 179 166 60.8 54.8 6 16 -7
European Union (27) 159 147 52.3 48.4 7 16 -8Commonwealth of Independent States (CIS) 2 2 0.3 0.6 21 -6 17Africa 2 2 0.7 0.7 9 12 3Middle East 3 2 ... 0.8 ... ... -23Asia 49 49 12.3 16.3 12 16 1
Annual percentage changeShareValue
4.4 Financial services
2011 2012 2011 2005-11 2010 2011 2012
ExportersEuropean Union (27) 158764 146734 53.0 9 2 16 -8 Extra-EU (27) exports 70765 64933 23.6 8 5 13 -8United States 74055 72328 24.7 11 9 5 -2Switzerland a 17017 16076 5.7 3 -3 8 -6Singapore a 14827 14837 5.0 22 15 25 0Hong Kong, China a 14570 14442 4.9 15 16 11 -1India 6234 5531 2.1 33 61 7 -11Japan 4111 4651 1.4 -3 -25 14 13Canada 3747 3767 1.3 11 18 14 1Korea, Republic of 3389 3192 1.1 13 20 24 -6Brazil 2662 2684 0.9 32 32 28 1
Above 10 299375 284240 100.0 - - - -Importers
European Union (27) 73647 67731 62.2 8 7 18 -8 Extra-EU (27) imports 30198 26909 25.5 9 11 22 -11United States 16207 15641 13.7 5 2 10 -3India 8211 5434 6.9 45 81 21 -34Canada 4432 4330 3.7 8 13 -2 -2Hong Kong, China a 3882 4082 3.3 18 13 10 5Japan 3346 3221 2.8 4 3 6 -4Singapore a 3036 3019 2.6 22 25 18 -1Switzerland a 1894 1687 1.6 10 -9 10 -11Norway 1876 2087 1.6 ... ... 49 11Brazil 1804 1975 1.5 16 4 7 9
Above 10 118335 109205 100.0 - - - -
Share in 10 economies Annual percentage change
a Includes Financial Intermediation Services Indirectly Measured (FISIM), see the Metadata. : Based on information available to the Secretariat. For more information on asymmetries, see the Metadata.
Table III.23
Major exporters and importers of financial services, 2011 and 2012
(Million dollars and percentage)
Value
166 World Trade OrganizationInternational Trade Statistics 2013
Download the data:www.wto.org/statistics

Table III.24
(Million dollars and percentage)
Value Share Value Share
2011 2011 2005-11 2010 2011 2011 2011 2005-11 2010 2011
European Union (27) United StatesWorld 158764 100.0 9 2 16 World 74055 100.0 11 9 5European Union (27) 87999 55.4 10 0 19 European Union (27) 26971 36.4 ... -1 10United States 21469 13.5 7 6 16 Canada 4933 6.7 ... 6 2Switzerland 8846 5.6 6 -2 15 Japan 3051 4.1 ... 6 -10Japan 4455 2.8 3 -11 18 Australia 2857 3.9 ... 19 21Russian Federation 2540 1.6 19 16 -20 Brazil 2170 2.9 ... 21 37
Above 5 125309 78.9 - - - Above 5 39982 54.0 - - -Hong Kong, China 1908 1.2 14 10 28 China 2131 2.9 ... 58 3Canada 1887 1.2 18 -2 68 Bermuda 1532 2.1 ... 10 -9Singapore 1708 1.1 19 13 42 Switzerland 1270 1.7 ... -2 -1Australia 1488 0.9 16 5 11 Mexico 1224 1.7 ... 8 2Chinese Taipei 1252 0.8 12 106 -35 Hong Kong, China 1207 1.6 ... 21 -3Norway 1226 0.8 7 -7 19 Korea, Republic of 782 1.1 ... 28 -2Turkey 681 0.4 13 6 21 Singapore 748 1.0 ... 2 -16South Africa 674 0.4 14 29 33 Saudi Arabia, Kingdom of 624 0.8 ... 4 20Brazil 560 0.4 26 6 29 India 504 0.7 ... -3 -2China 547 0.3 9 -7 12 Norway 472 0.6 ... -4 10
Above 15 137241 86.4 - - - Above 15 50476 68.2 - - -Singapore a, b Hong Kong, China c
World 14827 100.0 22 15 25 World 14570 100.0 15 16 11European Union (27) 2002 13.5 ... 19 38 United States 4133 28.4 ... 24 4United States 1085 7.3 ... 11 2 China 626 4.3 ... 69 -9Hong Kong, China 919 6.2 ... 49 18 Japan 396 2.7 ... -12 -7Australia 467 3.1 ... 78 20 Chinese Taipei 205 1.4 ... -5 34Japan 419 2.8 ... 102 23
Above 5 4892 33.0 - - - Above 4 5359 36.8 - - -Japan Russian Federation d
World 4111 100.0 -3 -25 14 World 1103 100.0 19 2 5European Union (27) 1539 37.4 ... -21 2 European Union (27) 688 62.4 19 -17 9United States 1285 31.3 -7 -45 10 United States 116 10.5 16 -25 47Hong Kong, China 295 7.2 -10 18 17 Switzerland 56 5.0 39 41 63Cayman Islands 272 6.6 9 62 23 Jersey 47 4.3 ... 306 -49Australia 76 1.8 19 23 -18 Belarus 35 3.2 53 18 76
Above 5 3466 84.3 - - - Above 5 942 85.4 - - -
c Financial intermediation services indirectly measured (FISIM) are not allocated geographically. In 2011 they accounted for 9 per cent of financial services exports.d In 2011, financial services not allocated geographically accounted for 1 per cent of exports.
Exports of financial services of selected economies by destination, 2011
Annual percentage change
Annual percentage change
a Financial services exports related to foreign exchange trading and to financial intermediation services indirectly measured are not allocated geographically. b In 2011, ASEAN countries accounted for 6 per cent of financial services exports.
167World Trade OrganizationInternational Trade Statistics 2013
Download the data:www.wto.org/statistics
III TRA
DE
IN C
OM
ME
RC
IAL
SE
RV
ICE
S

Table III.25
World exports of computer and information services by region, 2011 and 2012
(Billion dollars and percentage)
2011 2012 2005 2012 2005-12 2011 2012
ExportsWorld 250 265 100.0 100.0 14 14 6North America 23 24 12.3 9.1 9 9 6South and Central America 5 6 1.0 2.1 27 23 17Europe 138 142 60.9 54.1 12 13 3
European Union (27) 132 136 58.8 51.6 12 15 3Commonwealth of Independent States (CIS) 3 4 0.5 1.5 33 34 28Africa 1 1 0.3 0.5 21 20 5Middle East 10 11 4.4 4.4 14 22 19Asia 68 74 20.7 28.3 19 14 9
Annual percentage changeShareValue
4.5 Computer and information services
2011 2012 2011 2005-11 2009 2011 2012
ExportersEuropean Union (27) 132035 135684 58.0 13 6 15 3 Extra-EU (27) exports 57104 56442 25.1 18 10 14 -1India a 43634 47323 19.2 18 24 8 8United States 15501 ... 6.8 9 2 11 ...China 12182 14454 5.4 37 42 32 19Israel b 9529 11329 4.2 13 12 23 19Canada 6993 ... 3.1 12 17 4 ...Philippines b 2381 2036 1.0 73 10 23 -14Argentina 1790 1826 0.8 40 27 34 2Malaysia b 1770 1990 0.8 26 -1 23 12Russian Federation 1753 2088 0.8 27 5 29 19
Above 10 227565 ... 100.0 - - - -Importers
European Union (27) 63041 64831 57.1 12 3 10 3 Extra-EU (27) imports 20320 22307 18.4 11 2 4 10United States 24538 ... 22.2 15 16 16 ...Japan 4218 4496 3.8 10 -5 18 7Brazil 4036 4447 3.7 15 25 15 10China 3844 3843 3.5 15 -8 30 0Canada 3184 ... 2.9 10 0 10 ...Russian Federation 2433 2651 2.2 31 32 29 9India 1856 2497 1.7 7 12 -27 35Norway 1712 1731 1.5 ... ... 2 1Australia 1635 1575 1.5 13 17 11 -4
Above 10 110495 ... 100.0 - - - -
b Computer services.: Based on information available to the Secretariat. As certain economies do not report this item, they may not appear in the list. For more information on asymmetries, see the Metadata.
ValueShare in 10 economies Annual percentage change
Table III.26
Major exporters and importers of computer and information services, 2011 and 2012
(Million dollars and percentage)
a Secretariat estimate based on data reported on computer services by the Reserve Bank of India. It excludes estimates for Information Technology Enabled Services (ITES) and Business Process Outsourcing Services (BPO), (source: RBI, Survey on Computer Software & Information Technology Services Exports, various issues), which have been included under other business services.
168 World Trade OrganizationInternational Trade Statistics 2013
Download the data:www.wto.org/statistics

Table III.27
(Million dollars and percentage)
Value Share Value Share
2011 2011 2005-11 2010 2011 2011 2011 2005-11 2010 2011
European Union (27) United StatesWorld 132035 100.0 13 6 15 World 15501 100.0 9 2 11European Union (27) 74932 56.8 11 3 15 European Union (27) 6649 42.9 ... 1 10United States 12354 9.4 7 8 15 Canada 1576 10.2 ... -2 -2Switzerland 8917 6.8 14 3 -2 Japan 1049 6.8 ... -5 7Japan 3080 2.3 23 27 31 Switzerland 887 5.7 ... -6 20India 2286 1.7 47 -1 -4 Australia 805 5.2 ... 17 11
Above 5 101568 76.9 - - - Above 5 10966 70.7 - - -Russian Federation 2212 1.7 18 22 6 Singapore 431 2.8 ... 7 45China 2166 1.6 44 -22 12 China 370 2.4 ... 16 45Norway 2098 1.6 17 -5 39 India 311 2.0 ... 11 17Australia 1616 1.2 25 3 20 Mexico 306 2.0 ... -3 18Canada 1307 1.0 16 11 62 Brazil 277 1.8 ... -27 7South Africa 1156 0.9 13 19 -6 Hong Kong, China 256 1.7 ... 19 11Brazil 904 0.7 27 -1 19 Korea, Republic of 222 1.4 ... -10 79Israel 865 0.7 18 9 32 South Africa 201 1.3 ... -2 19Chinese Taipei 744 0.6 46 21 10 Saudi Arabia, Kingdom of 174 1.1 ... 11 19Turkey 660 0.5 21 -4 -1 Chinese Taipei 111 0.7 ... 9 37
Above 15 115295 87.3 - - - Above 15 13625 87.9 - - -Russian Federation a Norway
World 1753 100.0 27 5 29 World 1353 100.0 ... ... -55United States 689 39.3 32 1 49 European Union (27) 961 71.0 ... ... -54European Union (27) 655 37.4 25 6 9 United States 154 11.4 ... ... -50Kazakhstan 68 3.9 46 21 64 Switzerland 29 2.2 ... ... -35British Virgin Islands 65 3.7 45 41 56 Japan 22 1.6 ... ... -75Switzerland 60 3.4 11 81 15 Canada 10 0.7 ... ... -51
Above 5 1536 87.7 - - - Above 5 1176 86.9 - - -Japan Hong Kong, China
World 1198 100.0 1 21 15 World 946 100.0 24 30 7United States 619 51.6 -2 18 24 China 547 57.9 ... 55 9European Union (27) 174 14.5 ... -10 5 United States 184 19.5 ... 26 -10Switzerland 137 11.5 26 174 -10 Japan 110 11.6 ... -3 117Singapore 57 4.8 -10 0 53 Chinese Taipei 62 6.6 ... 15 33Hong Kong, China 46 3.9 34 97 18
Above 5 1033 86.2 - - - Above 4 904 95.6 - - -
Exports of computer and information services of selected economies by destination, 2011
Annual percentage change
Annual percentage change
a In 2011, computer and information services not allocated geographically accounted for 1 per cent of exports.
169World Trade OrganizationInternational Trade Statistics 2013
Download the data:www.wto.org/statistics
III TRA
DE
IN C
OM
ME
RC
IAL
SE
RV
ICE
S

4.5.1 Computer services
2011 2012 2011 2005-11 2010 2011 2012
ExportersEuropean Union (27) 120267 ... 60.5 14 7 16 ... Extra-EU (27) exports 50442 ... 25.4 19 13 19 ...India a 43459 47134 21.9 18 24 10 8United States 10110 ... 5.1 19 1 14 ...Israel 9529 11329 4.8 13 12 23 19Canada 6110 ... 3.1 12 16 4 ...Philippines 2381 2036 1.2 73 10 23 -14Argentina 1786 1822 0.9 40 27 34 2Malaysia 1770 1990 0.9 26 -1 23 12Russian Federation 1666 1995 0.8 28 5 31 20Costa Rica 1566 1852 0.8 35 60 29 18
Above 10 198645 ... 100.0 - - - -Importers
European Union (27) 57982 ... 61.0 12 3 12 ... Extra-EU (27) imports 18481 ... 19.4 11 2 6 ...United States 22635 ... 23.8 50 15 16 ...Brazil 3931 4337 4.1 15 26 15 10Russian Federation 2144 2313 2.3 34 35 30 8Canada 2085 ... 2.2 9 -2 10 ...Norway 1707 ... 1.8 7 7 2 ...Australia 1568 1517 1.6 14 15 11 -3India 1252 2096 1.3 3 35 -42 67Malaysia 1199 1453 1.3 21 -12 13 21Argentina 553 678 0.6 19 4 28 23
Above 10 95055 ... 100.0 - - - -
: Based on information available to the Secretariat. As certain major traders in computer and information services do not report the item computer services separately, they may not appear in the list. For more information on asymmetries, see the Metadata.
ValueShare in 10 economies Annual percentage change
Table III.28
Major exporters and importers of computer services, 2011 and 2012
(Million dollars and percentage)
a Secretariat estimate based on data reported on computer services by the Reserve Bank of India. It excludes estimates for Information Technology Enabled Services (ITES) and Business Process Outsourcing Services (BPO), (source: RBI, Survey on Computer Software & Information Technology Services Exports, various issues), which have been included under other business services.
170 World Trade OrganizationInternational Trade Statistics 2013
Download the data:www.wto.org/statistics

Table III.29
(Million dollars and percentage)
Value Share Value Share
2011 2011 2005-11 2010 2011 2011 2011 2005-11 2010 2011
European Union (27) United StatesWorld 120267 100.0 14 7 16 World 10110 100.0 19 1 14European Union (27) 69825 58.1 11 3 15 European Union (27) 4274 42.3 ... -4 13United States 10830 9.0 6 8 21 Canada 1062 10.5 ... 6 -1Switzerland 5621 4.7 18 17 17 Switzerland 733 7.3 ... -7 27Japan 2850 2.4 23 30 33 Japan 536 5.3 ... -12 15India 2245 1.9 47 -1 -5 Australia 475 4.7 ... 20 16
Above 5 91372 76.0 - - - Above 5 7080 70.0 - - -Russian Federation 2153 1.8 18 21 6 Singapore 387 3.8 ... 18 50China 2086 1.7 44 -24 13 China 290 2.9 ... 13 49Norway 1968 1.6 17 -6 42 Brazil 223 2.2 ... -20 10Australia 1547 1.3 28 4 20 Mexico 209 2.1 ... 2 22South Africa 1074 0.9 12 20 -7 India 167 1.7 ... 4 18Brazil 885 0.7 27 -2 20 Hong Kong, China 134 1.3 ... -4 44Israel 827 0.7 19 10 30 South Africa 124 1.2 ... -3 13Canada 825 0.7 18 9 13 Korea, Republic of 109 1.1 ... -29 51Chinese Taipei 712 0.6 46 23 10 Malaysia 90 0.9 ... 23 14Turkey 612 0.5 22 -3 0 Thailand 84 0.8 ... 18 15
Above 15 104060 86.5 - - - Above 15 8897 88.0 - - -Russian Federation
World 1666 100.0 28 5 31United States 677 40.6 32 0 52European Union (27) 615 36.9 27 5 11British Virgin Islands 63 3.8 56 45 58Kazakhstan 57 3.4 45 25 48Switzerland 55 3.3 10 89 13
Above 5 1467 88.0 - - -
Exports of computer services of selected economies by destination, 2011
Annual percentage change
Annual percentage change
171World Trade OrganizationInternational Trade Statistics 2013
Download the data:www.wto.org/statistics
III TRA
DE
IN C
OM
ME
RC
IAL
SE
RV
ICE
S

4.6 Royalties and licence fees
2011 2012 2011 2005-11 2010 2011 2012
ExportersUnited States a 120836 124303 42.6 8 9 13 3European Union (27) 102730 96682 36.2 13 3 14 -6 Extra-EU (27) exports 54130 50485 19.1 11 8 21 -7Japan 29058 31846 10.2 9 23 9 10Switzerland 19523 ... 6.9 15 11 18 ...Korea, Republic of 4336 3436 1.5 15 -2 38 -21Canada 2911 3583 1.0 1 -22 3 23Singapore 1637 1649 0.6 ... 16 68 1Israel 1100 1146 0.4 11 11 29 4Australia 919 854 0.3 9 25 -1 -7Chinese Taipei 838 932 0.3 24 90 82 11
Above 10 283890 ... 100.0 - - - -Importers
European Union (27) 123174 117792 47.2 12 0 9 -4 Extra-EU (27) imports 63403 59892 24.3 8 -1 8 -6United States a 36620 41992 14.0 6 7 10 15Switzerland 21697 ... 8.3 19 15 31 ...Japan 19158 19919 7.3 5 12 2 4Singapore 16391 16511 6.3 ... 19 17 1China 14706 17749 5.6 18 18 13 21Canada 10352 10563 4.0 7 9 6 2Korea, Republic of 7295 8387 2.8 8 26 -19 15Russian Federation 5830 7629 2.2 24 21 20 31Chinese Taipei 5788 4549 2.2 22 44 17 -21
Above 10 261010 ... 100.0 - - - -
: Based on information available to the Secretariat. For more information on asymmetries, see the Metadata.
Annual percentage change
(Million dollars and percentage)
Table III.31
Major economies for receipts and payments of royalties and licence fees, 2011 and 2012
ValueShare in 10 economies
a The U.S. Bureau of Economic Analysis moved film and television tape distribution services from audiovisual and related services to royalties and licence fees.
Table III.30
World receipts of royalties and licence fees by region, 2011 and 2012
(Billion dollars and percentage)
2011 2012 2005 2012 2005-12 2011 2012
ExportsWorld 290 290 100.0 100.0 9 14 0North America 124 128 48.4 44.2 7 13 3South and Central America 1 1 0.4 0.5 14 27 0Europe 123 116 36.5 40.2 10 14 -5
European Union (27) 103 97 30.6 33.4 10 14 -6Commonwealth of Independent States (CIS) 1 1 0.2 0.3 16 30 18Africa 0 0 0.2 0.1 2 -16 8Middle East 1 1 0.4 0.4 10 31 4Asia 39 41 14.0 14.3 9 14 6
Annual percentage changeShareValue
172 World Trade OrganizationInternational Trade Statistics 2013
Download the data:www.wto.org/statistics

Table III.32
(Million dollars and percentage)
Value Share Value Share
2011 2011 2005-11 2010 2011 2011 2011 2005-11 2010 2011
United States European Union (27)World 120836 100.0 8 9 13 World 102730 100.0 13 3 14European Union (27) 48907 40.5 ... -9 13 European Union (27) 48601 47.3 16 -1 7Japan 10653 8.8 1 24 0 United States 19319 18.8 7 2 29Canada 9589 7.9 10 22 16 Singapore 7117 6.9 13 28 32Switzerland 9125 7.6 9 13 10 Switzerland 4225 4.1 7 -16 8Chinese Taipei 5146 4.3 24 119 18 Japan 3130 3.0 3 18 7
Above 5 83420 69.0 - - - Above 5 82392 80.2 - - -Korea, Republic of 4532 3.8 12 22 15 China 2997 2.9 17 23 15China 4114 3.4 23 52 23 Brazil 1829 1.8 41 18 24Singapore 3822 3.2 7 88 0 Korea, Republic of 1686 1.6 20 37 15Brazil 3743 3.1 24 36 21 Canada 1438 1.4 19 62 -5Bermuda 3406 2.8 26 11 11 Russian Federation 1207 1.2 28 16 43Australia 3314 2.7 13 3 24 Australia 1081 1.1 15 -1 48Mexico 2769 2.3 9 12 9 Chinese Taipei 733 0.7 18 75 17Argentina 837 0.7 24 38 42 Norway 725 0.7 7 -1 25South Africa 821 0.7 13 0 21 Mexico 640 0.6 9 8 17India 676 0.6 20 -15 -3 South Africa 594 0.6 6 31 -1
Above 15 111454 92.2 - - - Above 15 95323 92.8 - - -Japan Korea, Republic of
World 29058 100.0 9 23 9 World 4336 100.0 15 -2 38United States 10607 36.5 6 24 4 United States 1549 35.7 13 -37 97European Union (27) 4352 15.0 ... 5 11 China 1271 29.3 17 19 18China 3149 10.8 22 17 10 European Union (27) 494 11.4 23 25 8Thailand 2326 8.0 14 36 18 Japan 198 4.6 4 28 17Chinese Taipei 1250 4.3 15 26 19 India 150 3.5 29 -9 28
Above 5 21683 74.6 - - - Above 5 3662 84.5 - - -Singapore Australia a
World 1637 100.0 ... 16 68 World 919 100.0 9 25 -1Australia 446 27.2 ... 66 435 United States 393 42.7 13 31 -16China 329 20.1 ... 30 36 European Union (27) 107 11.7 -6 6 -21Japan 205 12.5 ... 41 15 Canada 56 6.1 42 21 79United States 71 4.3 ... ... ... Singapore 54 5.8 69 … 83Hong Kong, China 56 3.4 ... 33 25 Switzerland 41 4.5 41 -4 400
Above 5 1107 67.6 - - - Above 5 651 70.8 - - -Russian Federation b
World 556 100.0 13 1 44European Union (27) 258 46.4 34 -1 77United States 80 14.3 -1 -14 6Kazakhstan 40 7.2 33 112 3Ukraine 30 5.4 23 0 26Belarus 18 3.3 32 16 4
Above 5 426 76.7 - - -
a In 2011, receipts of royalties and licence fees not allocated geographically accounted for 3 per cent of receipts. b In 2011, receipts of royalties and licence fees not allocated geographically accounted for 4 per cent of receipts.
Receipts of royalties and licence fees of selected economies by origin, 2011
Annual percentage change
Annual percentage change
173World Trade OrganizationInternational Trade Statistics 2013
Download the data:www.wto.org/statistics
III TRA
DE
IN C
OM
ME
RC
IAL
SE
RV
ICE
S

2011 2012 2011 2005-11 2010 2011 2012
ExportersEuropean Union (27) 541280 532621 57.7 9 4 13 -2 Extra-EU (27) exports 254182 258690 27.1 9 1 14 2United States 117175 127248 12.5 10 9 4 9China 58270 66623 6.2 17 14 12 14Japan 45367 37603 4.8 9 0 7 -17Hong Kong, China 39573 ... 4.2 8 16 13 ...India a 39524 45009 4.2 13 28 13 14Canada 26461 24978 2.8 10 10 7 -6Switzerland b 25621 ... 2.7 24 34 16 ...Singapore c 23469 24223 2.5 ... 10 21 3Chinese Taipei 21298 23014 2.3 10 18 13 8
Above 10 938040 ... 100.0 - - - -Importers
European Union (27) 466419 462425 59.6 8 0 13 -1 Extra-EU (27) imports 187611 186300 24.0 10 -2 14 -1United States 78192 81622 10.0 14 7 16 4Japan 45889 46509 5.9 10 1 17 1China 39620 42354 5.1 16 1 15 7Korea, Republic of 34679 38132 4.4 14 12 14 10Singapore 28736 29580 3.7 18 13 19 3India 25458 30296 3.3 11 51 0 19Brazil 25367 28346 3.2 23 36 22 12Canada 19974 19096 2.6 8 10 8 -4Russian Federation 18565 19875 2.4 19 9 19 7
Above 10 782900 798235 100.0 - - - -
Table III.34
Major exporters and importers of other business services, 2011 and 2012
(Million dollars and percentage)
a Secretariat estimate. It includes an estimate for Information Technology Enabled Services (ITES) and Business Process Outsourcing Services (BPO) which are classified under "software" by the Reserve Bank of India (source: RBI, Survey on Computer Software & Information Technology Services Exports, various issues).
: Based on information available to the Secretariat. For more information on asymmetries, see the Metadata.
Annual percentage changeShare in 10 economiesValue
b Covers construction and computer and information services.c Does not include merchanting.
Table III.33
World exports of other business services by region, 2011 and 2012
(Billion dollars and percentage)
2011 2012 2005 2012 2005-12 2011 2012
ExportsWorld 1100 1125 100.0 100.0 9 13 3North America 144 153 13.6 13.5 9 4 6South and Central America 42 44 2.5 3.9 16 37 4Europe 578 569 55.0 50.5 8 13 -1
European Union (27) 541 533 52.6 47.3 8 13 -2Commonwealth of Independent States (CIS) 22 23 1.2 2.1 18 24 8Africa 10 10 1.0 0.9 8 0 4Middle East 15 20 ... 1.8 ... 56 39Asia 288 307 25.2 27.2 10 13 7
Annual percentage changeShareValue
4.7 Other business services
174 World Trade OrganizationInternational Trade Statistics 2013
Download the data:www.wto.org/statistics

Table III.35
(Million dollars and percentage)
Value Share Value Share
2011 2011 2005-11 2010 2011 2011 2011 2005-11 2010 2011
European Union (27) Japan a World 541280 100.0 9 4 13 World 45367 100.0 9 0 7European Union (27) 287097 53.0 9 8 13 European Union (27) 17519 38.6 ... -8 0United States 61590 11.4 6 1 12 United States 11676 25.7 4 -6 -24Switzerland 47120 8.7 12 3 17 Singapore 11034 24.3 22 25 25China 11982 2.2 15 24 19 Chinese Taipei 7252 16.0 22 58 141Japan 7674 1.4 3 -17 47 China 1217 2.7 -6 1 …
Above 5 415463 76.8 - - - Above 5 48697 107.3 - - -Singapore 6517 1.2 18 11 22 Australia 859 1.9 6 -22 18Norway 5869 1.1 7 -13 9 Switzerland 747 1.6 13 5 -20Russian Federation 5490 1.0 5 16 -29 India 726 1.6 28 85 -4Canada 4900 0.9 16 -5 43 Canada 714 1.6 9 -12 -22Turkey 4265 0.8 18 11 37 Malaysia 593 1.3 ... … …Hong Kong, China 4165 0.8 0 18 6 Brazil 431 1.0 32 31 5India 4134 0.8 15 -4 18 Indonesia 240 0.5 10 … -67Australia 4058 0.7 17 8 3 Cayman Islands 218 0.5 12 5 29Korea, Republic of 4052 0.7 9 24 23 Hong Kong, China 101 0.2 ... … …Nigeria 3649 0.7 12 -1 49 New Zealand 83 0.2 -11 0 -18
Above 15 462561 85.5 - - - Above 15 53411 117.7 - - -Hong Kong, China Singapore b, c
World 39573 100.0 8 16 13 World 23469 100.0 ... 10 21United States 3855 9.7 ... 5 -3 European Union (27) 5262 22.4 ... 4 23China 1871 4.7 ... 13 4 United States 4493 19.1 ... 15 18Japan 430 1.1 ... 30 -11 Australia 2349 10.0 ... 70 23Chinese Taipei 272 0.7 ... 13 36 Japan 1396 6.0 ... 7 41
Hong Kong, China 1357 5.8 ... 29 9Above 4 6428 16.2 - - - Above 5 14858 63.3 - - -Korea, Republic of Russian Federation d
World 18464 100.0 12 39 10 World 15859 100.0 20 9 28United States 5798 31.4 10 52 18 European Union (27) 7258 45.8 19 5 29Japan 2664 14.4 8 37 -1 United States 2253 14.2 21 0 12European Union (27) 2523 13.7 5 20 11 Switzerland 1104 7.0 26 19 43China 2049 11.1 40 70 31 Kazakhstan 424 2.7 16 36 1Hong Kong, China 991 5.4 10 69 -11 British Virgin Islands 386 2.4 14 5 6
Above 5 14025 76.0 - - - Above 5 11426 72.0 - - -Norway Australia e
World 13245 100.0 ... ... 7 World 7592 100.0 14 17 10European Union (27) 6212 46.9 ... ... 19 United States 1934 25.5 12 17 26United States 1335 10.1 ... ... 15 European Union (27) 1112 14.6 14 24 10Brazil 413 3.1 ... ... -27 Singapore 1083 14.3 20 -12 60China 370 2.8 ... ... 86 New Zealand 400 5.3 12 9 23Switzerland 298 2.2 ... ... 44 Pitcairn 393 5.2 ... 109 21
Above 5 8627 65.1 - - - Above 5 4922 64.8 - - -
a In 2011, exports of other business services are counterbalanced by negative values for merchanting for the Republic of Korea, United Arab Emirates and several other economies.b Does not include merchanting.c In 2011, ASEAN countries accounted for 12 per cent of other business services exports.d In 2011, other business services not allocated geographically accounted for 2 per cent of exports.e In 2011, other business services not allocated geographically accounted for 9 per cent of exports.
Exports of other business services of selected economies by destination, 2011
Annual percentage change
Annual percentage change
175World Trade OrganizationInternational Trade Statistics 2013
Download the data:www.wto.org/statistics
III TRA
DE
IN C
OM
ME
RC
IAL
SE
RV
ICE
S

Value
Total
Legal, accounting, management
and public relations
Advertising, market
research and public
opinion polling
Research and development
Architectural, engineering and other technical services
Agricultural, mining and
other on-site processing
services Other a
Exporters European Union (27) 541280 24.2 3.8 72.0 14.9 6.5 9.6 9.9 2.1 29.0
Extra-EU (27) exports 254182 23.0 4.3 72.7 14.4 5.7 11.3 12.5 2.9 25.8United States b 117175 3.6 6.1 90.3 34.6 3.6 19.9 7.1 2.2 23.0China 58270 44.4 … 55.6 48.7 6.9 … … … …Japan 45367 52.6 7.8 39.6 … … 9.3 … … …Hong Kong, China 39573 83.1 0.1 16.8 10.2 1.9 … 1.2 … …Canada 26461 7.1 2.5 90.5 39.3 3.8 16.7 19.5 0.7 10.5Singapore c 23469 16.2 … 83.8 53.2 5.6 2.3 10.3 … 12.4Brazil 19675 6.4 0.3 93.2 15.7 3.0 2.3 37.4 0.2 34.6Korea, Republic of 18464 41.6 4.1 54.3 6.2 1.9 1.9 3.1 0.2 41.0Russian Federation 15859 7.0 8.4 84.5 17.9 23.2 2.6 22.6 4.6 13.7Lebanon 8974 8.5 … 91.5 3.5 2.2 0.3 4.6 0.1 80.7Argentina 5178 2.8 4.0 93.1 48.6 11.9 9.1 8.6 … 14.9Algeria 2130 … 0.6 99.4 0.6 4.4 … 8.1 0.0 86.2Morocco 2065 2.7 … 97.3 … 7.7 … … … 89.6New Zealand 1289 19.7 1.3 78.9 18.1 4.3 7.3 9.6 0.6 39.0Croatia 1218 11.0 2.8 86.1 12.9 25.5 9.5 30.3 5.2 2.8Serbia 1191 6.6 0.6 92.9 17.8 19.8 5.5 9.6 0.1 40.1Mauritius 876 25.2 0.1 74.7 … … … … … …Costa Rica 818 30.5 2.5 67.0 45.7 0.2 1.2 0.0 … 19.8Pakistan 765 3.9 0.7 95.5 14.3 2.8 0.9 3.6 … 73.8ImportersEuropean Union (27) 466419 12.6 4.1 83.2 15.4 8.9 13.1 8.2 1.2 36.4
Extra-EU (27) imports 187611 13.0 4.7 82.3 14.8 9.2 15.4 7.0 0.9 35.0United States b 78192 2.0 2.5 95.5 36.9 3.7 28.6 1.9 1.1 23.3Japan 45889 27.0 1.1 71.9 … … 23.2 … … …China 39620 46.1 … 53.9 46.9 7.0 … … … …Korea, Republic of 34679 35.7 3.7 60.5 6.3 11.0 5.1 2.5 0.2 35.5Singapore 28736 20.2 … 79.8 37.2 6.3 11.6 5.4 … 19.3Brazil 25367 3.8 66.0 30.1 3.8 3.0 0.1 17.8 0.0 5.5Canada 19974 4.1 6.4 89.5 45.5 3.9 6.5 17.9 2.0 13.7Russian Federation 18565 … 19.6 80.4 19.6 8.2 0.6 25.8 13.4 12.8Hong Kong, China 10680 39.9 17.9 42.2 27.4 4.8 … 3.0 … …Algeria 5564 … 0.3 99.7 0.0 0.2 … 96.0 0.0 3.4Lebanon 5058 17.0 … 83.0 9.9 1.2 0.5 4.1 0.5 66.9Kazakhstan 4181 0.4 11.8 87.8 11.2 0.5 2.7 50.2 18.7 4.5Argentina 3161 6.4 18.4 75.2 33.4 3.9 1.2 13.5 5.2 18.0Venezuela, Bolivarian Rep. of d 2622 … 29.8 70.2 46.2 0.1 … 18.5 0.2 5.3Colombia 2258 10.3 12.9 76.9 8.4 2.5 … 56.9 … 9.0Azerbaijan 2157 0.7 0.6 98.6 3.4 0.5 0.1 … … 94.7New Zealand 2077 6.8 14.6 78.6 16.1 10.3 2.0 12.4 1.9 35.8Egypt 1965 … … 100.0 8.3 … … … … 91.7Turkey 1727 3.1 15.1 81.9 2.3 4.9 … 0.5 … 74.2
Operational leasing services
Miscellaneous business, professional and technical services
d May cover transactions belonging to other services items.
a Covers other services not included elsewhere as well as services between related enterprises n.i.e.b Market research and public opinion polling are included in "other".c Does not include merchanting.
: Based on information available to the Secretariat. See the Metadata.
Table III.36
Trade in other business services by category in selected economies, 2011
(Million dollars and percentage)
Share
Total other business services
Merchanting and other trade-
related services
176 World Trade OrganizationInternational Trade Statistics 2013
Download the data:www.wto.org/statistics
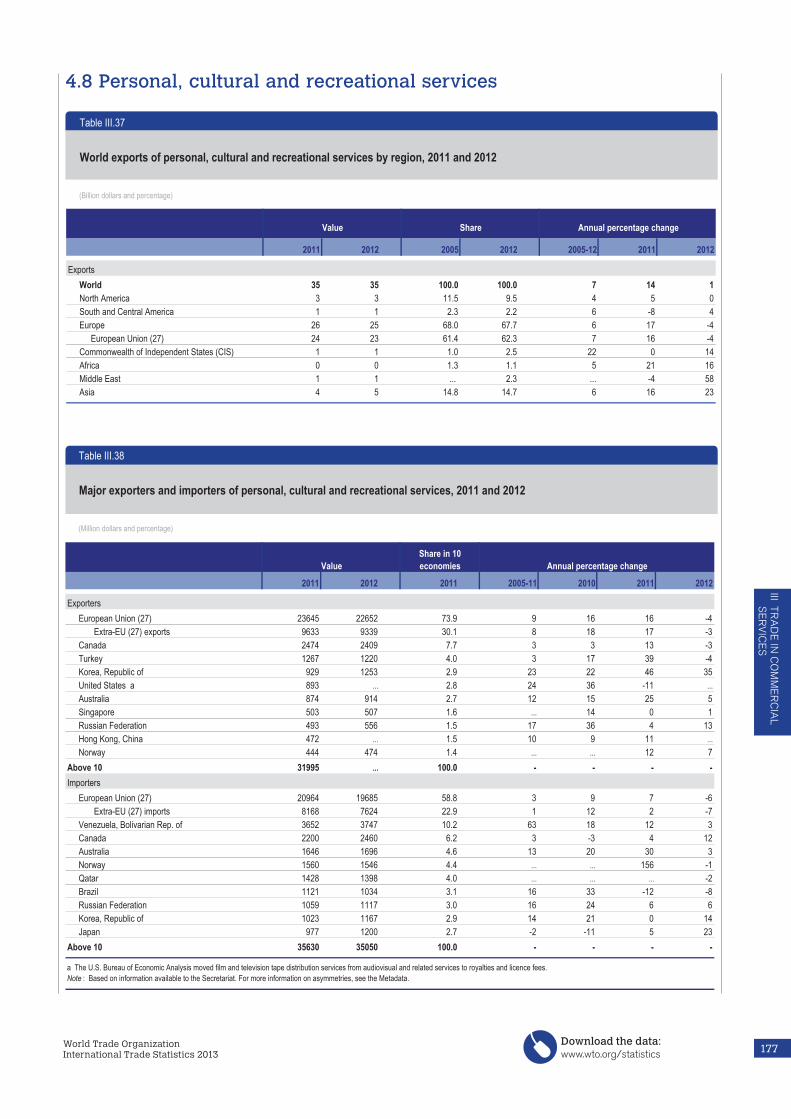
4.8 Personal, cultural and recreational services
2011 2012 2011 2005-11 2010 2011 2012
ExportersEuropean Union (27) 23645 22652 73.9 9 16 16 -4 Extra-EU (27) exports 9633 9339 30.1 8 18 17 -3Canada 2474 2409 7.7 3 3 13 -3Turkey 1267 1220 4.0 3 17 39 -4Korea, Republic of 929 1253 2.9 23 22 46 35United States a 893 ... 2.8 24 36 -11 ...Australia 874 914 2.7 12 15 25 5Singapore 503 507 1.6 ... 14 0 1Russian Federation 493 556 1.5 17 36 4 13Hong Kong, China 472 ... 1.5 10 9 11 ...Norway 444 474 1.4 ... ... 12 7
Above 10 31995 ... 100.0 - - - -Importers
European Union (27) 20964 19685 58.8 3 9 7 -6 Extra-EU (27) imports 8168 7624 22.9 1 12 2 -7Venezuela, Bolivarian Rep. of 3652 3747 10.2 63 18 12 3Canada 2200 2460 6.2 3 -3 4 12Australia 1646 1696 4.6 13 20 30 3Norway 1560 1546 4.4 ... ... 156 -1Qatar 1428 1398 4.0 ... ... ... -2Brazil 1121 1034 3.1 16 33 -12 -8Russian Federation 1059 1117 3.0 16 24 6 6Korea, Republic of 1023 1167 2.9 14 21 0 14Japan 977 1200 2.7 -2 -11 5 23
Above 10 35630 35050 100.0 - - - -
: Based on information available to the Secretariat. For more information on asymmetries, see the Metadata.
Annual percentage change
(Million dollars and percentage)
a The U.S. Bureau of Economic Analysis moved film and television tape distribution services from audiovisual and related services to royalties and licence fees.
Table III.38
Major exporters and importers of personal, cultural and recreational services, 2011 and 2012
ValueShare in 10 economies
Table III.37
World exports of personal, cultural and recreational services by region, 2011 and 2012
(Billion dollars and percentage)
2011 2012 2005 2012 2005-12 2011 2012
ExportsWorld 35 35 100.0 100.0 7 14 1North America 3 3 11.5 9.5 4 5 0South and Central America 1 1 2.3 2.2 6 -8 4Europe 26 25 68.0 67.7 6 17 -4
European Union (27) 24 23 61.4 62.3 7 16 -4Commonwealth of Independent States (CIS) 1 1 1.0 2.5 22 0 14Africa 0 0 1.3 1.1 5 21 16Middle East 1 1 ... 2.3 ... -4 58Asia 4 5 14.8 14.7 6 16 23
Annual percentage changeShareValue
177World Trade OrganizationInternational Trade Statistics 2013
Download the data:www.wto.org/statistics
III TRA
DE
IN C
OM
ME
RC
IAL
SE
RV
ICE
S

Table III.39
(Million dollars and percentage)
Value Share Value Share
2011 2011 2005-11 2010 2011 2011 2011 2005-11 2010 2011
European Union (27) Australia aWorld 23645 100.0 9 16 16 World 874 100.0 12 15 25European Union (27) 14014 59.3 9 15 16 European Union (27) 144 16.5 9 27 41United States 2786 11.8 3 23 3 Singapore 85 9.7 20 5 36Switzerland 1690 7.1 7 8 19 New Zealand 73 8.4 11 28 27Russian Federation 442 1.9 24 37 131 China 52 5.9 15 31 17Japan 413 1.7 -7 8 -8 United States 35 4.0 -14 -4 -4
Above 5 19345 81.8 - - - Above 5 389 44.5 - - -Norway 362 1.5 3 19 8 Malaysia 31 3.5 24 18 16Australia 229 1.0 -1 -6 104 Switzerland 20 2.2 ... 18 137Brazil 218 0.9 15 17 14 Canada 18 2.0 29 18 27China 190 0.8 36 -21 53 Pitcairn 18 2.0 ... -3 -40South Africa 169 0.7 19 23 19 Japan 15 1.8 -4 -22 -6Turkey 165 0.7 32 36 53 Hong Kong, China 12 1.4 -11 8 -39Singapore 127 0.5 5 -40 4 Indonesia 12 1.4 ... 6 50Korea, Republic of 126 0.5 18 100 -7 Norway 12 1.4 ... 229 -4Canada 109 0.5 8 25 12 India 9 1.1 16 -82 237Malaysia 104 0.4 38 98 46 Fiji 7 0.8 45 65 12
Above 15 21144 89.4 - - - Above 15 544 62.2 - - -Singapore Russian Federation
World 503 100.0 ... 14 0 World 493 100.0 17 36 4India 165 32.7 ... 26 10 European Union (27) 207 42.0 17 27 6United States 30 5.9 ... ... ... Switzerland 103 20.9 47 53 57European Union (27) 27 5.4 ... 94 -33 United States 37 7.6 13 -36 4China 21 4.2 ... -26 35 British Virgin Islands 32 6.4 26 … -45
Kazakhstan 24 4.9 17 17 -14Above 4 242 48.1 - - - Above 5 403 81.8 - - -Hong Kong, China Norway
World 472 100.0 10 9 11 World 444 100.0 ... ... 12China 383 81.0 ... 22 17 European Union (27) 421 95.0 ... ... 49United States 19 4.1 ... 94 32 United States 11 2.5 ... ... 180Japan 2 0.5 ... -57 -49 Switzerland 1 0.3 ... ... -82Chinese Taipei 1 0.2 ... -27 -25 China 1 0.3 ... ... ...
Above 4 405 85.8 - - - Above 4 435 98.1 - - -
Exports of personal, cultural and recreational services of selected economies by destination, 2011
Annual percentage change
Annual percentage change
a In 2011, personal, cultural and recreational services not allocated geographically accounted for 25 per cent of exports.
178 World Trade OrganizationInternational Trade Statistics 2013
Download the data:www.wto.org/statistics

4.8.1 Audiovisual services
2011 2012 2011 2005-11 2010 2011 2012
ExportersEuropean Union (27) 12749 ... 76.8 5 13 15 ... Extra-EU (27) exports 5161 ... 31.1 3 13 13 ...Canada 2129 ... 12.8 2 -5 14 ...Argentina 331 322 2.0 9 9 10 -3Russian Federation 310 314 1.9 16 39 -14 1Korea, Republic of 271 359 1.6 13 -5 44 32Norway 238 ... 1.4 4 -17 12 ...Australia 200 191 1.2 8 20 56 -4India 139 289 0.8 ... ... -40 108China 123 126 0.7 -1 26 0 2Hong Kong, China 110 ... 0.7 -12 -2 -1 ...
Above 10 16600 ... 100.0 - - - -Importers
European Union (27) 14290 ... 63.9 1 12 7 ... Extra-EU (27) imports 5842 ... 26.1 -2 15 3 ...Canada 1983 ... 8.9 3 5 2 ...Australia 1335 1374 6.0 15 15 29 3Brazil 1043 965 4.7 22 32 9 -8Russian Federation 875 817 3.9 15 18 3 -7Norway 842 ... 3.8 17 6 155 ...Japan 804 ... 3.6 -2 -10 10 ...Argentina 451 474 2.0 18 34 21 5China 400 564 1.8 17 33 8 41Korea, Republic of 330 357 1.5 13 12 -8 8
Above 10 22355 ... 100.0 - - - -
: Based on information available to the Secretariat. As certain major traders in personal, cultural and recreational services do not report the item audiovisual and related services separately, they may not appear in the list. The Unites States no longer appears in this table as the U.S. Bureau of Economic Analysis moved film and television tape distribution services from audiovisual and related services to royalties and licence fees. See the Metadata.
Annual percentage change
(Million dollars and percentage)
Table III.40
Major exporters and importers of audio-visual and related services, 2011 and 2012
ValueShare in 10 economies
179World Trade OrganizationInternational Trade Statistics 2013
Download the data:www.wto.org/statistics
III TRA
DE
IN C
OM
ME
RC
IAL
SE
RV
ICE
S

Table III.41
(Million dollars and percentage)
Value Share Value Share
2011 2011 2005-11 2010 2011 2011 2011 2005-11 2010 2011
European Union (27) Russian FederationWorld 12749 100.0 5 13 15 World 310 100.0 16 39 -14European Union (27) 7589 59.5 6 13 16 European Union (27) 146 47.0 17 30 -14United States 1924 15.1 0 -7 27 Switzerland 35 11.2 55 … 16Switzerland 883 6.9 6 37 20 British Virgin Islands 28 9.0 56 … -49Japan 306 2.4 -10 9 -10 United States 25 8.1 14 -44 -12Brazil 184 1.4 13 12 21 Kazakhstan 17 5.5 13 2 -28
Above 5 10887 85.4 - - - Above 5 251 80.8 - - -Norway 133 1.0 -10 0 -2 Ukraine 13 4.3 11 -16 9South Africa 132 1.0 24 33 7 Belarus 13 4.2 14 23 -21Korea, Republic of 101 0.8 16 104 -21 United Arab Emirates 8 2.5 365 … 62Australia 98 0.8 -12 -11 67 Azerbaijan 5 1.8 99 -34 485Russian Federation 92 0.7 20 22 18 Canada 2 0.7 103 58 71Malaysia 59 0.5 61 314 -1 Moldova 2 0.7 35 3 -12Singapore 58 0.5 2 -58 -8 San Marino 2 0.7 ... 67 71Turkey 46 0.4 19 15 30 Israel 2 0.6 26 8 -7Hong Kong, China 43 0.3 1 46 53 Singapore 2 0.6 ... 348 4China 28 0.2 27 -45 -36 Japan 2 0.6 3 -50 20
Above 15 11678 91.6 - - - Above 15 302 97.4 - - -
Exports of audiovisual and related services of selected economies by destination, 2011
Annual percentage change
Annual percentage change
180 World Trade OrganizationInternational Trade Statistics 2013
Download the data:www.wto.org/statistics