List of Potential Control Measures for PM 2.5 and Precursors · PDF fileSUBJECT: Lists of...
60
UNITED STATES ENVIRONMENTAL PROTECTION AGENCY RESEARCH TRIANGLE PARK, NC 27711 JUN 7 2007 OFFICE OF AIR QUALITY PLANNING AND STANDARDS MEMORANDUM SUBJECT: Lists of Potential Control Measures for PM 2 .s and Precursors William T. Harnett FROM: Director, Air Quality Policy Division (C504-0 1) TO: Air Division Directors, Regions I- X The attached compilation of PM 2 . 5 -related control measures, which was prepared by OAQPS, OTAQ, OAP and OPAR, is provided to you for your information and for you to share with the States in your regions that you determine would benefit. Please consider that the measures included in the lists have not been peer reviewed, and their appearance on these lists does not constitute EPA endorsement of any specific control measure. Attachment
Transcript of List of Potential Control Measures for PM 2.5 and Precursors · PDF fileSUBJECT: Lists of...

UNITED STATES ENVIRONMENTAL PROTECTION AGENCY
RESEARCH TRIANGLE PARK, NC 27711
JUN 7 2007 OFFICE OF
AIR QUALITY PLANNING AND STANDARDS
MEMORANDUM
SUBJECT: Lists of Potential Control Measures for PM2.s and Precursors
William T. Harnett w~ ~ FROM: Director, Air Quality Policy Division (C504-0 1)
TO: Air Division Directors, Regions I- X
The attached compilation of PM2.5-related control measures, which was prepared by OAQPS, OTAQ, OAP and OPAR, is provided to you for your information and for you to share with the States in your regions that you determine would benefit. Please consider that the measures included in the lists have not been peer reviewed, and their appearance on these lists does not constitute EPA endorsement of any specific control measure.
Attachment
Draft, Version 1.0
Lists of Potential Control Measures
for PM2.5 and Precursors
These informational documents are intended to provide a broad, though not comprehensive, listing of potential emissions reduction measures for direct PM2.5 and precursors. The purpose is primarily to assist states in identifying and evaluating potential measures as States develop plans for attaining the PM2.5 NAAQS. Before examining control measures, an important step for States is to identify the nature of the PM2.5 problem in their areas and the sources contributing to that problem. The severity, nature and sources of the PM2.5 problem vary in each nonattainment area, so the measures that are effective and cost-effective will also vary by area. Similarly, the geographic area in which measures are effectively applied will vary depending on the extent to which pollution sources outside the nonattainment area contribute to the area’s PM2.5 problem. Similarly, the costs of applying a given control measure will have case-specific considerations. While the tables here provide overall control costs and control efficiency estimates derived from the references, there is inherent uncertainty in any estimates of this nature. We do not attempt in these tables to provide any rigorous treatment of these uncertainties, but rather provide the control efficiency and cost estimates as a rough “ballpark” starting point. These documents also do not provide specific emissions monitoring and testing information, such as costs. We encourage the use of source-specific assessments which will be more reliable. This document contains several tabular lists of PM2.5 control measures. For most measures, the tables provide an estimate of the control efficiency and the cost per ton of pollutant reduced. The tables also identify reference sources that the user may wish to consult for more information. In the interest of making the lists as relevant as possible, we have omitted some measures that we believe are already employed by virtually all sources. For example, for direct PM2.5 sources we did not include an encyclopedic listing of add-on controls such as baghouses, electrostatic precipitators, and venturi scrubbers, since these controls are generally well-known and widely implemented. Note that this technical document is focused on identification of measures and does not address mechanisms for implementation, such as whether a measure would be implemented on a mandatory or voluntary basis, or whether state adoption of certain mobile measures on a mandatory basis would be pre-empted or require a fuels waiver under the Clean Air Act. The following control measure lists are included:
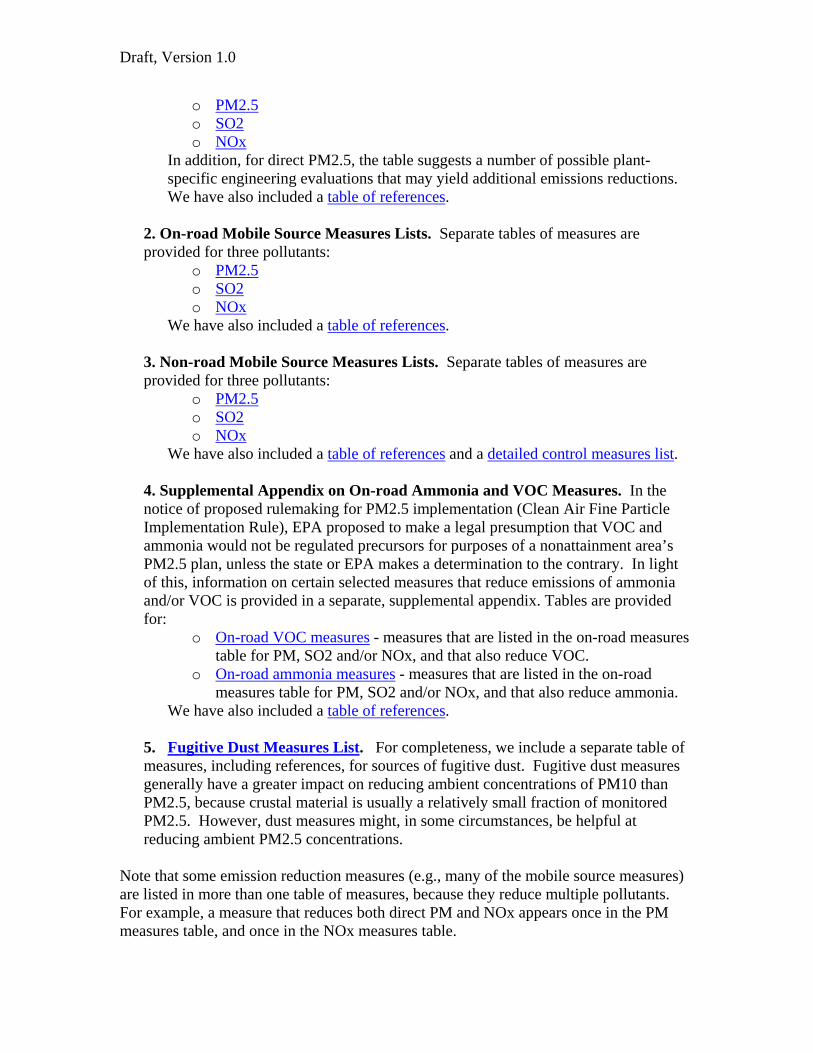
1. Stationary Source Measures Lists. Separate tables of measures are provided for three pollutants:
Draft, Version 1.0
o PM2.5 o SO2 o NOx
In addition, for direct PM2.5, the table suggests a number of possible plant-specific engineering evaluations that may yield additional emissions reductions. We have also included a table of references.
2. On-road Mobile Source Measures Lists. Separate tables of measures are provided for three pollutants:
o PM2.5 o SO2 o NOx
We have also included a table of references.
3. Non-road Mobile Source Measures Lists. Separate tables of measures are provided for three pollutants:
o PM2.5 o SO2 o NOx
We have also included a table of references and a detailed control measures list.
4. Supplemental Appendix on On-road Ammonia and VOC Measures. In the notice of proposed rulemaking for PM2.5 implementation (Clean Air Fine Particle Implementation Rule), EPA proposed to make a legal presumption that VOC and ammonia would not be regulated precursors for purposes of a nonattainment area’s PM2.5 plan, unless the state or EPA makes a determination to the contrary. In light of this, information on certain selected measures that reduce emissions of ammonia and/or VOC is provided in a separate, supplemental appendix. Tables are provided for:
o On-road VOC measures - measures that are listed in the on-road measures table for PM, SO2 and/or NOx, and that also reduce VOC.
o On-road ammonia measures - measures that are listed in the on-road measures table for PM, SO2 and/or NOx, and that also reduce ammonia.
We have also included a table of references.
5. Fugitive Dust Measures List. For completeness, we include a separate table of measures, including references, for sources of fugitive dust. Fugitive dust measures generally have a greater impact on reducing ambient concentrations of PM10 than PM2.5, because crustal material is usually a relatively small fraction of monitored PM2.5. However, dust measures might, in some circumstances, be helpful at reducing ambient PM2.5 concentrations.
Note that some emission reduction measures (e.g., many of the mobile source measures) are listed in more than one table of measures, because they reduce multiple pollutants. For example, a measure that reduces both direct PM and NOx appears once in the PM measures table, and once in the NOx measures table.

Draft, Version 1.0
EPA has developed a website, at http://www.epa.gov/pm/measures.html, intended to provide information on emissions reduction measures and programs for PM2.5 and precursors. It is our intent to include on this website the information in these tables, including weblinks to the references, in the near future. Energy Efficiency and Renewable Energy Measures List. A list currently under development will include energy efficiency and renewable energy measures that can help reduce emissions of PM2.5 and precursors. Agricultural Sources Measures List. Another separate list under development, being coordinated with the Department of Agriculture, will include control measures for agricultural sources, such as diesel engine retrofits and other measures that can help reduce emissions of PM2.5 and precursors.
Improved Source Monitoring. For many of the stationary source measures, it is fundamental to the effectiveness of the measure that implementation include appropriate source monitoring. Effective monitoring to assure ongoing compliance should include periodic emissions testing or other direct measures of compliance, as applicable, and less reliance on generic emissions factors (e.g., from AP-42) for estimating emissions or demonstrating compliance. Moreover, improvements to existing monitoring (e.g., use of fabric filter leak detectors, see EPA-454/R-98-015), or in the frequency of existing monitoring (see Barr and Schaffner, 2003, cited in Stationary Source reference table) will assure that control measures operate within compliance limits and may in fact increase the effectiveness of control measures already in place. Contacts. These documents are a joint effort of EPA’s Office of Air Quality Planning and Standards, Office of Transportation and Air Quality, Office of Atmospheric Programs, and Office of Policy Analysis and Review. Contractor assistance was provided by ICF Consulting and subcontractor E.H. Pechan. We regard these as “living documents” and have labeled them as “Draft” to indicate that as we use these documents, we expect to make ongoing revisions as we receive additional information. We invite users to provide suggestions for additional measures, or additional sources of information on measures, that they believe should be included. Please contact:
Tim Smith, Office of Air Quality Planning and Standards, 919-541-4718, [email protected], (stationary sources)
Rudolph Kapichak, Office of Transportation Air Quality, 734-214-4574 [email protected] (mobile sources)
Sam Waltzer, Office of Atmospheric Programs, 202-343-9175, [email protected] (EGUs) Tom Driscoll, Office of Air Quality Planning and Standards, 919-541-5135 [email protected] (emissions monitoring and testing)

Stationary Source Control Measures for PM2.5See cover note for important notes and caveats on the use of these tables
Draft Version 1.0
Source category Emissions reduction measure Control efficiency (%)
Cost effectiveness($/ton reduced)
Cost Year
Notes/caveats Other pollutants controlled
References for more information
Generally applicable measures All industrial and commercial sources emitting direct PM2.5
Review uncontrolled or under controlled stack sources for improvements
Variable Variable EPA 2002, EPA 1998b, AWMA 2000,STAPPA/ALAPCO 2006, Pechan and RTI 2005a, Pechan and RTI 2005b.
All industrial and commercial sources currently controlling PM with cyclones or multicylones
Upgrade to high-efficiency collection device to collect fine fraction of PM
Variable Variable EPA 1998b, AWMA 2000, EPA 2002
All industrial and commercial sources currently controlled by electrostatic precipitators (ESPs)
Upgrade ESP to improve efficiency on fine fraction of PM, for example by increasing size/SCA, flue gas conditioning, use of hybrid technologies to improve performance, or replacement with fabric filter at time of rebuild.
Variable Variable Pechan and RTI 2005b, EPA 1992, Southern Research Institute 1993.
Industrial process fugitives and open dust fugitive emissions sources
Improve fugitive emissions capture Variable Variable WRAP 2004, STAPPA/ALAPCO 2006
All sources of condensable PM2.5
Evaluate whether can feasibly reduce temperature of gas stream and increase collection of condensables, and whether can collect with wet ESPs, afterburner, or other devices
Variable Variable [We are looking for references on this topic]
Category specific Cement Manufacturing Process equipment vented to
baghouse.
Various controls for open storage piles, primary crushing operations, and conveying systems.
Not Available Not available Process equipment limits:0.01 gr/dscf for existing equipment;0.005 gr/dscf for new equipment
SCAQMD, 2005a
Page 1 of 3

Stationary Source Control Measures for PM2.5See cover note for important notes and caveats on the use of these tables
Draft Version 1.0
Source category Emissions reduction measure Control efficiency (%)
Cost effectiveness($/ton reduced)
Cost Year
Notes/caveats Other pollutants controlled
References for more information
Ferrous Metals Processing - Iron and Steel Production - Blast Furnace Casthouse
Capture Hood Vented to a Baghouse
85 Not available Based on engineering judgments and data which for some plants may be outdated.
EPA 2006a, Pechan 2006
Ferrous Metals Processing - Iron and Steel Production - BOF
Secondary Capture and Control System
85 $5,000 Based on engineering judgments and data which for some plants may be outdated.
EPA 2006a, Pechan 2006
Ferrous Metals Processing - Iron and Steel Production - Sinter Plant
Install baghouse to control emissions from sinter cooler
99 $5,000 2001$ Based on engineering judgments and data which for some plants may be outdated.
EPA 2006a, Pechan 2006
Petroleum Refinery Catalytic and Thermal Cracking Units
Wet Scrubbing 85 - 95 Not Available MARAMA, 2006
Petroleum Refinery Catalytic and Thermal Cracking Units
Electrostatic Precipitators >95% $3,500 - $6,600 MARAMA, 2006; SCAQMD, 2003
Petroleum Refinery Catalytic and Thermal Cracking Units
Sodium bisulfite (SBS) injection Not Available Not Available MARAMA, 2006
Stationary diesel engines including generators and other prime service engines
Diesel oxidation catalyst (where DPF not feasible)
20 $1,000-$2,000 2003$ Cost effectiveness is based on the combined CO, HC, NOx and PM reduction
NESCAUM 2003, STAPPA and ALAPCO 2006
Stationary diesel engines including generators and other prime service engines
Diesel particulate filter 80-90 $2,000-$19,000 2003$ Cost effectiveness is based on the combined CO, HC and PM reduction.
NESCAUM 2003, STAPPA and ALAPCO 2006.
Coal-fired Utility Boiler currently controlled by ESPs
Indigo Agglomerator 40 Cost effectiveness is variable and based on plant size: the total capital cost of $8 per kW
2005$ Khan, EPA. August 21, 2006.
Coal-fired Utility Boiler currently controlled by ESPs
Add enough collection area to equal one field
44 Cost effectiveness is variable and based on plant size: the total capital cost of $13.75 per kW
2005$ Khan, EPA, August 21, 2006
Page 2 of 3

Stationary Source Control Measures for PM2.5See cover note for important notes and caveats on the use of these tables
Draft Version 1.0
Source category Emissions reduction measure Control efficiency (%)
Cost effectiveness($/ton reduced)
Cost Year
Notes/caveats Other pollutants controlled
References for more information
Coal-fired Utility Boiler currently controlled by ESPs
Add enough collection area to equal two fields
67 Cost effectiveness is variable and based on plant size: the total capital cost of $17.50 per kW
2005$ CE is incremental to ESP controls
Khan, EPA, August 21, 2006
Residual Oil-Fired Utility and Industrial Boilers currently without add-on controls
ESP Not Available Not available EPA, 2006b.
Ferroalloy production Improve capture on open furnaces Not Available Not available EPA, 2006b.
Ferroalloy production Capture of fugitive emissions from pouring and casting
Not Available Not available EPA, 2006b.
Refractory products manufacturing - non-clay with organic binders
thermal oxidizer on plants below MACT applicability cutoff
Not Available Not available EPA, 2006b.
Refractory products manufacturing - non-clay with chromium
Fabric filter Not Available Not available EPA, 2006b.
Refractory products manufacturing - clay
Wet or dry lime scrubber for plants below MACT applicability limit
Not Available Not available EPA, 2006b.
Commercial Cooking -- conveyorized charbroiler
Catalytic Oxidizer 83 $3,000 2001$ 90 % co-control of VOCs
Ventura County 2004, CE-ERT 2002
Commercial Cooking -- large underfired grilling operations
Small ESP (e.g., SMOG-HOG) or scrubber
99 $6,000 2003$ Sorrels 2006
Open Burning of Land Clearing Debris
Substitution of landfilling for open burning
50 to 100 $3,500 1999$ Development measure from PM NAAQS RIA
EPA 2006a, Pechan 2006
Residential Wood Combustion Education and Advisory Program 5-10 Variable, depending on availability and effectiveness of resources allocated.
1990$ Includes all programs other than woodstove changeout programs
Pechan 1997
Residential Wood Stoves Woodstove Changeout Program, including financial incentives and information/encouragement when houses are sold
variable depending on outreach and incentives
$2,000 1999$ 'Development measure from PM NAAQS RIA
EPA Communication
Residential Wood Stoves Mandatory changeout when houses are sold
5-7% per year Not available 5-7% is based on typical rates of housing turnover
Residential Fireplaces Promote use of Gas Logs/ elimination of wood burning
Not Available Not available
Outdoor wood hydronic heaters Emissions standards or siting requirements
Not Available Not available NESCAUM 2007
Page 3 of 3
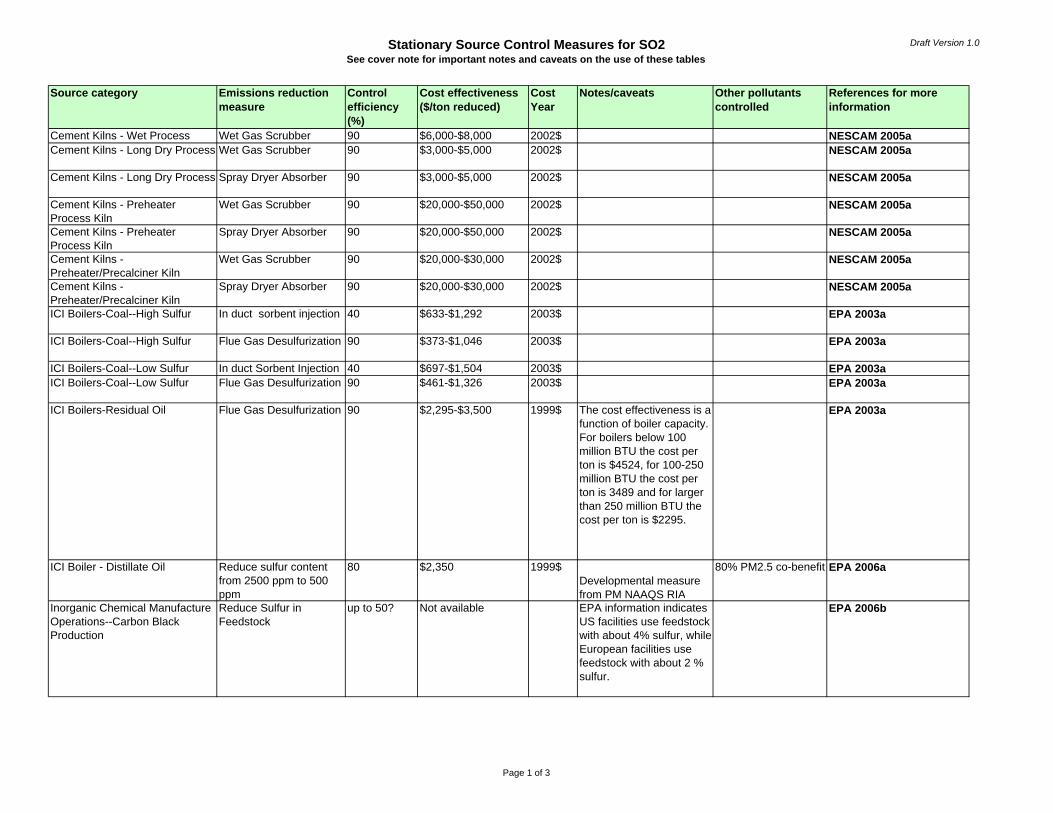
Stationary Source Control Measures for SO2See cover note for important notes and caveats on the use of these tables
Draft Version 1.0
Source category Emissions reduction measure
Control efficiency (%)
Cost effectiveness ($/ton reduced)
Cost Year
Notes/caveats Other pollutants controlled
References for more information
Cement Kilns - Wet Process Wet Gas Scrubber 90 $6,000-$8,000 2002$ NESCAM 2005aCement Kilns - Long Dry Process Wet Gas Scrubber 90 $3,000-$5,000 2002$ NESCAM 2005a
Cement Kilns - Long Dry Process Spray Dryer Absorber 90 $3,000-$5,000 2002$ NESCAM 2005a
Cement Kilns - Preheater Process Kiln
Wet Gas Scrubber 90 $20,000-$50,000 2002$ NESCAM 2005a
Cement Kilns - Preheater Process Kiln
Spray Dryer Absorber 90 $20,000-$50,000 2002$ NESCAM 2005a
Cement Kilns - Preheater/Precalciner Kiln
Wet Gas Scrubber 90 $20,000-$30,000 2002$ NESCAM 2005a
Cement Kilns - Preheater/Precalciner Kiln
Spray Dryer Absorber 90 $20,000-$30,000 2002$ NESCAM 2005a
ICI Boilers-Coal--High Sulfur In duct sorbent injection 40 $633-$1,292 2003$ EPA 2003a
ICI Boilers-Coal--High Sulfur Flue Gas Desulfurization 90 $373-$1,046 2003$ EPA 2003a
ICI Boilers-Coal--Low Sulfur In duct Sorbent Injection 40 $697-$1,504 2003$ EPA 2003aICI Boilers-Coal--Low Sulfur Flue Gas Desulfurization 90 $461-$1,326 2003$ EPA 2003a
ICI Boilers-Residual Oil Flue Gas Desulfurization 90 $2,295-$3,500 1999$ The cost effectiveness is a function of boiler capacity. For boilers below 100 million BTU the cost per ton is $4524, for 100-250 million BTU the cost per ton is 3489 and for larger than 250 million BTU the cost per ton is $2295.
EPA 2003a
ICI Boiler - Distillate Oil Reduce sulfur content from 2500 ppm to 500 ppm
80 $2,350 1999$Developmental measure from PM NAAQS RIA
80% PM2.5 co-benefit EPA 2006a
Inorganic Chemical Manufacture Operations--Carbon Black Production
Reduce Sulfur in Feedstock
up to 50? Not available EPA information indicates US facilities use feedstock with about 4% sulfur, while European facilities use feedstock with about 2 % sulfur.
EPA 2006b
Page 1 of 3

Stationary Source Control Measures for SO2See cover note for important notes and caveats on the use of these tables
Draft Version 1.0
Source category Emissions reduction measure
Control efficiency (%)
Cost effectiveness ($/ton reduced)
Cost Year
Notes/caveats Other pollutants controlled
References for more information
Iron and Steel--Coke Ovens Coke oven gas desulfurization
90+ Not available Pechan 2006
Oil and Gas Production--Process heaters
Flue Gas Desulfurization 90 Not available EPA 1981
Petroleum refining--catalytic and thermal cracking units
Catalyst additives 35 - 50 $ 1,096 - $1,889 This type of SO2 control is required in some refinery industry cases and settlements
MARAMA 2006, Eagleson et al., 2004,
Petroleum refining--catalytic and thermal cracking units
Wet gas scrubbers 95 - 99.9 $ 499 - 880 2004$ This type of SO2 control is required in some refinery industry cases and settlements
MARAMA 2006, Eagleson et al., 2004,
Petroleum refining -- catalytic and thermal cracking units
Feed hydrotreatment Not available Not available MARAMA, 2006
Petroleum refining--flares Process changes to reduce flaring
Variable depending on suite of measures selected
Variable depending on suite of measures selected
MARAMA, 2006
Petroleum refining--process heaters
Scrubbing: Wet Scrubbers, Spray Dry Scrubbers, Dry Scrubbers
90 - 99.9 $7,674 - $45,384 MARAMA, 2006
Petroleum refining--oil-burning process heaters
Eliminate the combustion of fuel oil (>0.05% sulfur by weight)
>95 Not available MARAMA, 2006
Petroleum refining--sulfur recovery units
Increased recovery efficiency, tail gas treatment such that H2 S content of fuels meets 0.10 gr/dscf (162 ppm) limit
variable depending on current recovery efficiency
Variable depending on current recovery efficiency
MARAMA, 2006
Primary aluminum plants Addition of scrubbers to control system for captured emissions from anode bake furnaces
Not available Not available EPA, 2006b
Primary aluminum plants Use of coke and pitch with lower sulfur content
Not available Not available EPA, 2006b
Page 2 of 3

Stationary Source Control Measures for SO2See cover note for important notes and caveats on the use of these tables
Draft Version 1.0
Source category Emissions reduction measure
Control efficiency (%)
Cost effectiveness ($/ton reduced)
Cost Year
Notes/caveats Other pollutants controlled
References for more information
Primary Lead Smelters - Sintering
Dual Absorption Acid Plant
90 Not available EPA 1981
Primary Zinc Smelters - Sintering Dual Absorption Acid Plant
90 Not available EPA 1981
Pulp and Paper--acid sulfite pulping
Alkaline scrubber Not available Not available STAPPA/ALAPCO 2006
Pulp and Paper--acid sulfite pulping
Raise pH of digester before releasing excess gas
Not available Not available STAPPA/ALAPCO 2006
Pulp and paper--recovery furnaces
Reduce sulfur content of black liquor before combustion
Not available Not available AWMA 2000
Pulp and paper--recovery furnaces
Regulate temperatures in the furnace to minimize SO2 formation
Not available Not available STAPPA/ALAPCO 2006
Residential fuel combustion--Home Heating Oil
Reduce sulfur content from 2500 ppm to 500 ppm
80 $2,350 1999$ Some areas currently have 500 ppm limits.
NESCAUM 2005
Sulfur Recovery Plants at Elemental Sulfur Plants, Oil and Gas Production, and other sulfur recovery plants not located at refineries
Increased recovery efficiency, tail gas treatment
Variable depending on current recovery efficiency
Variable depending on current recovery efficiency
EPA 2002
Sulfuric Acid Plants Increased recovery efficiency
Variable depending on current recovery efficiency
Variable depending on current recovery efficiency
Pechan 2006
Utility Boilers * (see footnote)
* This document does not address SO2 and NOx controls for EGU. These controls are relatively well known and are the subject of policy discussions among states, multi-state bodies and the EPA.
Page 3 of 3

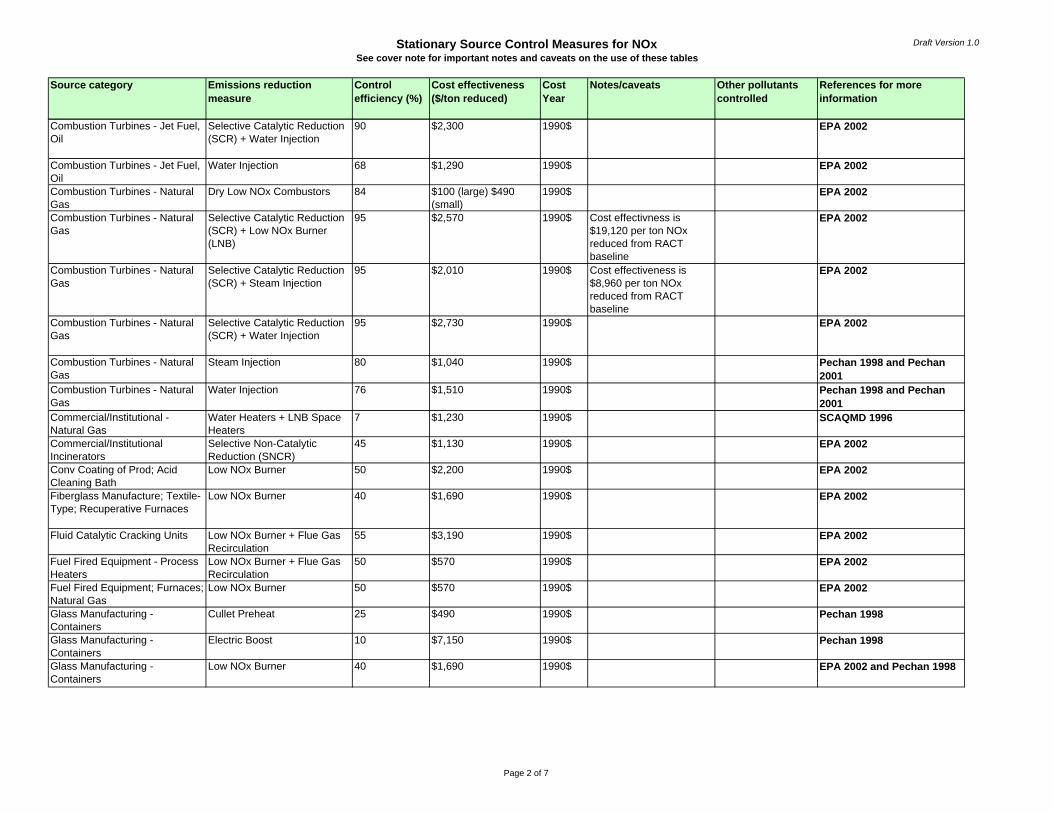
Stationary Source Control Measures for NOxSee cover note for important notes and caveats on the use of these tables
Draft Version 1.0
Source category Emissions reduction measure
Control efficiency (%)
Cost effectiveness ($/ton reduced)
Cost Year
Notes/caveats Other pollutants controlled
References for more information
Ammonia - Natural Gas - Fired Reformers
Low NOx Burner 50 $820 1990$ EPA 1994a, EPA 2002, Pechan 1998, Pechan 2001
Ammonia - Natural Gas - Fired Reformers
Low NOx Burner + Flue Gas Recirculation
60 $2,560 1990$ EPA 1994a, EPA 2002, Pechan 1998, Pechan 2001
Ammonia - Natural Gas - Fired Reformers
Oxygen Trim + Water Injection 65 $680 1990$ EPA 1994a, EPA 2002, Pechan 1998, Pechan 2001
Ammonia - Natural Gas - Fired Reformers
Selective Catalytic Reduction (SCR)
80 $2,230 1990$ EPA 1994a, EPA 2002, Pechan 1998, Pechan 2001
Ammonia - Natural Gas - Fired Reformers
Selective Non-Catalytic Reduction (SNCR)
50 $3,780 1990$ EPA 1994a, EPA 2002, Pechan 1998, Pechan 2001
Ammonia Products; Feedstock Desulfurization
Low NOx Burner + Flue Gas Recirculation
60 $2,560 1990$ EPA 1994a, EPA 2002, Pechan 1998, Pechan 2001
Asphalt Plant Manufacture Low NOx Burner + Flue Gas Recirculation
30-50 Not available
Asphaltic Conc; Rotary Dryer; Conv Plant
Low NOx Burner 50 $2,200 1990$ EPA 1993, EPA 2002, Pechan 1998
By-Product Coke Manufacturing; Oven Underfiring
Selective Non-Catalytic Reduction (SNCR)
60 $1,640 1990$ EPA 1994, EPA 2002, Pechan 1998, Pechan 2001
Cement Kilns Biosolids injection 23 $310 1999$ Pechan 2006Cement Kilns Changing feed composition Not available LADCO 2005Cement Kilns Low NOx Burner 27-40 $166-$1,299 2004$ LADCO 2005Cement Kilns Mid-Kiln Firing 33-41 -$460 to $730 2004$ LADCO 2005Cement Kilns Process control systems Not available LADCO, 2005Cement Kilns Selective Catalytic Reduction
(SCR)31-95 $600-$3,700 1999$ Uncertain -- currently
used on cement kilns in France; may apply to U.S. cement kilns in future
Pechan 2006, STAPPA/ALAPCO 2006
Cement Kilns SNCR-ammonia based 50 $850 1999$ EC/R 2000Cement Kilns SNCR-urea based 50 $770 1999$ EC/R 2000Ceramic Clay Manufacturing; Drying - Small Sources
Low NOx Burner 50 $2,200 1990$ EPA 2002 and Pechan 1998
Coal Cleaning-Thrml Dryer; Fluidized Bed - Small Sources
Low NOx Burner 50 $200-$1,000 2003$ Reaction Engineering International and Energy & Environmental Strategies
Combustion Turbine Aeroderivative Gas Turbines
Water Injection 40 $44,000 2005$ NJDEP 2005
Page 1 of 7
Stationary Source Control Measures for NOxSee cover note for important notes and caveats on the use of these tables
Draft Version 1.0
Source category Emissions reduction measure
Control efficiency (%)
Cost effectiveness ($/ton reduced)
Cost Year
Notes/caveats Other pollutants controlled
References for more information
Combustion Turbines - Jet Fuel, Oil
Selective Catalytic Reduction (SCR) + Water Injection
90 $2,300 1990$ EPA 2002
Combustion Turbines - Jet Fuel, Oil
Water Injection 68 $1,290 1990$ EPA 2002
Combustion Turbines - Natural Gas
Dry Low NOx Combustors 84 $100 (large) $490 (small)
1990$ EPA 2002
Combustion Turbines - Natural Gas
Selective Catalytic Reduction (SCR) + Low NOx Burner (LNB)
95 $2,570 1990$ Cost effectivness is $19,120 per ton NOx reduced from RACT baseline
EPA 2002
Combustion Turbines - Natural Gas
Selective Catalytic Reduction (SCR) + Steam Injection
95 $2,010 1990$ Cost effectiveness is $8,960 per ton NOx reduced from RACT baseline
EPA 2002
Combustion Turbines - Natural Gas
Selective Catalytic Reduction (SCR) + Water Injection
95 $2,730 1990$ EPA 2002
Combustion Turbines - Natural Gas
Steam Injection 80 $1,040 1990$ Pechan 1998 and Pechan 2001
Combustion Turbines - Natural Gas
Water Injection 76 $1,510 1990$ Pechan 1998 and Pechan 2001
Commercial/Institutional - Natural Gas
Water Heaters + LNB Space Heaters
7 $1,230 1990$ SCAQMD 1996
Commercial/Institutional Incinerators
Selective Non-Catalytic Reduction (SNCR)
45 $1,130 1990$ EPA 2002
Conv Coating of Prod; Acid Cleaning Bath
Low NOx Burner 50 $2,200 1990$ EPA 2002
Fiberglass Manufacture; Textile-Type; Recuperative Furnaces
Low NOx Burner 40 $1,690 1990$ EPA 2002
Fluid Catalytic Cracking Units Low NOx Burner + Flue Gas Recirculation
55 $3,190 1990$ EPA 2002
Fuel Fired Equipment - Process Heaters
Low NOx Burner + Flue Gas Recirculation
50 $570 1990$ EPA 2002
Fuel Fired Equipment; Furnaces; Natural Gas
Low NOx Burner 50 $570 1990$ EPA 2002
Glass Manufacturing - Containers
Cullet Preheat 25 $490 1990$ Pechan 1998
Glass Manufacturing - Containers
Electric Boost 10 $7,150 1990$ Pechan 1998
Glass Manufacturing - Containers
Low NOx Burner 40 $1,690 1990$ EPA 2002 and Pechan 1998
Page 2 of 7
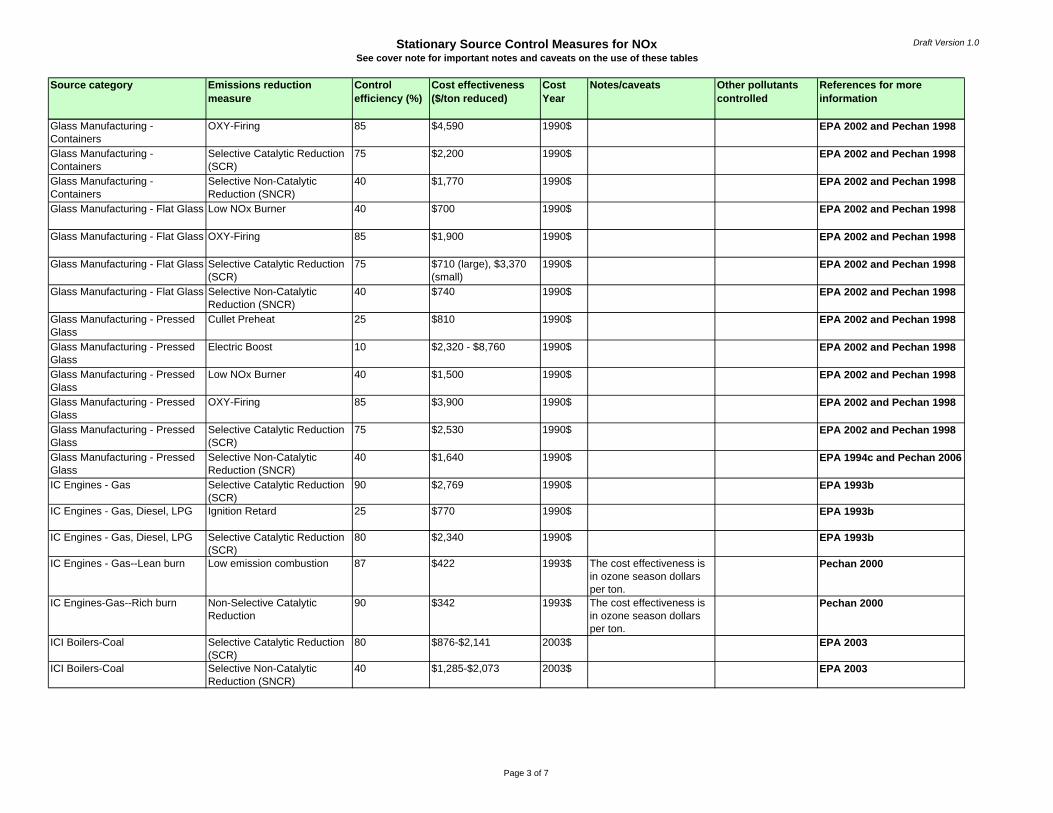
Stationary Source Control Measures for NOxSee cover note for important notes and caveats on the use of these tables
Draft Version 1.0
Source category Emissions reduction measure
Control efficiency (%)
Cost effectiveness ($/ton reduced)
Cost Year
Notes/caveats Other pollutants controlled
References for more information
Glass Manufacturing - Containers
OXY-Firing 85 $4,590 1990$ EPA 2002 and Pechan 1998
Glass Manufacturing - Containers
Selective Catalytic Reduction (SCR)
75 $2,200 1990$ EPA 2002 and Pechan 1998
Glass Manufacturing - Containers
Selective Non-Catalytic Reduction (SNCR)
40 $1,770 1990$ EPA 2002 and Pechan 1998
Glass Manufacturing - Flat Glass Low NOx Burner 40 $700 1990$ EPA 2002 and Pechan 1998
Glass Manufacturing - Flat Glass OXY-Firing 85 $1,900 1990$ EPA 2002 and Pechan 1998
Glass Manufacturing - Flat Glass Selective Catalytic Reduction (SCR)
75 $710 (large), $3,370 (small)
1990$ EPA 2002 and Pechan 1998
Glass Manufacturing - Flat Glass Selective Non-Catalytic Reduction (SNCR)
40 $740 1990$ EPA 2002 and Pechan 1998
Glass Manufacturing - Pressed Glass
Cullet Preheat 25 $810 1990$ EPA 2002 and Pechan 1998
Glass Manufacturing - Pressed Glass
Electric Boost 10 $2,320 - $8,760 1990$ EPA 2002 and Pechan 1998
Glass Manufacturing - Pressed Glass
Low NOx Burner 40 $1,500 1990$ EPA 2002 and Pechan 1998
Glass Manufacturing - Pressed Glass
OXY-Firing 85 $3,900 1990$ EPA 2002 and Pechan 1998
Glass Manufacturing - Pressed Glass
Selective Catalytic Reduction (SCR)
75 $2,530 1990$ EPA 2002 and Pechan 1998
Glass Manufacturing - Pressed Glass
Selective Non-Catalytic Reduction (SNCR)
40 $1,640 1990$ EPA 1994c and Pechan 2006
IC Engines - Gas Selective Catalytic Reduction (SCR)
90 $2,769 1990$ EPA 1993b
IC Engines - Gas, Diesel, LPG Ignition Retard 25 $770 1990$ EPA 1993b
IC Engines - Gas, Diesel, LPG Selective Catalytic Reduction (SCR)
80 $2,340 1990$ EPA 1993b
IC Engines - Gas--Lean burn Low emission combustion 87 $422 1993$ The cost effectiveness is in ozone season dollars per ton.
Pechan 2000
IC Engines-Gas--Rich burn Non-Selective Catalytic Reduction
90 $342 1993$ The cost effectiveness is in ozone season dollars per ton.
Pechan 2000
ICI Boilers-Coal Selective Catalytic Reduction (SCR)
80 $876-$2,141 2003$ EPA 2003
ICI Boilers-Coal Selective Non-Catalytic Reduction (SNCR)
40 $1,285-$2,073 2003$ EPA 2003
Page 3 of 7
Stationary Source Control Measures for NOxSee cover note for important notes and caveats on the use of these tables
Draft Version 1.0
Source category Emissions reduction measure
Control efficiency (%)
Cost effectiveness ($/ton reduced)
Cost Year
Notes/caveats Other pollutants controlled
References for more information
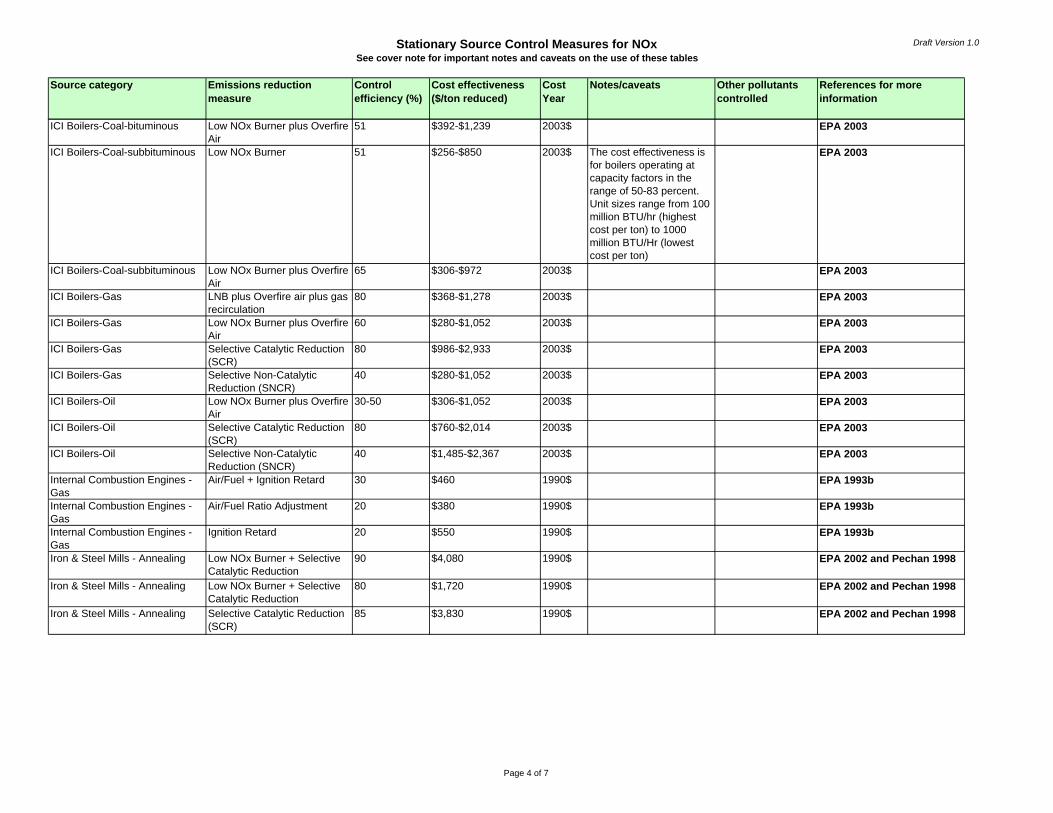
ICI Boilers-Coal-bituminous Low NOx Burner plus Overfire Air
51 $392-$1,239 2003$ EPA 2003
ICI Boilers-Coal-subbituminous Low NOx Burner 51 $256-$850 2003$ The cost effectiveness is for boilers operating at capacity factors in the range of 50-83 percent. Unit sizes range from 100 million BTU/hr (highest cost per ton) to 1000 million BTU/Hr (lowest cost per ton)
EPA 2003
ICI Boilers-Coal-subbituminous Low NOx Burner plus Overfire Air
65 $306-$972 2003$ EPA 2003
ICI Boilers-Gas LNB plus Overfire air plus gas recirculation
80 $368-$1,278 2003$ EPA 2003
ICI Boilers-Gas Low NOx Burner plus Overfire Air
60 $280-$1,052 2003$ EPA 2003
ICI Boilers-Gas Selective Catalytic Reduction (SCR)
80 $986-$2,933 2003$ EPA 2003
ICI Boilers-Gas Selective Non-Catalytic Reduction (SNCR)
40 $280-$1,052 2003$ EPA 2003
ICI Boilers-Oil Low NOx Burner plus Overfire Air
30-50 $306-$1,052 2003$ EPA 2003
ICI Boilers-Oil Selective Catalytic Reduction (SCR)
80 $760-$2,014 2003$ EPA 2003
ICI Boilers-Oil Selective Non-Catalytic Reduction (SNCR)
40 $1,485-$2,367 2003$ EPA 2003
Internal Combustion Engines - Gas
Air/Fuel + Ignition Retard 30 $460 1990$ EPA 1993b
Internal Combustion Engines - Gas
Air/Fuel Ratio Adjustment 20 $380 1990$ EPA 1993b
Internal Combustion Engines - Gas
Ignition Retard 20 $550 1990$ EPA 1993b
Iron & Steel Mills - Annealing Low NOx Burner + Selective Catalytic Reduction
90 $4,080 1990$ EPA 2002 and Pechan 1998
Iron & Steel Mills - Annealing Low NOx Burner + Selective Catalytic Reduction
80 $1,720 1990$ EPA 2002 and Pechan 1998
Iron & Steel Mills - Annealing Selective Catalytic Reduction (SCR)
85 $3,830 1990$ EPA 2002 and Pechan 1998
Page 4 of 7

Stationary Source Control Measures for NOxSee cover note for important notes and caveats on the use of these tables
Draft Version 1.0
Source category Emissions reduction measure
Control efficiency (%)
Cost effectiveness ($/ton reduced)
Cost Year
Notes/caveats Other pollutants controlled
References for more information
Iron & Steel Mills - Annealing Selective Non-Catalytic Reduction (SNCR)
60 $1,640 1990$ EPA 2002 and Pechan 1998
Iron & Steel Mills - Annealing, Galvanizing, Reheating
Low NOx Burner 50 - 65 $300 -$570 1990$ EPA 2002 and Pechan 1998
Iron & Steel Mills - Annealing, Galvanizing, Reheating
Low NOx Burner + Flue Gas Recirculation
60 - 77 $380-$750 1990$ EPA 2002 and Pechan 1998
Iron & Steel Mills - Reheating Low Excess Air 13 $1,320 1990$ EPA 2002 and Pechan 1998
Iron Production; Blast Furnaces; Blast Heating Stoves
Low NOx Burner + Flue Gas Recirculation
77 $380 1990$ EPA 2002 and Pechan 1998
Lime Kilns Low NOx Burner 30 $560 1999$ EPA 1994Medical Waste Incinerators Selective Non-Catalytic
Reduction (SNCR)45 $4,510 1990$ EPA 2002 and Pechan 1998
Municipal Waste Combustors Selective Non-Catalytic Reduction (SNCR)
45 $1,130 1990$ EPA 2002 and Pechan 1998
Natural Gas Production; Compressors
Selective Catalytic Reduction (SCR)
20 $1,650 1990$ EPA 2002 and Pechan 1998
Nitric Acid Manufacturing Extended Absorption 95 $480 1990$ EPA 2002 and Pechan 1998
Nitric Acid Manufacturing Non-Selective Catalytic Reduction
98 $550 1990$ EPA 2002 and Pechan 1998
Nitric Acid Manufacturing Selective Catalytic Reduction (SCR)
97 $590 1990$ EPA 2002 and Pechan 1998
Open Burning Episodic Ban Daily control efficiency is 100%
Not available Pechan 2006
Process Heaters - Distillate and Residual Oil
Low NOx Burner + Flue Gas Recirculation
34-48 $3,500-$4,500 1990$ EPA 2002 and Pechan 1998
Process Heaters - Distillate and Residual Oil
Low NOx Burner + Selective Catalytic Reduction
75 $2,300 1990$ EPA 2002 and Pechan 1998
Process Heaters - Distillate and Residual Oil
Selective Catalytic Reduction (SCR)
75 $5,350-$9,230 1990$ EPA 2002 and Pechan 1998
Process Heaters - Distillate and Residual Oil
Selective Non-Catalytic Reduction (SNCR)
60 $1,930-$3,180 1990$ EPA 2002 and Pechan 1998
Process Heaters - Distillate and Residual Oil
Ultra Low NOx Burner 74 $1,290-$2,140 1990$ EPA 2002 and Pechan 1998
Page 5 of 7
Stationary Source Control Measures for NOxSee cover note for important notes and caveats on the use of these tables
Draft Version 1.0
Source category Emissions reduction measure
Control efficiency (%)
Cost effectiveness ($/ton reduced)
Cost Year
Notes/caveats Other pollutants controlled
References for more information
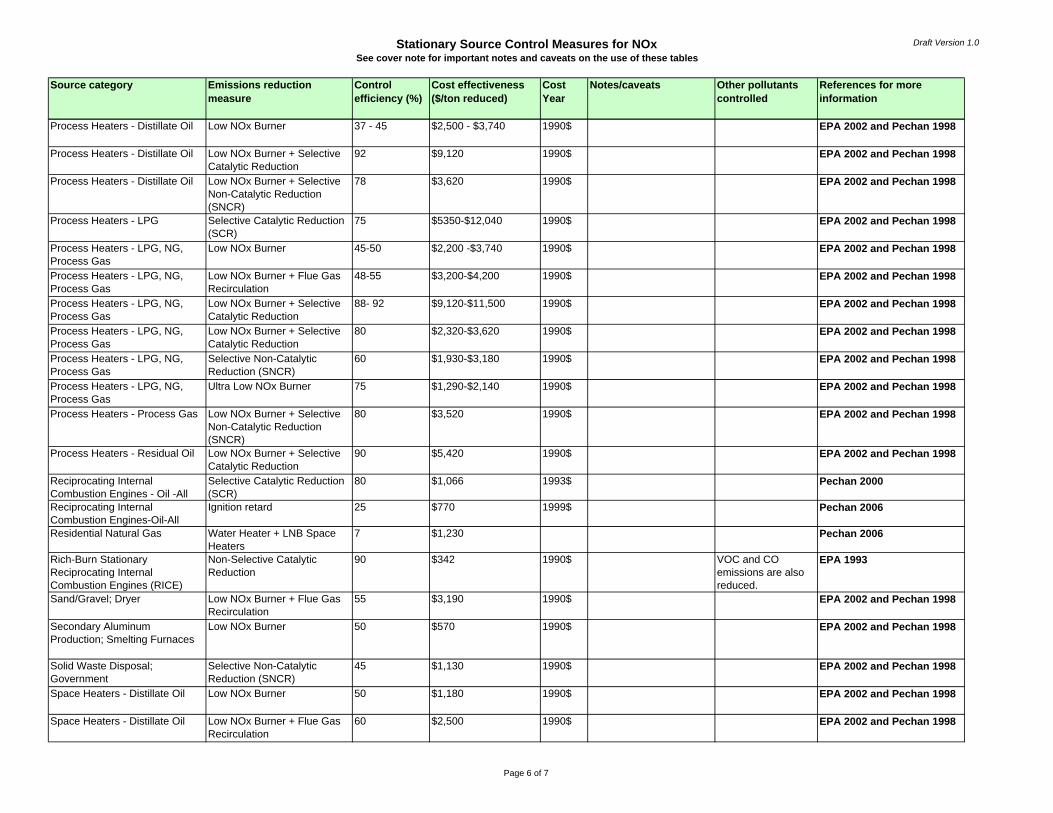
Process Heaters - Distillate Oil Low NOx Burner 37 - 45 $2,500 - $3,740 1990$ EPA 2002 and Pechan 1998
Process Heaters - Distillate Oil Low NOx Burner + Selective Catalytic Reduction
92 $9,120 1990$ EPA 2002 and Pechan 1998
Process Heaters - Distillate Oil Low NOx Burner + Selective Non-Catalytic Reduction (SNCR)
78 $3,620 1990$ EPA 2002 and Pechan 1998
Process Heaters - LPG Selective Catalytic Reduction (SCR)
75 $5350-$12,040 1990$ EPA 2002 and Pechan 1998
Process Heaters - LPG, NG, Process Gas
Low NOx Burner 45-50 $2,200 -$3,740 1990$ EPA 2002 and Pechan 1998
Process Heaters - LPG, NG, Process Gas
Low NOx Burner + Flue Gas Recirculation
48-55 $3,200-$4,200 1990$ EPA 2002 and Pechan 1998
Process Heaters - LPG, NG, Process Gas
Low NOx Burner + Selective Catalytic Reduction
88- 92 $9,120-$11,500 1990$ EPA 2002 and Pechan 1998
Process Heaters - LPG, NG, Process Gas
Low NOx Burner + Selective Catalytic Reduction
80 $2,320-$3,620 1990$ EPA 2002 and Pechan 1998
Process Heaters - LPG, NG, Process Gas
Selective Non-Catalytic Reduction (SNCR)
60 $1,930-$3,180 1990$ EPA 2002 and Pechan 1998
Process Heaters - LPG, NG, Process Gas
Ultra Low NOx Burner 75 $1,290-$2,140 1990$ EPA 2002 and Pechan 1998
Process Heaters - Process Gas Low NOx Burner + Selective Non-Catalytic Reduction (SNCR)
80 $3,520 1990$ EPA 2002 and Pechan 1998
Process Heaters - Residual Oil Low NOx Burner + Selective Catalytic Reduction
90 $5,420 1990$ EPA 2002 and Pechan 1998
Reciprocating Internal Combustion Engines - Oil -All
Selective Catalytic Reduction (SCR)
80 $1,066 1993$ Pechan 2000
Reciprocating Internal Combustion Engines-Oil-All
Ignition retard 25 $770 1999$ Pechan 2006
Residential Natural Gas Water Heater + LNB Space Heaters
7 $1,230 Pechan 2006
Rich-Burn Stationary Reciprocating Internal Combustion Engines (RICE)
Non-Selective Catalytic Reduction
90 $342 1990$ VOC and CO emissions are also reduced.
EPA 1993
Sand/Gravel; Dryer Low NOx Burner + Flue Gas Recirculation
55 $3,190 1990$ EPA 2002 and Pechan 1998
Secondary Aluminum Production; Smelting Furnaces
Low NOx Burner 50 $570 1990$ EPA 2002 and Pechan 1998
Solid Waste Disposal; Government
Selective Non-Catalytic Reduction (SNCR)
45 $1,130 1990$ EPA 2002 and Pechan 1998
Space Heaters - Distillate Oil Low NOx Burner 50 $1,180 1990$ EPA 2002 and Pechan 1998
Space Heaters - Distillate Oil Low NOx Burner + Flue Gas Recirculation
60 $2,500 1990$ EPA 2002 and Pechan 1998
Page 6 of 7

Stationary Source Control Measures for NOxSee cover note for important notes and caveats on the use of these tables
Draft Version 1.0
Source category Emissions reduction measure
Control efficiency (%)
Cost effectiveness ($/ton reduced)
Cost Year
Notes/caveats Other pollutants controlled
References for more information
Space Heaters - Distillate Oil Selective Catalytic Reduction (SCR)
80 $2,780 1990$ EPA 2002 and Pechan 1998
Space Heaters - Distillate Oil Selective Non-Catalytic Reduction (SNCR)
50 $4,640 1990$ EPA 2002 and Pechan 1998
Space Heaters - Natural Gas Low NOx Burner 50 $820 1990$ EPA 2002 and Pechan 1998
Space Heaters - Natural Gas Low NOx Burner + Flue Gas Recirculation
60 $2,650 1990$ EPA 2002 and Pechan 1998
Space Heaters - Natural Gas Oxygen Trim + Water Injection 65 $680 1990$ EPA 2002 and Pechan 1998
Space Heaters - Natural Gas Selective Catalytic Reduction (SCR)
80 $2,860 1990$ EPA 2002 and Pechan 1998
Space Heaters - Natural Gas Selective Non-Catalytic Reduction (SNCR)
50 $3,870 1990$ EPA 2002 and Pechan 1998
Starch Manufacturing; Combined Operation
Low NOx Burner + Flue Gas Recirculation
55 $3,190 1990$ EPA 2002 and Pechan 1998
Steel Foundries; Heat Treating Low NOx Burner 50 $570 1990$ EPA 2002 and Pechan 1998
Steel Production; Soaking Pits Low NOx Burner + Flue Gas Recirculation
60 $750 1990$ EPA 2002 and Pechan 1998
Sulfate Pulping - Recovery Furnaces
Low NOx Burner 50 $820 1990$ EPA 2002 and Pechan 1998
Sulfate Pulping - Recovery Furnaces
Low NOx Burner + Flue Gas Recirculation
60 $2,560 1990$ EPA 2002 and Pechan 1998
Sulfate Pulping - Recovery Furnaces
Oxygen Trim + Water Injection 65 $680 1990$ EPA 2002 and Pechan 1998
Sulfate Pulping - Recovery Furnaces
Selective Catalytic Reduction (SCR)
80 $2,230 1990$ EPA 2002 and Pechan 1998
Sulfate Pulping - Recovery Furnaces
Selective Non-Catalytic Reduction (SNCR)
50 $3,870 1990$ EPA 2002 and Pechan 1998
Surface Coat Oper; Coating Oven Htr; Nat Gas
Low NOx Burner 50 $2,200 1990$ EPA 2002 and Pechan 1998
Utility Boilers*
* This document does not address SO2 and NOx controls for EGU. These controls are relatively well known and are the subject of policy discussions among states, multi-state bodies and the EPA.
Page 7 of 7
Stationary Source Control Measures ReferencesSee cover note for important notes and caveats on the use of these tables
Draft Version 1.0
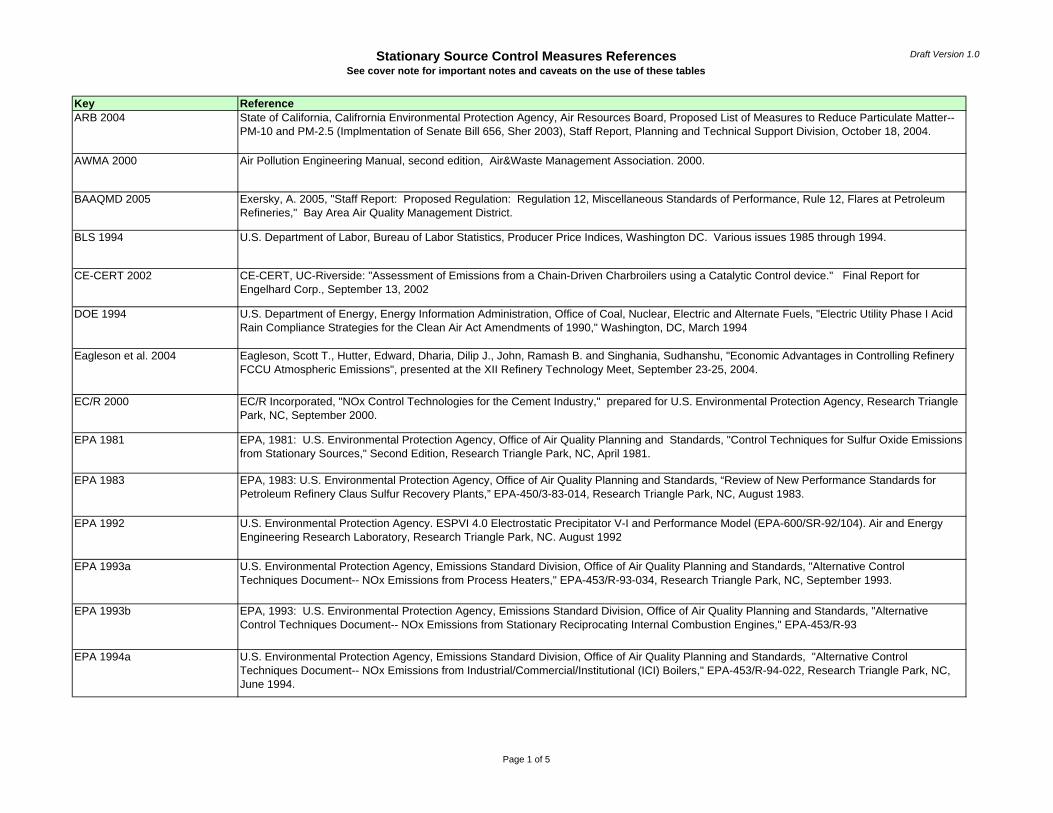
Key ReferenceARB 2004 State of California, Califrornia Environmental Protection Agency, Air Resources Board, Proposed List of Measures to Reduce Particulate Matter--
PM-10 and PM-2.5 (Implmentation of Senate Bill 656, Sher 2003), Staff Report, Planning and Technical Support Division, October 18, 2004.
AWMA 2000 Air Pollution Engineering Manual, second edition, Air&Waste Management Association. 2000.
BAAQMD 2005 Exersky, A. 2005, "Staff Report: Proposed Regulation: Regulation 12, Miscellaneous Standards of Performance, Rule 12, Flares at Petroleum Refineries," Bay Area Air Quality Management District.
BLS 1994 U.S. Department of Labor, Bureau of Labor Statistics, Producer Price Indices, Washington DC. Various issues 1985 through 1994.
CE-CERT 2002 CE-CERT, UC-Riverside: "Assessment of Emissions from a Chain-Driven Charbroilers using a Catalytic Control device." Final Report for Engelhard Corp., September 13, 2002
DOE 1994 U.S. Department of Energy, Energy Information Administration, Office of Coal, Nuclear, Electric and Alternate Fuels, "Electric Utility Phase I Acid Rain Compliance Strategies for the Clean Air Act Amendments of 1990," Washington, DC, March 1994
Eagleson et al. 2004 Eagleson, Scott T., Hutter, Edward, Dharia, Dilip J., John, Ramash B. and Singhania, Sudhanshu, "Economic Advantages in Controlling Refinery FCCU Atmospheric Emissions", presented at the XII Refinery Technology Meet, September 23-25, 2004.
EC/R 2000 EC/R Incorporated, "NOx Control Technologies for the Cement Industry," prepared for U.S. Environmental Protection Agency, Research Triangle Park, NC, September 2000.
EPA 1981 EPA, 1981: U.S. Environmental Protection Agency, Office of Air Quality Planning and Standards, "Control Techniques for Sulfur Oxide Emissions from Stationary Sources," Second Edition, Research Triangle Park, NC, April 1981.
EPA 1983 EPA, 1983: U.S. Environmental Protection Agency, Office of Air Quality Planning and Standards, “Review of New Performance Standards for Petroleum Refinery Claus Sulfur Recovery Plants,” EPA-450/3-83-014, Research Triangle Park, NC, August 1983.
EPA 1992 U.S. Environmental Protection Agency. ESPVI 4.0 Electrostatic Precipitator V-I and Performance Model (EPA-600/SR-92/104). Air and Energy Engineering Research Laboratory, Research Triangle Park, NC. August 1992
EPA 1993a U.S. Environmental Protection Agency, Emissions Standard Division, Office of Air Quality Planning and Standards, "Alternative Control Techniques Document-- NOx Emissions from Process Heaters," EPA-453/R-93-034, Research Triangle Park, NC, September 1993.
EPA 1993b EPA, 1993: U.S. Environmental Protection Agency, Emissions Standard Division, Office of Air Quality Planning and Standards, "Alternative Control Techniques Document-- NOx Emissions from Stationary Reciprocating Internal Combustion Engines," EPA-453/R-93
EPA 1994a U.S. Environmental Protection Agency, Emissions Standard Division, Office of Air Quality Planning and Standards, "Alternative Control Techniques Document-- NOx Emissions from Industrial/Commercial/Institutional (ICI) Boilers," EPA-453/R-94-022, Research Triangle Park, NC, June 1994.
Page 1 of 5

Stationary Source Control Measures ReferencesSee cover note for important notes and caveats on the use of these tables
Draft Version 1.0
Key ReferenceEPA 1994b U.S. Environmental Protection Agency, Emissions Standard Division, Office of Air Quality Planning and Standards, "Alternative Control
Techniques Document-- NOx Emissions from Cement Manufacturing," EPA-453/R-94-004, Research Triangle Park, NC, March 1994.
EPA 1994c U.S. Environmental Protection Agency, Emissions Standard Division, Office of Air Quality Planning and Standards, "Alternative Control Techniques Document-- NOx Emissions from Glass Manufacturing," EPA-453/R-94-037, Research Triangle Park, NC, June 1994.
EPA 1997a EPA, 1997: U.S. Environmental Protection Agency, "Mercury Study Report to Congress, Volume III: Fate and Transport of Mercury in the Environment," EPA/452/R-97-005, December 1997.
EPA 1997b EPA/OAQPS. Fabric Filter Lead Detection Guidance, EPA-454/R-98-015. September 1997
EPA 1998a EPA CEMS Cost Model, Version 3.0, U.S. Environmental Protection Agency.
EPA 1998b U.S. Environmental Protection Agency (EPA). Stationary 'Source Control Techniques Document for Fine Particulate 'Matter (EPA-68-D-98-026), October 1998. www.epa.gov/'ttn/catc/dir1/fi nepmtech.pdf.
EPA 1998c EPA, 1998: U.S. Environmental Protection Agency, "Analyzing Electric Power Generation Under the Clean Air Act Amendments, Appendix 3," March 1998.
EPA 1999 U.S. Environmental Protection Agency, Clean Air Technology Center (MD-12) Information Transfer and Program Integration Division Office of Air Quality Planning and Standard, "Nitrogen Oxides (NOx), Why and How They Are Controlled," EPA-456/F-99-006R, Research Triangle Park, NC, November 1999.
EPA 2000b U.S. Environmental Protection Agency, Controlling SO2 Emissions: A Review of Technologies, EPA/600/R-00/093, November 2000.
EPA 2002 U.S. Environmental Protection Agency, Office of Air Quality Planning and Standards, "EPA Air Pollution Control Cost Manual," 6th ed., EPA/452/B-02-001, Research Triangle Park, NC, January 2002.
EPA 2002a U.S. Environmental Protection Agency, "Documentation of EPA Modeling Applications (v.2.1) Using The Integrated Planning Model," EPA 430/R-02-004, March 2002.
EPA 2003 EPA, 2003: Methodology, Assumptions, and References--Preliminary NOx Controls Cost Estimates for Industrial Boilers, November 2003.
EPA 2003a Methodology, Assumptions and References -- Preliminary SO2 Controls Cost Estimates for Industrial Boilers, November 2003.
EPA 2004 U.S Environmental Protection Agency, Clean Air Market Division, "Updating Performance and Cost of NOx Control Technologies in the Integrated Planning Model" Paper # 137
EPA 2006a Regulatory Impact Analysis: 2006 National Ambient Air Quality Standards for Particle Pollution. October 6, 2006. http://www.epa.gov/ttn/ecas/ria.html
Page 2 of 5

Stationary Source Control Measures ReferencesSee cover note for important notes and caveats on the use of these tables
Draft Version 1.0
Key ReferenceEPA 2006b Tim Smith, EPA OAQPS, personal communication with OAQPS/SPPD Project Leads.
EPA 1986 U.S. Environmental Protection Agency, Air and Engineering Research Laboratory Identification, Assessment, and Control of Fugitive Particulate Emissions, EPA/600/8-86/023, prepared by Midwest Research Institute, August 1986.
EPRI 2002. Electric Power Research Institute. Electrostatic Precipitator Performance Model (ESPM).
ERG 2000 Palo Alto, CA
Khan, EPA. August 21, 2006. Sikander Khan, EPA/CAMD. Cost Estimates for Modification Measures to Improve Existing ESP Performance
LADCO 2005 LADCO, 2005: White Paper for Source Category: Electric Generating Units.
MARAMA, 2006 Assessment of Control Technology Options for Petroleum Refineries in the Mid-Atlantic Region. Draft Final Technical Support Document. Prepared by MACTEC Federal Programs, Inc. for MARAMA. October 13, 2006.
MACTEC 2005 Interim White Paper: Electric Generating Units, Identification and Evaluation of Candidate Control MEasures, prepared for the Midwest Regional Planning Organization by MACTEC Federal Programs, December 2005. http://www.ladco.org/reports/rpo/Regional%20Air%20Quality/White%20Papers%20March%202006/EGU_Ver4.pdf
NESCAUM 2005 Low Sulfur Heating Oil in the Northeast States: An Overview of Benefits, Costs, and Implementation Issues. NESCAUM, Boston, MA. December 2005.
NESCAUM 2005a Assessment of Technology Options for BART - eligible sources. Steam Electric Boilers, Cement Plants and Paper and Pulp Facilities. Prepared by NESCAUM in partnership with the mid-Atlantic/Northeast Visibility Union. March 2005.
NESCAUM 2006 Information from development of NESCAUM model rule for outdoor hydronic heaters. Presentation at November 16, 2006 Stakeholder Meeting.
NESCAUM 2007 Outdoor Hydronic Heater Model Regulation. http://www.nescaum.org/outdoor-hydronic-heaters
Neuffer 2006 Draft Control Table prepared by Bill Neuffer, U.S. Environmental Protection Agency, Office of Air Quality Planning and Standards, MS Word document entitled "stationary NOx list with control effieiency & cost effectiveness.doc", dated August 21, 2006
NJDEP 2005 State of New Jersey, New Jersey Department of Environmental Protection: Stationary Combustion Sources Workgroup, "A Collaborative Report Presenting Air Quality Startegies for Further Consideration by the State of New Jersey. October 31, 2005. downloaded from www.state.nj.us/dep/airworkgroups/docs/final_scs_workgroup_report.pdf
Page 3 of 5
Stationary Source Control Measures ReferencesSee cover note for important notes and caveats on the use of these tables
Draft Version 1.0
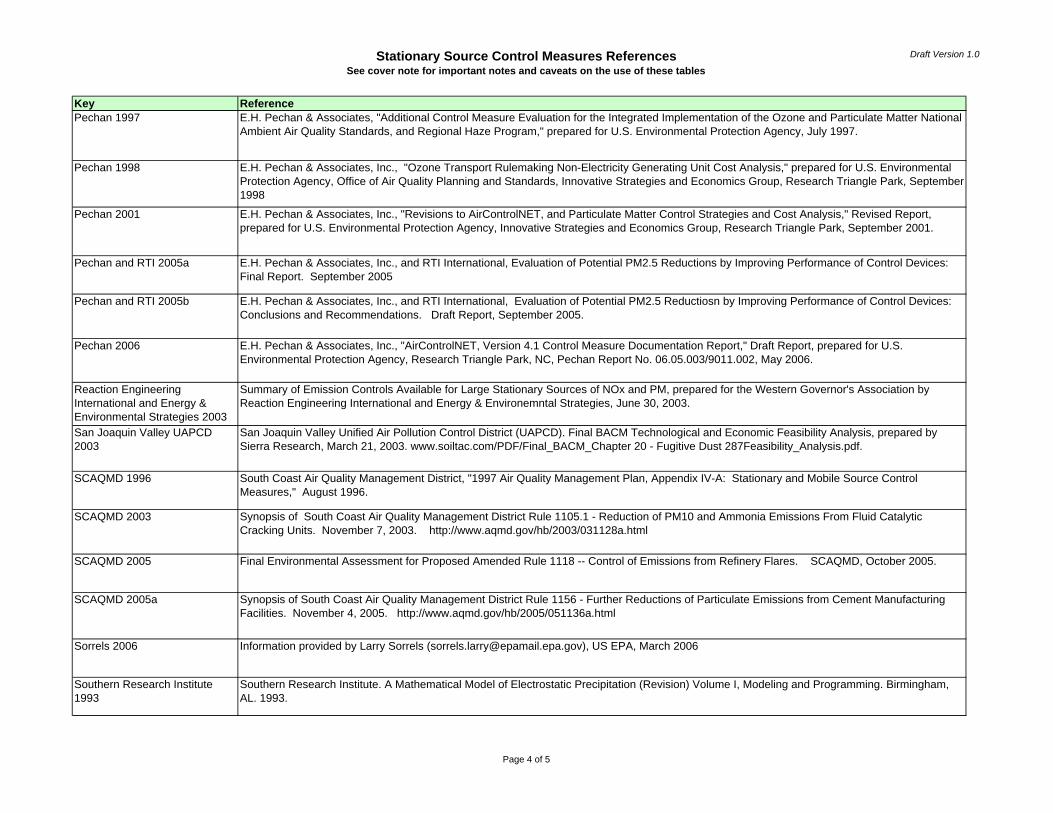
Key ReferencePechan 1997 E.H. Pechan & Associates, "Additional Control Measure Evaluation for the Integrated Implementation of the Ozone and Particulate Matter National
Ambient Air Quality Standards, and Regional Haze Program," prepared for U.S. Environmental Protection Agency, July 1997.
Pechan 1998 E.H. Pechan & Associates, Inc., "Ozone Transport Rulemaking Non-Electricity Generating Unit Cost Analysis," prepared for U.S. Environmental Protection Agency, Office of Air Quality Planning and Standards, Innovative Strategies and Economics Group, Research Triangle Park, September 1998
Pechan 2001 E.H. Pechan & Associates, Inc., "Revisions to AirControlNET, and Particulate Matter Control Strategies and Cost Analysis," Revised Report, prepared for U.S. Environmental Protection Agency, Innovative Strategies and Economics Group, Research Triangle Park, September 2001.
Pechan and RTI 2005a E.H. Pechan & Associates, Inc., and RTI International, Evaluation of Potential PM2.5 Reductions by Improving Performance of Control Devices: Final Report. September 2005
Pechan and RTI 2005b E.H. Pechan & Associates, Inc., and RTI International, Evaluation of Potential PM2.5 Reductiosn by Improving Performance of Control Devices: Conclusions and Recommendations. Draft Report, September 2005.
Pechan 2006 E.H. Pechan & Associates, Inc., "AirControlNET, Version 4.1 Control Measure Documentation Report," Draft Report, prepared for U.S. Environmental Protection Agency, Research Triangle Park, NC, Pechan Report No. 06.05.003/9011.002, May 2006.
Reaction Engineering International and Energy & Environmental Strategies 2003
Summary of Emission Controls Available for Large Stationary Sources of NOx and PM, prepared for the Western Governor's Association by Reaction Engineering International and Energy & Environemntal Strategies, June 30, 2003.
San Joaquin Valley UAPCD 2003
San Joaquin Valley Unified Air Pollution Control District (UAPCD). Final BACM Technological and Economic Feasibility Analysis, prepared by Sierra Research, March 21, 2003. www.soiltac.com/PDF/Final_BACM_Chapter 20 - Fugitive Dust 287Feasibility_Analysis.pdf.
SCAQMD 1996 South Coast Air Quality Management District, "1997 Air Quality Management Plan, Appendix IV-A: Stationary and Mobile Source Control Measures," August 1996.
SCAQMD 2003 Synopsis of South Coast Air Quality Management District Rule 1105.1 - Reduction of PM10 and Ammonia Emissions From Fluid Catalytic Cracking Units. November 7, 2003. http://www.aqmd.gov/hb/2003/031128a.html
SCAQMD 2005 Final Environmental Assessment for Proposed Amended Rule 1118 -- Control of Emissions from Refinery Flares. SCAQMD, October 2005.
SCAQMD 2005a Synopsis of South Coast Air Quality Management District Rule 1156 - Further Reductions of Particulate Emissions from Cement Manufacturing Facilities. November 4, 2005. http://www.aqmd.gov/hb/2005/051136a.html
Sorrels 2006 Information provided by Larry Sorrels ([email protected]), US EPA, March 2006
Southern Research Institute 1993
Southern Research Institute. A Mathematical Model of Electrostatic Precipitation (Revision) Volume I, Modeling and Programming. Birmingham, AL. 1993.
Page 4 of 5

Stationary Source Control Measures ReferencesSee cover note for important notes and caveats on the use of these tables
Draft Version 1.0
Key ReferenceSTAPPA/ALAPCO 2006 Controlling Fine Particulate Matter Under the Clean Air Act: A Menu of Options, STAPPA/ALAPCO, March 2006.
Staudt 1998 Staudt, James E., “Status Report on NOx Control Technologies and Cost Effectiveness for Utility Boilers,” Andover Technology Partners, North Andover, MA, prepared for NESCAUM and MARAMA, June 1998.
Ventura County 2004 Ventura County, "Final Staff Report: Proposed New Rule 74.25, Restaurant Cooking Operations Proposed Revisions to Rule 23, Exemptions From Permit", August 31, 2004.
WRAP 2006 Western Regional Air Partnership (WRAP). WRAP Fugitive Dust Handbook, prepared by Countess Environmental, September 7, 2006.
References Related to Improved Source MonitoringBarr and Schaffner 2003 Barr, Leigh and Karen Schaffner, “Impact of Improved Monitoring on PM2.5 Emissions,” RTI International, memorandum to Barrett Parker, U.S.
Environmental Protection Agency, Research Triangle Park, NC, December 8, 2003.
EPA 2000a U.S. Environmental Protection Agency, “Current Knowledge of Particulate Matter (PM) Continuous Emissions Monitoring,” Chapter 9, PM CEMS Cost, September 8, 2000.
EPA 1998d U.S. Environmental Protection Agency. Technical Guidance Document: Compliance Assurance Monitoring and appendices. Office of Air Quality Planning and Standards, Research Triangle Park, NC. August 1998. http://www.epa.gov/ttn/emc/cam.html.
McRanie, 2000. McRanie, R. Electrostatic Precipitator Compliance Assurance Monitoring Protocol. RMB Consulting and Research, Inc., Raleigh, NC. March 2000
EPRI, 1999. Electric Power Research Institute. Compliance Assurance Monitoring Field Test Program (TE-114178). Palo Alto, CA. November 1999.
EPA, 2005 Technical Support Document for Title V Permitting of Printing Facilities Including Appendices A-G, Office of Air Quality Planning and Standards, U.S. Environmental Protection Agency, Research Triangle Park, NC 27711, January 2005, http://www.epa.gov/ttn/emc/cam.html).
EPA, 2006c EPA Monitoring Knowledge Base (http://cfpub.epa.gov/mkb/), Technology Transfer Network, Monitoring information presented by industry type andby control technique, 2006.
Page 5 of 5
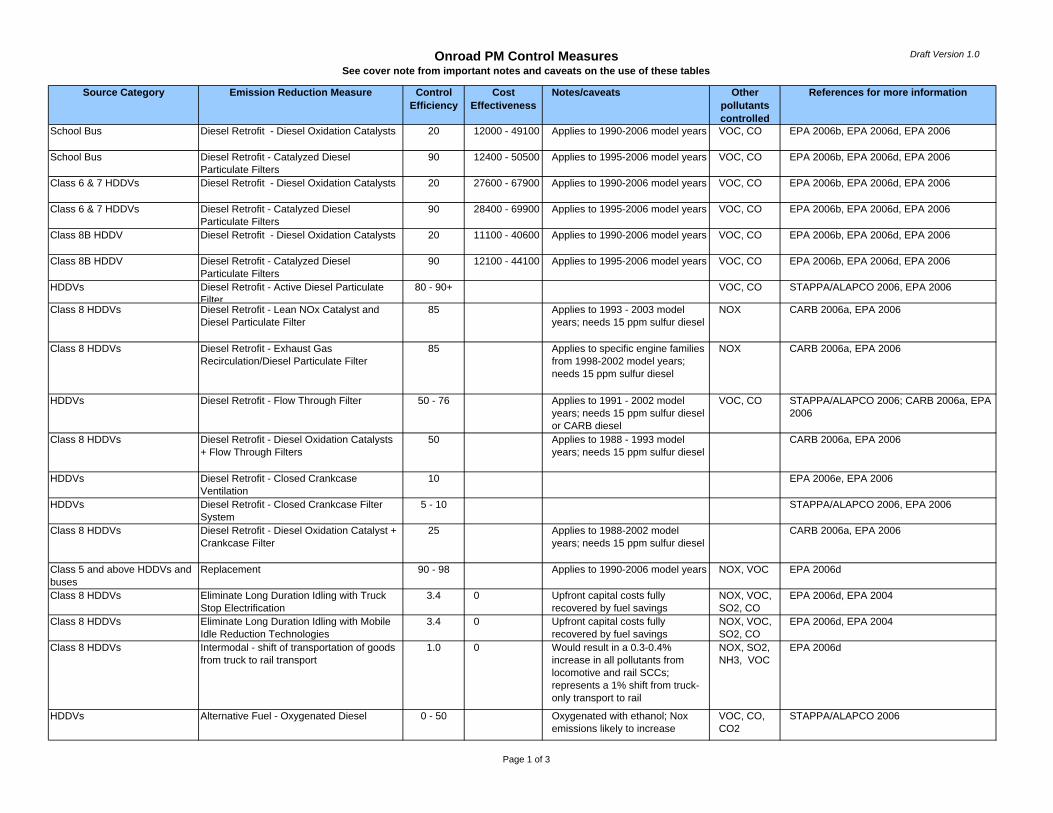
Onroad PM Control MeasuresSee cover note from important notes and caveats on the use of these tables
Draft Version 1.0
Source Category Emission Reduction Measure Control Efficiency
Cost Effectiveness
Notes/caveats Other pollutants controlled
References for more information
School Bus Diesel Retrofit - Diesel Oxidation Catalysts 20 12000 - 49100 Applies to 1990-2006 model years VOC, CO EPA 2006b, EPA 2006d, EPA 2006
School Bus Diesel Retrofit - Catalyzed Diesel Particulate Filters
90 12400 - 50500 Applies to 1995-2006 model years VOC, CO EPA 2006b, EPA 2006d, EPA 2006
Class 6 & 7 HDDVs Diesel Retrofit - Diesel Oxidation Catalysts 20 27600 - 67900 Applies to 1990-2006 model years VOC, CO EPA 2006b, EPA 2006d, EPA 2006
Class 6 & 7 HDDVs Diesel Retrofit - Catalyzed Diesel Particulate Filters
90 28400 - 69900 Applies to 1995-2006 model years VOC, CO EPA 2006b, EPA 2006d, EPA 2006
Class 8B HDDV Diesel Retrofit - Diesel Oxidation Catalysts 20 11100 - 40600 Applies to 1990-2006 model years VOC, CO EPA 2006b, EPA 2006d, EPA 2006
Class 8B HDDV Diesel Retrofit - Catalyzed Diesel Particulate Filters
90 12100 - 44100 Applies to 1995-2006 model years VOC, CO EPA 2006b, EPA 2006d, EPA 2006
HDDVs Diesel Retrofit - Active Diesel Particulate Filter
80 - 90+ VOC, CO STAPPA/ALAPCO 2006, EPA 2006
Class 8 HDDVs Diesel Retrofit - Lean NOx Catalyst and Diesel Particulate Filter
85 Applies to 1993 - 2003 model years; needs 15 ppm sulfur diesel
NOX CARB 2006a, EPA 2006
Class 8 HDDVs Diesel Retrofit - Exhaust Gas Recirculation/Diesel Particulate Filter
85 Applies to specific engine families from 1998-2002 model years; needs 15 ppm sulfur diesel
NOX CARB 2006a, EPA 2006
HDDVs Diesel Retrofit - Flow Through Filter 50 - 76 Applies to 1991 - 2002 model years; needs 15 ppm sulfur diesel or CARB diesel
VOC, CO STAPPA/ALAPCO 2006; CARB 2006a, EPA 2006
Class 8 HDDVs Diesel Retrofit - Diesel Oxidation Catalysts + Flow Through Filters
50 Applies to 1988 - 1993 model years; needs 15 ppm sulfur diesel
CARB 2006a, EPA 2006
HDDVs Diesel Retrofit - Closed Crankcase Ventilation
10 EPA 2006e, EPA 2006
HDDVs Diesel Retrofit - Closed Crankcase Filter System
5 - 10 STAPPA/ALAPCO 2006, EPA 2006
Class 8 HDDVs Diesel Retrofit - Diesel Oxidation Catalyst + Crankcase Filter
25 Applies to 1988-2002 model years; needs 15 ppm sulfur diesel
CARB 2006a, EPA 2006
Class 5 and above HDDVs and buses
Replacement 90 - 98 Applies to 1990-2006 model years NOX, VOC EPA 2006d
Class 8 HDDVs Eliminate Long Duration Idling with Truck Stop Electrification
3.4 0 Upfront capital costs fully recovered by fuel savings
NOX, VOC, SO2, CO
EPA 2006d, EPA 2004
Class 8 HDDVs Eliminate Long Duration Idling with Mobile Idle Reduction Technologies
3.4 0 Upfront capital costs fully recovered by fuel savings
NOX, VOC, SO2, CO
EPA 2006d, EPA 2004
Class 8 HDDVs Intermodal - shift of transportation of goods from truck to rail transport
1.0 0 Would result in a 0.3-0.4% increase in all pollutants from locomotive and rail SCCs; represents a 1% shift from truck-only transport to rail
NOX, SO2, NH3, VOC
EPA 2006d
HDDVs Alternative Fuel - Oxygenated Diesel 0 - 50 Oxygenated with ethanol; Nox emissions likely to increase
VOC, CO, CO2
STAPPA/ALAPCO 2006
Page 1 of 3
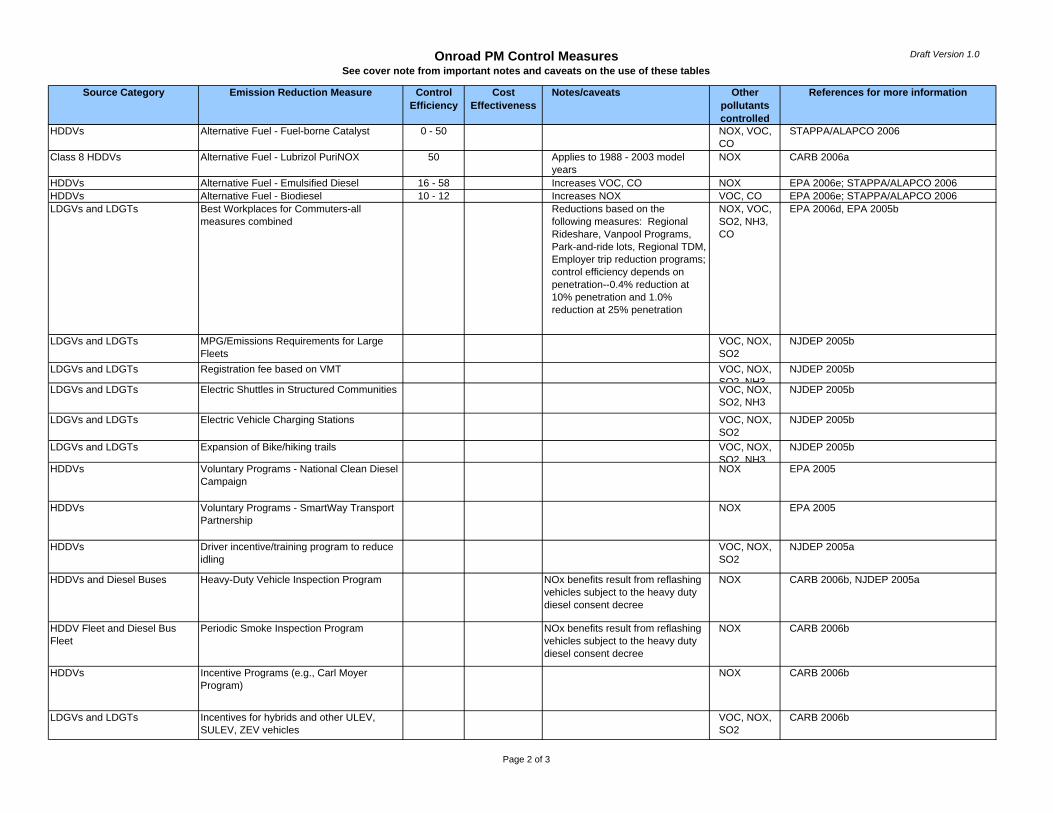
Onroad PM Control MeasuresSee cover note from important notes and caveats on the use of these tables
Draft Version 1.0
Source Category Emission Reduction Measure Control Efficiency
Cost Effectiveness
Notes/caveats Other pollutants controlled
References for more information
HDDVs Alternative Fuel - Fuel-borne Catalyst 0 - 50 NOX, VOC, CO
STAPPA/ALAPCO 2006
Class 8 HDDVs Alternative Fuel - Lubrizol PuriNOX 50 Applies to 1988 - 2003 model years
NOX CARB 2006a
HDDVs Alternative Fuel - Emulsified Diesel 16 - 58 Increases VOC, CO NOX EPA 2006e; STAPPA/ALAPCO 2006HDDVs Alternative Fuel - Biodiesel 10 - 12 Increases NOX VOC, CO EPA 2006e; STAPPA/ALAPCO 2006LDGVs and LDGTs Best Workplaces for Commuters-all
measures combined Reductions based on the
following measures: Regional Rideshare, Vanpool Programs, Park-and-ride lots, Regional TDM, Employer trip reduction programs; control efficiency depends on penetration--0.4% reduction at 10% penetration and 1.0% reduction at 25% penetration
NOX, VOC, SO2, NH3, CO
EPA 2006d, EPA 2005b
LDGVs and LDGTs MPG/Emissions Requirements for Large Fleets
VOC, NOX, SO2
NJDEP 2005b
LDGVs and LDGTs Registration fee based on VMT VOC, NOX, SO2 NH3
NJDEP 2005b
LDGVs and LDGTs Electric Shuttles in Structured Communities VOC, NOX, SO2, NH3
NJDEP 2005b
LDGVs and LDGTs Electric Vehicle Charging Stations VOC, NOX, SO2
NJDEP 2005b
LDGVs and LDGTs Expansion of Bike/hiking trails VOC, NOX, SO2 NH3
NJDEP 2005b
HDDVs Voluntary Programs - National Clean Diesel Campaign
NOX EPA 2005
HDDVs Voluntary Programs - SmartWay Transport Partnership
NOX EPA 2005
HDDVs Driver incentive/training program to reduce idling
VOC, NOX, SO2
NJDEP 2005a
HDDVs and Diesel Buses Heavy-Duty Vehicle Inspection Program NOx benefits result from reflashing vehicles subject to the heavy duty diesel consent decree
NOX CARB 2006b, NJDEP 2005a
HDDV Fleet and Diesel Bus Fleet
Periodic Smoke Inspection Program NOx benefits result from reflashing vehicles subject to the heavy duty diesel consent decree
NOX CARB 2006b
HDDVs Incentive Programs (e.g., Carl Moyer Program)
NOX CARB 2006b
LDGVs and LDGTs Incentives for hybrids and other ULEV, SULEV, ZEV vehicles
VOC, NOX, SO2
CARB 2006b
Page 2 of 3
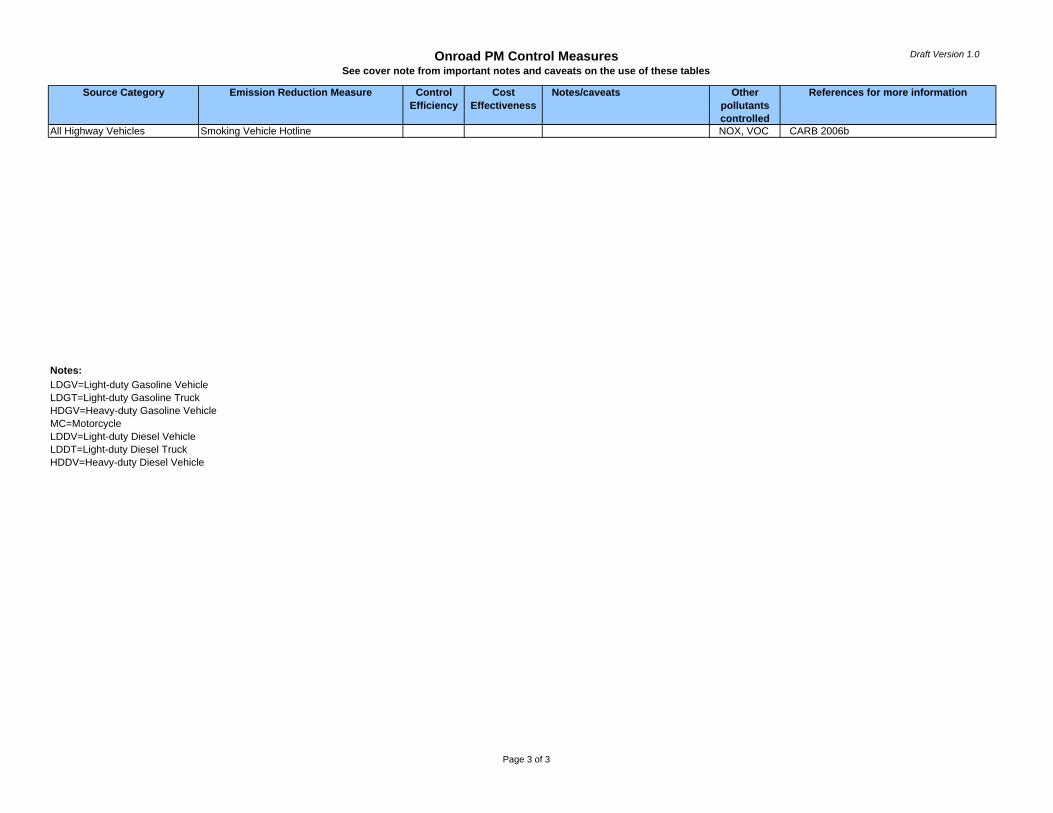
Onroad PM Control MeasuresSee cover note from important notes and caveats on the use of these tables
Draft Version 1.0
Source Category Emission Reduction Measure Control Efficiency
Cost Effectiveness
Notes/caveats Other pollutants controlled
References for more information
All Highway Vehicles Smoking Vehicle Hotline NOX, VOC CARB 2006b
Notes:LDGV=Light-duty Gasoline VehicleLDGT=Light-duty Gasoline TruckHDGV=Heavy-duty Gasoline VehicleMC=MotorcycleLDDV=Light-duty Diesel VehicleLDDT=Light-duty Diesel TruckHDDV=Heavy-duty Diesel Vehicle
Page 3 of 3
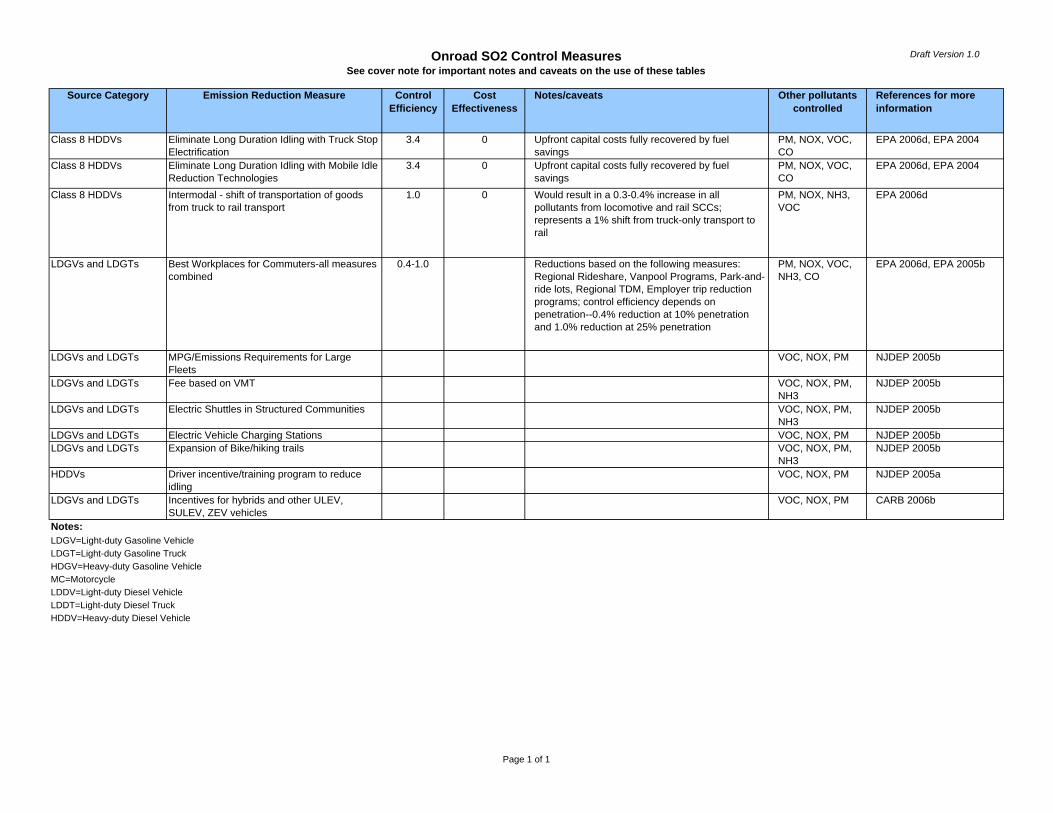
Onroad SO2 Control MeasuresSee cover note for important notes and caveats on the use of these tables
Draft Version 1.0
Source Category Emission Reduction Measure Control Efficiency
Cost Effectiveness
Notes/caveats Other pollutants controlled
References for more information
Class 8 HDDVs Eliminate Long Duration Idling with Truck Stop Electrification
3.4 0 Upfront capital costs fully recovered by fuel savings
PM, NOX, VOC, CO
EPA 2006d, EPA 2004
Class 8 HDDVs Eliminate Long Duration Idling with Mobile Idle Reduction Technologies
3.4 0 Upfront capital costs fully recovered by fuel savings
PM, NOX, VOC, CO
EPA 2006d, EPA 2004
Class 8 HDDVs Intermodal - shift of transportation of goods from truck to rail transport
1.0 0 Would result in a 0.3-0.4% increase in all pollutants from locomotive and rail SCCs; represents a 1% shift from truck-only transport to rail
PM, NOX, NH3, VOC
EPA 2006d
LDGVs and LDGTs Best Workplaces for Commuters-all measures combined
0.4-1.0 Reductions based on the following measures: Regional Rideshare, Vanpool Programs, Park-and-ride lots, Regional TDM, Employer trip reduction programs; control efficiency depends on penetration--0.4% reduction at 10% penetration and 1.0% reduction at 25% penetration
PM, NOX, VOC, NH3, CO
EPA 2006d, EPA 2005b
LDGVs and LDGTs MPG/Emissions Requirements for Large Fleets
VOC, NOX, PM NJDEP 2005b
LDGVs and LDGTs Fee based on VMT VOC, NOX, PM, NH3
NJDEP 2005b
LDGVs and LDGTs Electric Shuttles in Structured Communities VOC, NOX, PM, NH3
NJDEP 2005b
LDGVs and LDGTs Electric Vehicle Charging Stations VOC, NOX, PM NJDEP 2005bLDGVs and LDGTs Expansion of Bike/hiking trails VOC, NOX, PM,
NH3NJDEP 2005b
HDDVs Driver incentive/training program to reduce idling
VOC, NOX, PM NJDEP 2005a
LDGVs and LDGTs Incentives for hybrids and other ULEV, SULEV, ZEV vehicles
VOC, NOX, PM CARB 2006b
Notes:LDGV=Light-duty Gasoline VehicleLDGT=Light-duty Gasoline TruckHDGV=Heavy-duty Gasoline VehicleMC=MotorcycleLDDV=Light-duty Diesel VehicleLDDT=Light-duty Diesel TruckHDDV=Heavy-duty Diesel Vehicle
Page 1 of 1
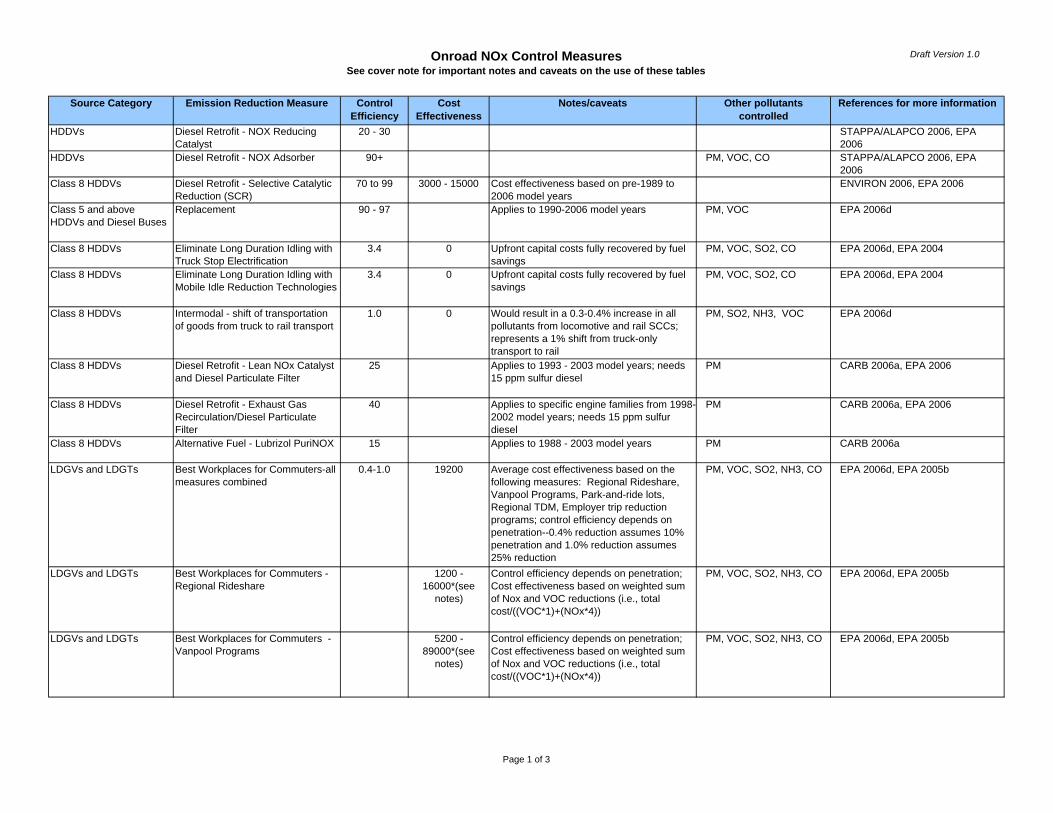
Onroad NOx Control MeasuresSee cover note for important notes and caveats on the use of these tables
Draft Version 1.0
Source Category Emission Reduction Measure Control Efficiency
Cost Effectiveness
Notes/caveats Other pollutants controlled
References for more information
HDDVs Diesel Retrofit - NOX Reducing Catalyst
20 - 30 STAPPA/ALAPCO 2006, EPA 2006
HDDVs Diesel Retrofit - NOX Adsorber 90+ PM, VOC, CO STAPPA/ALAPCO 2006, EPA 2006
Class 8 HDDVs Diesel Retrofit - Selective Catalytic Reduction (SCR)
70 to 99 3000 - 15000 Cost effectiveness based on pre-1989 to 2006 model years
ENVIRON 2006, EPA 2006
Class 5 and above HDDVs and Diesel Buses
Replacement 90 - 97 Applies to 1990-2006 model years PM, VOC EPA 2006d
Class 8 HDDVs Eliminate Long Duration Idling with Truck Stop Electrification
3.4 0 Upfront capital costs fully recovered by fuel savings
PM, VOC, SO2, CO EPA 2006d, EPA 2004
Class 8 HDDVs Eliminate Long Duration Idling with Mobile Idle Reduction Technologies
3.4 0 Upfront capital costs fully recovered by fuel savings
PM, VOC, SO2, CO EPA 2006d, EPA 2004
Class 8 HDDVs Intermodal - shift of transportation of goods from truck to rail transport
1.0 0 Would result in a 0.3-0.4% increase in all pollutants from locomotive and rail SCCs; represents a 1% shift from truck-only transport to rail
PM, SO2, NH3, VOC EPA 2006d
Class 8 HDDVs Diesel Retrofit - Lean NOx Catalyst and Diesel Particulate Filter
25 Applies to 1993 - 2003 model years; needs 15 ppm sulfur diesel
PM CARB 2006a, EPA 2006
Class 8 HDDVs Diesel Retrofit - Exhaust Gas Recirculation/Diesel Particulate Filter
40 Applies to specific engine families from 1998-2002 model years; needs 15 ppm sulfur diesel
PM CARB 2006a, EPA 2006
Class 8 HDDVs Alternative Fuel - Lubrizol PuriNOX 15 Applies to 1988 - 2003 model years PM CARB 2006a
LDGVs and LDGTs Best Workplaces for Commuters-all measures combined
0.4-1.0 19200 Average cost effectiveness based on the following measures: Regional Rideshare, Vanpool Programs, Park-and-ride lots, Regional TDM, Employer trip reduction programs; control efficiency depends on penetration--0.4% reduction assumes 10% penetration and 1.0% reduction assumes 25% reduction
PM, VOC, SO2, NH3, CO EPA 2006d, EPA 2005b
LDGVs and LDGTs Best Workplaces for Commuters - Regional Rideshare
1200 - 16000*(see
notes)
Control efficiency depends on penetration; Cost effectiveness based on weighted sum of Nox and VOC reductions (i.e., total cost/((VOC*1)+(NOx*4))
PM, VOC, SO2, NH3, CO EPA 2006d, EPA 2005b
LDGVs and LDGTs Best Workplaces for Commuters - Vanpool Programs
5200 - 89000*(see
notes)
Control efficiency depends on penetration; Cost effectiveness based on weighted sum of Nox and VOC reductions (i.e., total cost/((VOC*1)+(NOx*4))
PM, VOC, SO2, NH3, CO EPA 2006d, EPA 2005b
Page 1 of 3
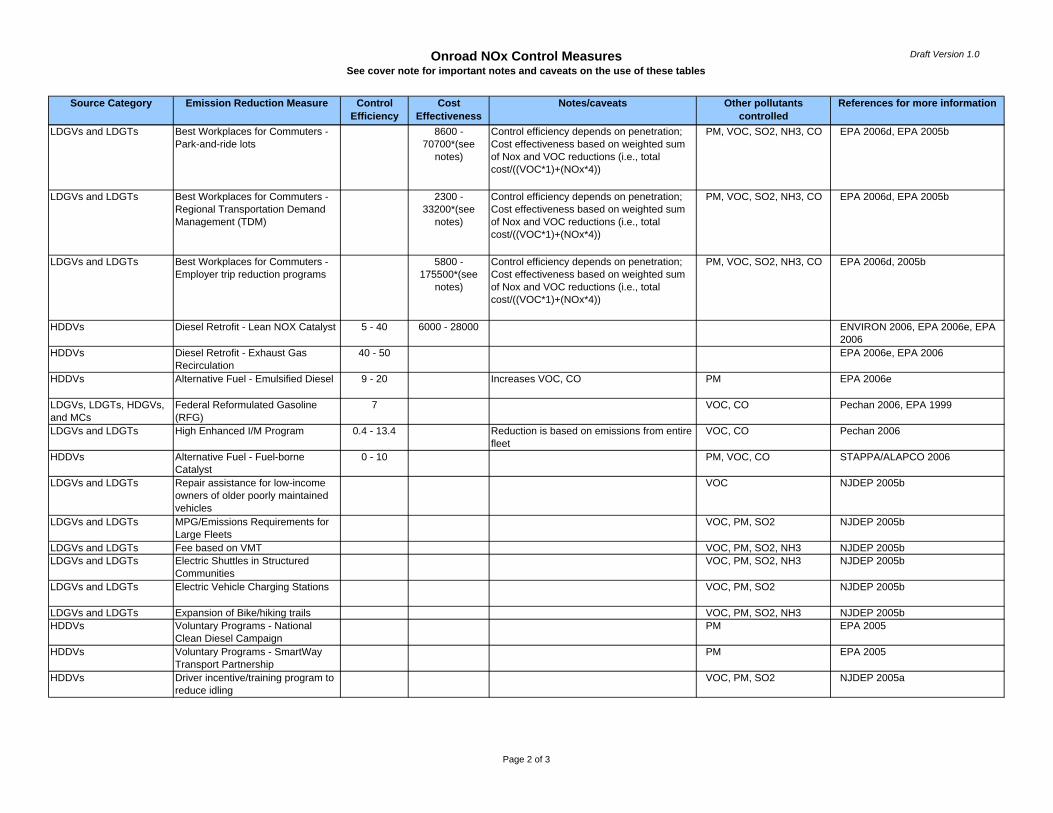
Onroad NOx Control MeasuresSee cover note for important notes and caveats on the use of these tables
Draft Version 1.0
Source Category Emission Reduction Measure Control Efficiency
Cost Effectiveness
Notes/caveats Other pollutants controlled
References for more information
LDGVs and LDGTs Best Workplaces for Commuters - Park-and-ride lots
8600 - 70700*(see
notes)
Control efficiency depends on penetration; Cost effectiveness based on weighted sum of Nox and VOC reductions (i.e., total cost/((VOC*1)+(NOx*4))
PM, VOC, SO2, NH3, CO EPA 2006d, EPA 2005b
LDGVs and LDGTs Best Workplaces for Commuters - Regional Transportation Demand Management (TDM)
2300 - 33200*(see
notes)
Control efficiency depends on penetration; Cost effectiveness based on weighted sum of Nox and VOC reductions (i.e., total cost/((VOC*1)+(NOx*4))
PM, VOC, SO2, NH3, CO EPA 2006d, EPA 2005b
LDGVs and LDGTs Best Workplaces for Commuters - Employer trip reduction programs
5800 - 175500*(see
notes)
Control efficiency depends on penetration; Cost effectiveness based on weighted sum of Nox and VOC reductions (i.e., total cost/((VOC*1)+(NOx*4))
PM, VOC, SO2, NH3, CO EPA 2006d, 2005b
HDDVs Diesel Retrofit - Lean NOX Catalyst 5 - 40 6000 - 28000 ENVIRON 2006, EPA 2006e, EPA 2006
HDDVs Diesel Retrofit - Exhaust Gas Recirculation
40 - 50 EPA 2006e, EPA 2006
HDDVs Alternative Fuel - Emulsified Diesel 9 - 20 Increases VOC, CO PM EPA 2006e
LDGVs, LDGTs, HDGVs, and MCs
Federal Reformulated Gasoline (RFG)
7 VOC, CO Pechan 2006, EPA 1999
LDGVs and LDGTs High Enhanced I/M Program 0.4 - 13.4 Reduction is based on emissions from entire fleet
VOC, CO Pechan 2006
HDDVs Alternative Fuel - Fuel-borne Catalyst
0 - 10 PM, VOC, CO STAPPA/ALAPCO 2006
LDGVs and LDGTs Repair assistance for low-income owners of older poorly maintained vehicles
VOC NJDEP 2005b
LDGVs and LDGTs MPG/Emissions Requirements for Large Fleets
VOC, PM, SO2 NJDEP 2005b
LDGVs and LDGTs Fee based on VMT VOC, PM, SO2, NH3 NJDEP 2005bLDGVs and LDGTs Electric Shuttles in Structured
CommunitiesVOC, PM, SO2, NH3 NJDEP 2005b
LDGVs and LDGTs Electric Vehicle Charging Stations VOC, PM, SO2 NJDEP 2005b
LDGVs and LDGTs Expansion of Bike/hiking trails VOC, PM, SO2, NH3 NJDEP 2005bHDDVs Voluntary Programs - National
Clean Diesel CampaignPM EPA 2005
HDDVs Voluntary Programs - SmartWay Transport Partnership
PM EPA 2005
HDDVs Driver incentive/training program to reduce idling
VOC, PM, SO2 NJDEP 2005a
Page 2 of 3

Onroad NOx Control MeasuresSee cover note for important notes and caveats on the use of these tables
Draft Version 1.0
Source Category Emission Reduction Measure Control Efficiency
Cost Effectiveness
Notes/caveats Other pollutants controlled
References for more information
All Highway Vehicles Intelligent Transport System - Speed Limit Restriction (65 mph)
TCEQ2006
HDDVs and Diesel Buses Heavy-Duty Vehicle Inspection Program
NOx benefits result from reflashing vehicles subject to the heavy duty diesel consent decree
PM CARB 2006b, NJDEP 2005a
HDDV Fleet, and Diesel Bus Fleet
Periodic Smoke Inspection Program
NOx benefits result from reflashing vehicles subject to the heavy duty diesel consent decree
PM CARB 2006b
HDDVs Software Upgrade for Diesel Trucks ("Chip Reflash")
1800 - 2500 Rebuild kits are free to any truck operator requesting one from truck manufacturer as a result of the Consent Decree with EPA. Each kit costs about $20-$30/vehicle.
CARB 2006b, OTC 2006
HDDVs Incentive Programs (e.g., Carl Moyer Program)
PM CARB 2006b
LDGVs and LDGTs Incentives for hybrids and other ULEV, SULEV, ZEV vehicles
VOC, PM, SO2 CARB 2006b
All Highway Vehicles Smoking Vehicle Hotline VOC, PM CARB 2006b
Notes:LDGV=Light-duty Gasoline VehicleLDGT=Light-duty Gasoline TruckHDGV=Heavy-duty Gasoline VehicleMC=MotorcycleLDDV=Light-duty Diesel VehicleLDDT=Light-duty Diesel TruckHDDV=Heavy-duty Diesel Vehicle
Page 3 of 3
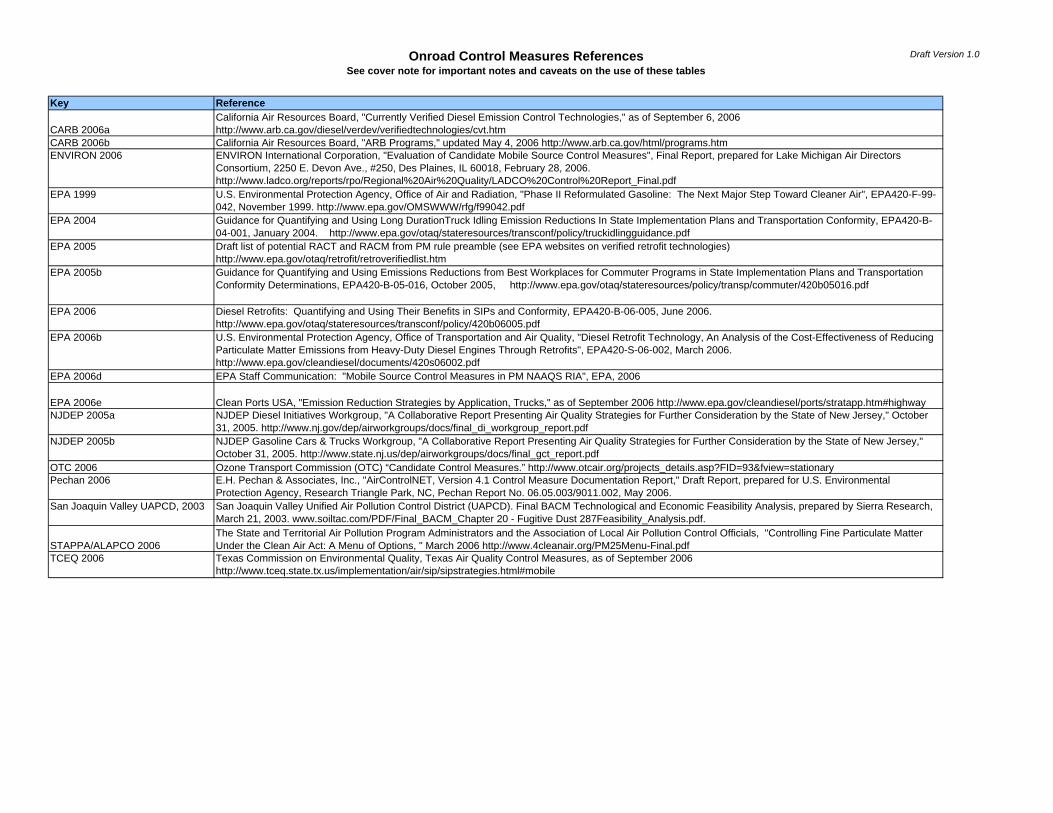
Onroad Control Measures ReferencesSee cover note for important notes and caveats on the use of these tables
Draft Version 1.0
Key Reference
CARB 2006aCalifornia Air Resources Board, "Currently Verified Diesel Emission Control Technologies," as of September 6, 2006 http://www.arb.ca.gov/diesel/verdev/verifiedtechnologies/cvt.htm
CARB 2006b California Air Resources Board, "ARB Programs," updated May 4, 2006 http://www.arb.ca.gov/html/programs.htmENVIRON 2006 ENVIRON International Corporation, "Evaluation of Candidate Mobile Source Control Measures", Final Report, prepared for Lake Michigan Air Directors
Consortium, 2250 E. Devon Ave., #250, Des Plaines, IL 60018, February 28, 2006. http://www.ladco.org/reports/rpo/Regional%20Air%20Quality/LADCO%20Control%20Report_Final.pdf
EPA 1999 U.S. Environmental Protection Agency, Office of Air and Radiation, "Phase II Reformulated Gasoline: The Next Major Step Toward Cleaner Air", EPA420-F-99-042, November 1999. http://www.epa.gov/OMSWWW/rfg/f99042.pdf
EPA 2004 Guidance for Quantifying and Using Long DurationTruck Idling Emission Reductions In State Implementation Plans and Transportation Conformity, EPA420-B-04-001, January 2004. http://www.epa.gov/otaq/stateresources/transconf/policy/truckidlingguidance.pdf
EPA 2005 Draft list of potential RACT and RACM from PM rule preamble (see EPA websites on verified retrofit technologies) http://www.epa.gov/otaq/retrofit/retroverifiedlist.htm
EPA 2005b Guidance for Quantifying and Using Emissions Reductions from Best Workplaces for Commuter Programs in State Implementation Plans and Transportation Conformity Determinations, EPA420-B-05-016, October 2005, http://www.epa.gov/otaq/stateresources/policy/transp/commuter/420b05016.pdf
EPA 2006 Diesel Retrofits: Quantifying and Using Their Benefits in SIPs and Conformity, EPA420-B-06-005, June 2006. http://www.epa.gov/otaq/stateresources/transconf/policy/420b06005.pdf
EPA 2006b U.S. Environmental Protection Agency, Office of Transportation and Air Quality, "Diesel Retrofit Technology, An Analysis of the Cost-Effectiveness of Reducing Particulate Matter Emissions from Heavy-Duty Diesel Engines Through Retrofits", EPA420-S-06-002, March 2006. http://www.epa.gov/cleandiesel/documents/420s06002.pdf
EPA 2006d EPA Staff Communication: "Mobile Source Control Measures in PM NAAQS RIA", EPA, 2006
EPA 2006e Clean Ports USA, "Emission Reduction Strategies by Application, Trucks," as of September 2006 http://www.epa.gov/cleandiesel/ports/stratapp.htm#highwayNJDEP 2005a NJDEP Diesel Initiatives Workgroup, "A Collaborative Report Presenting Air Quality Strategies for Further Consideration by the State of New Jersey," October
31, 2005. http://www.nj.gov/dep/airworkgroups/docs/final_di_workgroup_report.pdfNJDEP 2005b NJDEP Gasoline Cars & Trucks Workgroup, "A Collaborative Report Presenting Air Quality Strategies for Further Consideration by the State of New Jersey,"
October 31, 2005. http://www.state.nj.us/dep/airworkgroups/docs/final_gct_report.pdfOTC 2006 Ozone Transport Commission (OTC) “Candidate Control Measures.” http://www.otcair.org/projects_details.asp?FID=93&fview=stationaryPechan 2006 E.H. Pechan & Associates, Inc., "AirControlNET, Version 4.1 Control Measure Documentation Report," Draft Report, prepared for U.S. Environmental
Protection Agency, Research Triangle Park, NC, Pechan Report No. 06.05.003/9011.002, May 2006.San Joaquin Valley UAPCD, 2003 San Joaquin Valley Unified Air Pollution Control District (UAPCD). Final BACM Technological and Economic Feasibility Analysis, prepared by Sierra Research,
March 21, 2003. www.soiltac.com/PDF/Final_BACM_Chapter 20 - Fugitive Dust 287Feasibility_Analysis.pdf.
STAPPA/ALAPCO 2006The State and Territorial Air Pollution Program Administrators and the Association of Local Air Pollution Control Officials, "Controlling Fine Particulate Matter Under the Clean Air Act: A Menu of Options, " March 2006 http://www.4cleanair.org/PM25Menu-Final.pdf
TCEQ 2006 Texas Commission on Environmental Quality, Texas Air Quality Control Measures, as of September 2006 http://www.tceq.state.tx.us/implementation/air/sip/sipstrategies.html#mobile

Nonroad PM Control MeasuresSee cover note for important notes and caveats on the use of these tables
Source Category Emissions Reduction Measure Control Efficiency (%)
Cost Effectiveness, $/ton
Notes/Caveats Other Pollutants Controlled
References for More Information
Nonroad Diesel Engines except locomotive, marine, pleasure craft, and aircraft engine
Nonroad Retrofit DOC 20 11,600 - 63,300 Low end of range represents most cost-effective retrofits (first 50% of retrofit potential). High end of range represents least cost-effective retrofits (second 50% of retrofit potential). PM cost effectiveness values apply for all retrofit measures combined (DOC, DPF, and rebuild). Cost effectiveness values were calculated by EPA based on the cost for DOC applied to a 250 hp bulldozer. However, this measure is intended to apply to all nonroad engines, model year 1988-2007, except for locomotive, marine, pleasure craft, and aircraft engines.
VOC EPA, 2006aEPA, 2006b
Nonroad Diesel Engines except locomotive, marine, pleasure craft, and aircraft engine
Nonroad Retrofit DPF 90 9,700 - 52,700 Low end of range represents most cost-effective retrofits (first 50% of retrofit potential). High end of range represents least cost-effective retrofits (second 50% of retrofit potential). PM cost effectiveness values apply for all retrofit measures combined (DOC, DPF, and rebuild). Cost effectiveness values were calculated by EPA based on the cost for DOC applied to a 250 hp bulldozer. However, this measure is intended to apply to all nonroad engines, model year 1988-2007, except for locomotive, marine, pleasure craft, and aircraft engines.
VOC EPA, 2006aEPA, 2006b
Nonroad Diesel Engines except locomotive, marine, pleasure craft, and aircraft engine
Nonroad Engine Upgrade 20 NOx, VOC EPA, 2006a
Nonroad Diesel Engines Early Use of Ultra-Low Sulfur Diesel Some direct PM reductions would result due to lower S content of fuel SO2 EPA, 2006cNonroad Diesel Engines Early Use of Ultra-Low Sulfur Diesel +
RetrofitSome retrofits that rely on ULSD (e.g., DPFs) that have been verified by EPA and/or CARB require a S content of no more than 15-50ppm.
SO2 EPA, 2006c
Nonroad Diesel Construction Engine/Equipment Replacement (Scrappage)
2,000-25,000 Only emission reductions reported, no control efficiencies. Emission reductions and Cost effectiveness values by equipment application, horsepower and technology type are reported in Appendices to LADCO report. Cost effectiveness expressed as dollar per ton NOx reduced.
NOx ENVIRON, 2006EPA, 2005
Nonroad Diesel Engines Establish Opacity or other Emission Standards for "Gross-Emitting" Diesel Equipment or Vessels
EPA, 2005
Nonroad Engines Low Emission Specifications - Limit emissions for construction projects, industrial facilities, ship yards, airports
EPA, 2005
Nonroad Engines Expand Use of Clean Burning Fuels EPA, 2005Nonroad Gasoline Equipment Replacement - Lawn
Mower Buy Back ProgramProgram encourages trading of gasoline-powered mowers by providing funds to offset the purchase cost of electric mowers.
SCAQMD, 2006
Recreational Marine Variable Registration Fees for Boat Engines
This control measure would require owners to register boat engines. The boat engine registration fee schedule would be designed so that lower fees would be assessed for the newest engines.
VOC NJDEP, 2005
Nonroad Diesel Industrial Operational Changes at Ports - Reduce Use of Mobile Diesel-powered Material-Handling Equipment
Reduce use of mobile diesel-powered material-handling equipment in favor of electric-powered stationary cranes. No emission reduction or cost information provided.
STAPPA/ALAPCO, 2006CARB, 2005
Nonroad Diesel Industrial ARB Cargo Handling Equipment Rule -Application of Best Available Control Technology
25-85 6,500-18,000 Range of CE values represents Level 1, 2 and 3, which are three benchmarks that control systems can be verified to. Cost effectiveness expressed as dollar per ton of NOx + diesel PM reduced.
NOx CARB, 2006
Locomotives Idling Reduction - SmartStart and Diesel Driven Heating System
40-60 809 Idle reduction technologies can reduce idling up to 90 percent, depending on which technology is employed in which application. Control efficiencies provided correspond to a 90 percent reduction in idling, which is expected to reduce fuel consumption by 40 to 60 percent. PM and NOx cost per ton is an upper bound value, since savings due to reduced maintenance costs not accounted for.
NOx NJDEP, 2005Union Pacific, 2006Vancouver, 2005, EPA 2004
Locomotives Reduce Idling for Locomotives EPA, 2005; EPA 2004Locomotives I&M for Locomotives - Conduct
Opacity Testing and Conduct RepairsThis program is a voluntary agreement with the BNSF Railway Company and the Union Pacific Railroad Company to reduce PM emissions in California rail yards.
STAPPA/ALAPCO, 2006CARB, 2005
Switch Locomotive Upgrade Engines in Switcher Locomotives - Diesel-electric hybrid locomotives
80 6,500-18,000 Hybrid switch locomotives have significantly reduced diesel PM and NOx emissions, idling time, and fuel use compared to conventional switchers. Cost effectiveness expressed as dollar per ton of NOx + diesel PM reduced.
NOx CARB, 2006
Page 1 of 2

Nonroad PM Control MeasuresSee cover note for important notes and caveats on the use of these tables
Source Category Emissions Reduction Measure Control Efficiency (%)
Cost Effectiveness, $/ton
Notes/Caveats Other Pollutants Controlled
References for More Information
Switch Locomotive Upgrade Engines in Switcher Locomotives - Install multiple off-road diesel engines
80 6,500-18,000 Remanufactured switchers are powered with two or three (700 hp) Tier 3 non-road diesel engines call gen-sets instead of conventional diesel locomotive engines. Gen-set locomotive manufacturers report that these locomotives can reduce fuel consumption by 20 to 35 percent. Cost effectiveness expressed as dollar per ton of NOx + diesel PM reduced.
NOx CARB, 2006
Locomotives Locomotive Retrofit - DPF >85 Has not been tested or used in rail yard applications in the U.S. CARB, 2006Locomotives Locomotive Retrofit - DOC 20-50 Has not been tested or used in rail yard applications in the U.S. CARB, 2006Locomotives Use of Alternative Fuels - Biodiesel >50 6,500-18,000 Biodiesel generally results in a NOx increase, and is best used in
combination with NOx control strategies. Cost effectiveness expressed as dollar per ton of NOx + diesel PM reduced.
CARB, 2006
Locomotives Use of Alternative Fuels - Fisher-Tropsch Diesel
6,500-18,000 Made from converting synthetic gas to a liquid hydrocarbon diesel, this synthetic diesel fuel contains less than 10 ppm sulfur, which directly reduces diesel PM and SOx emissions. Cost effectiveness expressed as dollar per ton of NOx + diesel PM reduced.
CARB, 2006
Commercial Marine Vessels Add-On Controls - DPF >85 CARB, 2006Commercial Marine Vessels Add-On Controls - DOC ~30 CARB, 2006Commercial Marine Vessels-Harbor Vessels Cleaner Marine Fuels - Emulsified
Diesel Fuel ARB estimates that emulsified diesel fuel used in on-road engines can reduce NOx by 15 percent and PM by 50 percent. Additional testing is required to determine whether similar reductions are possible in marine engines.
CARB, 2006
Commercial Marine Vessels-Harbor Vessels Cleaner Marine Fuels - Biodiesel >50 Generally results in a NOx increase. Biodiesel is best used in combination with NOx control strategies.
CARB, 2006
Commercial Marine Vessels-Harbor Vessels Cleaner Marine Fuels - Compressed or liquefied natural gas or diesel/CNG dual fuel
Can result in significant reductions in NOx and PM. The results vary with specific application and the ratio of diesel to CNG used. Additional testing is required to determine whether similar reductions are possible in marine engines.
CARB, 2006
Commercial Marine Vessels-Ocean Going Vessels
Cleaner Marine Fuels for Main Engines - Marine distillate fuels
75 6,500-18,000 Cost effectiveness expressed as dollar per ton of NOx + diesel PM reduced.
SO2 CARB, 2006
Commercial Marine Vessels-Ocean Going Vessels
Cleaner Marine Fuels for Main Engines - Lower sulfur content
35 6,500-18,000 Control efficiencies assume use of lower sulfur content fuel oil of 5000 ppm. Cost effectiveness expressed as dollar per ton of NOx + diesel PM reduced.
SO2 CARB, 2006
Commercial Marine Vessels-Ocean Going Vessels
Cleaner Marine Fuels for Auxiliary Engines - Lower sulfur content
35 6,500-18,000 Control efficiencies assume use of lower sulfur content fuel oil of 5000 ppm. Cost effectiveness expressed as dollar per ton of NOx + diesel PM reduced.
SO2 CARB, 2006
Commercial Marine VesselsRecreational Marine
Reduce Fuel Sulfur Content for Smaller Commercial and Recreational Vessels
10 Emission reductions based on assumption that current sulfur level of 3,000 parts per million (ppm) is reduced to 500 and to 15 ppm.
SO2 NJDEP, 2005
Commercial Marine Vessels-Ocean Going Vessels
Shore Based Electrical Power - Cold Ironing
90 6,500-18,000 ARB assumes 90% control and participation of 20% of fleet in 2010 and 80% of fleet in 2020. Cost effectiveness expressed as dollar per ton of NOx + diesel PM reduced.
NOx CARB, 2006
Commercial Marine Vessels-Harbor Vessels Shore Based Electrical Power - Cold Ironing
12-27 No cost effectiveness values provided; likely to be cost-effective for ships that frequently visit ports equipped with shore power. Control efficiencies based on participation of 40% of tugboat fleet in 2010 and 80-100% of tugboat fleet in 2025.
NOx CARB, 2006
Commercial Marine Vessels Shore Based Electrical Power - Cold Ironing
83-97 69,000 (average)16,000 (average weighted across all ships in study)
Cost effectiveness expressed as dollar per ton of VOC, NOx, CO, PM10 and SO2 reduction combined. Cost effectiveness would improve in the case of new terminals or new vessels, due to the lack of operational, safety, and engineering challenges associated with retrofitting shore power into existing port facilities.
NOx, SO2, VOC, CO
Environ, 2004NJDEP, 2005
NOTES: Unless otherwise noted, control efficiencies represent control values per engine or equipment; overall cost effectiveness would need to account for the fraction of the fleet to which controls were applied.
AcronymsEGR - Exhaust Gas Recirculation SCR - Selective Catalytic Reduction DOC - Diesel Oxidation CatalystsDPF - Diesel Particulate FiltersCCV - Closed Crankcase VentilationAPU - Auxiliary Power UnitsGSE - Ground Support EquipmentCNG - Compressed Natural GasLPG - Liquefied Petroleum GasIMO - International Marine OrganizationULSD - Ultra-Low Sulfur Diesel
Page 2 of 2
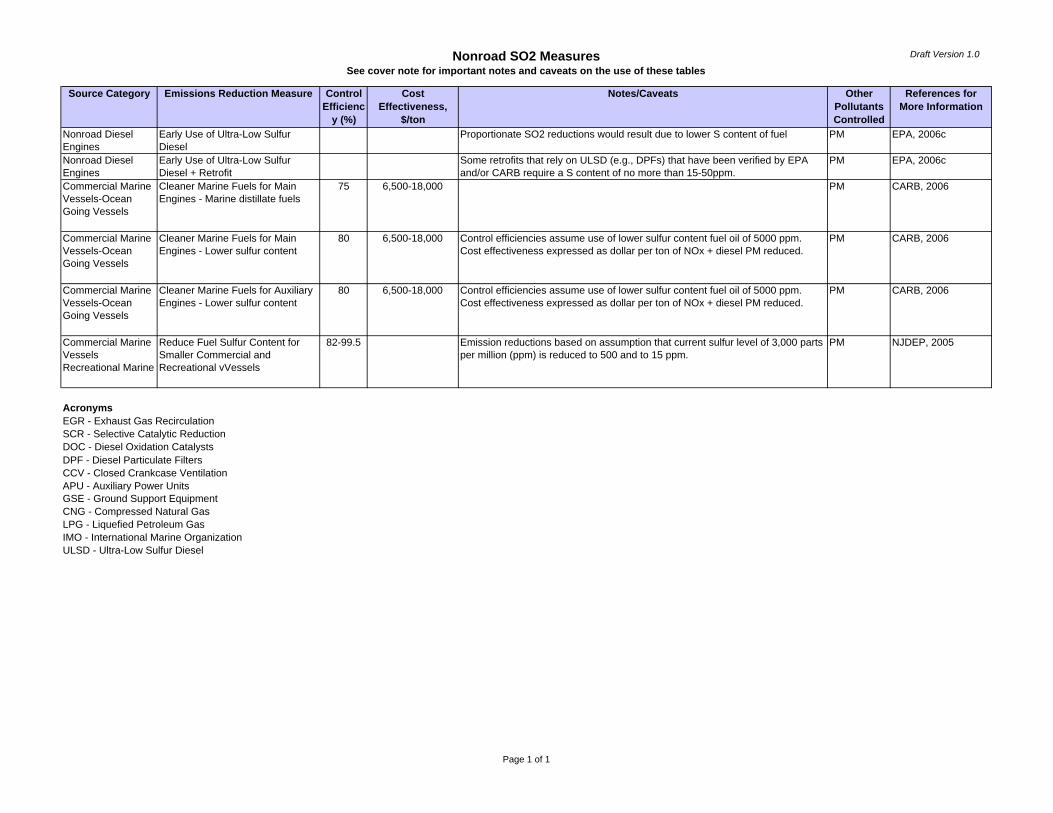
Nonroad SO2 MeasuresSee cover note for important notes and caveats on the use of these tables
Draft Version 1.0
Source Category Emissions Reduction Measure Control Efficienc
y (%)
Cost Effectiveness,
$/ton
Notes/Caveats Other Pollutants Controlled
References for More Information
Nonroad Diesel Engines
Early Use of Ultra-Low Sulfur Diesel
Proportionate SO2 reductions would result due to lower S content of fuel PM EPA, 2006c
Nonroad Diesel Engines
Early Use of Ultra-Low Sulfur Diesel + Retrofit
Some retrofits that rely on ULSD (e.g., DPFs) that have been verified by EPA and/or CARB require a S content of no more than 15-50ppm.
PM EPA, 2006c
Commercial Marine Vessels-Ocean Going Vessels
Cleaner Marine Fuels for Main Engines - Marine distillate fuels
75 6,500-18,000 PM CARB, 2006
Commercial Marine Vessels-Ocean Going Vessels
Cleaner Marine Fuels for Main Engines - Lower sulfur content
80 6,500-18,000 Control efficiencies assume use of lower sulfur content fuel oil of 5000 ppm. Cost effectiveness expressed as dollar per ton of NOx + diesel PM reduced.
PM CARB, 2006
Commercial Marine Vessels-Ocean Going Vessels
Cleaner Marine Fuels for Auxiliary Engines - Lower sulfur content
80 6,500-18,000 Control efficiencies assume use of lower sulfur content fuel oil of 5000 ppm. Cost effectiveness expressed as dollar per ton of NOx + diesel PM reduced.
PM CARB, 2006
Commercial Marine VesselsRecreational Marine
Reduce Fuel Sulfur Content for Smaller Commercial and Recreational vVessels
82-99.5 Emission reductions based on assumption that current sulfur level of 3,000 parts per million (ppm) is reduced to 500 and to 15 ppm.
PM NJDEP, 2005
AcronymsEGR - Exhaust Gas Recirculation SCR - Selective Catalytic Reduction DOC - Diesel Oxidation CatalystsDPF - Diesel Particulate FiltersCCV - Closed Crankcase VentilationAPU - Auxiliary Power UnitsGSE - Ground Support EquipmentCNG - Compressed Natural GasLPG - Liquefied Petroleum GasIMO - International Marine OrganizationULSD - Ultra-Low Sulfur Diesel
Page 1 of 1

Nonroad NOx Control MeasuresSee cover note for important notes and caveats on the use of these tables
Draft Version 1.0
Source Category Emissions Reduction Measure Control Efficiency
(%)
Cost Effectiveness,
$/ton
Notes/Caveats Other Pollutants Controlled
References for More Information
Nonroad Diesel Construction Engine/Equipment Replacement (Scrappage)
2,000-25,000 Only emission reductions reported, no control efficiencies. Emission reductions and Cost effectiveness values by equipment application, horsepower and technology type are reported in Appendices to LADCO report.
PM ENVIRON, 2006EPA, 2005
Nonroad Diesel Construction Nonroad NOx Retrofit - Lean NOx Catalyst
40 3,000-54,000 Cost effectiveness values by equipment application, horsepower and technology type reported in Appendices to LADCO report. Earlier technology type engines are generally more cost-effective.
ENVIRON, 2006EPA, 2005
Nonroad Diesel Construction Nonroad NOx Retrofit - EGR+DPF
50 7,000-108,000 Cost effectiveness values by equipment application, horsepower and technology type reported in Appendices to LADCO report. Earlier technology type engines are generally more cost-effective.
ENVIRON, 2006EPA, 2005
Nonroad Diesel Construction Nonroad NOx Retrofit - SCR 70-99 2,000-40,000 Cost effectiveness values by equipment application, horsepower and technology type reported in Appendices to LADCO report. Earlier technology type engines are generally more cost-effective.
ENVIRON, 2006EPA, 2005
Nonroad Diesel Engines Nonroad Engine Upgrade - Low end
30 1,600 Low end represents most cost-effective retrofits (first 50% of retrofit potential). Cost effectiveness based on low-end of range for DOC applied to 250 hp bulldozers. Cost effectiveness based on the same methodology as used in the PM cost effectiveness paper.
PM, VOC EPA, 2006a EPA, 2006b
Nonroad Diesel Engines Nonroad Engine Upgrade - High end
30 7,200 High end represents least cost-effective retrofits (second 50% of retrofit potential). Cost effectiveness based on average of range for DOC applied to 250 hp bulldozers. Cost effectiveness based on the same methodology as used in the PM cost effectiveness paper.
PM, VOC EPA, 2006a EPA, 2006b
Nonroad Diesel "Carl Moyer/TERP"-Type Voluntary Program - Nonroad Diesel Retrofit
1,800-7,300 OTC, 2006
Nonroad Gasoline Industrial ARB Forklift and Other Industrial Equipment Rule - Tighter NOx and VOC Limits Plus Accelerated Replacement
CARB, 2006
Nonroad Diesel Construction Emulsified Diesel Fuel 18 15,000-160,000 Cost effectiveness values by equipment application, horsepower and technology type are reported in Appendices to LADCO report. Smaller horsepower and earlier technology type engines are generally more cost-effective.
ENVIRON, 2006EPA, 2005
Page 1 of 3

Nonroad NOx Control MeasuresSee cover note for important notes and caveats on the use of these tables
Draft Version 1.0
Source Category Emissions Reduction Measure Control Efficiency
(%)
Cost Effectiveness,
$/ton
Notes/Caveats Other Pollutants Controlled
References for More Information
Nonroad Diesel Construction Nonroad Idling Reduction - Automatic Shut-off Devices
Control efficiencies will be variable. For example, if 20% reduction in idling is achievable, 225 tpy NOx and 18 tpy PM2.5 reduction would result in NJ. Reduction in fuel and engine maintenance costs, increased equipment life, and decreased noise complaints. Cost of technology would be recouped within the life of the equipment, probably sooner in many cases, providing a net cost savings for equipment owner.
NJDEP, 2005
Locomotives Idling Reduction - SmartStart and Diesel Driven Heating System
40-60 $809 Idle reduction technologies can reduce idling up to 90 percent. Control efficiencies provided correspond to a 90 percent reduction in idling, which is expected to reduce fuel consumption by 40 to 60 percent. Cost per ton is an upper bound value, since savings due to reduced maintenance costs not accounted for.
PM NJDEP, 2005Union Pacific, 2006Vancouver, 2005, EPA 2004
Switch Locomotive Upgrade Engines in Switcher Locomotives - Diesel-electric hybrid locomotives
80 6,500-18,000 Hybrid switch locomotives have significantly reduced diesel PM and NOx emissions, idling time, and fuel use compared to conventional switchers. Cost effectiveness expressed as dollar per ton of NOx + diesel PM reduced.
PM CARB, 2006
Switch Locomotive Upgrade Engines in Switcher Locomotives - Install multiple off-road diesel engines
80 6,500-18,000 Remanufactured switchers are powered with two or three (700 hp) Tier 3 non-road diesel engines call gen-sets instead of conventional diesel locomotive engines. Gen-set locomotive manufacturers report that these locomotives can reduce fuel consumption by 20 to 35 percent. Cost effectiveness expressed as dollar per ton of NOx + diesel PM reduced.
PM CARB, 2006
Commercial Marine Vessels Add-On Controls - SCR 65-90 May reduce diesel PM emissions. PM CARB, 2006Commercial Marine Vessels-Ocean Going Vessels
Cleaner Marine Fuels - Emulsified Diesel Fuel
30 6,500-18,000 Slight increase in fuel consumption and PM emissions. Cost effectiveness expressed as dollar per ton of NOx + diesel PM reduced.
CARB, 2006
Commercial Marine Vessels-Harbor Vessels
Cleaner Marine Fuels - Emulsified Diesel Fuel
ARB estimates that emulsified diesel fuel used in on-road engines can reduce NOx by 15 percent and PM by 50 percent. Additional testing is required to determine whether similar reductions are possible in marine engines.
PM CARB, 2006
Commercial Marine Vessels-Ocean Going Vessels
Vessel Speed Reduction Program - Extending Speed Reduction Zones Offshore
6,500-18,000 Slower speeds reduce main engine fuel consumption and result in significant NOx reductions. There is the potential for increases in diesel PM emissions for some vessels operating at slow speeds. Cost effectiveness expressed as dollar per ton of NOx + diesel PM reduced.
CARB, 2006
Commercial Marine Vessels-Ocean Going Vessels
Shore Based Electrical Power - Cold Ironing
90 6,500-18,000 ARB assumes 90% control and participation of 20% of fleet in 2010 and 80% of fleet in 2020. Cost effectiveness expressed as dollar per ton of NOx + diesel PM reduced.
PM CARB, 2006
Commercial Marine Vessels - Ocean-Going Vessels
Shore Based Electrical Power - Cold Ironing
99 69,000 (average)16,000 (average weighted across all ships in study)
Cost effectiveness expressed as dollar per ton of VOC, NOx, CO, PM10 and SO2 reduction combined. Cost effectiveness would improve in the case of new terminals or new vessels, due to the lack of operational, safety, and engineering challenges associated with retrofitting shore power into existing port facilities.
PM NJDEP, 2005Environ, 2004
Commercial Marine Vessels-Harbor Vessels
Shore Based Electrical Power - Cold Ironing
12-27 No cost effectiveness values provided; likely to be cost-effective for ships that frequently visit ports equipped with shore power. Control efficiency represents overall control effectiveness based on participation of 40% of tugboat fleet in 2010 and 80-100% of tugboat fleet in 2025.
CARB, 2006
Commercial Marine Vessels-Ocean Going Vessels
Build or Retrofit New Ships that Far Exceed IMO Standards
90 6,500-18,000 Cost effectiveness expressed as dollar per ton of NOx + diesel PM reduced. PM CARB, 2006
Aircraft Ground Support Equipment
Alternative Fuels for Airport GSE -Replace Diesel GSE with CNG/LPG
65 1,000 - 3,000 Cost-effectiveness is expressed in dollar per ton VOC/CO/NOx combined VOC MRPO, 2005NESCAUM, 2003
Page 2 of 3
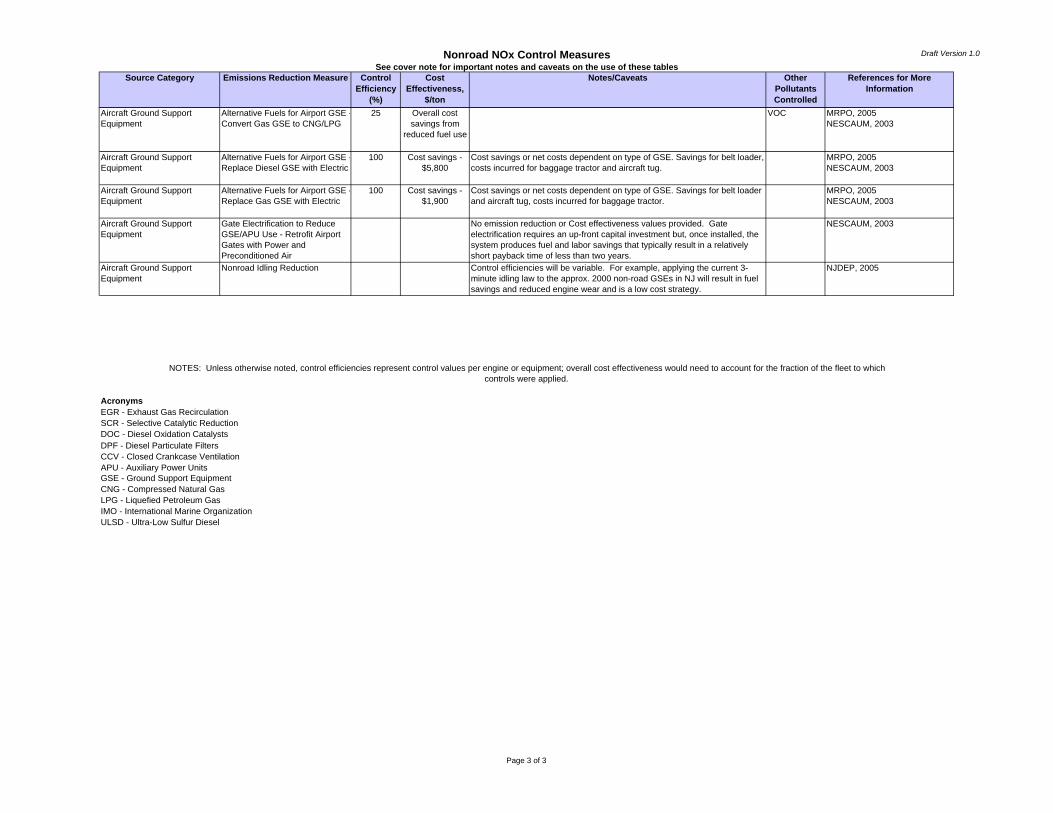
Nonroad NOx Control MeasuresSee cover note for important notes and caveats on the use of these tables
Draft Version 1.0
Source Category Emissions Reduction Measure Control Efficiency
(%)
Cost Effectiveness,
$/ton
Notes/Caveats Other Pollutants Controlled
References for More Information
Aircraft Ground Support Equipment
Alternative Fuels for Airport GSE -Convert Gas GSE to CNG/LPG
25 Overall cost savings from
reduced fuel use
VOC MRPO, 2005NESCAUM, 2003
Aircraft Ground Support Equipment
Alternative Fuels for Airport GSE -Replace Diesel GSE with Electric
100 Cost savings - $5,800
Cost savings or net costs dependent on type of GSE. Savings for belt loader, costs incurred for baggage tractor and aircraft tug.
MRPO, 2005NESCAUM, 2003
Aircraft Ground Support Equipment
Alternative Fuels for Airport GSE -Replace Gas GSE with Electric
100 Cost savings - $1,900
Cost savings or net costs dependent on type of GSE. Savings for belt loader and aircraft tug, costs incurred for baggage tractor.
MRPO, 2005NESCAUM, 2003
Aircraft Ground Support Equipment
Gate Electrification to Reduce GSE/APU Use - Retrofit Airport Gates with Power and Preconditioned Air
No emission reduction or Cost effectiveness values provided. Gate electrification requires an up-front capital investment but, once installed, the system produces fuel and labor savings that typically result in a relatively short payback time of less than two years.
NESCAUM, 2003
Aircraft Ground Support Equipment
Nonroad Idling Reduction Control efficiencies will be variable. For example, applying the current 3-minute idling law to the approx. 2000 non-road GSEs in NJ will result in fuel savings and reduced engine wear and is a low cost strategy.
NJDEP, 2005
AcronymsEGR - Exhaust Gas Recirculation SCR - Selective Catalytic Reduction DOC - Diesel Oxidation CatalystsDPF - Diesel Particulate FiltersCCV - Closed Crankcase VentilationAPU - Auxiliary Power UnitsGSE - Ground Support EquipmentCNG - Compressed Natural GasLPG - Liquefied Petroleum GasIMO - International Marine OrganizationULSD - Ultra-Low Sulfur Diesel
NOTES: Unless otherwise noted, control efficiencies represent control values per engine or equipment; overall cost effectiveness would need to account for the fraction of the fleet to which controls were applied.
Page 3 of 3

Nonroad Control Measures ReferencesSee cover note for important notes and caveats on the use of these tables
Draft Version 1.0
Key ReferenceCARB 2005 California Environmental Protection Agency, Air Resources Board (CARB). "ARB/Railroad Statewide Agreement Particulate Emissions Reduction Program at
California Rail Yards," June 2005. http://www.arb.ca.gov/railyard/083005mouexecuted.pdf
CARB 2006 California Air Resources Board, "Proposed Emission Reduction Plan for Ports and Good Movement in California, March 21, 2006 http://www.arb.ca.gov/planning/gmerp/gmerp.htm
ENVIRON 2004 “Cold Ironing Cost Effectiveness Study”, ENVIRON International Corporation, prepared for Port of Long Beach, California, March 30, 2004. http://www.polb.com/civica/filebank/blobdload.asp?BlobID=2157
ENVIRON 2006 ENVIRON International Corporation, "Evaluation of Candidate Mobile Source Control Measures", Final Report, prepared for Lake Michigan Air Directors Consortium, 2250 E. Devon Ave., #250, Des Plaines, IL 60018, February 28, 2006. http://www.ladco.org/reports/rpo/Regional%20Air%20Quality/LADCO%20Control%20Report_Final.pdf
EPA 2004 Guidance for Quantifying and Using Long-Duration Switch Yard Locomotive Idling Emission Reductions in State Implementation Plans. EPA420-B-04-002. January 2004. http://www.epa.gov/oms/smartway/idle-guid.htm
EPA 2005 Draft list of potential RACT and RACM from PM rule preamble (see EPA websites on verified retrofit technologies) http://www.epa.gov/otaq/retrofit/retroverifiedlist.htm
EPA 2006a E.H. Pechan & Associates, Inc., "PM NAAQS Modeling, Technical Memorandum", Draft Report, prepared for U.S. Environmental Protection Agency, Research Triangle Park, NC, July 2006.
EPA 2006b U.S. Environmental Protection Agency, Office of Transportation and Air Quality, "Diesel Retrofit Technology, An Analysis of the Cost-Effectiveness of Reducing Particulate Matter Emissions from Heavy-Duty Diesel Engines Through Retrofits", EPA420-S-06-002, March 2006. http://www.epa.gov/cleandiesel/documents/420s06002.pdf
EPA 2006c EPA staff communication via e-mail from R. Kapichak, OTAQ/EPA, to J. Ketcham-Colwill, OPAR/OAR/EPA on September 9, 2006
MRPO 2005 Midwest RPO, Interim White Paper - Midwest RPO Candidate Control Measures, Source Category: Airport Related Activities, December 20, 2005. http://www.ladco.org/reports/rpo/Regional%20Air%20Quality/White%20Papers%20March%202006/Airports_Operations_Ver1.pdf
NESCAUM 2003 Northeast States for Coordinated Air Use Management (NESCAUM). Controlling Airport-Related Air Pollution. June 2003. http://www.nescaum.org/documents/aviation_final_report.pdf/view?searchterm=Airport
NJDEP 2005 NJDEP Diesel Initiatives Workgroup, "A Collaborative Report Presenting Air Quality Strategies for Further Consideration by the State of New Jersey," October 31, 2005. http://www.nj.gov/dep/airworkgroups/docs/final_di_workgroup_report.pdf
Page 1 of 2

Nonroad Control Measures ReferencesSee cover note for important notes and caveats on the use of these tables
Draft Version 1.0
Key ReferenceOTC 2006 Ozone Transport Commission (OTC) “Candidate Control Measures.” http://www.otcair.org/projects_details.asp?FID=93&fview=stationary
SCAQMD 2006 South Coast Air Quality Management District (SCAQMD) Air Quality Summit, June 5 & 6, 2006. http://www.aqmd.gov/aqmp/07aqmp/aqsummit/aqsummit.html
STAPPA/ALAPCO 2006 The State and Territorial Air Pollution Program Administrators and the Association of Local Air Pollution Control Officials, "Controlling Fine Particulate Matter Under the Clean Air Act: A Menu of Options, " March 2006 http://www.4cleanair.org/PM25Menu-Final.pdf
Union Pacific 2006 “Union Pacific and the Environment” fact sheet. www.up.com
Vancouver 2005 “Vancouver, Wa. Switchyard Locomotive Idle Reduction Project, Final Report to EPA”, Southwest Clean Air Agency, Vancouver, Wa., October 18, 2005. http://www.epa.gov/SmartwayLogistics/documents/vancouver-locomotive.pdf
Page 2 of 2
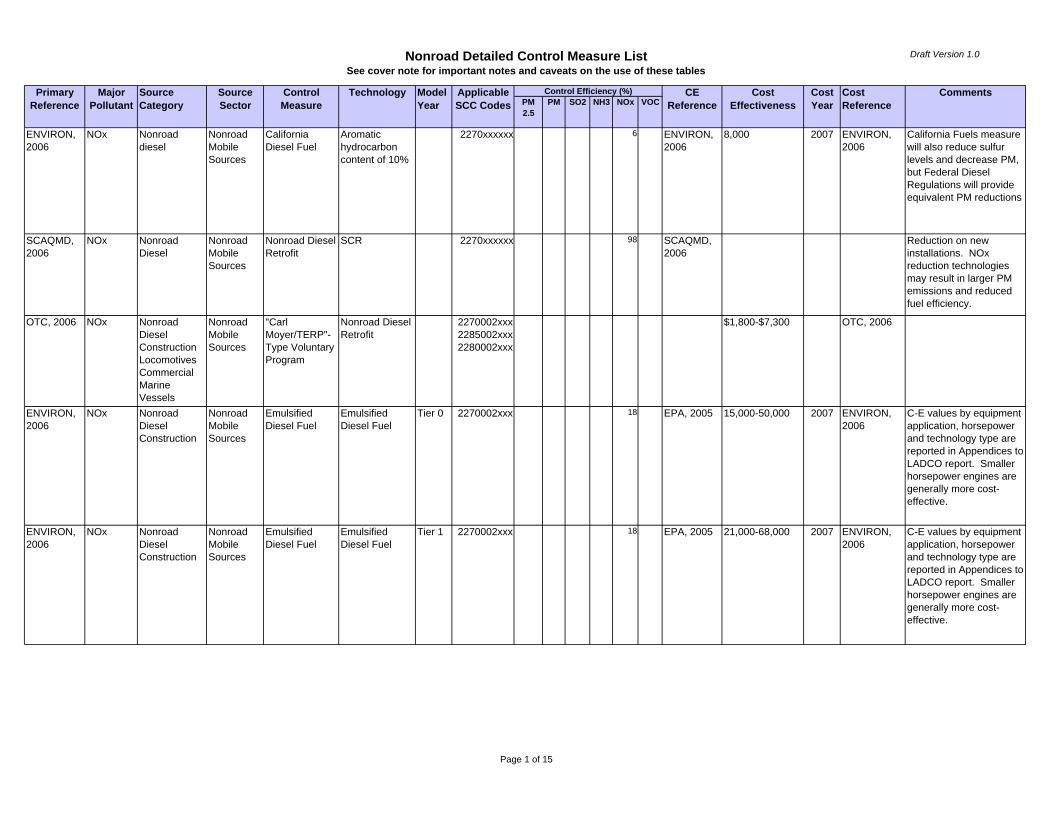
Nonroad Detailed Control Measure ListSee cover note for important notes and caveats on the use of these tables
Draft Version 1.0
PM2.5
PM SO2 NH3 NOx VOC
ENVIRON, 2006
NOx Nonroad diesel
Nonroad Mobile Sources
California Diesel Fuel
Aromatic hydrocarbon content of 10%
2270xxxxxx 6 ENVIRON, 2006
8,000 2007 ENVIRON, 2006
California Fuels measure will also reduce sulfur levels and decrease PM, but Federal Diesel Regulations will provide equivalent PM reductions
SCAQMD, 2006
NOx Nonroad Diesel
Nonroad Mobile Sources
Nonroad Diesel Retrofit
SCR 2270xxxxxx 98 SCAQMD, 2006
Reduction on new installations. NOx reduction technologies may result in larger PM emissions and reduced fuel efficiency.
OTC, 2006 NOx Nonroad Diesel ConstructionLocomotivesCommercial Marine Vessels
Nonroad Mobile Sources
"Carl Moyer/TERP"-Type Voluntary Program
Nonroad Diesel Retrofit
2270002xxx2285002xxx2280002xxx
$1,800-$7,300 OTC, 2006
ENVIRON, 2006
NOx Nonroad Diesel Construction
Nonroad Mobile Sources
Emulsified Diesel Fuel
Emulsified Diesel Fuel
Tier 0 2270002xxx 18 EPA, 2005 15,000-50,000 2007 ENVIRON, 2006
C-E values by equipment application, horsepower and technology type are reported in Appendices to LADCO report. Smaller horsepower engines are generally more cost-effective.
ENVIRON, 2006
NOx Nonroad Diesel Construction
Nonroad Mobile Sources
Emulsified Diesel Fuel
Emulsified Diesel Fuel
Tier 1 2270002xxx 18 EPA, 2005 21,000-68,000 2007 ENVIRON, 2006
C-E values by equipment application, horsepower and technology type are reported in Appendices to LADCO report. Smaller horsepower engines are generally more cost-effective.
Primary Reference
Major Pollutant
Source Category
Source Sector
CommentsControl Measure
Applicable SCC Codes
Control Efficiency (%) CE Reference
Technology Model Year
Cost Effectiveness
Cost Year
Cost Reference
Page 1 of 15

Nonroad Detailed Control Measure ListSee cover note for important notes and caveats on the use of these tables
Draft Version 1.0
PM2.5
PM SO2 NH3 NOx VOCPrimary
ReferenceMajor
PollutantSource Category
Source Sector
CommentsControl Measure
Applicable SCC Codes
Control Efficiency (%) CE Reference
Technology Model Year
Cost Effectiveness
Cost Year
Cost Reference
ENVIRON, 2006
NOx Nonroad Diesel Construction
Nonroad Mobile Sources
Emulsified Diesel Fuel
Emulsified Diesel Fuel
Tier 2 2270002xxx 18 EPA, 2005 31,000-100,000 2007 ENVIRON, 2006
C-E values by equipment application, horsepower and technology type are reported in Appendices to LADCO report. Smaller horsepower engines are generally more cost-effective.
ENVIRON, 2006
NOx Nonroad Diesel Construction
Nonroad Mobile Sources
Emulsified Diesel Fuel
Emulsified Diesel Fuel
Tier 3 2270002xxx 18 EPA, 2005 50,000-160,000 2007 ENVIRON, 2006
C-E values by equipment application, horsepower and technology type are reported in Appendices to LADCO report. Smaller horsepower engines are generally more cost-effective.
ENVIRON, 2006
NOx Nonroad Diesel Construction
Nonroad Mobile Sources
Engine/Equipment Replacement (Scrappage)
Replace Tier 0 with Tier 2 engines
Tier 0 2270002xxx EPA, 2005 2,000-8,000 2007 ENVIRON, 2006
Only emission reductions reported, no control efficiencies. Emission reductions and C-E values by equipment application, horsepower and technology type are reported in Appendices to LADCO report.
ENVIRON, 2006
NOx Nonroad Diesel Construction
Nonroad Mobile Sources
Engine/Equipment Replacement (Scrappage)
Replace Tier 1 with Tier 3 engines
Tier 1 2270002xxx EPA, 2005 4,000-11,000 2007 ENVIRON, 2006
Only emission reductions reported, no control efficiencies. Emission reductions and C-E values by equipment application, horsepower and technology type are reported in Appendices to LADCO report.
Page 2 of 15
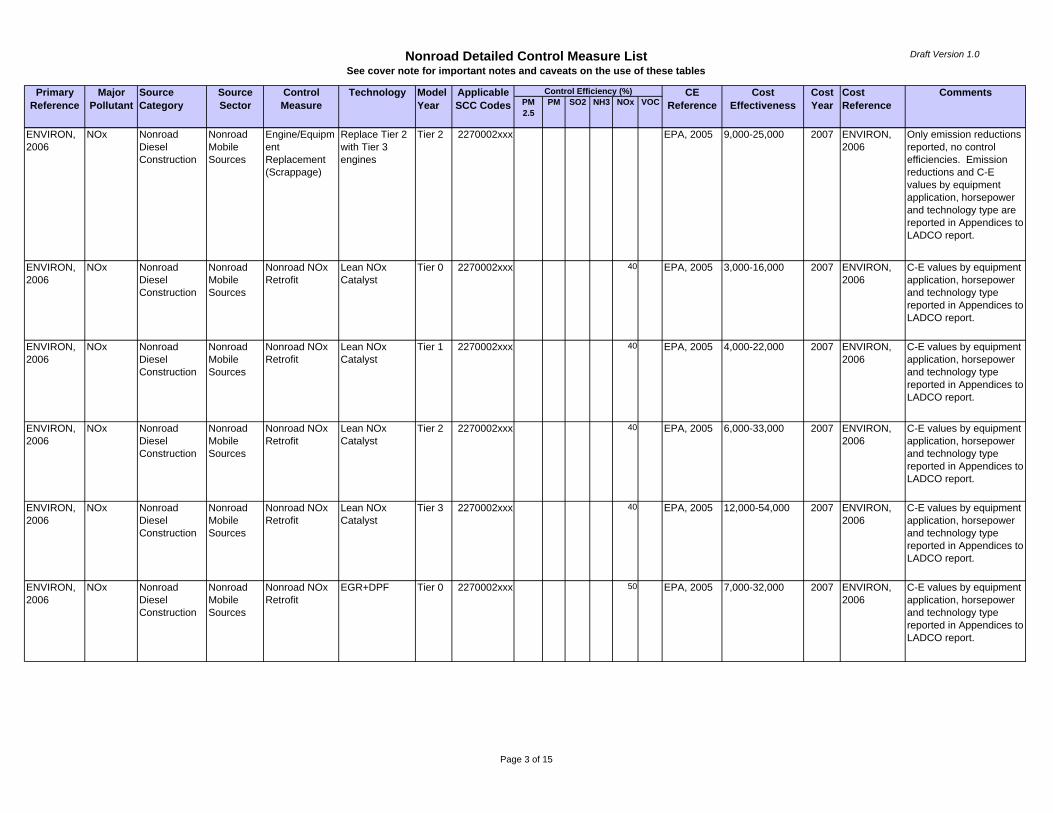
Nonroad Detailed Control Measure ListSee cover note for important notes and caveats on the use of these tables
Draft Version 1.0
PM2.5
PM SO2 NH3 NOx VOCPrimary
ReferenceMajor
PollutantSource Category
Source Sector
CommentsControl Measure
Applicable SCC Codes
Control Efficiency (%) CE Reference
Technology Model Year
Cost Effectiveness
Cost Year
Cost Reference
ENVIRON, 2006
NOx Nonroad Diesel Construction
Nonroad Mobile Sources
Engine/Equipment Replacement (Scrappage)
Replace Tier 2 with Tier 3 engines
Tier 2 2270002xxx EPA, 2005 9,000-25,000 2007 ENVIRON, 2006
Only emission reductions reported, no control efficiencies. Emission reductions and C-E values by equipment application, horsepower and technology type are reported in Appendices to LADCO report.
ENVIRON, 2006
NOx Nonroad Diesel Construction
Nonroad Mobile Sources
Nonroad NOx Retrofit
Lean NOx Catalyst
Tier 0 2270002xxx 40 EPA, 2005 3,000-16,000 2007 ENVIRON, 2006
C-E values by equipment application, horsepower and technology type reported in Appendices to LADCO report.
ENVIRON, 2006
NOx Nonroad Diesel Construction
Nonroad Mobile Sources
Nonroad NOx Retrofit
Lean NOx Catalyst
Tier 1 2270002xxx 40 EPA, 2005 4,000-22,000 2007 ENVIRON, 2006
C-E values by equipment application, horsepower and technology type reported in Appendices to LADCO report.
ENVIRON, 2006
NOx Nonroad Diesel Construction
Nonroad Mobile Sources
Nonroad NOx Retrofit
Lean NOx Catalyst
Tier 2 2270002xxx 40 EPA, 2005 6,000-33,000 2007 ENVIRON, 2006
C-E values by equipment application, horsepower and technology type reported in Appendices to LADCO report.
ENVIRON, 2006
NOx Nonroad Diesel Construction
Nonroad Mobile Sources
Nonroad NOx Retrofit
Lean NOx Catalyst
Tier 3 2270002xxx 40 EPA, 2005 12,000-54,000 2007 ENVIRON, 2006
C-E values by equipment application, horsepower and technology type reported in Appendices to LADCO report.
ENVIRON, 2006
NOx Nonroad Diesel Construction
Nonroad Mobile Sources
Nonroad NOx Retrofit
EGR+DPF Tier 0 2270002xxx 50 EPA, 2005 7,000-32,000 2007 ENVIRON, 2006
C-E values by equipment application, horsepower and technology type reported in Appendices to LADCO report.
Page 3 of 15

Nonroad Detailed Control Measure ListSee cover note for important notes and caveats on the use of these tables
Draft Version 1.0
PM2.5
PM SO2 NH3 NOx VOCPrimary
ReferenceMajor
PollutantSource Category
Source Sector
CommentsControl Measure
Applicable SCC Codes
Control Efficiency (%) CE Reference
Technology Model Year
Cost Effectiveness
Cost Year
Cost Reference
ENVIRON, 2006
NOx Nonroad Diesel Construction
Nonroad Mobile Sources
Nonroad NOx Retrofit
EGR+DPF Tier 1 2270002xxx 50 EPA, 2005 9,000-45,000 2007 ENVIRON, 2006
C-E values by equipment application, horsepower and technology type reported in Appendices to LADCO report.
ENVIRON, 2006
NOx Nonroad Diesel Construction
Nonroad Mobile Sources
Nonroad NOx Retrofit
EGR+DPF Tier 2 2270002xxx 50 EPA, 2005 13,000-66,000 2007 ENVIRON, 2006
C-E values by equipment application, horsepower and technology type reported in Appendices to LADCO report.
ENVIRON, 2006
NOx Nonroad Diesel Construction
Nonroad Mobile Sources
Nonroad NOx Retrofit
EGR+DPF Tier 3 2270002xxx 50 EPA, 2005 26,000-108,000 2007 ENVIRON, 2006
C-E values by equipment application, horsepower and technology type reported in Appendices to LADCO report.
ENVIRON, 2006
NOx Nonroad Diesel Construction
Nonroad Mobile Sources
Nonroad NOx Retrofit
SCR Tier 0 2270002xxx 70-99 EPA, 2005 2,000-12,000 2007 ENVIRON, 2006
C-E values by equipment application, horsepower and technology type reported in Appendices to LADCO report.
ENVIRON, 2006
NOx Nonroad Diesel Construction
Nonroad Mobile Sources
Nonroad NOx Retrofit
SCR Tier 1 2270002xxx 70-99 EPA, 2005 3,000-17,000 2007 ENVIRON, 2006
C-E values by equipment application, horsepower and technology type reported in Appendices to LADCO report.
ENVIRON, 2006
NOx Nonroad Diesel Construction
Nonroad Mobile Sources
Nonroad NOx Retrofit
SCR Tier 2 2270002xxx 70-99 EPA, 2005 4,000-25,000 2007 ENVIRON, 2006
C-E values by equipment application, horsepower and technology type reported in Appendices to LADCO report.
ENVIRON, 2006
NOx Nonroad Diesel Construction
Nonroad Mobile Sources
Nonroad NOx Retrofit
SCR Tier 3 2270002xxx 70-99 EPA, 2005 9,000-40,000 2007 ENVIRON, 2006
C-E values by equipment application, horsepower and technology type reported in Appendices to LADCO report.
Page 4 of 15
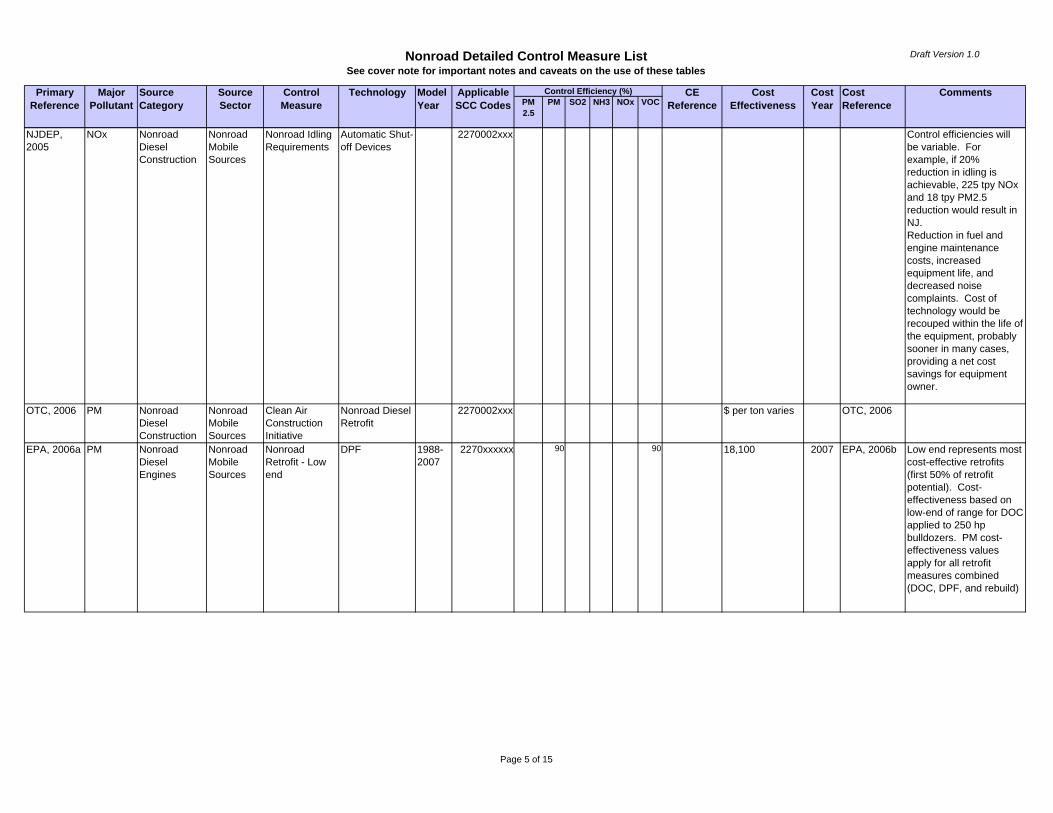
Nonroad Detailed Control Measure ListSee cover note for important notes and caveats on the use of these tables
Draft Version 1.0
PM2.5
PM SO2 NH3 NOx VOCPrimary
ReferenceMajor
PollutantSource Category
Source Sector
CommentsControl Measure
Applicable SCC Codes
Control Efficiency (%) CE Reference
Technology Model Year
Cost Effectiveness
Cost Year
Cost Reference
NJDEP, 2005
NOx Nonroad Diesel Construction
Nonroad Mobile Sources
Nonroad Idling Requirements
Automatic Shut-off Devices
2270002xxx Control efficiencies will be variable. For example, if 20% reduction in idling is achievable, 225 tpy NOx and 18 tpy PM2.5 reduction would result in NJ. Reduction in fuel and engine maintenance costs, increased equipment life, and decreased noise complaints. Cost of technology would be recouped within the life of the equipment, probably sooner in many cases, providing a net cost savings for equipment owner.
OTC, 2006 PM Nonroad Diesel Construction
Nonroad Mobile Sources
Clean Air Construction Initiative
Nonroad Diesel Retrofit
2270002xxx $ per ton varies OTC, 2006
EPA, 2006a PM Nonroad Diesel Engines
Nonroad Mobile Sources
Nonroad Retrofit - Low end
DPF 1988-2007
2270xxxxxx 90 90 18,100 2007 EPA, 2006b Low end represents most cost-effective retrofits (first 50% of retrofit potential). Cost-effectiveness based on low-end of range for DOC applied to 250 hp bulldozers. PM cost-effectiveness values apply for all retrofit measures combined (DOC, DPF, and rebuild)
Page 5 of 15
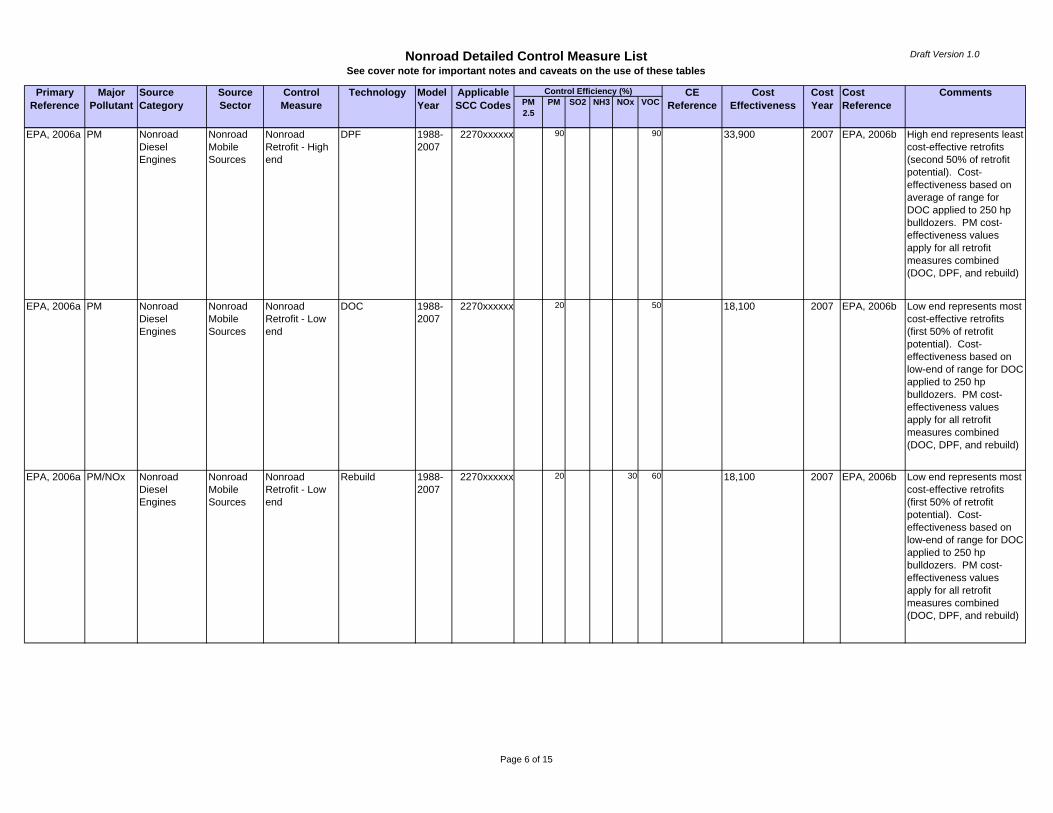
Nonroad Detailed Control Measure ListSee cover note for important notes and caveats on the use of these tables
Draft Version 1.0
PM2.5
PM SO2 NH3 NOx VOCPrimary
ReferenceMajor
PollutantSource Category
Source Sector
CommentsControl Measure
Applicable SCC Codes
Control Efficiency (%) CE Reference
Technology Model Year
Cost Effectiveness
Cost Year
Cost Reference
EPA, 2006a PM Nonroad Diesel Engines
Nonroad Mobile Sources
Nonroad Retrofit - High end
DPF 1988-2007
2270xxxxxx 90 90 33,900 2007 EPA, 2006b High end represents least cost-effective retrofits (second 50% of retrofit potential). Cost-effectiveness based on average of range for DOC applied to 250 hp bulldozers. PM cost-effectiveness values apply for all retrofit measures combined (DOC, DPF, and rebuild)
EPA, 2006a PM Nonroad Diesel Engines
Nonroad Mobile Sources
Nonroad Retrofit - Low end
DOC 1988-2007
2270xxxxxx 20 50 18,100 2007 EPA, 2006b Low end represents most cost-effective retrofits (first 50% of retrofit potential). Cost-effectiveness based on low-end of range for DOC applied to 250 hp bulldozers. PM cost-effectiveness values apply for all retrofit measures combined (DOC, DPF, and rebuild)
EPA, 2006a PM/NOx Nonroad Diesel Engines
Nonroad Mobile Sources
Nonroad Retrofit - Low end
Rebuild 1988-2007
2270xxxxxx 20 30 60 18,100 2007 EPA, 2006b Low end represents most cost-effective retrofits (first 50% of retrofit potential). Cost-effectiveness based on low-end of range for DOC applied to 250 hp bulldozers. PM cost-effectiveness values apply for all retrofit measures combined (DOC, DPF, and rebuild)
Page 6 of 15
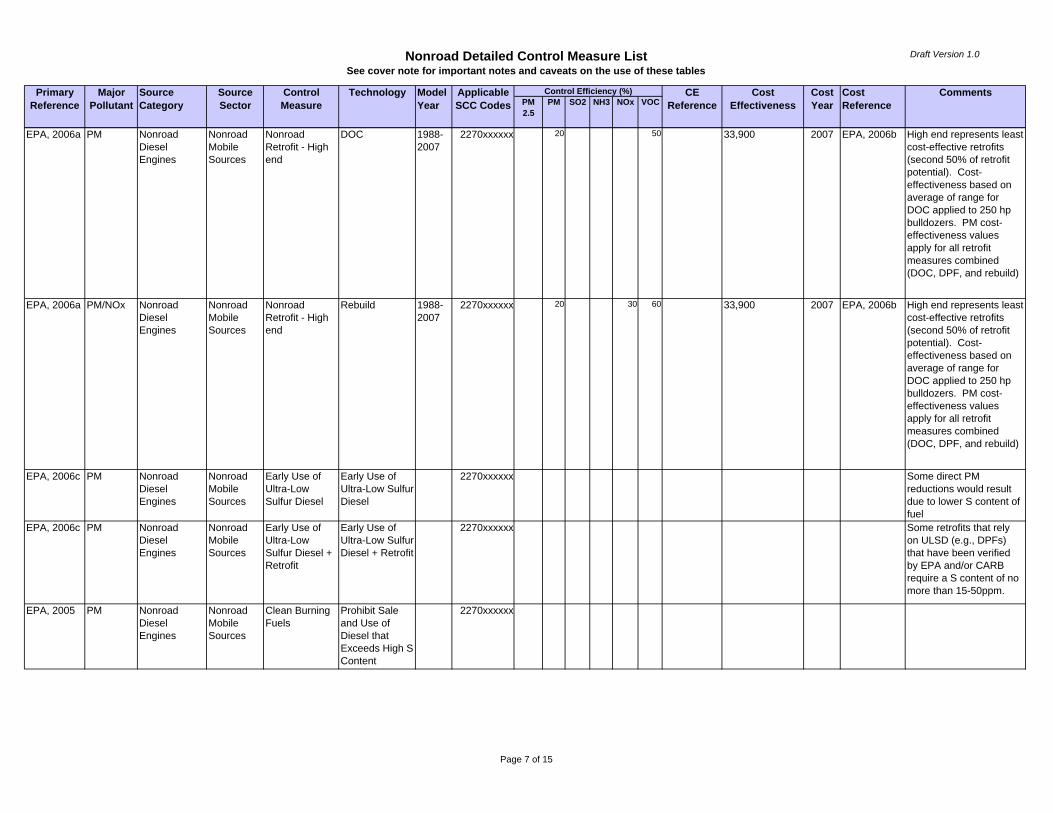
Nonroad Detailed Control Measure ListSee cover note for important notes and caveats on the use of these tables
Draft Version 1.0
PM2.5
PM SO2 NH3 NOx VOCPrimary
ReferenceMajor
PollutantSource Category
Source Sector
CommentsControl Measure
Applicable SCC Codes
Control Efficiency (%) CE Reference
Technology Model Year
Cost Effectiveness
Cost Year
Cost Reference
EPA, 2006a PM Nonroad Diesel Engines
Nonroad Mobile Sources
Nonroad Retrofit - High end
DOC 1988-2007
2270xxxxxx 20 50 33,900 2007 EPA, 2006b High end represents least cost-effective retrofits (second 50% of retrofit potential). Cost-effectiveness based on average of range for DOC applied to 250 hp bulldozers. PM cost-effectiveness values apply for all retrofit measures combined (DOC, DPF, and rebuild)
EPA, 2006a PM/NOx Nonroad Diesel Engines
Nonroad Mobile Sources
Nonroad Retrofit - High end
Rebuild 1988-2007
2270xxxxxx 20 30 60 33,900 2007 EPA, 2006b High end represents least cost-effective retrofits (second 50% of retrofit potential). Cost-effectiveness based on average of range for DOC applied to 250 hp bulldozers. PM cost-effectiveness values apply for all retrofit measures combined (DOC, DPF, and rebuild)
EPA, 2006c PM Nonroad Diesel Engines
Nonroad Mobile Sources
Early Use of Ultra-Low Sulfur Diesel
Early Use of Ultra-Low Sulfur Diesel
2270xxxxxx Some direct PM reductions would result due to lower S content of fuel
EPA, 2006c PM Nonroad Diesel Engines
Nonroad Mobile Sources
Early Use of Ultra-Low Sulfur Diesel + Retrofit
Early Use of Ultra-Low Sulfur Diesel + Retrofit
2270xxxxxx Some retrofits that rely on ULSD (e.g., DPFs) that have been verified by EPA and/or CARB require a S content of no more than 15-50ppm.
EPA, 2005 PM Nonroad Diesel Engines
Nonroad Mobile Sources
Clean Burning Fuels
Prohibit Sale and Use of Diesel that Exceeds High S Content
2270xxxxxx
Page 7 of 15
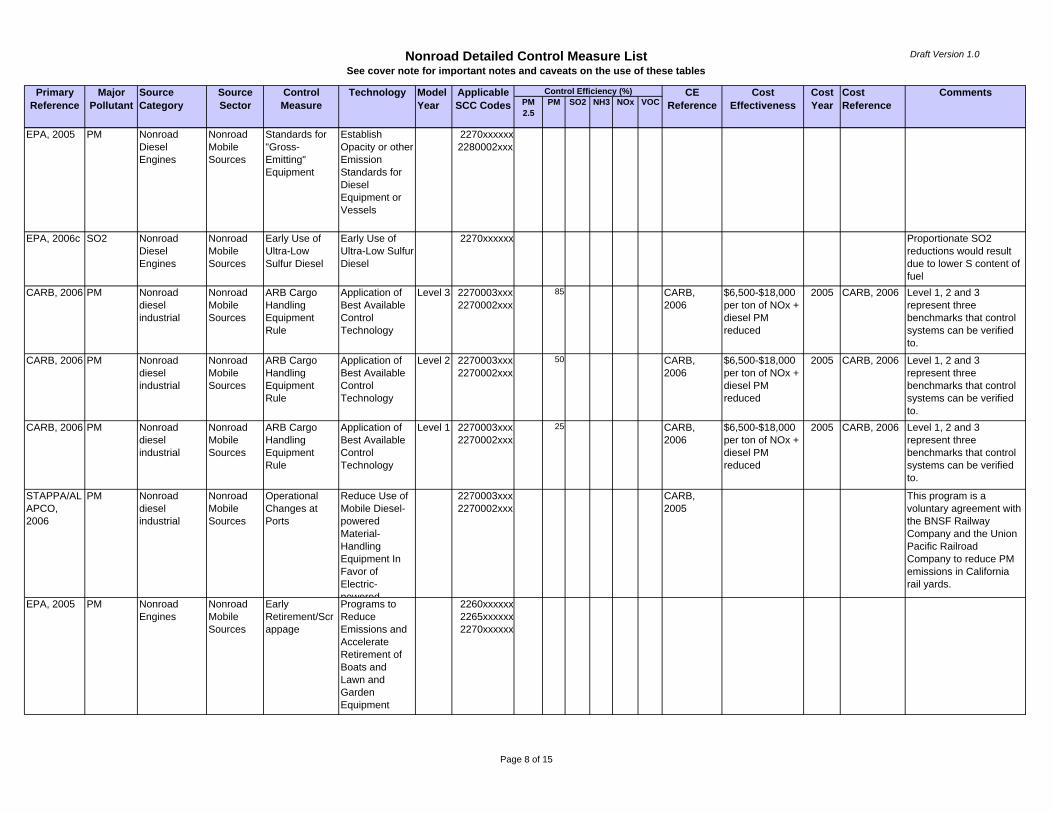
Nonroad Detailed Control Measure ListSee cover note for important notes and caveats on the use of these tables
Draft Version 1.0
PM2.5
PM SO2 NH3 NOx VOCPrimary
ReferenceMajor
PollutantSource Category
Source Sector
CommentsControl Measure
Applicable SCC Codes
Control Efficiency (%) CE Reference
Technology Model Year
Cost Effectiveness
Cost Year
Cost Reference
EPA, 2005 PM Nonroad Diesel Engines
Nonroad Mobile Sources
Standards for "Gross-Emitting" Equipment
Establish Opacity or other Emission Standards for Diesel Equipment or Vessels
2270xxxxxx2280002xxx
EPA, 2006c SO2 Nonroad Diesel Engines
Nonroad Mobile Sources
Early Use of Ultra-Low Sulfur Diesel
Early Use of Ultra-Low Sulfur Diesel
2270xxxxxx Proportionate SO2 reductions would result due to lower S content of fuel
CARB, 2006 PM Nonroad diesel industrial
Nonroad Mobile Sources
ARB Cargo Handling Equipment Rule
Application of Best Available Control Technology
Level 3 2270003xxx2270002xxx
85 CARB, 2006
$6,500-$18,000 per ton of NOx + diesel PM reduced
2005 CARB, 2006 Level 1, 2 and 3 represent three benchmarks that control systems can be verified to.
CARB, 2006 PM Nonroad diesel industrial
Nonroad Mobile Sources
ARB Cargo Handling Equipment Rule
Application of Best Available Control Technology
Level 2 2270003xxx2270002xxx
50 CARB, 2006
$6,500-$18,000 per ton of NOx + diesel PM reduced
2005 CARB, 2006 Level 1, 2 and 3 represent three benchmarks that control systems can be verified to.
CARB, 2006 PM Nonroad diesel industrial
Nonroad Mobile Sources
ARB Cargo Handling Equipment Rule
Application of Best Available Control Technology
Level 1 2270003xxx2270002xxx
25 CARB, 2006
$6,500-$18,000 per ton of NOx + diesel PM reduced
2005 CARB, 2006 Level 1, 2 and 3 represent three benchmarks that control systems can be verified to.
STAPPA/ALAPCO, 2006
PM Nonroad diesel industrial
Nonroad Mobile Sources
Operational Changes at Ports
Reduce Use of Mobile Diesel-powered Material-Handling Equipment In Favor of Electric-powered
2270003xxx2270002xxx
CARB, 2005
This program is a voluntary agreement with the BNSF Railway Company and the Union Pacific Railroad Company to reduce PM emissions in California rail yards.
EPA, 2005 PM Nonroad Engines
Nonroad Mobile Sources
Early Retirement/Scrappage
Programs to Reduce Emissions and Accelerate Retirement of Boats and Lawn and Garden Equipment
2260xxxxxx2265xxxxxx2270xxxxxx
Page 8 of 15

Nonroad Detailed Control Measure ListSee cover note for important notes and caveats on the use of these tables
Draft Version 1.0
PM2.5
PM SO2 NH3 NOx VOCPrimary
ReferenceMajor
PollutantSource Category
Source Sector
CommentsControl Measure
Applicable SCC Codes
Control Efficiency (%) CE Reference
Technology Model Year
Cost Effectiveness
Cost Year
Cost Reference
EPA, 2005 PM Nonroad Engines
Nonroad Mobile Sources
Low Emission Specifications
Limit emissions for construction projects, industrial facilities, ship yards, airports
2260xxxxxx2265xxxxxx2270xxxxxx
EPA, 2005 PM Nonroad Engines
Nonroad Mobile Sources
Clean Burning Fuels
Expand Use of Clean Burning Fuels
2260xxxxxx2265xxxxxx2270xxxxxx
SCAQMD, 2006
PM Nonroad Gasoline
Nonroad Mobile Sources
Equipment Replacement
Lawn Mower Buy Back Program
2260004xxx2265004xxx
Program encourages trading of gasoline-powered mowers by providing funds to offset the purchase cost of electric mowers.
CARB, 2006 NOx Nonroad gasoline industrial
Nonroad Mobile Sources
ARB Forklift and Other Industrial Equipment Rule
Tighter NOx and VOC Limits Plus Accelerated Replacement
2260003xxx2265003xxx
NJDEP, 2005
PM/VOC Recreational Marine
Nonroad Mobile Sources
Variable Registration Fees for Boat Engines
Boat Engine Registration
228202xxxx This control measure would require owners to register boat engines. The boat engine registration fee schedule would be designed so that lower fees would be assessed for the newest engines.
MRPO, 2005
NOx Aircraft Ground Support Equipment
Nonroad Mobile Sources
Alternative Fuels for Airport GSE
Replace Diesel GSE with CNG/LPG
2270008xxx 65 30 NESCAUM, 2003
1,000 - 3,000 NESCAUM, 2003
Cost-effectiveness is expressed in dollar per ton VOC/CO/NOx combined
MRPO, 2005
NOx Aircraft Ground Support Equipment
Nonroad Mobile Sources
Alternative Fuels for Airport GSE
Convert Gas GSE to CNG/LPG
2260008xxx2265008xxx
25 50-70 NESCAUM, 2003
Overall cost savings from reduced fuel use
NESCAUM, 2003
MRPO, 2005
NOx Aircraft Ground Support Equipment
Nonroad Mobile Sources
Alternative Fuels for Airport GSE
Replace Diesel GSE with Electric
2270008xxx 100 NESCAUM, 2003
Cost savings - $5,800
NESCAUM, 2003
Cost savings or net costs dependent on type of GSE. Savings for belt loader, costs incurred for baggage tractor and aircraft tug.
Page 9 of 15

Nonroad Detailed Control Measure ListSee cover note for important notes and caveats on the use of these tables
Draft Version 1.0
PM2.5
PM SO2 NH3 NOx VOCPrimary
ReferenceMajor
PollutantSource Category
Source Sector
CommentsControl Measure
Applicable SCC Codes
Control Efficiency (%) CE Reference
Technology Model Year
Cost Effectiveness
Cost Year
Cost Reference
MRPO, 2005
NOx Aircraft Ground Support Equipment
Nonroad Mobile Sources
Alternative Fuels for Airport GSE
Replace Gas GSE with Electric
2260008xxx2265008xxx
100 NESCAUM, 2003
Cost savings - $1,900
NESCAUM, 2003
Cost savings or net costs dependent on type of GSE. Savings for belt loader and aircraft tug, costs incurred for baggage tractor.
NESCAUM, 2003
NOx Aircraft Ground Support Equipment
Nonroad Mobile Sources
Gate Electrification to Reduce GSE/APU Use
Retrofit airport gates with power and preconditioned air
2260008xxx2265008xxx2270008xxx2275070000
No emission reduction or C-E values provided. Gate electrification requires an up-front capital investment but, once installed, the system produces fuel and labor savings that typically result in a relatively short payback time of less than two years.
NJDEP, 2005
NOx Aircraft Ground Support Equipment
Nonroad Mobile Sources
Nonroad Idling Requirements
Restrict Idling to 3 minutes
2270008xxx Control efficiencies will be variable. For example, applying the current 3-minute idling law to the approx. 2000 non-road GSEs in NJ will result in fuel savings and reduced engine wear and is a low cost strategy.
CARB, 2006 PM/NOx Switch Locomotive
Nonroad Mobile Sources
Upgrade Engines in Switcher Locomotives
Diesel-electric hybrid locomotives
2285002010 80 80 CARB, 2006
$6,500-$18,000 per ton of NOx + diesel PM reduced
2005 CARB, 2006 Hybrid switch locomotives have significantly reduced diesel PM and NOx emissions, idling time, and fuel use compared to conventional switchers.
Page 10 of 15
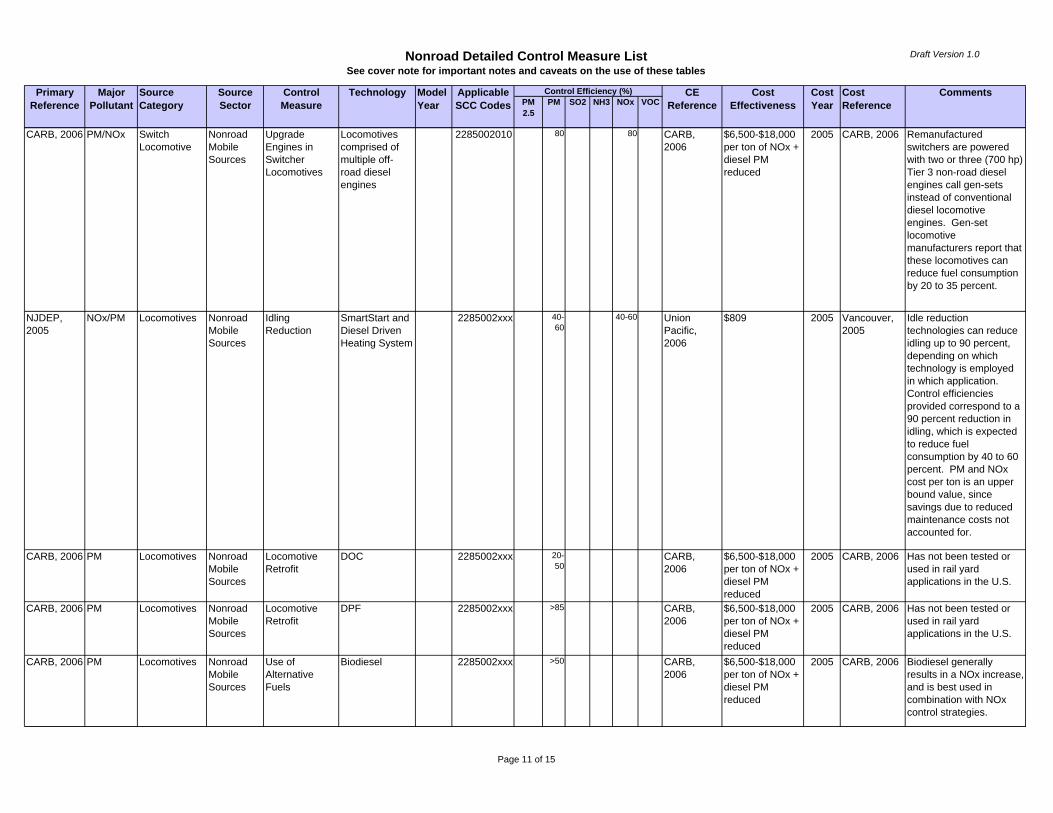
Nonroad Detailed Control Measure ListSee cover note for important notes and caveats on the use of these tables
Draft Version 1.0
PM2.5
PM SO2 NH3 NOx VOCPrimary
ReferenceMajor
PollutantSource Category
Source Sector
CommentsControl Measure
Applicable SCC Codes
Control Efficiency (%) CE Reference
Technology Model Year
Cost Effectiveness
Cost Year
Cost Reference
CARB, 2006 PM/NOx Switch Locomotive
Nonroad Mobile Sources
Upgrade Engines in Switcher Locomotives
Locomotives comprised of multiple off-road diesel engines
2285002010 80 80 CARB, 2006
$6,500-$18,000 per ton of NOx + diesel PM reduced
2005 CARB, 2006 Remanufactured switchers are powered with two or three (700 hp) Tier 3 non-road diesel engines call gen-sets instead of conventional diesel locomotive engines. Gen-set locomotive manufacturers report that these locomotives can reduce fuel consumption by 20 to 35 percent.
NJDEP, 2005
NOx/PM Locomotives Nonroad Mobile Sources
Idling Reduction
SmartStart and Diesel Driven Heating System
2285002xxx 40-60
40-60 Union Pacific, 2006
$809 2005 Vancouver, 2005
Idle reduction technologies can reduce idling up to 90 percent, depending on which technology is employed in which application. Control efficiencies provided correspond to a 90 percent reduction in idling, which is expected to reduce fuel consumption by 40 to 60 percent. PM and NOx cost per ton is an upper bound value, since savings due to reduced maintenance costs not accounted for.
CARB, 2006 PM Locomotives Nonroad Mobile Sources
Locomotive Retrofit
DOC 2285002xxx 20-50
CARB, 2006
$6,500-$18,000 per ton of NOx + diesel PM reduced
2005 CARB, 2006 Has not been tested or used in rail yard applications in the U.S.
CARB, 2006 PM Locomotives Nonroad Mobile Sources
Locomotive Retrofit
DPF 2285002xxx >85 CARB, 2006
$6,500-$18,000 per ton of NOx + diesel PM reduced
2005 CARB, 2006 Has not been tested or used in rail yard applications in the U.S.
CARB, 2006 PM Locomotives Nonroad Mobile Sources
Use of Alternative Fuels
Biodiesel 2285002xxx >50 CARB, 2006
$6,500-$18,000 per ton of NOx + diesel PM reduced
2005 CARB, 2006 Biodiesel generally results in a NOx increase, and is best used in combination with NOx control strategies.
Page 11 of 15
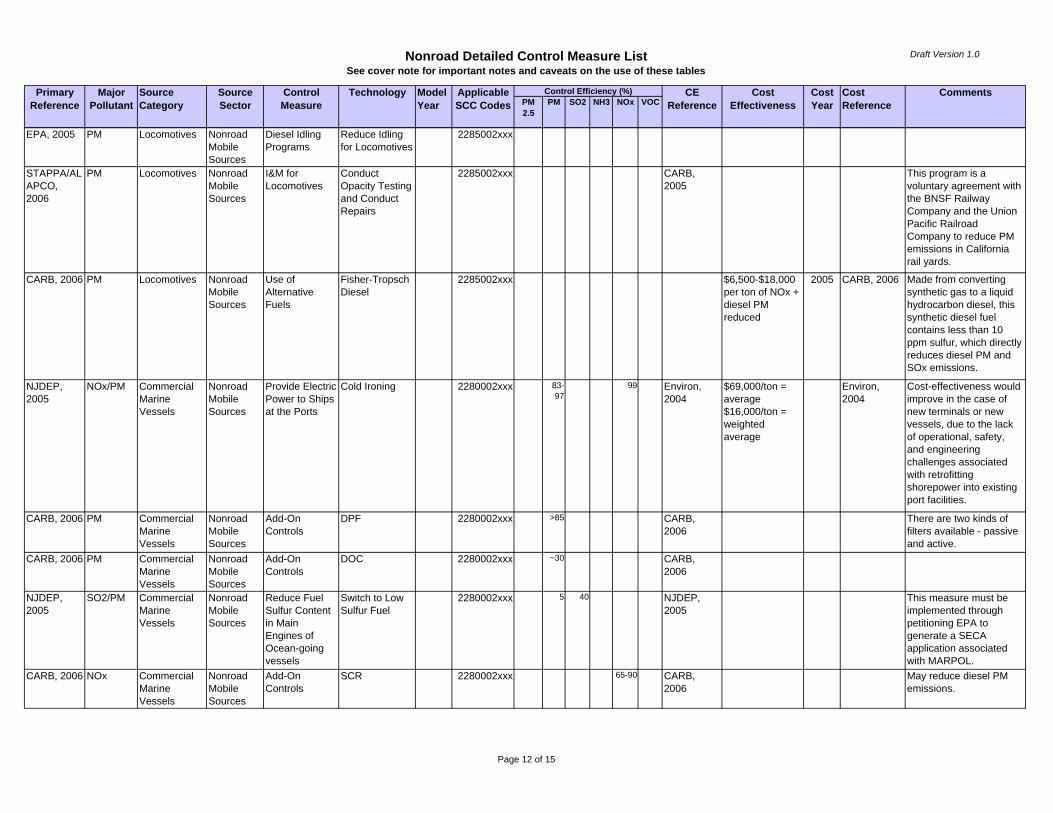
Nonroad Detailed Control Measure ListSee cover note for important notes and caveats on the use of these tables
Draft Version 1.0
PM2.5
PM SO2 NH3 NOx VOCPrimary
ReferenceMajor
PollutantSource Category
Source Sector
CommentsControl Measure
Applicable SCC Codes
Control Efficiency (%) CE Reference
Technology Model Year
Cost Effectiveness
Cost Year
Cost Reference
EPA, 2005 PM Locomotives Nonroad Mobile Sources
Diesel Idling Programs
Reduce Idling for Locomotives
2285002xxx
STAPPA/ALAPCO, 2006
PM Locomotives Nonroad Mobile Sources
I&M for Locomotives
Conduct Opacity Testing and Conduct Repairs
2285002xxx CARB, 2005
This program is a voluntary agreement with the BNSF Railway Company and the Union Pacific Railroad Company to reduce PM emissions in California rail yards.
CARB, 2006 PM Locomotives Nonroad Mobile Sources
Use of Alternative Fuels
Fisher-Tropsch Diesel
2285002xxx $6,500-$18,000 per ton of NOx + diesel PM reduced
2005 CARB, 2006 Made from converting synthetic gas to a liquid hydrocarbon diesel, this synthetic diesel fuel contains less than 10 ppm sulfur, which directly reduces diesel PM and SOx emissions.
NJDEP, 2005
NOx/PM Commercial Marine Vessels
Nonroad Mobile Sources
Provide Electric Power to Ships at the Ports
Cold Ironing 2280002xxx 83-97
99 Environ, 2004
$69,000/ton = average$16,000/ton = weighted average
Environ, 2004
Cost-effectiveness would improve in the case of new terminals or new vessels, due to the lack of operational, safety, and engineering challenges associated with retrofitting shorepower into existing port facilities.
CARB, 2006 PM Commercial Marine Vessels
Nonroad Mobile Sources
Add-On Controls
DPF 2280002xxx >85 CARB, 2006
There are two kinds of filters available - passive and active.
CARB, 2006 PM Commercial Marine Vessels
Nonroad Mobile Sources
Add-On Controls
DOC 2280002xxx ~30 CARB, 2006
NJDEP, 2005
SO2/PM Commercial Marine Vessels
Nonroad Mobile Sources
Reduce Fuel Sulfur Content in Main Engines of Ocean-going vessels
Switch to Low Sulfur Fuel
2280002xxx 5 40 NJDEP, 2005
This measure must be implemented through petitioning EPA to generate a SECA application associated with MARPOL.
CARB, 2006 NOx Commercial Marine Vessels
Nonroad Mobile Sources
Add-On Controls
SCR 2280002xxx 65-90 CARB, 2006
May reduce diesel PM emissions.
Page 12 of 15

Nonroad Detailed Control Measure ListSee cover note for important notes and caveats on the use of these tables
Draft Version 1.0
PM2.5
PM SO2 NH3 NOx VOCPrimary
ReferenceMajor
PollutantSource Category
Source Sector
CommentsControl Measure
Applicable SCC Codes
Control Efficiency (%) CE Reference
Technology Model Year
Cost Effectiveness
Cost Year
Cost Reference
NJDEP, 2005
SO2/PM Commercial Marine Vessels
Nonroad Mobile Sources
Limit Sulfur Content of Auxiliary Engine Fuel
Switch to Low Sulfur Fuel
2280002xxx California has predicted that their auxiliary engine rule will yield the following reductions: 2.7 tons per day (TPD) of PM in 2007 and 3.7 TPD of PM in 2010.
California has predicted that their auxiliary engine fuel sulfur limit will cost the container and bulk shipping industry to reduce sulfur content of the fuel from 1% to 0.5% approximately $34 million in 2007. To further reduce the sulfur content of the fuel from 0.5% to 0.1% would cost approximately $38 million in 2010.
NJDEP, 2005
SO2/PM Commercial Marine VesselsRecreational Marine
Nonroad Mobile Sources
Reduce Fuel Sulfur Content for Smaller Commercial and Recreational Vessels
Switch to Low Sulfur Fuel
2280002xxx228202xxxx
10 82-99.5
NJDEP, 2005
Emission reductions based on assumption that current sulfur level of 3,000 parts per million (ppm) is reduced to 500 and to 15 ppm.
CARB, 2006 NOx/PM Commercial Marine Vessels-Harbor Vessels
Nonroad Mobile Sources
Shore Based Electrical Power
Cold Ironing 2280002020 12-27
12-27 CARB, 2006
No C-E values provided; likely to be cost-effective for ships that frequently visit ports equipped with shore power. Control efficiencies based on participation of 40% of tugboat fleet in 2010 and 80-100% of tugboat fleet in 2025.
CARB, 2006 PM Commercial Marine Vessels-Harbor Vessels
Nonroad Mobile Sources
Cleaner Marine Fuels
Biodiesel 2280002020 >50 CARB, 2006
Generally results in a NOx increase. Biodiesel is best used in combination with NOx control strategies.
Page 13 of 15

Nonroad Detailed Control Measure ListSee cover note for important notes and caveats on the use of these tables
Draft Version 1.0
PM2.5
PM SO2 NH3 NOx VOCPrimary
ReferenceMajor
PollutantSource Category
Source Sector
CommentsControl Measure
Applicable SCC Codes
Control Efficiency (%) CE Reference
Technology Model Year
Cost Effectiveness
Cost Year
Cost Reference
CARB, 2006 NOx Commercial Marine Vessels-Harbor Vessels
Nonroad Mobile Sources
Cleaner Marine Fuels
Emulsified Diesel Fuel
2280002020 CARB, 2006
ARB estimates that emulsified diesel fuel used in on-road engines can reduce NOx by 15 percent and PM by 50 percent. Additional testing is required to determine whether similar reductions are possible in marine engines.
CARB, 2006 PM Commercial Marine Vessels-Harbor Vessels
Nonroad Mobile Sources
Cleaner Marine Fuels
Compressed or liquefied natural gas or diesel/CNG dual fuel
2280002020 Can result in significant reductions in NOx and PM. The results vary with specific application and the ratio of diesel to CNG used. Additional testing is required to determine whether similar reductions are possible in marine engines.
CARB, 2006 NOx/PM Commercial Marine Vessels-Ocean Going Vessels
Nonroad Mobile Sources
Shore Based Electrical Power
Cold Ironing 2280002010 90 90 $6,500-$18,000 per ton of NOx + diesel PM reduced
2005 CARB, 2006 ARB assumes 90% control and participation of 20% of fleet in 2010 and 80% of fleet in 2020
CARB, 2006 SO2/PM Commercial Marine Vessels-Ocean Going Vessels
Nonroad Mobile Sources
Cleaner Marine Fuels for Main Engines
Marine distillate fuels
2280002010 75 75 6 CARB, 2006
$6,500-$18,000 per ton of NOx + diesel PM reduced
2005 CARB, 2006
CARB, 2006 NOx/PM Commercial Marine Vessels-Ocean Going Vessels
Nonroad Mobile Sources
Build New Ships that Far Exceed IMO Standards
New or Retrofitted Engines
2280002010 60 90 CARB, 2006
$6,500-$18,000 per ton of NOx + diesel PM reduced
2005 CARB, 2006
CARB, 2006 SO2 Commercial Marine Vessels-Ocean Going Vessels
Nonroad Mobile Sources
Cleaner Marine Fuels for Main Engines
Lower sulfur content
2280002010 35 80 CARB, 2006
$6,500-$18,000 per ton of NOx + diesel PM reduced
2005 CARB, 2006 Control efficiencies assume use of lower sulfur content fuel oil of 5000 ppm
Page 14 of 15

Nonroad Detailed Control Measure ListSee cover note for important notes and caveats on the use of these tables
Draft Version 1.0
PM2.5
PM SO2 NH3 NOx VOCPrimary
ReferenceMajor
PollutantSource Category
Source Sector
CommentsControl Measure
Applicable SCC Codes
Control Efficiency (%) CE Reference
Technology Model Year
Cost Effectiveness
Cost Year
Cost Reference
CARB, 2007 SO2 Commercial Marine Vessels-Ocean Going Vessels
Nonroad Mobile Sources
Cleaner Marine Fuels for Auxiliary Engines
Lower sulfur content
2280002010 35 80 CARB, 2006
$6,500-$18,000 per ton of NOx + diesel PM reduced
2005 CARB, 2006 Control efficiencies assume use of lower sulfur content fuel oil of 5000 ppm
CARB, 2006 NOx Commercial Marine Vessels-Ocean Going Vessels
Nonroad Mobile Sources
Cleaner Marine Fuels
Emulsified Diesel Fuel
2280002010 30 $6,500-$18,000 per ton of NOx + diesel PM reduced
2005 CARB, 2006 Slight increase in fuel consumption and PM emissions.
CARB, 2006 NOx Commercial Marine Vessels-Ocean Going Vessels
Nonroad Mobile Sources
Vessel Speed Reduction Program
Extending speed reduction zones offshore
2280002010 $6,500-$18,000 per ton of NOx + diesel PM reduced
2005 CARB, 2006 Slower speeds reduce main engine fuel consumption and result in significant NOx reductions. There is the potential for increases in diesel PM emissions for some vessels operating at slow speeds.
AcronymsEGR - Exhaust Gas Recirculation SCR - Selective Catalytic Reduction DOC - Diesel Oxidation CatalystsDPF - Diesel Particulate FiltersCCV - Closed Crankcase VentilationAPU - Auxiliary Power UnitsGSE - Ground Support EquipmentCNG - Compressed Natural GasLPG - Liquefied Petroleum GasIMO - International Marine OrganizationULSD - Ultra-Low Sulfur Diesel
Page 15 of 15

Onroad VOC MeasuresSee cover note for important notes and caveats on the use of these tables
Draft Version 1.0
Source Category Emission Reduction Measure Control Efficiency
Cost Effectiveness
Notes/caveats Other pollutants controlled
References for more information
School Bus Diesel Retrofit - Diesel Oxidation Catalysts
50 12000 - 49100 Applies to 1990-2006 model years
PM, CO EPA 2006b, EPA 2006d, EPA 2006
School Bus Diesel Retrofit - Catalyzed Diesel Particulate Filters
90 12400 - 50500 Applies to 1995-2006 model years
PM, CO EPA 2006b, EPA 2006d, EPA 2006
Class 6 & 7 HDDVs Diesel Retrofit - Diesel Oxidation Catalysts
50 27600 - 67900 Applies to 1990-2006 model years
PM, CO EPA 2006b, EPA 2006d, EPA 2006
Class 6 & 7 HDDVs Diesel Retrofit - Catalyzed Diesel Particulate Filters
90 28400 - 69900 Applies to 1995-2006 model years
PM, CO EPA 2006b, EPA 2006d, EPA 2006
Class 8B HDDVs Diesel Retrofit - Diesel Oxidation Catalysts
50 11100 - 40600 Applies to 1990-2006 model years
PM, CO EPA 2006b, EPA 2006d, EPA 2006
Class 8B HDDVs Diesel Retrofit - Catalyzed Diesel Particulate Filters
90 12100 - 44100 Applies to 1995-2006 model years
PM, CO EPA 2006b, EPA 2006d, EPA 2006
HDDVs Diesel Retrofit - Active Diesel Particulate Filter
60 - 93 PM, CO STAPPA/ALAPCO 2006, EPA 2006
HDDVs Diesel Retrofit - Flow Through Filter
50 - 89 Applies to 1991 - 2002 model years; needs 15 ppm sulfur diesel or CARB diesel
PM, CO STAPPA/ALAPCO 2006; CARB 2006a, EPA 2006
HDDVs Diesel Retrofit - NOX Adsorber 10 - 90 PM, NOX, CO STAPPA/ALAPCO 2006, EPA 2006HDDVs Alternative Fuel - Biodiesel 0 - 50 Increases NOX PM, CO EPA 2006e; STAPPA/ALAPCO 2006HDDVs Alternative Fuel - Oxygenated
Diesel0 - 50 Oxygenated with ethanol;
Nox emissions likely to increase
PM, CO, CO2 STAPPA/ALAPCO 2006
HDDVs Alternative Fuel - Fuel-borne Catalyst
0 - 50 PM, NOX, CO STAPPA/ALAPCO 2006
Class 5 and above HDDVs and Diesel Buses
Replacement 72 - 89 Applies to 1990-2006 model years
PM, NOX EPA 2006d
Class 8 HDDVs Intermodal - shift of transportation of goods from truck to rail transport
1.0 0 Would result in a 0.3-0.4% increase in all pollutants from locomotive and rail SCCs; represents a 1% shift from truck-only transport to
PM, NOX, SO2, NH3
EPA 2006d
Class 8 HDDVs Eliminate Long Duration Idling with Truck Stop Electrification
3.4 0 Upfront capital costs fully recovered by fuel savings
PM, NOX, SO2, CO EPA 2006d, EPA 2004
Class 8 HDDVs Eliminate Long Duration Idling with Mobile Idle Reduction Technologies
3.4 0 Upfront capital costs fully recovered by fuel savings
PM, NOX, SO2, CO EPA 2006d, EPA 2004
Page 1 of 3
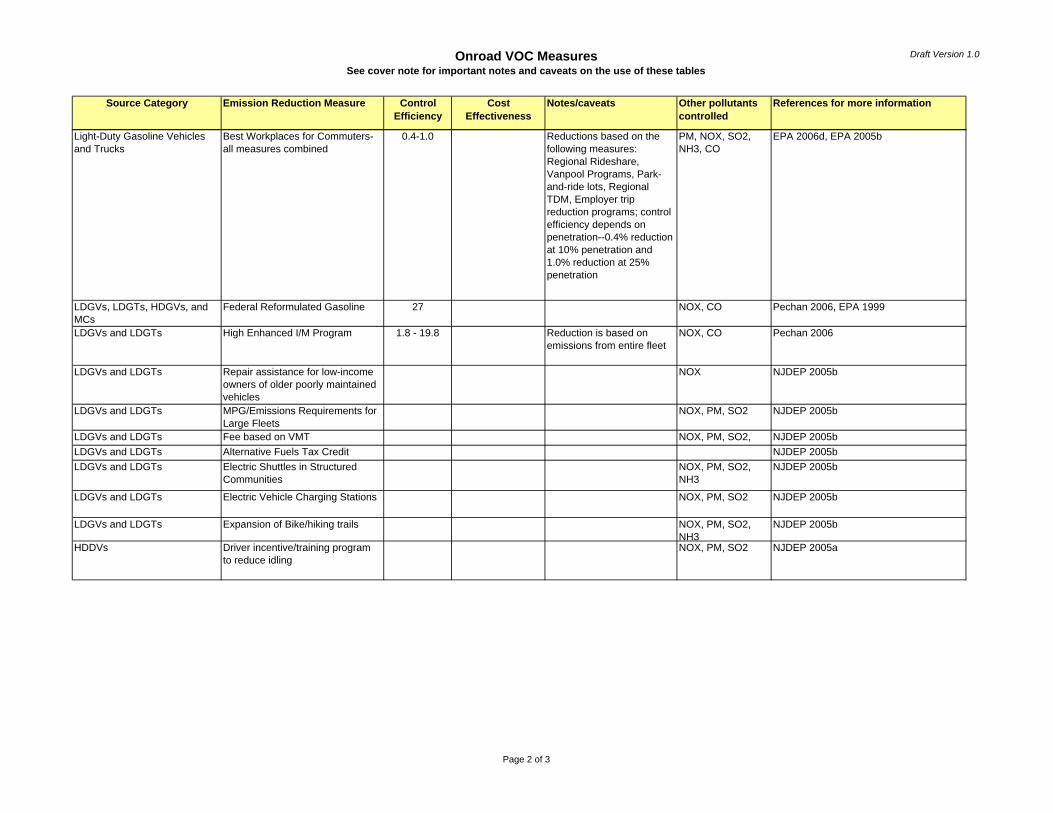
Onroad VOC MeasuresSee cover note for important notes and caveats on the use of these tables
Draft Version 1.0
Source Category Emission Reduction Measure Control Efficiency
Cost Effectiveness
Notes/caveats Other pollutants controlled
References for more information
Light-Duty Gasoline Vehicles and Trucks
Best Workplaces for Commuters-all measures combined
0.4-1.0 Reductions based on the following measures: Regional Rideshare, Vanpool Programs, Park-and-ride lots, Regional TDM, Employer trip reduction programs; control efficiency depends on penetration--0.4% reduction at 10% penetration and 1.0% reduction at 25% penetration
PM, NOX, SO2, NH3, CO
EPA 2006d, EPA 2005b
LDGVs, LDGTs, HDGVs, and MCs
Federal Reformulated Gasoline 27 NOX, CO Pechan 2006, EPA 1999
LDGVs and LDGTs High Enhanced I/M Program 1.8 - 19.8 Reduction is based on emissions from entire fleet
NOX, CO Pechan 2006
LDGVs and LDGTs Repair assistance for low-income owners of older poorly maintained vehicles
NOX NJDEP 2005b
LDGVs and LDGTs MPG/Emissions Requirements for Large Fleets
NOX, PM, SO2 NJDEP 2005b
LDGVs and LDGTs Fee based on VMT NOX, PM, SO2, NJDEP 2005bLDGVs and LDGTs Alternative Fuels Tax Credit NJDEP 2005bLDGVs and LDGTs Electric Shuttles in Structured
CommunitiesNOX, PM, SO2, NH3
NJDEP 2005b
LDGVs and LDGTs Electric Vehicle Charging Stations NOX, PM, SO2 NJDEP 2005b
LDGVs and LDGTs Expansion of Bike/hiking trails NOX, PM, SO2, NH3
NJDEP 2005b
HDDVs Driver incentive/training program to reduce idling
NOX, PM, SO2 NJDEP 2005a
Page 2 of 3
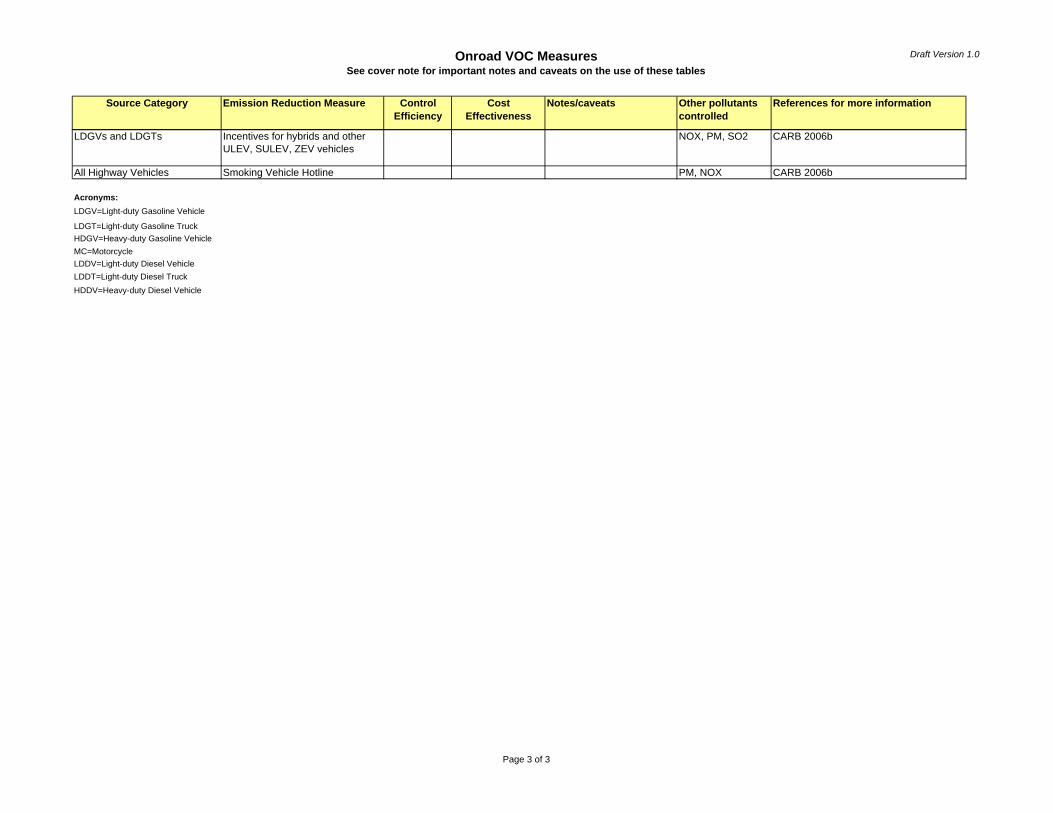
Onroad VOC MeasuresSee cover note for important notes and caveats on the use of these tables
Draft Version 1.0
Source Category Emission Reduction Measure Control Efficiency
Cost Effectiveness
Notes/caveats Other pollutants controlled
References for more information
LDGVs and LDGTs Incentives for hybrids and other ULEV, SULEV, ZEV vehicles
NOX, PM, SO2 CARB 2006b
All Highway Vehicles Smoking Vehicle Hotline PM, NOX CARB 2006b
Acronyms:LDGV=Light-duty Gasoline Vehicle
LDGT=Light-duty Gasoline TruckHDGV=Heavy-duty Gasoline VehicleMC=MotorcycleLDDV=Light-duty Diesel VehicleLDDT=Light-duty Diesel TruckHDDV=Heavy-duty Diesel Vehicle
Page 3 of 3
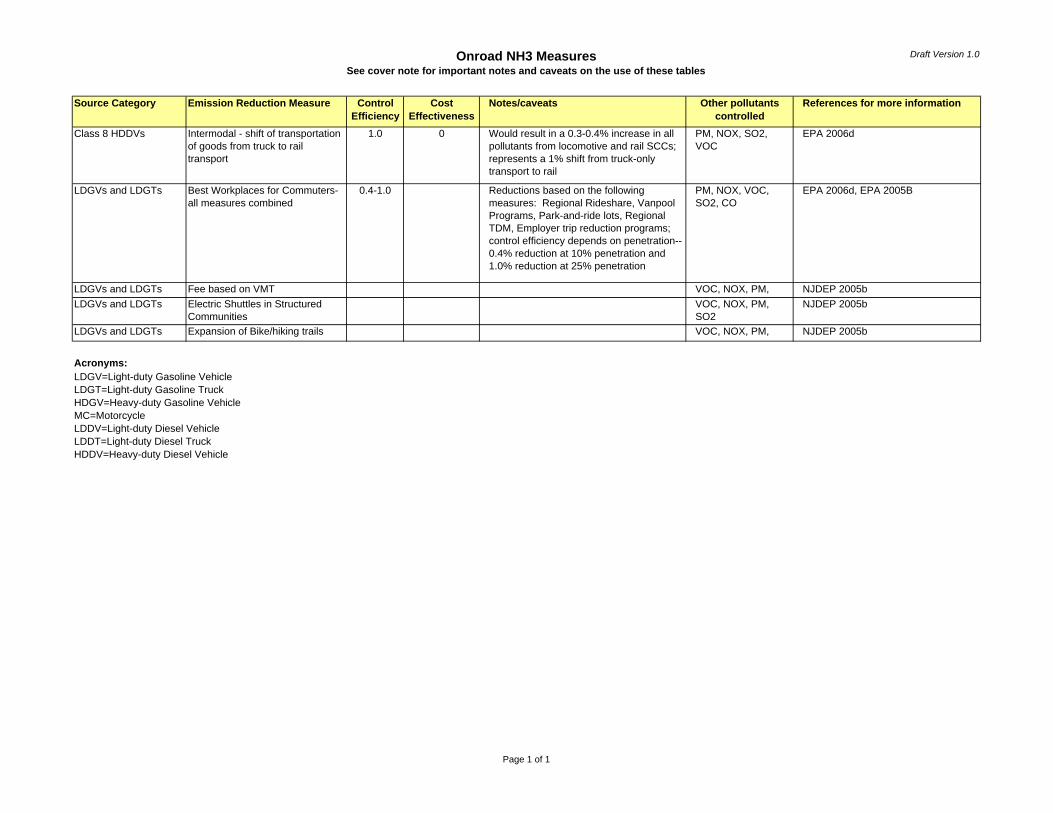
Onroad NH3 MeasuresSee cover note for important notes and caveats on the use of these tables
Draft Version 1.0
SO2
Source Category Emission Reduction Measure Control Efficiency
Cost Effectiveness
Notes/caveats Other pollutants controlled
References for more information
Class 8 HDDVs Intermodal - shift of transportation of goods from truck to rail transport
1.0 0 Would result in a 0.3-0.4% increase in all pollutants from locomotive and rail SCCs; represents a 1% shift from truck-only transport to rail
PM, NOX, SO2, VOC
EPA 2006d
LDGVs and LDGTs Best Workplaces for Commuters-all measures combined
0.4-1.0 Reductions based on the following measures: Regional Rideshare, Vanpool Programs, Park-and-ride lots, Regional TDM, Employer trip reduction programs; control efficiency depends on penetration--0.4% reduction at 10% penetration and 1.0% reduction at 25% penetration
PM, NOX, VOC, SO2, CO
EPA 2006d, EPA 2005B
LDGVs and LDGTs Fee based on VMT VOC, NOX, PM, NJDEP 2005bLDGVs and LDGTs Electric Shuttles in Structured
CommunitiesVOC, NOX, PM, SO2
NJDEP 2005b
LDGVs and LDGTs Expansion of Bike/hiking trails VOC, NOX, PM, NJDEP 2005b
Acronyms:LDGV=Light-duty Gasoline VehicleLDGT=Light-duty Gasoline TruckHDGV=Heavy-duty Gasoline VehicleMC=MotorcycleLDDV=Light-duty Diesel VehicleLDDT=Light-duty Diesel TruckHDDV=Heavy-duty Diesel Vehicle
Page 1 of 1

Onroad VOC and NH3 Measure ReferencesSee cover note for important notes and caveats on the use of these tables
Draft Version 1.0
Key ReferenceReferences for Onroad VOC and NH3
CARB 2006aCalifornia Air Resources Board, "Currently Verified Diesel Emission Control Technologies," as of September 6, 2006 http://www.arb.ca.gov/diesel/verdev/verifiedtechnologies/cvt.htm
CARB 2006b California Air Resources Board, "ARB Programs," updated May 4, 2006 http://www.arb.ca.gov/html/programs.htmENVIRON 2006 ENVIRON International Corporation, "Evaluation of Candidate Mobile Source Control Measures", Final Report, prepared for Lake Michigan Air Directors
Consortium, 2250 E. Devon Ave., #250, Des Plaines, IL 60018, February 28, 2006. http://www.ladco.org/reports/rpo/Regional%20Air%20Quality/LADCO%20Control%20Report_Final.pdf
EPA 1999 U.S. Environmental Protection Agency, Office of Air and Radiation, "Phase II Reformulated Gasoline: The Next Major Step Toward Cleaner Air", EPA420-F-99-042, November 1999. http://www.epa.gov/OMSWWW/rfg/f99042.pdf
EPA 2004 Guidance for Quantifying and Using Long DurationTruck Idling Emission Reductions In State Implementation Plans and Transportation Conformity, EPA420-B-04-001, January 2004. http://www.epa.gov/otaq/stateresources/transconf/policy/truckidlingguidance.pdf
EPA 2005 Draft list of potential RACT and RACM from PM rule preamble (see EPA websites on verified retrofit technologies) http://www.epa.gov/otaq/retrofit/retroverifiedlist.htm
EPA 2005b Guidance for Quantifying and Using Emissions Reductions from Best Workplaces for Commuter Programs in State Implementation Plans and Transportation Conformity Determinations, EPA420-B-05-016, October 2005. http://www.epa.gov/otaq/stateresources/policy/transp/commuter/420b05016.pdf
EPA 2006 Diesel Retrofits: Quantifying and Using Their Benefits in SIPs and Conformity, EPA420-B-06-005, June 2006. http://www.epa.gov/otaq/stateresources/transconf/policy/420b06005.pdf
EPA 2006b U.S. Environmental Protection Agency, Office of Transportation and Air Quality, "Diesel Retrofit Technology, An Analysis of the Cost-Effectiveness of Reducing Particulate Matter Emissions from Heavy-Duty Diesel Engines Through Retrofits", EPA420-S-06-002, March 2006. http://www.epa.gov/cleandiesel/documents/420s06002.pdf
EPA 2006d EPA Staff Communication: "Mobile Source Control Measures in PM NAAQS RIA", EPA, 2006
EPA 2006e Clean Ports USA, "Emission Reduction Strategies by Application, Trucks," as of September 2006 http://www.epa.gov/cleandiesel/ports/stratapp.htm#highwayNJDEP 2005a NJDEP Diesel Initiatives Workgroup, "A Collaborative Report Presenting Air Quality Strategies for Further Consideration by the State of New Jersey," October
31, 2005. http://www.nj.gov/dep/airworkgroups/docs/final_di_workgroup_report.pdfNJDEP 2005b NJDEP Gasoline Cars & Trucks Workgroup, "A Collaborative Report Presenting Air Quality Strategies for Further Consideration by the State of New Jersey,"
October 31, 2005. http://www.state.nj.us/dep/airworkgroups/docs/final_gct_report.pdfOTC 2006 Ozone Transport Commission (OTC) “Candidate Control Measures.” http://www.otcair.org/projects_details.asp?FID=93&fview=stationaryPechan 2006 E.H. Pechan & Associates, Inc., "AirControlNET, Version 4.1 Control Measure Documentation Report," Draft Report, prepared for U.S. Environmental
Protection Agency, Research Triangle Park, NC, Pechan Report No. 06.05.003/9011.002, May 2006.San Joaquin Valley UAPCD, 2003 San Joaquin Valley Unified Air Pollution Control District (UAPCD). Final BACM Technological and Economic Feasibility Analysis, prepared by Sierra Research,
March 21, 2003. http://www.soiltac.com/PDF/Final_BACM_Chapter 20 - Fugitive Dust 287Feasibility_Analysis.pdf
STAPPA/ALAPCO 2006The State and Territorial Air Pollution Program Administrators and the Association of Local Air Pollution Control Officials, "Controlling Fine Particulate Matter Under the Clean Air Act: A Menu of Options, " March 2006. http://www.4cleanair.org/PM25Menu-Final.pdf
TCEQ 2006 Texas Commission on Environmental Quality, Texas Air Quality Control Measures, as of September 2006 http://www.tceq.state.tx.us/implementation/air/sip/sipstrategies.html#mobile
Page 1 of 1
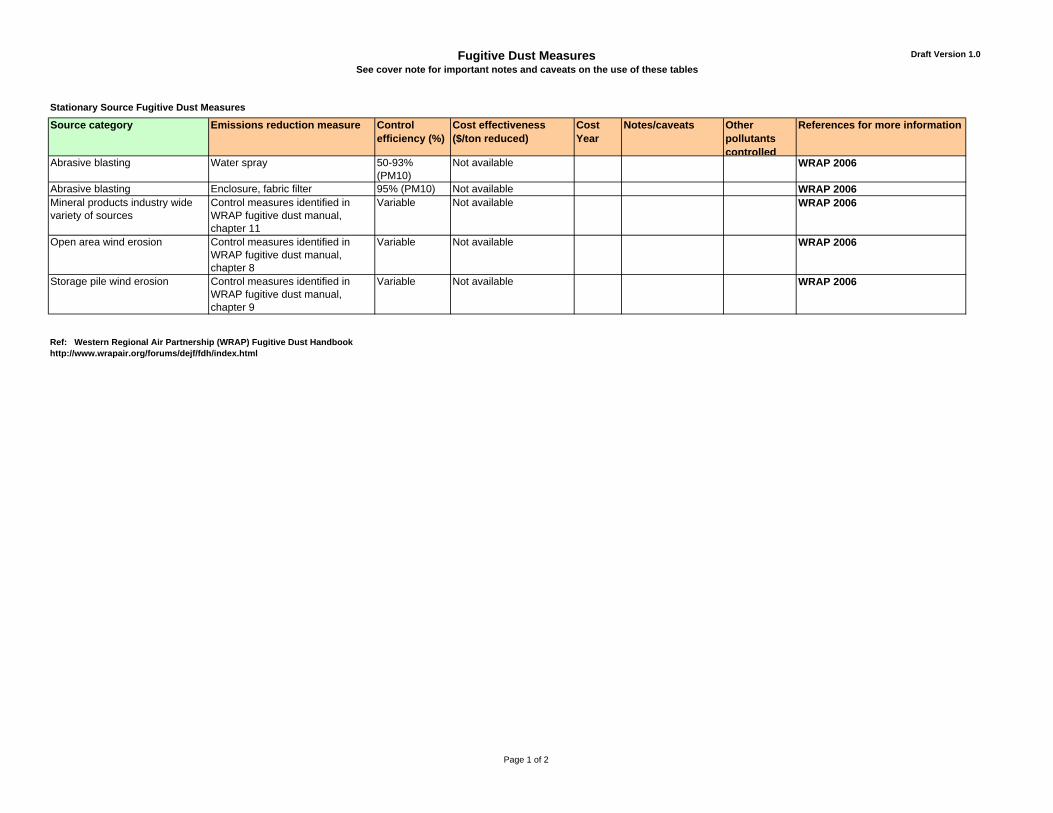
Fugitive Dust MeasuresSee cover note for important notes and caveats on the use of these tables
Draft Version 1.0
Stationary Source Fugitive Dust Measures
Source category Emissions reduction measure Control efficiency (%)
Cost effectiveness($/ton reduced)
Cost Year
Notes/caveats Other pollutants controlled
References for more information
Abrasive blasting Water spray 50-93% (PM10)
Not available WRAP 2006
Abrasive blasting Enclosure, fabric filter 95% (PM10) Not available WRAP 2006Mineral products industry wide variety of sources
Control measures identified in WRAP fugitive dust manual, chapter 11
Variable Not available WRAP 2006
Open area wind erosion Control measures identified in WRAP fugitive dust manual, chapter 8
Variable Not available WRAP 2006
Storage pile wind erosion Control measures identified in WRAP fugitive dust manual, chapter 9
Variable Not available WRAP 2006
Ref: Western Regional Air Partnership (WRAP) Fugitive Dust Handbookhttp://www.wrapair.org/forums/dejf/fdh/index.html
Page 1 of 2
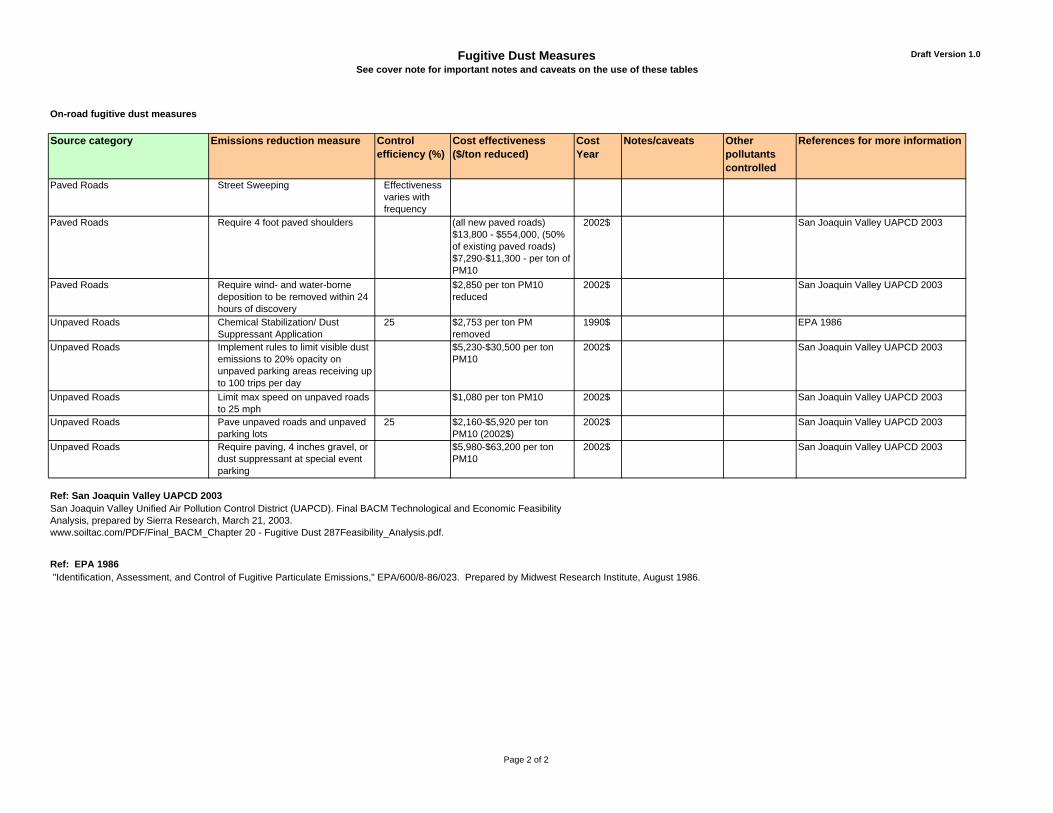
Fugitive Dust MeasuresSee cover note for important notes and caveats on the use of these tables
Draft Version 1.0
On-road fugitive dust measures
Source category Emissions reduction measure Control efficiency (%)
Cost effectiveness($/ton reduced)
Cost Year
Notes/caveats Other pollutants controlled
References for more information
Paved Roads Street Sweeping Effectiveness varies with frequency
Paved Roads Require 4 foot paved shoulders (all new paved roads) $13,800 - $554,000, (50% of existing paved roads) $7,290-$11,300 - per ton of PM10
2002$ San Joaquin Valley UAPCD 2003
Paved Roads Require wind- and water-borne deposition to be removed within 24 hours of discovery
$2,850 per ton PM10 reduced
2002$ San Joaquin Valley UAPCD 2003
Unpaved Roads Chemical Stabilization/ Dust Suppressant Application
25 $2,753 per ton PM removed
1990$ EPA 1986
Unpaved Roads Implement rules to limit visible dust emissions to 20% opacity on unpaved parking areas receiving up to 100 trips per day
$5,230-$30,500 per ton PM10
2002$ San Joaquin Valley UAPCD 2003
Unpaved Roads Limit max speed on unpaved roads to 25 mph
$1,080 per ton PM10 2002$ San Joaquin Valley UAPCD 2003
Unpaved Roads Pave unpaved roads and unpaved parking lots
25 $2,160-$5,920 per ton PM10 (2002$)
2002$ San Joaquin Valley UAPCD 2003
Unpaved Roads Require paving, 4 inches gravel, or dust suppressant at special event parking
$5,980-$63,200 per ton PM10
2002$ San Joaquin Valley UAPCD 2003
Ref: San Joaquin Valley UAPCD 2003San Joaquin Valley Unified Air Pollution Control District (UAPCD). Final BACM Technological and Economic Feasibility Analysis, prepared by Sierra Research, March 21, 2003. www.soiltac.com/PDF/Final_BACM_Chapter 20 - Fugitive Dust 287Feasibility_Analysis.pdf.
Ref: EPA 1986 "Identification, Assessment, and Control of Fugitive Particulate Emissions," EPA/600/8-86/023. Prepared by Midwest Research Institute, August 1986.
Page 2 of 2