List of Activities - Salt Lake County Lesson Plan Reason for the Seasons Activity ... Understand...
97
©Clark Planetarium 2008 List of Activities: Reason for the Seasons Reason for the Seasons (Short Version) Angle of Incidence Seasons Assessment Activities Seasonal Constellations Exploring Eclipses Phases of the Moon Questions, comments, suggestions: Duke Johnson ([email protected] ) Education Manager Clark Planetarium (801) 456-4925 If you have any books, websites, or other agencies that have served you well in the past, please let us know so that we can include them in future revisions of this activity guide.
Transcript of List of Activities - Salt Lake County Lesson Plan Reason for the Seasons Activity ... Understand...

©Clark Planetarium 2008
List of Activities: Reason for the Seasons Reason for the Seasons (Short Version) Angle of Incidence Seasons Assessment Activities Seasonal Constellations Exploring Eclipses Phases of the Moon Questions, comments, suggestions: Duke Johnson ([email protected]) Education Manager Clark Planetarium (801) 456-4925
If you have any books, websites, or other agencies that have served you well in the past, please let us know so that we can include them in future revisions of this activity guide.


TRPP Lesson Plan
Reason for the Seasons Activity
© Clark Planetarium 2008

Page 2 © Clark Planetarium 2008
Table of Contents Alignment to Utah Core Curriculum 3 Intended Learning Outcomes Core Standard Core Objectives Enduring Understanding Essential Questions
Background 4 Common Misconceptions
Activity 11 Length of Activity Materials Procedures Helpful Hints Formative Assessment Strategies
Learning Extensions 21
Page 3 © Clark Planetarium 2008
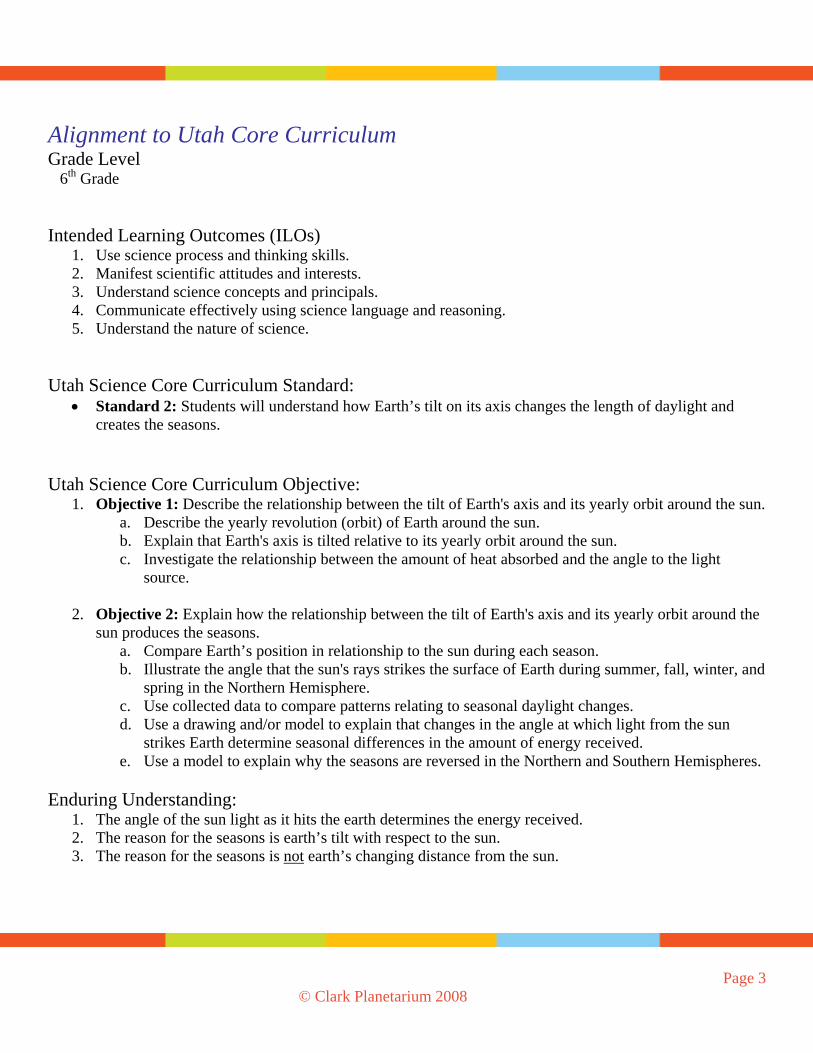
Alignment to Utah Core Curriculum Grade Level 6th Grade Intended Learning Outcomes (ILOs)
1. Use science process and thinking skills. 2. Manifest scientific attitudes and interests. 3. Understand science concepts and principals. 4. Communicate effectively using science language and reasoning. 5. Understand the nature of science.
Utah Science Core Curriculum Standard:
Standard 2: Students will understand how Earth’s tilt on its axis changes the length of daylight and creates the seasons.
Utah Science Core Curriculum Objective:
1. Objective 1: Describe the relationship between the tilt of Earth's axis and its yearly orbit around the sun. a. Describe the yearly revolution (orbit) of Earth around the sun. b. Explain that Earth's axis is tilted relative to its yearly orbit around the sun. c. Investigate the relationship between the amount of heat absorbed and the angle to the light
source.
2. Objective 2: Explain how the relationship between the tilt of Earth's axis and its yearly orbit around the sun produces the seasons.
a. Compare Earth’s position in relationship to the sun during each season. b. Illustrate the angle that the sun's rays strikes the surface of Earth during summer, fall, winter, and
spring in the Northern Hemisphere. c. Use collected data to compare patterns relating to seasonal daylight changes. d. Use a drawing and/or model to explain that changes in the angle at which light from the sun
strikes Earth determine seasonal differences in the amount of energy received. e. Use a model to explain why the seasons are reversed in the Northern and Southern Hemispheres.
Enduring Understanding: 1. The angle of the sun light as it hits the earth determines the energy received. 2. The reason for the seasons is earth’s tilt with respect to the sun. 3. The reason for the seasons is not earth’s changing distance from the sun.

Essential Questions: 1. Why does earth have seasons? 2. Does the angle of the sunlight hitting the earth have any effect? 3. Could other planets in our solar system have seasons?
Background: Introduction: This section covers the basic set up of hardware and preparation of students for “The Reason for the Seasons” globe activity. Overview: This hands-on activity will challenge students’ common misconceptions (see below) by using observation, data collection, analysis and comparison to allow the students to discover the real reason behind the seasons. Students will work together in small scientific groups to research and collect data and convene with the greater scientific community (classroom) to share data and draw conclusions. Students will 1) measure the amount of direct sunlight at specific locations on the globes; 2) estimate the highest point reached by the Sun and also 3) estimate the number of hours of daylight various parts of the Earth receive at different times of the year. Teacher Background: Earth rotates on its axis once a day. Earth also orbits, or revolves around the Sun once each year. Earth’s rotational axis is tilted by about 23.4º relative to its orbit around the Sun. The axis points in a nearly constant direction as Earth circles the Sun. This is evidenced by the northern axis pointing toward Polaris, the North Star. As a result of Earth’s axis tilt and its motion around the Sun, many locations on Earth experience seasons.
Earth Orbit Viewed from the Side Earth’s position in its orbit on the first day of winter, spring, summer, and fall in the Northern Hemisphere. The seasons are reversed in the Southern Hemisphere. Note: the diagram is not to scale and the orbit is viewed from the side. If the orbit were viewed from above, it would appear to be a circle (see page 7).
Page 4 © Clark Planetarium 2008

Since Earth’s tilt is constant, (the North Pole is always pointed toward the North Star), it is best to get into the habit of talking not about tilt, but about “leaning” toward or away from the Sun. This helps students who wind up thinking that our axis wobbles back and forth each year. When it is summer in Utah, Earth’s northern axis is leaning toward the Sun. At this time the Sun is high overhead at noon and we have more hours of daylight than of darkness. The concentrated rays of direct sunlight have more time to warm this part of Earth, so we experience warmer weather.
If Earth were actually the size depicted in the diagram, the Sun would be a sphere 2 meters (6.8 feet) in diameter, and would be 223 meters (730 feet) away.
During Utah’s winter, the northern axis is leaning away from the Sun. At this time of year, the Sun is low in the sky at noon and the length of day is much shorter than the length of night. When the Sun is low in the sky, the Sun’s rays are spread out over a larger area and can’t warm the ground as effectively. With fewer hours of daylight and less efficient heating, we experience colder temperatures even though the Sun is still shining bright.
The following questions can help students reflect on the length of daylight in summer and winter. • In summer, we wait until dark to begin fireworks. What time do fireworks begin? (10-10:30 p.m.) • In winter, we wait until dark to turn on holiday lights. What time are these lights turned on? (5-6 p.m.) As Earth continues to move around the Sun, there is an increase in the hours of daylight and the Sun climbs higher in the sky. Winter changes to spring and then back to summer as we complete one full journey around the Sun.
Page 5 © Clark Planetarium 2008
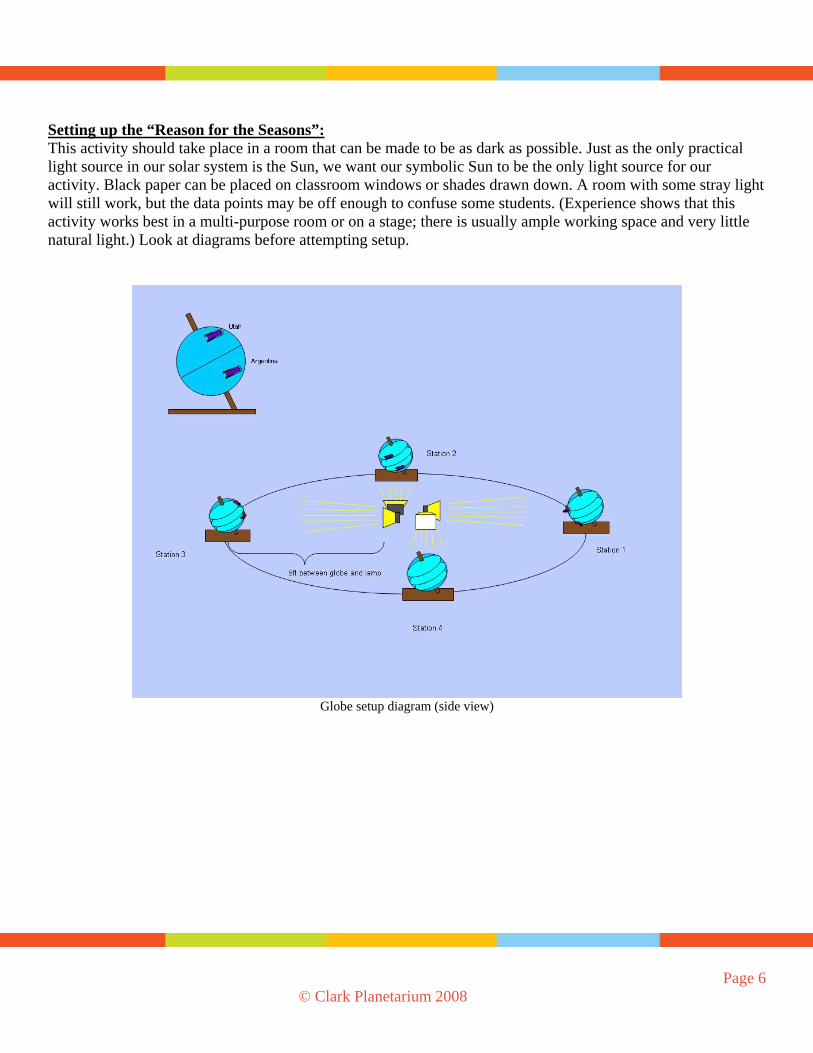
Setting up the “Reason for the Seasons”: This activity should take place in a room that can be made to be as dark as possible. Just as the only practical light source in our solar system is the Sun, we want our symbolic Sun to be the only light source for our activity. Black paper can be placed on classroom windows or shades drawn down. A room with some stray light will still work, but the data points may be off enough to confuse some students. (Experience shows that this activity works best in a multi-purpose room or on a stage; there is usually ample working space and very little natural light.) Look at diagrams before attempting setup.
Globe setup diagram (side view)
Page 6 © Clark Planetarium 2008

Globe set up diagram (top view)
Plug the extension cord into the nearest wall outlet and bring the other end to the center of the activity
area and plug both power strips into it (tape down the cord). Place the 4 lamps on a desk or table that is the same height as the desks on which the globes will be
placed. The individual lamps should be oriented to point in different directions, 90º from each other (for ease
and simplicity the lamps may be oriented facing the four cardinal directions). Plug the lamps into the power strips (2 lamps into each power strip) and test for power and functional bulbs.
Place a small table or level desk in the light path of each of the four lamps about 6 ft from the light source.
Place globes on the smaller tables in the correct order for the diagram. Globe bases have their station numbers printed on them. Place them in the correct order according to the above diagrams. (Regardless of real direction, in this setup, station numbers are South = 1, East = 2, North = 3, West = 4. You may align these directions with the true directions on your site if it makes sense.)
It is a good idea to mark the position of the table on the floor with pieces of masking tape, so as to reference its starting position and ensure consistent data from each successive group.
Each table or station should also have a multi-meter. Each multi-meter should be set to a position four clicks to the left of the top. That setting is labeled “2000m”, and sits in the DCV section.
Page 7 © Clark Planetarium 2008

Page 8 © Clark Planetarium 2008
The activity globes have pegs and solar energy collectors glued to the surface in key locations. The solar energy collectors convert light into electricity (more direct light produces more electricity). The electricity is measured to compare relative levels of light at two locations on the globes at key times of the year. (Each of the four globes has been pre-tested and designated as to which station will provide the best results). Each globe MUST be placed on its respective station table. (Globes are labeled on top with numbers 1, 2, 3, or 4, as are the bases.) Using the ruler, measuring tape or 6-foot string, measure the distances between each globe (measure to the center of the globe’s base, the vertical hole) and the front face of the light source and adjust where necessary, making sure all globes are the same distance from the light source, and centered in the light path. Mark the positions of the globe bases with masking tape, so as to reference its starting position and ensure consistent data from each successive group.
You have now completed construction of a model of Earth’s obit around the Sun. The lamps at the center represent the Sun, and the globes represent Earth’s relative position on the first days of summer, autumn, winter, and spring. Earth’s axis points in a nearly constant direction as Earth orbits the Sun, so all globe axes should point in the same direction. Earth’s orbit is nearly a perfect circle, so in this model, consistency in distance is important. As part of the activity we will move one of the globes to test the effect of changing distance, but for now a consistent distance between the Earth and the Sun is important. A last look over the set up to be sure all is where it should be:
Check power and light source. Check distance and placement of globes in the light path. Check station numbers and verify that they match with their proper globe position. (counter clockwise
rotation 1-4) Check direction of polar axes of globes. (Station 1 Utah leaning toward the Sun, Station 3 leaning
away from the Sun, Stations 2 and 4 neither leaning toward or away form the Sun. Check stations for pens/pencils. Check stations for activity sheets. Check stations Multi-Meters. (Check for power and proper setting. The Multi-Meters should be set on
2000m DCV. This setting gives the most information to provide as much accuracy as needed for the activity. It is VERY important that the setting on the Multi-Meters does not change, or inconsistent information will be collected from one group to the next.
Scientific Research Groups: Before beginning the activity separate the class into 4 equal size groups, 4 to 8 students per group depending on class size. (The students can form into their standard work groups or can be randomly organized by the teacher. The teacher should also reserve the right to reorganize groups that will work together more productively). Each student in the scientific group will have a role or responsibility. Student roles: Probe Specialist (PS), Base Holder (BH), Globe Rotator (GR), Meter Reader (MR), Data Recorder (DR), Researcher #1 (R1), Researcher #2 (R2)
Probe Specialist (PS): One student will need to hold the leads from the Multi-Meter in the sockets on the solar energy collectors.
Page 9 © Clark Planetarium 2008
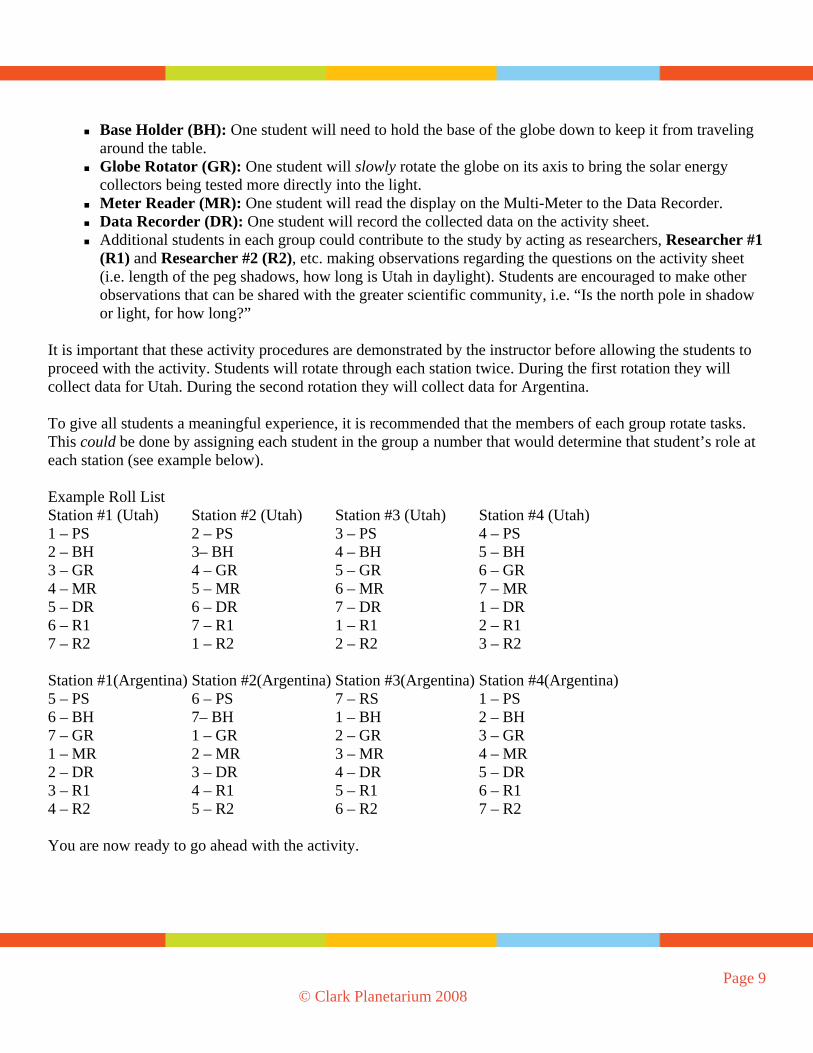
Base Holder (BH): One student will need to hold the base of the globe down to keep it from traveling around the table.
Globe Rotator (GR): One student will slowly rotate the globe on its axis to bring the solar energy collectors being tested more directly into the light.
Meter Reader (MR): One student will read the display on the Multi-Meter to the Data Recorder. Data Recorder (DR): One student will record the collected data on the activity sheet. Additional students in each group could contribute to the study by acting as researchers, Researcher #1
(R1) and Researcher #2 (R2), etc. making observations regarding the questions on the activity sheet (i.e. length of the peg shadows, how long is Utah in daylight). Students are encouraged to make other observations that can be shared with the greater scientific community, i.e. “Is the north pole in shadow or light, for how long?”
It is important that these activity procedures are demonstrated by the instructor before allowing the students to proceed with the activity. Students will rotate through each station twice. During the first rotation they will collect data for Utah. During the second rotation they will collect data for Argentina. To give all students a meaningful experience, it is recommended that the members of each group rotate tasks. This could be done by assigning each student in the group a number that would determine that student’s role at each station (see example below). Example Roll List Station #1 (Utah) Station #2 (Utah) Station #3 (Utah) Station #4 (Utah) 1 – PS 2 – PS 3 – PS 4 – PS 2 – BH 3– BH 4 – BH 5 – BH 3 – GR 4 – GR 5 – GR 6 – GR 4 – MR 5 – MR 6 – MR 7 – MR 5 – DR 6 – DR 7 – DR 1 – DR 6 – R1 7 – R1 1 – R1 2 – R1 7 – R2 1 – R2 2 – R2 3 – R2 Station #1(Argentina) Station #2(Argentina) Station #3(Argentina) Station #4(Argentina) 5 – PS 6 – PS 7 – RS 1 – PS 6 – BH 7– BH 1 – BH 2 – BH 7 – GR 1 – GR 2 – GR 3 – GR 1 – MR 2 – MR 3 – MR 4 – MR 2 – DR 3 – DR 4 – DR 5 – DR 3 – R1 4 – R1 5 – R1 6 – R1 4 – R2 5 – R2 6 – R2 7 – R2 You are now ready to go ahead with the activity.

Common Misconceptions: Many students hold the misconception that the changing seasons are a result of the change in distance between Earth and Sun. Two possible sources for this misconception are: 1. Misleading text book illustrations
Most text books use illustrations that exaggerate the shape of Earth’s orbit around the Sun by tilting the perspective of the illustration (like the orbit illustration on page 4). This fuels the misunderstanding that the orbit is very elliptical, bringing Earth much closer to the Sun at certain times of the year.
Earth’s orbit viewed from above. (Size of Sun and Earth not to scale)
2. Personal experience of warmer temperatures closer to a heat source: The other great misunderstanding is that Earth experiences warmer temperatures in summer because it is closer to the Sun. Many students will have felt increased heat when they have moved closer to a heat source, like a campfire, fireplace, or stove. When someone is very close to a heat source, a small change in distance can result in a noticeable change in received heat. However, Earth is far from the Sun (if the Sun were a ball 6 inches in diameter, Earth would be about the size of the head on a pin and would be about 50 feet away from the Sun), so small changes in distance would have little effect. Example: If someone were already standing 25 feet from a fireplace, would they feel significantly more heat if they moved 6 inches closer? No.
While Earth’s orbit is an ellipse, it differs from being a perfect circle by only 1.67%. In fact, Earth is closest to the Sun on or near January 4 and farthest from the Sun on or near July 4. Utah’s weather on these dates is opposite of what would be expected under this common misconception. This small change in distance accounts for less than one degree in seasonal temperature change, thus, the elliptical nature of Earth’s orbit around the Sun does not vary the distance to the Sun enough to make any noticeable difference in the seasons.
Page 10 © Clark Planetarium 2008

Page 11 © Clark Planetarium 2008
Activity: Length of Activity: Setup: 20 minutes Activity: 90-120 minutes *Note: additional activities can be done with this same setup. Skim the rest of the activities in the binder to make sure you really want to take everything down before trying some of the other activities. Materials Needed: Environment and Materials
4 Earth globes prepared with solar energy collectors and pegs 6 digital multi-meters (4 used to measure solar cell output, 2 spares); these units measure the electricity
output of the solar cells 4 500 watt lamps with stands 1 power strip 1 12 gauge extension cord 1 ruler, measuring tape or 6 ft. string master copy of student worksheet Darkened multipurpose room or classroom with adequate room to move 4 groups of 4-8 students
around 4 stations (area of about 16 ft. in diameter) 1 (or more) electrical outlet(s) 5 desks or small tables (must be level, the same height, and large enough to hold all of the station
materials.) pencil/pen (one for each student) copies of student worksheets (one for each student) 1 roll masking tape 1 projection screen - optional 1 overhead projector – optional 1 overhead copy of the Worksheet (for the overhead projector: classroom analysis and comparison) -
optional Materials Provided:
4 Earth globes prepared with solar energy collectors and pegs 6 digital multi-meters (4 used to measure solar cell output, 2 spares); these units measure the electricity
output of the solar cells 4 500 watt lamps with stands 1 power strip 1 12 gauge extension cord 1 ruler, measuring tape or 6 ft. string master copy of student worksheet
Page 12 © Clark Planetarium 2008
Helpful Hints: Inquiry: It is possible to teach this activity utilizing an inquiry approach or a more directed approach.
While the inquiry method will take a little longer, it is encouraged as it allows more time for the students to build their cognitive framework for the exercise and allows more room for developing useful inquiry skills.
Teachers and students are encouraged to use a questioning approach throughout. There are many
opportunities for students to make observations that are not necessarily listed below. Safety: The following precautions should be followed.
1. These lamps put out 500 watts of energy. They are very bright and very hot. Avoid looking directly at the lights. They are not as bright as the real Sun, but can still make it difficult to see in the dark if gazed upon directly. Avoid touching the lamps. Parts of the lamps do get hot enough to cause serious burns.
2. The lamps are plugged into a power strip with an extension cord. There is a risk of tripping on either of these power cords. The power cords can be taped down to present less of a hazard.
3. If room permits, the scientific groups should revolve from station to station around the outside of the activity circle to minimize the risk of touching the hot lamps and burning one’s self, tripping on power cords, or bumping the globe stations out of position resulting in a collection of bad data.
PRE-ACTIVTY: We highly recommend the use of the “Angle of Incidence” activity (also in this binder) as a lead in to this exploration. Procedure: Rundown of activity rules:
Earth’s orbit is nearly a perfect circle. The position of the table is very important for accuracy. Avoid sitting on, leaning on, or pushing on the tables occupied by the globes. Be careful to not move the globe from its position on the table.
Standing in the Sun’s light and casting a shadow on the Earth is often referred to an Eclipse. We are not learning about Eclipses today, try not to cast shadows or stand in the Sun’s light.
To ensure everyone’s collected data is consistent; do not change the setting on the multi-meter. Introduction for students: Scientists often use models to help them understand things better. That’s what we’re going to do today. • What do the lamps represent? (Sun) • What do the globes represent? (Earth) • If the Sun were the size of one of these lamps (a ball 6 inches in diameter), how big would Earth be? Make a
circle with your fingers to show me. (It would be the size of the head on a pin.)
Page 13 © Clark Planetarium 2008
• How far away from the Sun would it be at that scale? (about 50 feet) • Is our model at the correct scale? (No, but it would be difficult to use one at the correct scale) • How many Earths are there? (one) • Why are there four globes? What might they represent? (Earth at four points in its orbit around the Sun) • Does Earth move? (yes) • What motions does it have? (it spins or rotates on its axis and orbits or revolves around the Sun) • How long for one rotation? (one day) • What do we experience as a result of Earth’s rotation? (day and night) • How long for one orbit (or revolution)? (one year, about 365 days) • What do we experience as a result of Earth’s revolution? (seasons) • Why do we have seasons? (usually a student will suggest that Earth is closer to the Sun in summer and father
from the Sun in winter – acknowledge this as a possibility) • Are there other possible reasons that we have seasons? (accept all without judgment, you may even wish to
post a list) • Do you notice anything about how these four globes are set up? (they are all tilted in the same direction) • Does Earth’s axis point in the same direction as it orbits the Sun? (yes) • Is there any (observational) evidence that it does or does not? (yes) • Does the axis point toward anything in space? (Earth’s northern axis always points toward the North Star, so
we know that the axis stays pointed in the same direction as Earth revolves around the Sun. Make sure NOT to pick an object in the room to represent the North Star as everything is far to close.)
• Could the tilt of Earth’s axis be the reason we have seasons? (point out the orientation of the globes with
respect to the lamps – at station 1 the northern hemisphere leans toward the Sun, and at station 3, the northern hemisphere leans away from the Sun (NOTE: the tilt always stays the same.))
• What are these things on the globes? (solar energy collectors and pegs)

Page 14 © Clark Planetarium 2008
• What do solar energy collectors do? (convert light into electricity) • If more light or more intense light shines on a solar energy collector will it produce more electricity? (yes) • What length of shadow do you have if the Sun is high in the sky? (short) • What length of shadow do you have if the Sun is low in the sky? (long) • So, can we use shadow length to tell how high the Sun is in the sky? (yes) • If there is a vertical stick in the ground, and we observe that the stick’s shadow is short, the Sun is . . . ?
(high in the sky) • If the stick’s shadow is long the Sun is . . . ? (low in the sky) • During this activity, you will need to use shadow lengths to determine if the Sun is high, medium or low in the
sky at a particular location on the globes. • We can use this model of the Earth-Sun system to test both hypotheses (distance vs. tilt) of what causes the
seasons. The Activity: Demonstrate the roles and techniques required to correctly gather data by collecting data for Earth’s closest and furthest distance from the sun for later use.
This demonstration should take place with the use of just one globe. Station 1 works well for this demonstration. Leave the other lamps off so students can see. Verify that the multi-meter is turned on and is on the proper setting (DCV 2000m). Turn on the lamp that faces the globe being used for the demonstration; the other three lamps do not need to be used at this time. Turn off the main lights to darken the classroom. Ask for a couple volunteers to help with the demonstration. Begin the demonstration by positioning the volunteer students and defining their respective roles in detail. (Several roles could be demonstrated by the teacher for both speed and clarity of presentation.) - Probe Specialist: should hold the probe leads from the multi-meter securely in the sockets on the
solar energy collectors. Keep hands and wires from covering or casting shadows on the solar energy collectors. As the leads are being held in place it is important that the “Probe Specialist” does not put so much pressure on the globe to interfere with other parts of the data collection.
- Base Holder: should simply keep the globe base from moving from its predetermined location. This individual needs to hold the base of the globe securely, but not hinder the movements of the others in the team or cast shadows on the globe.
- Globe Rotator: (to be demonstrated by instructor) should slowly rotate the globe left and right brining the solar energy collector directly into the light (have the center of the collector facing the

Page 15 © Clark Planetarium 2008
light) to achieve the highest number on the multi-meter. The “Globe Rotator” should listen to and follow the direction of the “Meter Reader”. After the highest value has been displayed by the meter, the “Meter Reader” should tell the “Globe Rotator” to stop and slowly rotate back the other direction until the highest value has been reestablished by the meter. (Hint: Experience shows that students who rush through this process usually end up with inconsistent data. When the highest value has been found, the “Globe Rotator” should remove his/her hands momentarily to allow the globe to stand alone and settle for more accurate data. Impress upon the students that their data MUST BE REPRODUCIBLE!!! This means that each reading should be attained at least twice) Do not rush through this process or the data will not be accurate.
- Meter Reader: should read the display on the multi-meter and report to the “Globe Rotator” when the greatest value has been displayed by the meter. Working together, the “Meter Reader” and “Globe Rotator” rotate the globe back and forth several times to find the highest consistent value on the meter. When the greatest value has been found, this information will be reported to the “Data Recorder”. Explain: The numbers on the multi-meter display will not give an accurate representation of actual seasonal temperatures or values of actual solar radiation. Rather, the numerical values simply provide a reference for comparison, as the level of direct sun light increases, so does the electrical output from the solar energy collector. Tell the students that a higher number corresponds to more sunlight.
- Data Recorder: records in a clear hand the highest consistent values collected by the “Meter Reader”. Other students in the group will be able to copy the data onto their individual sheets immediately after data collection or a later time. The “Data Recorder” could also collect the results of the student’s inquiries regarding the other learning points on the work sheet.
Near and Far:
After the demonstration of scientific roles and while you still have volunteers to help, begin the discussion of the effect that the distance between the Earth and the Sun has on the seasons. Ask: “What is the shape of Earth’s orbit around the Sun?” (Students will usually reply “ellipse” or “oval”.) Ask: “Is this setup an accurate model of the Earth’s orbit around the Sun?” (Students respond, “No”) Ask: How is this model different from the real thing?” (The Sun is a sphere and casts light in all directions; The Earth shouldn’t be this big compared to the Sun; The Earth should be farther away.) Ask: “Does the shape of Earth’s orbit have any influence or effect on the seasons?” (Students will usually have mixed opinions.) This is one of the questions we will answer in this activity.
To collect the data for the near and far extremes of Earth’s elliptical orbit use only the one globe used to demonstrate the student roles. Have the “Base Holder” re-position the globe about one inch closer to the Sun.

Page 16 © Clark Planetarium 2008
Explain: This distance is not exact, but within the scale of our model this change closely resembles Earth’s closest distance to the Sun (the actual orbit is off from a true circle by about 1.6% closer or 1.6% farther away). Have the Probe Specialist insert the leads for the multi-meter into the solar energy collector for Utah only while the teacher holds the multi-meter. The instructor rotates the globe to bring the solar energy collector into the light and reads to the class the changing values on the digital display. Read aloud the 5 or so values on either side of the maximum. Call special attention to the sequential progression of numbers both up and down. When the globe has been oriented so the solar energy collector is receiving as much direct light as possible and the highest number on the multi-meter has been achieved at least twice, record this value in the space provided on the activity sheet. Invite all students to record the maximum number on the data collection sheet. Next, have the “Base Holder” move the globe back about an inch behind its pre-designated position (2 inches from its current position). This represents the farthest point Earth gets from the Sun. The data for Utah should then be collected and recorded in the same manner. (After collecting the data for “Near and Far”, reset the globe to its original position for the remainder of the group activity.) You are only collecting data now, we will analyze it after the tilt data is collected.
The Scientific Groups and the Data Collection:
Send the four scientific groups to their stations. After the groups are at the stations, have them note which station they are at. At this point it is very important to instruct each group that they are to write the collected information in the correct spaces on the activity sheet (many students need to be reminded that they are not necessarily starting at station #1). ALL data collection from here through the end of the activity deals with Earth’s tilt. If the roles for this station have not been pre-assigned, have the students decide who will perform each task. Each student should record the data on their own worksheet. The scientific groups will collect data in the same manner as the demonstration at each of the four stations; with the exception that they will not be moving the globes to collect data for the near and far distances from the Sun. Have the students collect data only for Utah at each station. Data for Argentina should be collected during the second pass. This will allow students to experience a grater variety of roles. To keep time to a minimum, the groups will spend no more than 7 or 8 minutes at their first station, gathering data as quickly and accurately as possible. The next 3 rotations should take about ½ the time.
Students should change roles at each station. When most of the groups have collected their data and answered the two questions regarding shadow length and hours of daylight over Utah, announce that the groups should finish with their first station data collection. When all have completed their data collection, announce that it is time to revolve to the next station: 1 to 2, 2 to 3, and so on. Counterclockwise as viewed from above the North Pole (see diagram).

The groups revolve from one station to the next as the instructor dictates, visiting all of the stations twice in a counter clockwise order, completing two full orbits (2 years) of the Earth around the Sun in the proper direction. As the activity progresses, continuously bring students to focus on the reason we experience seasons by drawing the student’s attention to the questions on the activity sheet as well as with other relevant thoughts.
Ask: “What is the difference between the position of this globe and the globe you were just at? Ask: “Is the shadow cast by the peg longer or shorter than the last station?” Ask: “At this station, does the Sun ever shine on the north pole?” Ask: “What season do you think this station is supposed to represent?” Ask: “What is the weather like in China?...Australia?”
It is very important to periodically check the positions of the globes and the tables against their starting reference markers and make adjustments as necessary, particularly as students are moving from station to station. This could be done by the “Base Holder”, or for large groups a student could be assigned as a “Globe Position Checker”. The multi-meters should be checked for proper setting as well. This could be done by the “Meter Reader”.
Page 17 © Clark Planetarium 2008

Data Analysis and Assessment with the Greater Scientific Community: When the small groups have completed collecting all of the data for Utah, Argentina and answering the two questions for each station, bring the whole class together in front of the white board or projection screen. Keep the groups together so they can collaborate and share their findings with the greater scientific community more efficiently. Explain again: “The solar energy collectors collect light and turn it into electricity. The multi-meter measures the amount of electricity and gives us a value. A higher value on the meter means there is more light”. Ask: “How can we use the data that we collected to help us determine why we have seasons?” Using the graph on the worksheet transparency for the overhead (or a drawn copy of the graph on the white board for all to see (this could also be done on chart paper for review later), plot the data for Utah collected at the four stations in their respective column, using different colors or symbols to represent each student group on the same graph (each group will likely have differing data that can be used to show variance in data collection and can be analyzed later to find the cause of the anomaly).
Station vs. Sunlight
200
250
300
350
400
450
1 2 3 4
Station
Su
nli
gh
t
Utah Argentina
Sample graph showing data for Group 1
Take the data for the near and far distances from the Sun collected for Utah during the demonstration at the beginning of the activity and plot them in a space provided near the graph. Find the change in sunlight compared to the total amount of sunlight between the near and far. (The difference is usually a value of about 4 points or units of energy or about 1% or 2% of the highest value from this station. *Observational note – this percentage is similar to the variance in Earth’s elliptical orbit.*) Use at least some of these questions to elicit the data needed for analysis. Ask: “Which hypothesis for the reason for the seasons (distance or tilt) shows the greatest change or the greatest percentage difference in the amount of light seen over Utah?” Ask: “Does the tilt of the Earth’s axis really have anything to do with our seasons?” “How?” “Let’s compare the data you collected.”
Page 18 © Clark Planetarium 2008

Page 19 © Clark Planetarium 2008
Ask: “Which station had the highest value for Utah?” (Station #1) Reference the work sheet for other notes and observations that were collected
Ask: “How long was the shadow of the peg at New York at this station?” (Short shadow; Sun is high in the sky) *Students should know that direct sunlight is much more efficient at warming the surface of the Earth because the Sun’s rays are more concentrated in a local area.* Ask: “How many hours of daylight were over Utah at station #1?” (More than half of a rotation, or more than 12 hours of daylight.) Ask: “Is the tilt of the Earth’s axis leaning toward or away from the Sun?” (Toward - refer to the station globe if necessary) Ask: “What season do you suppose this might be?” (Summer) Ask: “Which station had the lowest value for Utah?” (Station #3) Reference the work sheet for other notes and observations that were collected Ask: “How long was the shadow of the peg at New York at this station?” (Very long, 3 inches; the Sun is very low in the sky) *Students should know that indirect sunlight or sunlight from very low angles is spread across a larger area and therefore does not warm the Earth’s surface as efficiently as direct sunlight.* Ask: “How many hours of daylight were over Utah at station #3?” (Less than half of a rotation, or less than 12 hours of daylight.) Ask: “Is the tilt of the Earth’s axis leaning toward or away from the Sun?” (Away - refer to the station globe if necessary) Ask: “What season do you suppose this might be?” (Winter) Ask: “What season do you think Station #2 is supposed to represent?” (Spring or Fall) Ask: “How many hours of daylight were over Utah at station #2?” (Exactly half of a rotation; 12 hours of day and 12 hours of night, Equinox) Ask: “What observations can you make to discover which of stations 2 and 4 is spring and which is fall?” (Fall, station 2, comes after summer and spring, station 4, follows winter) Work through the math with the students, pausing to enhance understanding as needed. Remember that you need to treat distance and tilt separately. Distance numbers are typically a difference of 4 out of a total available sunlight of about 400. Tilt numbers (highest amount of sunlight recorded minus least

Page 20 © Clark Planetarium 2008
amount of sunlight) are typically around a difference of 125 out of 400 possible. Written as fractions, we compare 4/400 to 125/400 since there is usually about 125 points of change from highest summer readings to lowest winter readings. Most students quickly see that 125/400 is a larger change, but sometimes fraction review is required. (For math extensions, these fractions can be reduced or changed to percents, but experience shows that any further manipulation of the raw numbers initially can lead to confusion). After working through the Utah example, students should be asked to work in groups to fill in the numbers for Argentina and analyze the data to determine where the seasons fall in Argentina. Have them write several sentences comparing seasons in Utah to Argentina. Example: Seasons are reversed in Utah and Argentina. At station 1 it is summer in Utah and winter in Argentina. At station 3 it is winter in Utah and summer in Argentina. After completion of this section, you may also want to talk to students about an error analysis, trying to solicit responses about light from windows, light bouncing off of walls, floors, and ceilings affecting the readings as well as the possible variance in multi-meters and different outputs by all 4 solar energy collectors under identical conditions. This is largely why a range in data is seen.
The students can now deduce the real reason for the season using the data they collected and observations they made during the activity. The collected data can also be used for other classroom activities to show comparisons between the northern and southern hemispheres and also similar latitudes around the globe. See the “No Tilt” Globe Activity sheet for an explanation of how to examine an Earth without tilt. Formative Assessment Strategies: See attached master worksheet
Learning Extensions: Booklist: Agencies: Websites:
USOE
250 East 500 South | P.O. Box 144200 | Salt Lake City, UT 84114-4200
Phone: 801-538-7803 | Fax: 801-538-7769 |
Page 21 © Clark Planetarium 2008


Season Globes Data Sheet Name _______________________
DISTANCE
Circle your hypothesis: Seasons are caused by Earth’s CHANGING DISTANCE from the Sun OR Seasons are caused by Earth’s TILT.
Directions: Record the data as it is gathered in the appropriate box. Answer all questions. Readings are in “V” (Volts).
Far:
Station 1, Utah
Near:
Difference:
2) How big was the change in distance?
1) How far is the globe from the light?
Utah:
Argentina:
Max Readings
4) Is Utah in daylight for: half a rotation, less than half, more than half?
Station 1 TILT
5) How long is the shadow of the peg near New York (when shortest)?
6) Is the Sun HIGH, MEDIUM or LOW in the sky when the peg’s shadow is shortest at this station?
Utah:
Argentina:
Max Readings
7) Is Utah in daylight for: half a rotation, less than half, more than half?
Station 2
8) How long is the shadow of the peg near New York (when shortest)?
9) Is the Sun HIGH, MEDIUM or LOW in the sky when the peg’s shadow is shortest at this station?
TILT
Circle the shadow
Circle the shadow
3) What is the % change in distance?
© Clark Planetarium 2008

Utah:
Argentina:
Max Readings
10) Is Utah in daylight for: half a rotation, less than half, more than half?
Station 3 TILT
11) How long is the shadow of the peg near New York (when shortest)?
12) Is the Sun HIGH, MEDIUM or LOW in the sky when the peg’s shadow is shortest at this station?
Utah:
Argentina:
Max Readings
13) Is Utah in daylight for: half a rotation, less than half, more than half?
Station 4
14) How long is the shadow of the peg near New York (when shortest)?
15) Is the Sun HIGH, MEDIUM or LOW in the sky when the peg’s shadow is shortest at this station?
TILT
Amount of Sunlight in Utah
250
300
350
400
450
1 2 3 4
Station
Sunl
ight
DISTANCE Effect TILT Effect
1) Which station represents Utah's Summer? Why?
2) Which has a greater affect, distance or tilt?
3) What is the reason that we have seasons?
Data Analysis
4) Compare shadow length at each station. Which season has the longest shadows? __The Shortest? __
Why?
Circle the shadow
Circle the shadow
Use different colors for Utah and Argentina
TILT
© Clark Planetarium 2008

TRPP Lesson Plan
Reason for the Seasons Activity
(Short Version)
© Clark Planetarium 2008

Page 2 © Clark Planetarium 2008
Setup: Introduction: This section covers the basic set up of hardware and preparation of students for “The Reason for the Seasons” globe activity. Pre-Activity: If time permits, do the “Angle of Incidence” activity as a lead-in to this activity. Overview: This hands-on activity will challenge students’ common misconceptions (see below) by using observation, data collection, analysis and comparison to allow the students to discover the real reason behind the seasons. Students will work together in small scientific groups to research and collect data and convene with the greater scientific community (classroom) to share data and draw conclusions. Students will 1) measure the amount of direct sunlight at specific locations on the globes; 2) estimate the highest point reached by the Sun and also 3) estimate the number of hours of daylight various parts of the Earth receive at different times of the year.

Page 3 © Clark Planetarium 2008
Note: Each globe MUST be placed on its respective station table. (Globes are labeled on top with numbers 1, 2, 3, or 4, as are the bases.) Failure to do so may result in poor data gathering. Using the ruler, measuring tape or 6-foot string, measure the distances between each globe (measure to the center of the globe’s base, the vertical hole) and the front face of the light source and adjust where necessary, making sure all globes are the same distance from the light source, and centered in the light path. Mark the positions of the globe bases with masking tape, so as to reference its starting position and ensure consistent data from each successive group.
Materials Provided: 4 Earth globes prepared with solar energy collector and pegs 6 digital multi-meters (4 used to measure solar cell output, 2 spares); these units measure the electricity
output of the solar cells; they should be set on DCV 2000m 4 500 watt lamps with stands 1 power strip 1 12 gauge extension cord 1 ruler, measuring tape or 6 ft. string master copy of student worksheet
Teacher Provided Materials: Copy 1 data sheet for each student or group. Observe normal and recommended safety procedures. Procedure: Rundown of activity rules:
Earth’s orbit is nearly a perfect circle. The position of the table is very important for accuracy. Avoid sitting on, leaning on, or pushing on the tables occupied by the globes. Be careful to not move the globe from its position on the table.
Standing in the Sun’s light and casting a shadow on the Earth is often referred to as an Eclipse. We are not learning about Eclipses today, try not to cast shadows or stand in the Sun’s light.
To ensure everyone’s collected data is consistent; do not change the setting on the multi-meter. Student roles: Probe Specialist (PS), Base Holder (BH), Globe Rotator (GR), Meter Reader (MR), Data Recorder (DR), Researcher #1 (R1), Researcher #2 (R2) To give all students a meaningful experience, it is recommended that the members of each group rotate tasks. Explain that Scientists use models to predict what’s happening in complex systems. Introduce activity in an inquiry way, having students explain what the model might represent. Ask a number of the relevant questions at the beginning of the activity.

Page 4 © Clark Planetarium 2008
Introduction for students: Scientists often use models to help them understand things better. That’s what we’re going to do today. • What do the lamps represent? (Sun) • What do the globes represent? (Earth) • If the Sun were the size of one of these lamps (a ball 6 inches in diameter), how big would Earth be? Make a
circle with your fingers to show me. (It would be the size of the head on a pin.) • How far away from the Sun would it be at that scale? (about 50 feet) • Is our model at the correct scale? (No, but it would be difficult to use one at the correct scale) Turn on one light at station 1 to demonstrate the techniques and roles students will assume throughout this activity. Model skills as you take the “Near and Far” data. Have students record. Turn on remaining 500 W halogen lights in center of room. Send students to stations to begin data collection. Circulate between stations to assist students in proper data collection. The groups revolve from one station to the next as the instructor dictates, visiting all of the stations twice in a counter-clockwise order, completing two full orbits (2 years) of the Earth around the Sun in the proper direction. As the activity progresses, continuously bring students to focus on the reason we experience seasons by drawing the student’s attention to the questions on the activity sheet as well as with other relevant thoughts. Ask: “What is the difference between the position of this globe and the globe you were just at? Ask: “Is the shadow cast by the peg longer or shorter than the last station?” Ask: “At this station, does the Sun ever shine on the north pole?” Ask: “What season do you think this station is supposed to represent?” Ask: “What is the weather like in China?...Australia?”

Page 5 © Clark Planetarium 2008
Station vs. Sunlight
200
250
300
350
400
450
1 2 3 4
Station
Su
nli
gh
t
Utah Argentina
Sample graph showing data for Group 1
It is very important to periodically check the positions of the globes and the tables against their starting reference markers and make adjustments as necessary, particularly as students are moving from station to station. This could be done by the “Base Holder”, or for large groups a student could be assigned as a “Globe Position Checker”. The multi-meters should be checked for proper setting as well. This could be done by the “Meter Reader”. Take the data for the near and far distances from the Sun collected for Utah during the demonstration at the beginning of the activity and plot them in a space provided near the graph. Find the change in sunlight compared to the total amount of sunlight between the near and far. (The difference is usually a value of about 4 points or units of energy or about 1% or 2% of the highest value from this station. *Observational note – this percentage is similar to the variance in Earth’s elliptical orbit.*) The students can now deduce the real reason for the season using the data they collected and observations they made during the activity. The collected data can also be used for other classroom activities to show comparisons between the northern and southern hemispheres and also similar latitudes around the globe. See the “No Tilt” Globe Activity sheet for an explanation of how to examine an Earth without tilt.
USOE
250 East 500 South | P.O. Box 144200 | Salt Lake City, UT 84114-4200
Phone: 801-538-7803 | Fax: 801-538-7769 | E-mail:


© Clark Planetarium 2008 Page 1
TRPP Lesson Plan
Angle of Incidence Activity

© Clark Planetarium 2008 Page 2
The Importance of Sun Angle or Distance Activity Description: This demonstration/activity can be used prior to or after the “Reasons for the Seasons” activities. After some testing, this activity appears to work at least as well as the “linchpin” to solidify understanding when done after the main “Seasons” activity. If used as a post activity, part 2 should be done IMMEDIATELY after Part 1. Connections can be made to light and angle of incidence through this and other inquiry activities in this kit. In the first part of the activity, students choose multiple angles by rotating a solar cell. *Note: Placing the solar panel too close to the light for prolonged periods can cause it to be damaged. Always keep it 4 feet away or more. Teacher Background: Light is most intense when it strikes a surface at right angles to the surface. When this occurs, the angle of incidence of the incoming light is 0°. When the angle of incidence is greater than 0 °, the same amount of light is spread over a larger area. So, there is less light striking each unit of area and light at the surface is less intense. This phenomenon is most pronounced at large angles as small changes angle lead to a large change in area covered—much like the rapid lengthening of shadows just prior to sunset. On Earth, less light striking an area results in less heating of the surface and lower temperatures. Solar cells convert light energy into electrical energy. Greater light intensity striking a solar cell results in greater output of electrical energy. Since the light output from the Sun or the light used in the activity is essentially constant, the greatest electrical energy is generated when the plane of the solar cell is perpendicular to the light source, a 0 angle of incidence. As the angle of incidence to the light source increases, the energy output of the solar cell decreases because a fixed amount of light is spread over a larger area. As the angle is increased toward 90 in either direction, the electrical energy (voltage) from the solar cell will decrease. This is similar to dumping a glass of water onto a large desk. Since you only have so much water, it must spread out to cover the surface, although it will be at a much shallower depth than when concentrated in the glass. Materials needed: (1 )500 W halogen light (1) 12 gauge power cord (1) Angle of Incidence Device (PVC tube with attached solar cell mounted to a bookend) (1) multi-meter with probes (1) overhead transparency or markers and white board to record data and graph results (1) power strip (optional) (1) Light Area Measurement Grid (1) Board (19” x 14”) with hole (This is also the divider in the kit with the lights) (2) Erasable markers of different colors
© Clark Planetarium 2008 Page 3
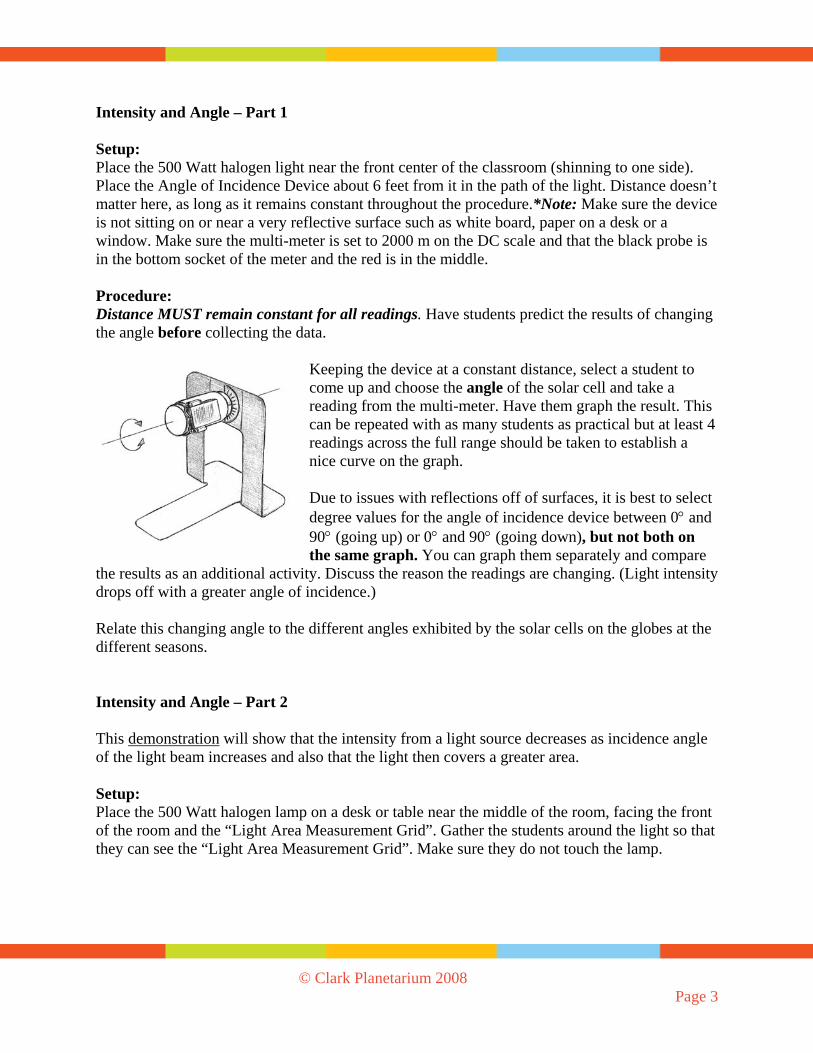
Intensity and Angle – Part 1 Setup: Place the 500 Watt halogen light near the front center of the classroom (shinning to one side). Place the Angle of Incidence Device about 6 feet from it in the path of the light. Distance doesn’t matter here, as long as it remains constant throughout the procedure.*Note: Make sure the device is not sitting on or near a very reflective surface such as white board, paper on a desk or a window. Make sure the multi-meter is set to 2000 m on the DC scale and that the black probe is in the bottom socket of the meter and the red is in the middle. Procedure: Distance MUST remain constant for all readings. Have students predict the results of changing the angle before collecting the data.
Keeping the device at a constant distance, select a student to come up and choose the angle of the solar cell and take a reading from the multi-meter. Have them graph the result. This can be repeated with as many students as practical but at least 4 readings across the full range should be taken to establish a nice curve on the graph. Due to issues with reflections off of surfaces, it is best to select degree values for the angle of incidence device between 0 and 90 (going up) or 0 and 90 (going down), but not both on the same graph. You can graph them separately and compare
the results as an additional activity. Discuss the reason the readings are changing. (Light intensity drops off with a greater angle of incidence.) Relate this changing angle to the different angles exhibited by the solar cells on the globes at the different seasons. Intensity and Angle – Part 2 This demonstration will show that the intensity from a light source decreases as incidence angle of the light beam increases and also that the light then covers a greater area. Setup: Place the 500 Watt halogen lamp on a desk or table near the middle of the room, facing the front of the room and the “Light Area Measurement Grid”. Gather the students around the light so that they can see the “Light Area Measurement Grid”. Make sure they do not touch the lamp.

© Clark Planetarium 2008 Page 4
Procedure: Turn off the lights in the classroom. Hold the board with the hole in front of the lamp. (Be careful not to touch the lamp as it will be hot). The bottom of the board may be rested on the table. With the lamp on, have someone hold the “Light Area Measurement Grid” a few feet in front of the board. The grid should be perpendicular to the board, so that the "angle of incidence" of the light beam is 0 degrees. Have the students observe the intensity of the light on the grid. Using an erasable marker, trace out the area on
the grid that is illuminated by the light passing through the hole in the board. Tilt the grid so that the incidence angle of the light beam on the board is more than 45 degrees (until the light is noticeably less intense). Make sure that the actual distance from the light to the grid does not increase.
Once again, have the students observe the intensity of the light on the grid. Using a separate color, trace out the illuminated area on the grid. Questions for the Students: What happens to the brightness of the light on the board as the angle of incidence increases? (decreases) What happens to the size of the lit area on the board as the angle of incidence increases? (increases)

© Clark Planetarium 2008 Page 5
Why does the light intensity decrease? (The same amount of light is spread out over a larger area) Does the amount of light coming out of the hole in the board change as we tilt the grid? (no) How much more area does this same amount of light cover when the grid is tilted to a grater angle? (more, but answers will vary based on angle) When the Earth is illuminated by the Sun, do we receive the most energy when the angle of the incident radiation is large or small? (small) At small angles, that means that the Sun is higher in the sky and the Sun’s rays strike Earth more directly and provide more efficient heating.
USOE
250 East 500 South | P.O. Box 144200 | Salt Lake City, UT 84114-4200
Phone: 801-538-7803 | Fax: 801-538-7769 | E-mail:


© Clark Planetarium 2008 Page 1
TRPP Lesson Plan
Seasons Assessment Activites

© Clark Planetarium 2008 Page 2
USOE
250 East 500 South | P.O. Box 144200 | Salt Lake City, UT 84114-4200
Phone: 801-538-7803 | Fax: 801-538-7769 | E-mail:

Seasons Assessment (Unless otherwise stated, all questions refer to observers in the northern hemisphere.) Circle the correct answer or complete the question as directed.
1) When are the shadows the shortest? a) June 21 b) Dec 21 c) March 21 d) September 21 2) When are shadows the longest? a) June 21 b) Dec 21 c) March 21 d) September 21 3) When is the sun lowest in the sky? a) June 21 b) Dec 21 c) March 21 d) September 21 4) When is Utah in daylight for more than half a rotation (more than 12 hours daylight).
a) June 21 b) Dec 21 c) March 20 d) September 22 5) Draw the correct orientation of Earth as it revolves (orbits) around the sun. Include the Earth,
Sun, orbital path and Earth’s axis in your drawing.
6) As the intensity of sunlight increases, the voltage generated by the photo diodes goes: a) up, b) down c) stays the same
7) A flagpole stands in the school yard. Draw its shadow in summer compared to its shadow in winter. Include the position of the sun.
Name ______________________
Summer Winter
(over)

8) When in Utah will a flag pole cast no shadow because the sun is directly overhead? a) June 21 b) Dec 21 c) Never d) Every day at noon
9) Explain what effect Earth’s changing distance from the sun has on its seasons. _________ ____________________________________________________________________________________________________________________________________________________________ 10) Using the word box, complete the statements below for summer and winter in the northern
hemisphere.
Summer a. Shadows are __________________.
toward more than low less than indirectly long away high directly short
b. There are _________________ 12 hours of daylight. c. The sun is _________________ in the sky at noon. d. The sun’s rays hit us very __________________. e. The northern hemisphere is leaning __________ the sun.
Winter f. Shadows are __________________. g. There are _________________ 12 hours of daylight. h. The sun is _________________ in the sky at noon. i. The sun’s rays hit us very __________________. j. The northern hemisphere is leaning ___________ from the sun.

TILT, DAYLIGHT AND SEASONS WORKSHEET Activity Description: Students will use a data table to make a graph for the length of day and average high
temperature in Utah. They will then answer questions based on the available data. STANDARD II: Students will understand how Earth’s tilt on its axis changes the length of daylight and creates the seasons. Objective 1: Describe the relationship between the tilt of Earth's axis and its yearly orbit around the sun. a. Describe the yearly revolution (orbit) of Earth around the sun. b. Explain that Earth's axis is tilted relative to its yearly orbit around the sun. c. Investigate the relationship between the amount of heat absorbed and the angle to the light source. Objective 2: Explain how the relationship between the tilt of Earth's axis and its yearly orbit around the sun produces the seasons. a. Compare Earth’s position in relationship to the sun during each season. b. Compare the hours of daylight and illustrate the angle that the sun's rays strikes the surface of Earth during
summer, fall, winter, and spring in the Northern Hemisphere. c. Use collected data to compare patterns relating to seasonal daylight changes. d. Use a drawing and/or model to explain that changes in the angle at which light from the sun strikes Earth,
and the length of daylight, determine seasonal differences in the amount of energy received. e. Use a model to explain why the seasons are reversed in the Northern and Southern Hemispheres. Background: Earth moves around the Sun in a path that nearly repeats itself about every 365.25 days. Earth’s path around the Sun is called its orbit. Contrary to how it appears in most diagrams (including the diagram below), Earth’s orbit is almost a perfect circle as is apparent when viewed from directly above. Earth’s axis of rotation is an imaginary line that passes through Earth’s north and south poles. Earth rotates around this axis, which causes day and night. Earth’s axis of rotation is not straight up and down with respect to its orbit, but it is tilted by about 23.4 degrees with respect to this up and down direction.
Fig. 1 (Beginning at left, moving counter-clockwise) Earth’s position in its orbit on the first day of winter, spring, summer, and fall in the Northern Hemisphere. The seasons are reversed in the Southern Hemisphere. Note: the diagram is not to scale and the orbit is viewed from the side. If the orbit were viewed from above, it would appear to be a circle.

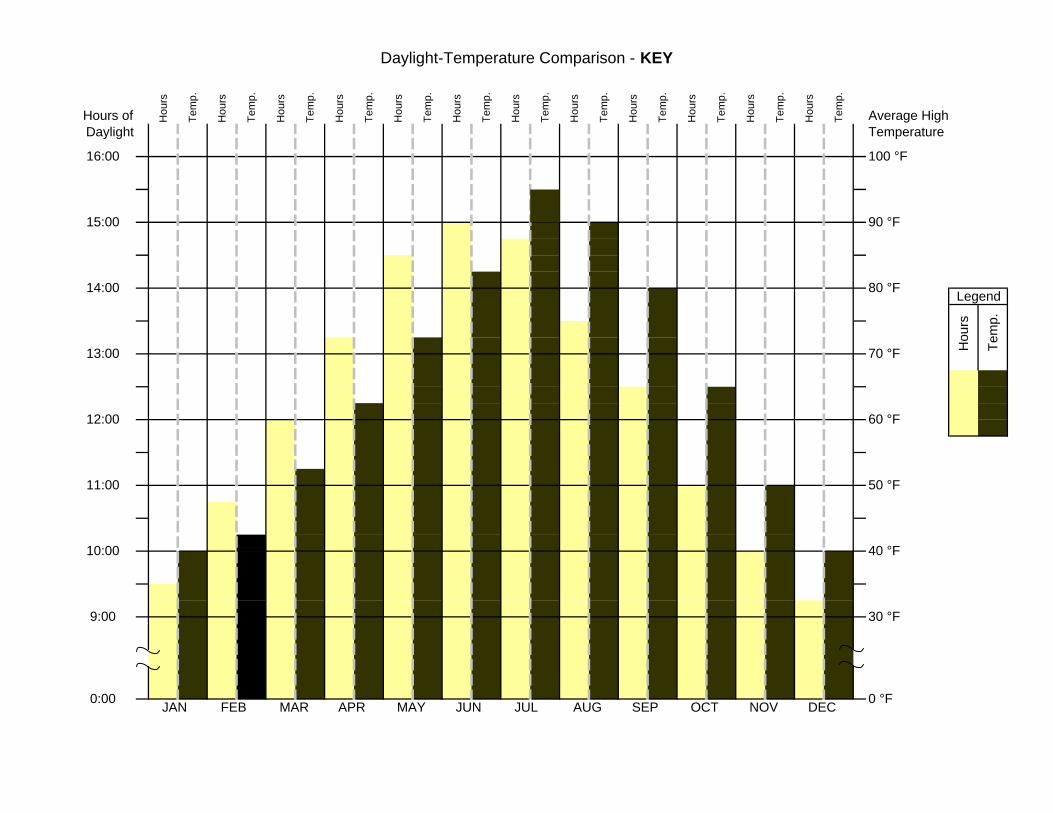
Earth’s axis of rotation points in the same direction (toward the North Star) as Earth rotates on its axis and moves in its orbit around the sun. Because of this, the length of daylight at a particular location on Earth changes throughout the year (other than at the equator). For example, about June 21 every year, Earth is at a place in its orbit where the northern axis is most leaning toward the Sun. On this day, Utah receives about 15 hours of daylight. With 15 hours of solar heating and only 9 hours of cooling at night, the weather is hot. Six months later, about December 21, Earth is on the other side of the Sun. Here, its northern axis leans away from the Sun and Utah receives only about 9 hours of daylight. Now, with only 9 hours of heating and 15 hours of cooling, the weather is cold. *Note that earth does NOT wobble back and forth each year on its axis at it orbits the sun as many believe. Questions: Why do the days with the greatest amount of daylight not have the highest temperatures? Why are the days with the least amount of daylight not the coldest? Summer and Winter Some materials (especially metals) can be heated or cooled quickly. The top layer of Earth’s surface (especially if loose dirt or sand) also heats and cools quickly. Other materials (like water) are able to absorb quite a lot of heat without changing their temperature very much, so it takes a long time to heat and cool them. (See “HEATING WATER” below) Since the sun’s rays hit us most directly in Utah in May, June, and July, they do a very good job concentrating the available energy (see “light area measurement grid”) on the water and land during this time. This heat energy builds up slowly from day to day. After June 21, the sun is still up almost as high each day (direct light) and daylight is almost as long. This continues to warm the water and land very efficiently. Because of this, the land and water reach a maximum temperature in late July. After this time, the lower height of the sun and shorter hours of daylight allow cooling to take place. Throughout this process, water takes much longer to warm or cool than does the land. Similarly, the coldest days are usually around the last week of January or first week of February. A low sun angel (indirect light) and almost as few hours of sunlight as on the winter solstice combine to allow cooling to reach a maximum very near the end of January. Spring and Fall: Temperatures are cooler in the spring than in the fall for the same reasons as listed above. In the spring, the water and land are still trying to warm up from a cold winter. Fall is warmer than spring because the water and land still retain heat and slowly give up more and more as we approach winter. HEATING WATER A pan filled with water is placed on a stove burner and it is turned on High. While the pan heats up quickly, the water does not. After five minutes, the stove is turned down slightly to Medium-High. Does the water immediately become cooler? No. It is receiving almost as much heat on Medium-High as on High. For a time after the stove is turned down, the water temperature continues to rise. About 3/4 of Earth’s surface is covered by water. So Earth behaves in a similar way to the pan of water. In the Northern Hemisphere, the maximum heat received from the Sun occurs about June 21. A day later, the amount of heat received from the Sun is only slightly less, so temperatures continue to increase. In fact, the highest average temperatures occur about one month later. Similarly, the lowest

average temperatures occur about a month after the date when the Northern Hemisphere receives the least amount of heat from the Sun. Materials: (Worksheets) Sunrise-Sunset and Temperature Data for Salt Lake City, Utah
Daylight-Temperature Comparison Graph

Name ____________________
SUNRISE-SUNSET AND TEMPERATURE DATA FOR SALT LAKE CITY, UTAH
Directions: Calculate the length of daylight for each day listed below.
DATE SUNRISE SUNSET Length of Daylight in hours and minutes
Ave High (°F)
Jan 15 7:50 AM 5:24 PM 38
Feb 15 7:22 AM 6:02 PM 43
Mar 15 7:40 AM 7:34 PM 53
Apr 15 6:49 AM 8:07 PM 63
May 15 6:11 AM 8:38 PM 72
Jun 15 5:56 AM 9:00 PM 82
Jul 15 6:09 AM 8:58 PM 94
Aug 15 6:38 AM 8:26 PM 91
Sep 15 7:08 AM 7:37 PM 80
Oct 15 7:38 AM 6:47 PM 65
Nov 15 7:14 AM 5:10 PM 49
Dec 15 7:44 AM 5:01 PM 39
Average high temperatures are 59-year averages from the National Weather Service Field office in Salt Lake City, Utah.
Directions: Using the Daylight—Temperature Comparison Worksheet, make a bar-graph of both the length of daylight and average high temperature. Use a different color for hours of daylight and average high temperature.
1) How long does the Sun heat Salt Lake City on June 15? ______ hrs. ______ min.
2) How long does Salt Lake City cool at night on June 15? ______ hrs. ______ min.
3) How long does the Sun heat Salt Lake City on December 15? ______ hrs. ______ min.
4) How long does Salt Lake City cool at night on December 15? ______ hrs. ______ min.
5) Based on the information above (including your bar-graph), what is the relationship between the hours of daylight at different times of year and the temperature?

KEY
SUNRISE-SUNSET AND TEMPERATURE DATA FOR SALT LAKE CITY, UTAH
Directions: Calculate the length of daylight for each day listed below.
DATE SUNRISE SUNSET Length of Daylight in hours and minutes
Ave High (°F)
Jan 15 7:50 AM 5:24 PM 9:34 38
Feb 15 7:22 AM 6:02 PM 10:40 43
Mar 15 7:40 AM 7:34 PM 11:54 53
Apr 15 6:49 AM 8:07 PM 13:18 63
May 15 6:11 AM 8:38 PM 14:27 72
Jun 15 5:56 AM 9:00 PM 15:04 82
Jul 15 6:09 AM 8:58 PM 14:49 94
Aug 15 6:38 AM 8:26 PM 13:48 91
Sep 15 7:08 AM 7:37 PM 12:29 80
Oct 15 7:38 AM 6:47 PM 11:09 65
Nov 15 7:14 AM 5:10 PM 9:56 49
Dec 15 7:44 AM 5:01 PM 9:17 39
Average high temperatures are 59-year averages from the National Weather Service Field office in Salt Lake City, Utah.
Using the Daylight-Temperature Comparison Worksheet, make a bar-graph of both the length of daylight and average high temperature. Use a different color for hours of daylight and average high temperature.
1) How long does the Sun heat Salt Lake City on June 15? __15__ hrs. ___4__ min.
2) How long does Salt Lake City cool at night on June 15? ___8__ hrs. __56__ min. (24:00 in a day – 15:04 of daylight)
3) How long does the Sun heat Salt Lake City on December 15? ___9__ hrs. __17__ min.
4) How long does Salt Lake City cool at night on December 15? __14__ hrs. __43__ min. (24:00 in a day – 9:17 of daylight)
5) Based on the information above (including your bar-graph), what is the relationship between the hours of daylight at different times of year and the temperature?
Increasing and decreasing temperatures generally follow increasing and decreasing hours of daylight, but the highest temperature occurs about a month after the greatest amount of daylight due to the slow warming of the land and water.


Name __________________
SUN HEIGHT / TEMPERATURE WORKSHEET
At various times of year, the following data was gathered for Salt Lake City, UT. The shadow refers to a flagpole in the school yard with a height of 9 meters. Use the table data to complete the tasks below.
DATE Time Sun
Is Highest (Assumes Standard Time
throughout the year)
Shadow Length 9 m Flagpole
Height of Sun In degrees
Ave High (°F)
Jan 21 12:39 PM 16 m 29 38 Feb 21 12:42 PM 11 m 39 43 Mar 21 12:35 PM 8 m 50 53 Apr 21 12:26 PM 5 m 61 63
May 21 12:24 PM 3 m 70 72
Jun 21 12:29 PM 2.75 m 73 82
Jul 21 12:34 PM 3 m 70 94 Aug 21 12:30 PM 5 m 61 91
Sep 21 12:20 PM ? m 50 80
Oct 21 12:12 PM 12 m 39 65
Nov 21 12:13 PM 16 m 29 49
Dec 21 12:26 PM 18 m 26 39
Average high temperatures are 59-year averages from the National Weather Service Field office in Salt Lake City, Utah.
Using the data above, make a bar graph of the sun height each month. Make a second graph of the shadow length each month. Use the graph and the data table above to answer the following questions. 1) At what time and date is the sun highest in the sky? _____________
2) At what time and date is the sun lowest in the sky?______________
3) What would be the most likely length of the shadow on Sept. 21? ___________ Why do you think
so? _____________________________________________________________________________
4) How does the sun height compare to the length of the shadow cast by the flagpole?
_____________________________________________________________________________
5) In general, what happens to the average temperature as the shadow of the flagpole lengthens? _____________________________________________________________________________
6) In general, how does the average temperature compare to the height of the sun in the summer?
_____________________________________________________________________________

Name __________________
KEY
SUN HEIGHT / TEMPERATURE WORKSHEET
At various times of year, the following data was gathered for Salt Lake City, UT. The shadow refers to a flagpole in the school yard with a height of 9 meters. Use the table data to complete the tasks below.
DATE Time Sun
Is Highest (Assumes Standard Time throughout the year)
Shadow Length 9 m Flagpole
Height of Sun In degrees
Ave High (°F)
Jan 21 12:39 PM 16 m 29 38
Feb 21 12:42 PM 11 m 39 43
Mar 21 12:35 PM 8 m 50 53
Apr 21 12:26 PM 5 m 61 63
May 21 12:24 PM 3 m 70 72
Jun 21 12:29 PM 2.75 m 73 82
Jul 21 12:34 PM 3 m 70 94
Aug 21 12:30 PM 5 m 61 91
Sep 21 12:20 PM 8 m 50 80
Oct 21 12:12 PM 12 m 39 65
Nov 21 12:13 PM 16 m 29 49
Dec 21 12:26 PM 18 m 26 39
Average high temperatures are 59-year averages from the National Weather Service Field office in Salt Lake City, Utah.
Using the data above, make a bar graph of both the sun height each month. Make a second graph of the shadow length each month. Use the graph and the data table above to answer the following questions.
1) At what time and date is the sun highest in the sky? __12:29 PM, June 21
2) At what time and date is the sun lowest in the sky? ___12:26 PM, December 21
3) What would be the length of the shadow on Sept. 21? ___8 m (just as in March)__Why? Because the Sun is at the same height on Mar 21, so it would have the same shadow length. Also, shadow length follows a repeatable pattern, it has the same length at each equinox.
4) How does the sun height compare to the length of the shadow cast by the flagpole? ______The
higher the sun, the shorter the shadow cast by the flagpole_

KEY cont.
5) In general, what happens to the average temperature as the shadow of the flagpole lengthens? ________The average temperature goes down. _____________________________
6) In general, how does the average temperature compare to the height of the sun in the summer?
_______It is warm when the sun is high in our sky. _____________________________
Sun height in degrees/Month
Sun Height in degrees
Months, Jan = 1…
Shadow Length
in meters
Months, Jan = 1…

Daylight-Temperature Comparison
Hours of Hou
rs
Tem
p.
Hou
rs
Tem
p.
Hou
rs
Tem
p.
Hou
rs
Tem
p.
Hou
rs
Tem
p.
Hou
rs
Tem
p.
Hou
rs
Tem
p.
Hou
rs
Tem
p.
Hou
rs
Tem
p.
Hou
rs
Tem
p.
Hou
rs
Tem
p.
Hou
rs
Tem
p.
Average HighDaylight Temperature
JAN FEB MAR APR MAY JUN JUL AUG SEP OCT NOV DEC0:00
9:00
10:00
11:00
12:00
13:00
14:00
15:00
16:00 100 °F
90 °F
80 °F
30 °F
0 °F
70 °F
60 °F
50 °F
40 °F
Daylight-Temperature Comparison - KEY
Hours of Hou
rs
Tem
p.
Hou
rs
Tem
p.
Hou
rs
Tem
p.
Hou
rs
Tem
p.
Hou
rs
Tem
p.
Hou
rs
Tem
p.
Hou
rs
Tem
p.
Hou
rs
Tem
p.
Hou
rs
Tem
p.
Hou
rs
Tem
p.
Hou
rs
Tem
p.
Hou
rs
Tem
p.
Average HighDaylight Temperature
JAN FEB MAR APR MAY JUN JUL AUG SEP OCT NOV DEC0 °F
70 °F
60 °F
50 °F
40 °F
Hou
rs
Tem
p.
Legend
30 °F
16:00 100 °F
90 °F
80 °F
12:00
13:00
14:00
15:00
0:00
9:00
10:00
11:00


TRPP Lesson Plan
Seasonal Constellations Activity
© Clark Planetarium 2008

© Clark Planetarium 2008 Page 2
Table of Contents Alignment to Utah Core Curriculum 3 Intended Learning Outcomes Core Standard Core Objectives Enduring Understanding Essential Questions
Background 4 Setup 5 & 6 Common Misconceptions 7 Activity 7 & 8 Length of Activity Materials Procedures Formative Assessment Strategies Learning Extensions

© Clark Planetarium 2008 Page 3
Alignment to Utah Core Curriculum Grade Level 6th Grade Intended Learning Outcomes (ILOs)
1. Use science process and thinking skills. 2. Manifest scientific attitudes and interests. 3. Understand science concepts and principals. 4. Communicate effectively using science language and reasoning. 5. Understand the nature of science.
Utah Science Core Curriculum Standard:
Standard 4: Students will understand the scale of size, distance between objects, movement, and apparent motion (due to Earth’s rotation) of objects in the universe and how cultures have understood, related to and used these objects in the night sky.
Utah Science Core Curriculum Objective:
1. Objective 2: Describe the appearance and apparent motion of groups of stars in the night sky relative to Earth and how various cultures have understood and used them.
a. Locate and identify stars that are grouped in patterns in the night sky. b. Identify ways people have historically grouped stars in the night sky. c. Recognize that stars in a constellation are not all the same distance from Earth. d. Relate the seasonal change in the appearance of the night sky to Earth’s position. e. Describe ways that familiar groups of stars may be used for navigation and calendars.
_____________________________________________________________________________ Enduring Understanding:
1. The stars seen at night change throughout the year because of the orbit of Earth around the Sun. Essential Questions:
1. Are the stars we see at night in the summer the same as those we see in the winter? 2. Do we see the same stars in our skies all night long? 3. Why do the stars seen at night change throughout the year?

© Clark Planetarium 2008 Page 4
Background: Introduction: This constellation activity will allow students to explore the changing constellations visible in the night sky over the course of the Earth’s 365 day orbit. Overview: This is a quick hands-on activity that allows the students to model the change in constellations seen at various points in Earth’s orbit. The use of this model will show how Earth’s night side changes direction with respect to the stars as we orbit the Sun. The students will observe how the nighttime star field changes at each of the four seasonal positions. It can be done individually or in groups. Teacher Background:
Constellations are groups of stars that form a pattern in the night sky. Constellations can depict people, animals, places or objects. There are 88 official constellations in the night sky. However, not all 88 are visible from Utah. While most constellations used today came from the Greeks, nearly every ancient civilization fashioned their own constellations. Many of your students may already be familiar with some constellations such as: Orion, Hercules, Taurus, Scorpius, Draco, Leo, and Ursa Major. This activity uses the Zodiac constellations, as these are the constellations that the Sun appears to pass “through” or in front of, during a year. This is because those constellations lie in approximately the same plane as Earth’s orbit (and that of the other planets as well). Because Earth’s axis points in same direction (toward the North Star) throughout its yearly orbit, constellations that surround the North Star can be seen all year long. As Earth rotates, constellations (other than those near the North Star) appear to rise and set, allowing us to see most of sky during the night. However, we cannot see stars in the direction of the Sun because the Sun’s light is too bright. As Earth orbits the Sun, the night side of Earth faces different areas of the sky. This allows us to see different groups of stars over time. Most constellations seen in the spring at a particular time of night are different from constellations seen at that same time in the fall (see diagram below). If we observe the night sky from just after sunset to just before sunrise, we discover that only a handful of constellations are completely hidden by sunlight. For example, if we observe all night, we will see ten or eleven of the Zodiac constellations. Because the stars and constellations that are visible are the same with each orbit, they can be used mark the time of year and herald yearly events. For example, ancient Egyptians knew that when the bright star Sirius first became visible in the morning twilight, it was time for the annual flooding of the Nile, and in Greece the morning rise of the Pleiades signaled the start of the wheat harvest. More detailed information: Each day, Earth moves about 1 degree in its orbit. As a result of this slight movement, particular stars will rise about 4 minutes earlier each night. This daily change in rise time results in about a 2 hour (4 minutes x 30 days = 120 minutes) earlier rise after a month. After 3 months (~90 days), Earth has moved about 90, so constellations will rise a full 6 hours earlier. For example, Taurus rises just after sunset in early December. At the beginning of March, it rises (unseen) about noon and is high in the sky as its stars become visible after sunset.

Setup: This is an extension to the “Seasons” activity. The basic setup is the same, except that the signs of the Zodiac are placed at just below chest level around the room. In this activity, the Sun is represented by the cluster of lamps placed in the center of the room. Four Earth globes should be placed around this structure, each one at approximately six feet from the “Sun” (see diagram below). Make sure to orient each axis in the same direction as in the setup for the main “Seasons” activity. They should all have their axes pointing toward the same side of the classroom and in the order shown in the diagram. The distance between the walls and the globes should be large enough that the students can move between the two freely, and yet still identify the constellations from the far side of the Earth circle. The pattern for the constellations is laid out in the diagram on page 6. Turn on the power for the lights (Sun) just before beginning the activity.
Position 2
© Clark Planetarium 2008 Page 5
Spring
Autumn
Sum
mer W
inte
r
Position 3 Position 1
Position 4

© Clark Planetarium 2008 Page 6
Visible Constellations Change with the Seasons
(Setup Sheet)
Directions: Place the constellations of the zodiac around the edge of the room between chest and head height in
the positions indicated.

© Clark Planetarium 2008 Page 7
Common Misconceptions: 1. Stars are all the same distance from Earth. (The stars are all different distances from Earth and usually
very far apart from each other physically.) 2. All of the stars we see are part of our solar system. (There is only one star in our solar system, the Sun;
all of the other stars are very far away. The closest star to our sun is Centauri Proxima, 4.2 light years or nearly 25 trillion miles away!)
3. Stars appear in the same place every night, all night. Stars slowly move through the sky as Earth turns. 4. We see the same constellations all year long.
Activity: Length of Activity: Setup: 15-20 minutes unless “Seasons” activity is still set up—then 5 minutes Activity: 20 minutes Materials Needed: Environment and Materials: A number of supplies are required and all of the hardware needs to be in place before the activity can begin. Other Materials:
Darkened multipurpose room or classroom with adequate room to move 4 groups of 4-8 students around 4 stations (area of about 16 ft. in diameter)
1 (or more) electrical outlet(s) on 20 amp breakers 5 desks or small tables (must be level, the same height, and large enough to hold all of the station
materials.) pencil/pen (one for each student) copies of student worksheets (one for each student) 1 roll masking tape 1 overhead copy of the Worksheet (for the overhead projector: classroom analysis and comparison) -
optional Materials Provided:
4 Earth globes Constellations cards 8 ½ x 11 (4) 500 watt lamps with stands 1 power strip (1) 12 gauge extension cord 1 ruler, measuring tape or 6 ft. string master copy of student worksheet

Procedure: Activity: With a worksheet in hand, students will to travel to each of the Earth globe stations and fill in the worksheet for that station. At each station, the students should begin by filling in the night side of the Earth. This will help them identify that the night side is facing in different directions throughout the year. Then, they should try to identify which two constellations would be high up in the sky at midnight (facing nearly directly away from the noon position) for their station. These constellations will be the two that are to either side of a line directly opposite that of the sun. What may also help is to have a student stand between their Earth globe and the constellations and hold their hands out straight to the sides, facing away from the sun. This way, they have a full night sky view, from horizon to horizon (their arms). The two constellations that are right in front of them (opposite the sun) will be the ones that are high in the sky at midnight. After they have visited each of the Earth stations and filled in their worksheet, the students should sit down in their groups and try to answer the questions on the back using the chart they filled in. Be sure to power off the lamps after the students have finished with their observations. Formative Assessment Strategies: Observation and questioning throughout the activity. Worksheet. (See attached master worksheet.) Websites http://www.utm.utoronto.ca/~astro/lesson7.htm Booklist James Evans, The History and Practice of Ancient Astronomy, Oxford University Press, New York, 1998
USOE
250 East 500 South | P.O. Box 144200 | Salt Lake City, UT 84114-4200
Phone: 801-538-7803 | Fax: 801-538-7769 | E-mail: [email protected]
© Clark Planetarium 2008 Page 8

Seasonal Constellations Part One
Name: _________________
© Clark Planetarium 2008 1
Directions: At each station:
Night Day 1) Decide which half of the globe is the day side and which is the night side. On the diagram below, color in the night side.
2) Look out at the ring of constellations in the model. Which two constellations would be visible high in the sky at midnight at your station? Write the names in the boxes on the diagram. Make sure you get them in the right positions. (*Look at your station #.)
2
3
4
1

Seasonal Constellations Part Two
© Clark Planetarium 2008 2
Directions: After completing the diagram using your observations from the model,
complete the following questions using as much detail as possible. Questions:
1) Can you see the constellation of Aquarius from the night side of station #2? Why or why not?
2) Can you see the constellation of Taurus from the night side of station #4? Why or
why not?
3) Can you see the constellation of Sagittarius from the night side of station #3? Why or why not?
4) With the unaided eye, can we see the constellation of Scorpius all year long?
Why or why not? Draw a picture if it helps your explanation. BONUS:
5) With the unaided eye, can we see the constellation of Ursa Minor all year long? Why or why not. Draw a picture if it helps your explanation.

Seasonal Constellations (Key) Part One
Name: _________________ Directions: At each station:
1) Decide which half of the globe is the day side and which is the night side. On the diagram below, color in the night side. Night Day
2) Look out at the ring of constellations in the model. Which two constellations would be visible high in the sky at midnight at your station? Write the names in the boxes on the diagram. Make sure you get them in the right positions. (*Look at your station #.)
© Clark Planetarium 2008

Seasonal Constellations (Key) Part Two
Directions: After completing the diagram using your observations from the model,
complete the following questions using as much detail as possible. Questions:
1) Can you see the constellation of Aquarius from the night side of station #2? Why or why not?
Yes, Aquarius can be seen from the night side of station #2 because it is high in the night sky. The Sun doesn’t get in the way. 2) Can you see the constellation of Taurus from the night side of station #4? Why or
why not?
No, Taurus cannot be seen from the night side of station #4 because it is positioned on the day side of Earth, just before sunset.
3) Can you see the constellation of Sagittarius from the night side of station #3?
Why or why not? No, Sagittarius cannot be seen from the night side of station #3 because it is high in the daytime sky. 4) With the unaided eye, can we see the constellation of Scorpius all year long?
Why or why not? Draw a picture if it helps your explanation.
No, we do not see the same zodiac constellations all year long because the Sun gets in the way. This is because as Earth orbits the Sun, the night side of Earth faces a different portion of our galaxy in different months so we see a different sets of stars. For about two months, Scorpius is in the direction of the Sun.
BONUS:
5) With the unaided eye, can we see the constellation of Ursa Minor all year long? Why or why not. Draw a picture if it helps your explanation. Yes, Ursa Minor (Little Dipper) is a polar constellation and is visible every night of the year when skies are clear. Like Ursa Major, its position changes throughout the night and throughout the year, but for people in the US, it is always above the horizon.
© Clark Planetarium 2008

TRPP Lesson Plan
Exploring Eclipses Activity
© Clark Planetarium 2008

© Clark Planetarium 2008 Page 2
Table of Contents Alignment to Utah Core Curriculum 3 Intended Learning Outcomes Core Standard Core Objectives Enduring Understanding Essential Questions
Background 3 Common Misconceptions
Activity 4 Length of Activity Materials Procedures Helpful Hints Formative Assessment Strategies
Learning Extensions 6

© Clark Planetarium 2008 Page 3
Alignment to Utah Core Curriculum Grade Level 6th Grade Intended Learning Outcomes (ILOs) Students will explore and learn by inquiry how and why eclipses occur. They will also be able to model and know the difference between solar and lunar eclipses. Enduring Understanding:
1. Students will explore and correctly model both lunar and solar eclipses. 2. Students will be able to translate new visual and kinesthetic information in order to correctly complete
worksheet. Essential Questions:
1. What is the position of the Earth, Moon and Sun during a solar eclipse? 2. What is the position of the Earth, Moon and Sun during a lunar eclipse? 3. Do eclipses occur often? Why or why not? 4. Why don’t we have two eclipses (1 solar and 1 lunar) leach month?
Background: Setup: For details, refer to setup for “The Reasons for the Seasons” activity in this binder. In general, place the 4 halogen lamps in the center of a 12 foot diameter circle shining out at 90 degree angles to each other. Globes should be positioned on the outer edge of the circle at the N, S, E, and W directions. Each lamp should face 1 globe. Teacher Background: Eclipses occur when an object in space casts a shadow upon another object. On Earth, two types of eclipses can occur, solar and lunar. A solar eclipse is when the Moon passes in front of the Sun and casts a shadow on a small portion of the Earth. A solar eclipse always occurs during the new Moon phase. The disk of the Moon is just the right size to cover the Sun. However, the Moon is not the same size as the Sun; it looks like the same size because the Moon is closer to us. The Sun is 400 times larger than the Moon, but the Moon is 400 times closer to us. In the small area of the Earth shadowed by the Moon during a total solar eclipse, day seems to turn to early night as even stars begin to become visible.

Solar Eclipse
A lunar eclipse occurs when the Moon passes through Earth’s shadow in space. The Moon is in its full moon phase during the eclipse. When passing through the Earth’s shadow, the Moon is usually at least slightly visible. This is because light from the Sun is refracted through our atmosphere. Most of the light is scattered (the reason we have a blue sky) but long red wavelengths of light make it through the atmosphere. During totality, the only light getting to the moon is light that has passed through Earth’s atmosphere. This causes the Moon to become a reddish color during a lunar eclipse.
Lunar Eclipse
Eclipses do not occur every month because the Moon’s orbit is tilted by about 5º compared to Earth’s. This causes the Moon to pass a little above or a little below the Earth’s shadow every month. Only on rare occasions do the Sun, Moon, and Earth line up just right for an eclipse to occur. Common Misconceptions:
1. It is dangerous to be outside during a lunar eclipse. There is no danger at all. Solar eclipses should only be viewed with appropriate safety gear or safe methods such as image projection.
Activity: Length of Activity: Setup: 15 minutes (unless it is done after the “Seasons” activity, then setup is already done) Activity: 15 minutes Materials Needed:
Darkened multipurpose room or classroom with adequate room to move 4 groups of 4-8 students around 4 stations (area of about 16 ft. in diameter)
1 (or more) electrical outlet(s) 5 desks or small tables (must be level, the same height, and large enough to hold all of the station
materials.) pencil/pen (one for each student) copies of student worksheets (one for each student) 1 overhead copy of the Worksheet (for the overhead projector: classroom analysis and comparison) -
optional
© Clark Planetarium 2008 Page 4
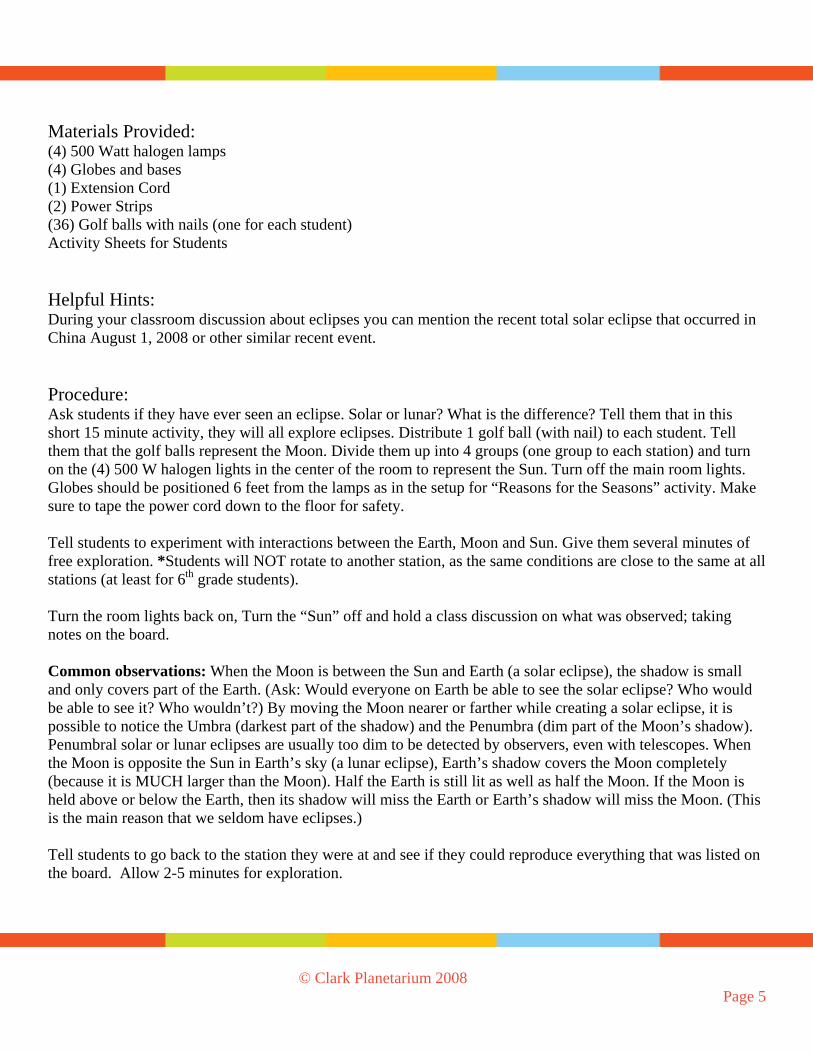
© Clark Planetarium 2008 Page 5
Materials Provided: (4) 500 Watt halogen lamps (4) Globes and bases (1) Extension Cord (2) Power Strips (36) Golf balls with nails (one for each student) Activity Sheets for Students Helpful Hints: During your classroom discussion about eclipses you can mention the recent total solar eclipse that occurred in China August 1, 2008 or other similar recent event. Procedure: Ask students if they have ever seen an eclipse. Solar or lunar? What is the difference? Tell them that in this short 15 minute activity, they will all explore eclipses. Distribute 1 golf ball (with nail) to each student. Tell them that the golf balls represent the Moon. Divide them up into 4 groups (one group to each station) and turn on the (4) 500 W halogen lights in the center of the room to represent the Sun. Turn off the main room lights. Globes should be positioned 6 feet from the lamps as in the setup for “Reasons for the Seasons” activity. Make sure to tape the power cord down to the floor for safety. Tell students to experiment with interactions between the Earth, Moon and Sun. Give them several minutes of free exploration. *Students will NOT rotate to another station, as the same conditions are close to the same at all stations (at least for 6th grade students). Turn the room lights back on, Turn the “Sun” off and hold a class discussion on what was observed; taking notes on the board. Common observations: When the Moon is between the Sun and Earth (a solar eclipse), the shadow is small and only covers part of the Earth. (Ask: Would everyone on Earth be able to see the solar eclipse? Who would be able to see it? Who wouldn’t?) By moving the Moon nearer or farther while creating a solar eclipse, it is possible to notice the Umbra (darkest part of the shadow) and the Penumbra (dim part of the Moon’s shadow). Penumbral solar or lunar eclipses are usually too dim to be detected by observers, even with telescopes. When the Moon is opposite the Sun in Earth’s sky (a lunar eclipse), Earth’s shadow covers the Moon completely (because it is MUCH larger than the Moon). Half the Earth is still lit as well as half the Moon. If the Moon is held above or below the Earth, then its shadow will miss the Earth or Earth’s shadow will miss the Moon. (This is the main reason that we seldom have eclipses.) Tell students to go back to the station they were at and see if they could reproduce everything that was listed on the board. Allow 2-5 minutes for exploration.

Formative Assessment Strategies: See attached master worksheet
Learning Extensions: Booklist: Agencies: Websites: www.nasaimages.org http://wserver.scc.losrios.edu/~sah/physics/44Miscon.htm
USOE
250 East 500 South | P.O. Box 144200 | Salt Lake City, UT 84114-4200
Phone: 801-538-7803 | Fax: 801-538-7769 | E-mail: [email protected]
© Clark Planetarium 2008 Page 6

Eclipse Activity Sheet
Name: _________________ 1) What are the two types of eclipses?
a. b.
2) Is the Moon the same size as the Sun? Justify your answer? 3) Can an eclipse occur at night? If so, what kind? 4) Draw the positions of the Sun, Moon, and Earth for both kinds of eclipses.
© Clark Planetarium 2008

5) On August 1, 2008 there was a total solar eclipse visible in Greenland, and Asia. Could all of the Asian continent see the total solar eclipse? Why or why not?
6) During a lunar eclipse, what is the phase of the Moon? 7) What phase is the Moon during a solar eclipse? 8) Why don’t eclipses occur every month? 9) Bonus: On August 21, 2017 a total solar eclipse will be visible in North America!
The umbra will pass through the United States including Idaho and Wyoming. How old will you be during this eclipse?
© Clark Planetarium 2008

Eclipse Activity Sheet (Key)
Name: ___________________ 1) What are the two types of eclipses?
a. Solar eclipse b. Lunar eclipse
2) Is the Moon the same size as the Sun? Justify your answer?
The Moon is not the same size as the Sun but they look like the same size, because the Moon is closer to us. The Sun is 400 times larger than the Moon, but the Moon is 400 times closer to us.
3) Can an eclipse occur at night? If so, what kind?
Yes, a lunar eclipse can only occur at night.
4) Draw the positions of the Sun, Moon, and Earth for both kinds of eclipses.
Solar Eclipse
*Drawings not to scale
Lunar Eclipse
*Note the very large shadow cast by the Earth.
© Clark Planetarium 2008

5) On August 1, 2008 there was a total solar eclipse visible in Greenland, and Asia. Could all of the Asian continent see the total solar eclipse? Why? No, the Moon’s shadow only covers a very small area of Earth. The shadow was not big enough to cover all of Asia.
6) During a lunar eclipse, what phase is the Moon?
Full moon
7) What phase is the Moon during a solar eclipse?
New moon
8) Why don’t eclipses occur every month?
The Moon’s orbit is tilted by about 5º as compared to Earth’s. This causes the Moon to pass a little above or a little below Earth’s shadow. Only on rare occasions do the Sun, Moon, and Earth line up just right for an eclipse to occur.
9) Trivia! On August 21, 2017 a total solar eclipse will be visible in North America!
The umbra will pass through the United States including Idaho and Wyoming.
Answers will vary
© Clark Planetarium 2008
TRPP Lesson Plan
Phases of the Moon Activity
© Clark Planetarium 2008

© Clark Planetarium 2008 Page 2
Table of Contents Alignment to Utah Core Curriculum 3 Intended Learning Outcomes Core Standard Core Objectives Enduring Understanding Essential Questions
Background 4 Common Misconceptions
Activity 7 Length of Activity Materials Procedures Helpful Hints Formative Assessment Strategies
Learning Extensions 10
© Clark Planetarium 2008 Page 3
Alignment to Utah Core Curriculum Grade Level 6th Grade Intended Learning Outcomes (ILOs)
1. Use science process and thinking skills. 2. Manifest scientific attitudes and interests. 3. Understand science concepts and principals. 4. Communicate effectively using science language and reasoning. 5. Understand the nature of science.
Utah Science Core Curriculum Standard:
Standard 1: Students will understand that the appearance of the Moon changes in a predictable cycle as it orbits Earth and as Earth rotates on its axis.
Utah Science Core Curriculum Objective:
1. Objective 1: Explain patterns of changes in the appearance of the moon as it orbits Earth. a. Describe changes in the appearance of the moon during a month. b. Identify the pattern of change in the moon’s appearance. c. Use observable evidence to explain the movement of the moon around Earth in relationship to
Earth turning on its axis and the position of the moon changing in the sky. d. Design an investigation, construct a chart, and collect data depicting the phases of the moon.
2. Objective 2: Demonstrate how the relative positions of Earth, the moon, and the sun create the appearance of the moon’s phases.
a. Identify the difference between the motion of an object rotating on its axis and an object revolving in orbit.
b. Compare how objects in the sky (the moon, planets, stars) change in relative position over the course of the day or night
c. Model the movement and relative positions of Earth, the moon, and the sun.
Enduring Understanding:
1. The Moon shines because it reflects light from the sun. 2. Understand why and how the moon changes its appearance.

© Clark Planetarium 2008 Page 4
Essential Questions: 1. Why does the Moon shine? 2. Why does the Moon have phases? 3. Is the moon always visible at night?
Background: Introduction: This activity covers the setup and preparation for the Lunar Phases Activity. Overview: This is a hands-on activity that will allow students to visually and kinetically explore the phases of the Moon, the arrangement of the Earth, Sun, and Moon at each of the phases, and experience the difference between lunar and solar eclipses. Student’s misconceptions about the phases of the Moon will be targeted and addressed in an inquiry setting. *Make sure to review what the moon looks like as it goes through a lunar cycle prior to doing this activity. Once the students know what it looks like from Earth, it will be easier for them to understand the Earth/Moon system in 3D, which will show them that Earth’s shadow is NOT the cause of moon phases. Setting up the “Phases of the Moon” This activity should be done in a room made as dark as possible. It is essential to have a dark environment or the phases on the golf balls will be difficult to observe. Any windows or outside light sources can be covered with black paper, plastic; the darker the better. Clamp the UV light to something stable such as a wall at the front of the room and point the light toward the students. It is best to have the lamp at eye level or a little above to reduce problems with shadows. Distribute the golf balls (on a nail), giving one to each student. Golf balls will fluoresce (glow) with exposure to ultra violet (UV) light. The UV light will cause some of the student’s clothing to fluoresce too! Later, the assessment worksheets and additional activities may be handed out. If the UV light is the Sun, the student’s head is the Earth, and the golf ball is the Moon. Students can move the golf ball around their head and see different phases on the golf ball. Student’s can then make observations and learn to correctly model the pattern of the phases. Student’s can also make a solar and lunar eclipse happen in this setting and learn the difference between the two. Safety: The following precautions should be followed.
1. The black light lamps put out 27 watts of energy. It is hard to see with a black light so watch your step. Avoid touching the lamp as parts may get very hot.
2. Do not look directly into the black light for a long period of time. 3. Handle golf ball and nails with care. Don’t allow horsing around by the students. 4. If needed, tape down the power cord and make sure any other obstructions are out of the way so
students don’t trip over or run into them.

Teacher Background: The phases of the Moon are caused by the Sun’s light reflecting off the Moon’s surface in combination with the Moon’s orbit around Earth. The Sun always illuminates half of the Moon. As the Moon travels around Earth our perspective changes and so does the amount of the lighted half of the Moon that is visible to us. The Moon orbits around Earth from West to East. This may confuse some students because, as seen from Earth, the Moon appears to rise in the East, move westward across the sky, then set in the West. However, this apparent motion of the Moon results from Earth’s rotation (spinning), not the revolution (orbit) of the Moon. The Moon orbits Earth from West to East slowly. It takes 29.5 days or about one month (from the origin of the word, “moonth”) to orbit Earth and return to the same phase. This slow trek eastward can be noticed by observing that the Moon rises on average about 45 minutes later each day. When the Moon is at its new phase, the side opposite us is lit by the Sun and it is impossible to see the unlit side of the Moon. Two days after new moon, the Moon has moved enough for a small portion of the lit side to be seen, a crescent. As the Moon continues to orbit Earth more of its sunlit surface can be seen and the Moon is said to be waxing (growing). In about seven days the Moon goes from new to waxing crescent to its first quarter phase, where we see a quarter of the Moon’s surface (1/2 the illuminated surface) illuminated by the Sun. As the Moon continues to travel around Earth, it proceeds from a waxing gibbous to a full moon. At the full moon phase, the Moon’s surface that we see is fully illuminated and the bright moonlight can even cast shadows on earthly objects. After the full moon, less and less of the Moon’s lighted surface is seen and the Moon is said to be waning. Over the next 14-15 days the Moon will slowly change to a waning gibbous followed by third quarter, waning crescent, then finally back to a new moon.
Sunlight
WANING GIBBOUS
WANING CRESCENT
Outer circle depicts lunar phases as viewed from Earth
© Clark Planetarium 2008 Page 5

One way to help students identify waxing phases from waning phases is to use their hands. If they can line up the lit side of the Moon with a backward “C” made with their RIGHT hand (below right), it is a WAXING Moon. If they can line up the lit side of the Moon with a “C” made with their LEFT hand, it is a WANING Moon (below left).
As the Moon revolves around Earth, the angle between the Sun and the Moon, as seen from Earth, changes. At the new moon phase, the Moon and the Sun lie in the same direction. At full moon, the Sun is seen opposite to the Moon in the sky. For this reason, the full moon rises at sunset (see below). This can be understood by visualizing the linear arrangement of the Sun, Earth, and the Moon. Common Misconceptions:
Left Hand - Waning Right Hand - Waxing
East West
Full Moon
Looking to the south
Be aware that there are many misconceptions that students and adults have about the Moon and its phases. Some of these are are:
1. The Moon shines because it is generating its own light. 2. The Moon has phases because clouds cover its surface. 3. The Moon has phases because Earth’s shadow is being cast on it. 4. The Moon is visible every night and not visible during the day. 5. The Sun and Moon are the same size.
© Clark Planetarium 2008 Page 6

© Clark Planetarium 2008 Page 7
Activity: Length of Activity: Setup: 5 minutes Activity: 15-20 minutes Can be repeated quickly for reinforcement Materials Needed: Environment and Materials
Darkened multipurpose room or classroom 36 Golf balls with nails 1 UV lamp with clamp Electrical outlet Pencil/pens (enough for all students or groups)
Materials Provided:
36 Golf balls with nails 1 UV lamp with clamp Master worksheet
Helpful Hints:
Placing the lamp a little above head level and placing taller students in the back will help diminish shadows cast on other students.
Have students be an extended arm’s width from the nearest student so they don’t hit each other. Always keep at least six feet of clear space in front of the lamp so large shadows are not cast.
Procedure: Activity Rules:
This lesson will require a lot of turning and arm motion. Please do not stand too close to the Sun (black light) to avoid knocking it over or causing shadows.
The room will get very dark but the black light will be on. Please sit still and wait for your eyes to adjust and for further instructions.
Make sure there is enough room between you and the next person.

© Clark Planetarium 2008 Page 8
Introduction for Students: Scientists often use models and observation to help them understand things better. This is what we will be doing today.
What does the black light represent? (Sun) What do our golf balls represent? (The Moon)
Say, “Our heads will represent the Earth and our hometown will be our nose.”
If the Moon really was the size of the golf ball, how big would Earth be? Make a circle with your hands/fingers to show me.(6 inch diameter ball)
Are the Sun and the Moon the same size? (No, the Sun is 400 times bigger than the Moon but it is also
400 times farther away from the earth making it look the same size.)
Is our model to the correct distance scale? (No. But it would be difficult to use at the correct scale.) How many moons does Earth have? (One)
Why does the Moon shine? (Reflected sunlight)
o (Listen for student’s theories. Write a list of them on the board)
Why does the Moon change shape? (We are seeing different amounts of the lit up side)
o (Again list and listen; leave this list on the board for comparison later. Many will say that phases are the shadow of Earth falling on the Moon.)
Does the Moon rise and set at the same times everyday? (No)
Can you see the Moon every night? (No)
Can the Moon be seen in the daytime? (Yes, about as often as at night)
Do all people on Earth see the same phase of the Moon on the same day? (Yes)

© Clark Planetarium 2008 Page 9
The Activity: Moon Phases and Eclipses
1) Have students stand in a semi-circle around the black light. Explain that their head is Earth and their nose is their home town. The black light represents the Sun.
2) Tell them to take 1 to 2 minutes to explore moon phases while being careful not to get in the way of other classmates. Turn on the black light and then turn off the overhead lights. Note that the black light will make the golf balls and some of the student’s teeth and clothing fluoresce. Students may take a moment to have theirs eyes adjust and get their wiggles out. Allow them 1-2 minutes for free exploration (most of which will be spent looking at their clothes). Teachers will assess through direct observation throughout the activity.
3) If students didn’t use their time for free exploration of moon phases, redirect them by asking them to move the moon around “Earth.” Ask them to watch for anything interesting that happens.
4) After most have experimented with many different Moon positions, ask everyone to demonstrate a full moon. For those students with shadows from their heads covering the moon, encourage them to hold their moons higher. Explain that the reason we don’t have lunar eclipses every month at full moon is that the moon’s orbit is almost always a little above or below Earth’s shadow.
5) Ask students to demonstrate the position for new moon. Ask if they can see the new moon reflecting any light. Can they make a solar eclipse by moving the moon in front of the Sun?
6) Now, ask which way they have to move the Moon so that it revolves (orbits) correctly, based on their previous observations of the Moon (e.g. a waxing moon is lit on the right side). Encourage them to confer with their neighbors. Try to elicit the correct responses without giving away the answer (counterclockwise as viewed from the North Pole).
7) Next, have students demonstrate both first and last quarter phases, then waxing and waning crescents. 8) Putting it all together, have students start with new moon and demonstrate the whole lunar cycle ~29.5
days. 9) If time permits, have students explore the craters on the moon by looking to see if all craters are
illuminated the same way or if there are shadows in some of the craters. Are the craters easier to see at certain phases than others?
Take questions and try to get members within the group of students to answer. Provide guidance as necessary. Review: We recommend use of the Moon Phases activity mentioned above in addition to the Phase Card activity. To do the Phase Card activity, have students (individually or in groups) cut and label the pictures of the moon phases (groups should be no larger than three students).
Game time! Have the students turn over their moon phase cards so they can’t see the pictures. On the count of three have them flip them over and quickly put them in the right order starting with the New Moon. This should take no longer than a minute. Discuss the right order as a group.
Discuss why the moon has phases and make a new list to compare to their initial list. Are there any changes? Why? Summarize the phases and eclipses again.

Additional activity ideas These are optional activities the students can do in their spare time or as a class activity.
1. Use the golf balls and the moon outside during the day (make sure the moon is up) to show that the
phases occur during the day and that Moon rises at different times each day. Safety: Remind students to never look at the sun!!
2. Have students hold their golf ball up high above their heads in the direction of the moon. The ball should have a shadow similar to that of the Moon in the sky. This activity also helps students to understand lunar phases are not caused by the Earth’s shadow.
Formative Assessment Strategies: Besides observing all students throughout the activity, the worksheet provided will provide one of the necessary bridges that will force students to translate this kinesthetic modeling experience into a formal written context. Copy enough Moon Phases worksheets for each student or group.
Learning Extensions: Booklist Agencies Websites
USOE
250 East 500 South | P.O. Box 144200 | Salt Lake City, UT 84114-4200
Phone: 801-538-7803 | Fax: 801-538-7769 | E-mail: [email protected]
© Clark Planetarium 2008 Page 10
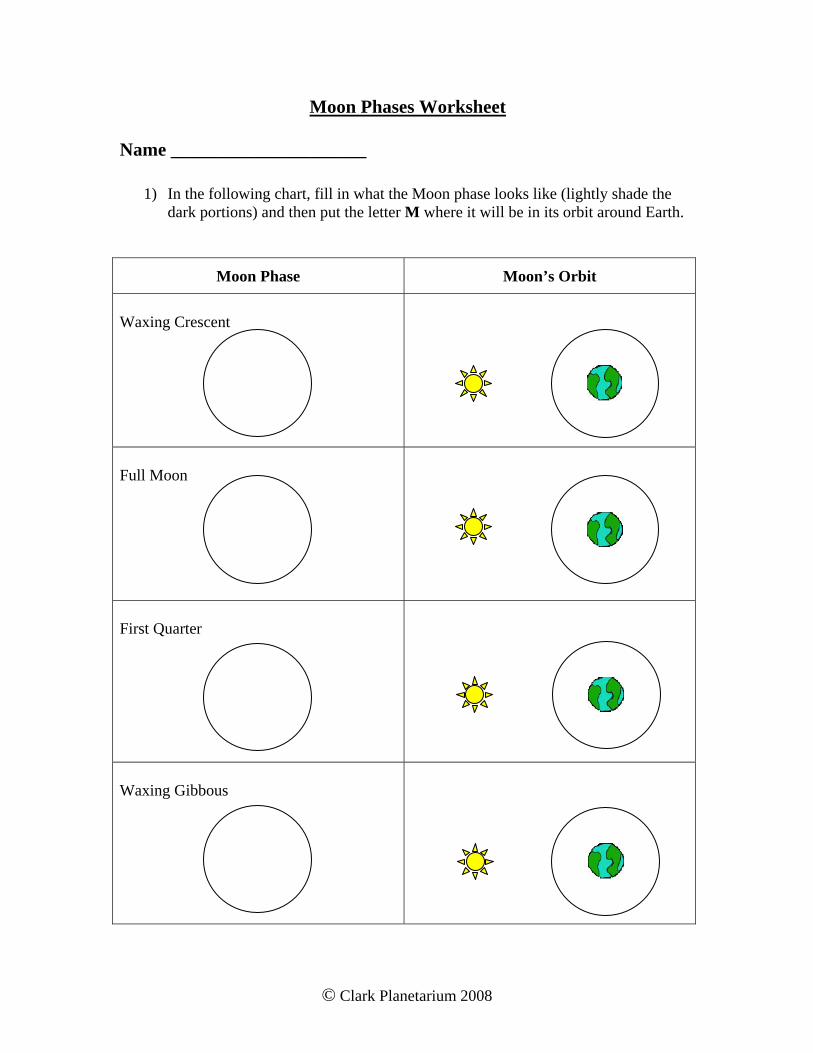
Moon Phases Worksheet
Name _____________________
1) In the following chart, fill in what the Moon phase looks like (lightly shade the dark portions) and then put the letter M where it will be in its orbit around Earth.
Moon Phase Moon’s Orbit
Waxing Crescent
Full Moon
First Quarter
Waxing Gibbous
© Clark Planetarium 2008

Moon Phase
Moon’s Orbit
Waning Gibbous
New Moon
Waning Crescent
Third Quarter
© Clark Planetarium 2008

2) What is the difference between a lunar eclipse and a solar eclipse? Draw a picture
if it helps your answer. 3) About how many days does it take the Moon to go through all its phases and
arrive back in the same place in our sky? How many times does the Moon orbit in a year?
4) Explain why the Moon seems to change shape. Draw a picture if helps in
describing it. 5) Do all people on Earth see the same phase of the Moon within 24 hours? Why or
why not?
© Clark Planetarium 2008

© Clark Planetarium 2008

Moon Phases Worksheet (Key)
Name _____________________
1) In the following chart, fill in what the Moon phase looks like and then put the letter M where it will be in its orbit around Earth.
Moon Phase Moon’s Orbit
Waxing Crescent
Full Moon
First Quarter
Waning Gibbous
M
M
M
M
© Clark Planetarium 2008

Moon Phase Moon’s Orbit
Waxing Gibbous
New Moon
Waning Crescent
Third Quarter
M
M
M
M
© Clark Planetarium 2008

2) What is the difference between a lunar eclipse and a solar eclipse? Draw a picture if it helps your answer.
In a Lunar eclipse, the full moon is covered by the Earth’s large shadow. In a Solar eclipse the new moon blocks the Sun from view by casting a shadow on a small portion of Earth. Lunar eclipses are visible by a large portion of the world while solar eclipses only occur over very small areas of Earth.
3) About how many days does it take the Moon to go through all its phases and
arrive back in the same place? About how many times does the Moon orbit in a year?
It takes about 29.5 days to go through all its phases. Since this is about 30 days (1 month), we get about 12 lunar orbits in a year.
4) Explain why the Moon seems to change shape change. Draw a picture if helps in
describing it.
The Sun always lights ½ of the surface of the Moon. As the Moon orbits the Earth, we see different parts of the lit and shadowed side of the moon. It is NOT the shadow of the Earth covering parts of the Moon. It is best to call special attention to this as it is a BIG misconception. Not addressing it may reinforce it.
5) Do all people on Earth see the same phase of the Moon within 24 hours? Why or
why not?
Yes. Because Earth rotates daily, this motion brings the Moon into view for people all over the Earth.
© Clark Planetarium 2008

© Clark Planetarium 2008

Phase Cards
Directions: Label each phase and cut out. Put the phases in the correct order starting with the new moon phase.

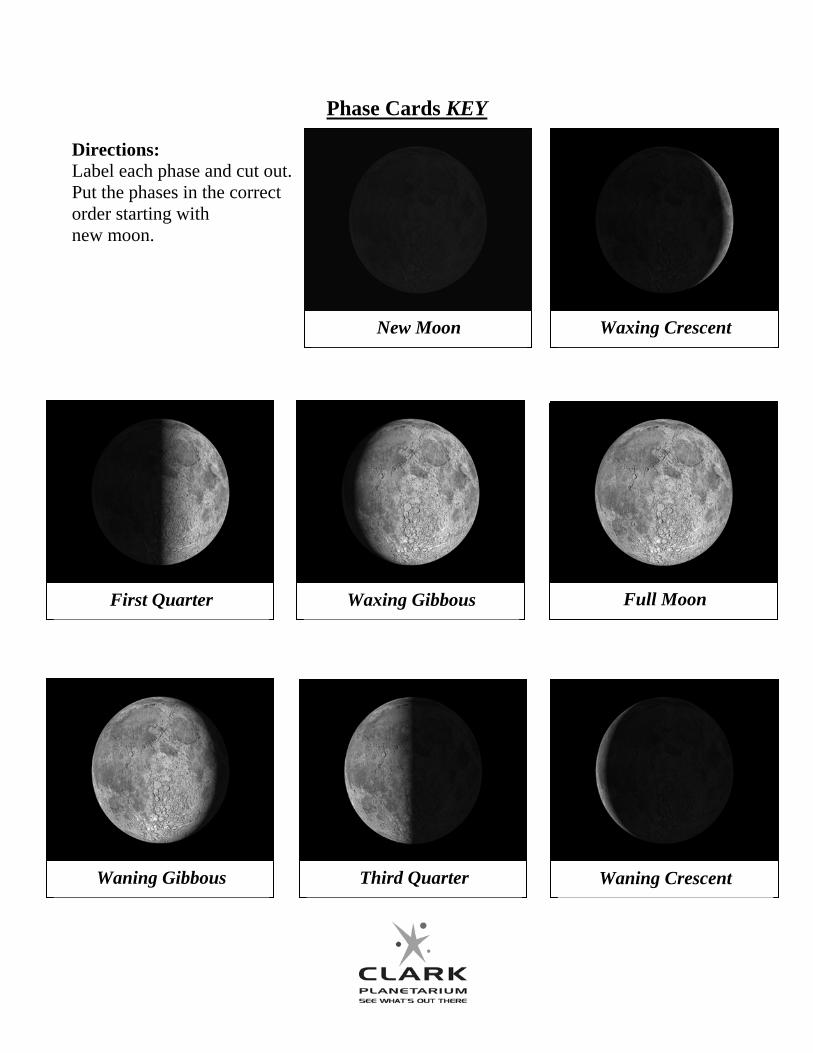
Phase Cards KEY
New Moon Waxing Crescent
Directions: Label each phase and cut out. Put the phases in the correct order starting with new moon.
First Quarter Waxing Gibbous Full Moon
Waning Gibbous Waning Crescent Third Quarter