Lisgar - Mississauga · February 2004 City of Mississauga, Planning and Building Department Page 3...
12
History When the City of Mississauga was incorpo- rated in 1974, its westerly boundary was extended to Ninth Line to include the area now known as Lisgar. The land use plan for Lisgar, consisting of various types of residential development, was approved in 1984. The first major development was a unique modular concept, in the area around Trelawny Circle and Tenth Line W. Each module consists of six detached dwellings, on oblique angled lots, fronting on a cul-de-sac off a typical road. Other more conventional residential development has occurred throughout the rest of the community. Lisgar is still experiencing development but will soon be fully developed. Lisgar is named after the pioneer settlement that began around 1819 in the vicinity of the intersection of Derry Rd W and Winston Community Profile CITY OF MISSISSAUGA Planning and Building Department None of the original buildings survive. The only other surviving reminder of the pioneer community is another cemetery. Kindree Cemetery, located on the south side of Derry Road W between Ninth and Tenth Lines, is the burial ground for the seven children of Nathan and Mary Kindree that died between 1829 and 1839. Five of the Kindree's twelve children survived and raised their own families in the area. Churchill Blvd. The settlement was originally dubbed "Switzer's Corners" because five Switzer families lived in the area and a number of the original community buildings were built on former Switzer family farmland. The community was officially named "Lisgar" in 1871 in honour of Sir John Young Lisgar, the Governor General of Canada. By this time Lisgar had a log school house, a church, a cemetery, an inn and a small store with a post office. Also nearby was a blacksmith shop and a train station was added around 1880. In 1868 the church congregation had moved to a new brick church opposite the cemetery and was named “Eden”. The original church cemetery still exists at the southeast corner of Derry Rd W and Shelter Bay Rd. The log school built in 1823 was replaced in 1887 and served the community for 73 years. Mississauga, Leading Today for Tomorrow February, 2004 Lisgar Lisgar Mississauga Lisgar as a % of Mississauga Male 12,145 301,495 4.0% Female 12,350 309,235 4.0% Total 24,500 610,730 4.0% Numbers may not add due to rounding. Table 1 - 2001 Total Population
-
Upload
truongduong -
Category
Documents
-
view
217 -
download
1
Transcript of Lisgar - Mississauga · February 2004 City of Mississauga, Planning and Building Department Page 3...

History When the City of Mississauga was incorpo-rated in 1974, its westerly boundary was extended to Ninth Line to include the area now known as Lisgar. The land use plan for Lisgar, consisting of various types of residential development, was approved in 1984. The first major development was a unique modular concept, in the area around Trelawny Circle and Tenth Line W. Each module consists of six detached dwellings, on oblique angled lots, fronting on a cul-de-sac off a typical road. Other more conventional residential development has occurred throughout the rest of the community. Lisgar is still experiencing development but will soon be fully developed.
Lisgar is named after the pioneer settlement that began around 1819 in the vicinity of the intersection of Derry Rd W and Winston
Community Profile
CITY OF MISSISSAUGA Planning and Building Department
None of the original buildings survive. The only other surviving reminder of the pioneer community is another cemetery. Kindree Cemetery, located on the south side of Derry Road W between Ninth and Tenth Lines, is the burial ground for the seven children of Nathan and Mary Kindree that died between 1829 and 1839. Five of the Kindree's twelve children survived and raised their own families in the area.
Churchill Blvd. The settlement was originally dubbed "Switzer's Corners" because five Switzer families lived in the area and a number of the original community buildings were built on former Switzer family farmland. The community was officially named "Lisgar" in 1871 in honour of Sir John Young Lisgar, the Governor General of Canada. By this time Lisgar had a log school house, a church, a cemetery, an inn and a small store with a post office. Also nearby was a blacksmith shop and a train station was added around 1880. In 1868 the church congregation had moved to a new brick church opposite the cemetery and was named “Eden”. The original church cemetery still exists at the southeast corner of Derry Rd W and Shelter Bay Rd. The log school built in 1823 was replaced in 1887 and served the community for 73 years.
Mississauga, Leading Today for Tomorrow
February, 2004
Lisgar
Lisgar MississaugaLisgar as a
% of Mississauga
Male 12,145 301,495 4.0%
Female 12,350 309,235 4.0%
Total 24,500 610,730 4.0%Numbers may not add due to rounding.
Table 1 - 2001 Total Population

Figure 1. Population Pyramid
-8 -6 -4 -2 0 2 4 6 8
0-4
5-9
10-14
15-19
20-24
25-29
30-34
35-39
40-44
45-49
50-54
55-59
60-64
65-74
75+
Age
Gro
up
Percent Male Female
Lisgar
Mississauga
Age Group Male % Female % Total % Male % Female % Total %
0-4 1,250 5.1% 1,290 5.3% 2,540 10.4% 20,460 3.4% 19,690 3.2% 40,150 6.6% 6.3% 5-9 1,275 5.2% 1,285 5.2% 2,560 10.4% 23,680 3.9% 22,300 3.7% 45,980 7.5% 5.6% 10-14 1,120 4.6% 975 4.0% 2,095 8.5% 23,285 3.8% 21,610 3.5% 44,895 7.4% 4.7% 15-19 820 3.4% 800 3.3% 1,620 6.7% 22,630 3.7% 21,265 3.5% 43,895 7.2% 3.7% 20-24 620 2.5% 520 2.1% 1,140 4.6% 21,185 3.5% 20,050 3.3% 41,235 6.8% 2.8% 25-29 715 2.9% 695 2.8% 1,410 5.8% 19,740 3.2% 21,675 3.6% 41,415 6.8% 3.4% 30-34 1,195 4.9% 1,510 6.2% 2,705 11.0% 23,350 3.8% 25,095 4.1% 48,445 7.9% 5.6% 35-39 1,515 6.2% 1,645 6.7% 3,160 12.9% 28,080 4.6% 29,310 4.8% 57,390 9.4% 5.5% 40-44 1,370 5.6% 1,300 5.3% 2,670 10.9% 26,865 4.4% 28,460 4.7% 55,325 9.1% 4.8% 45-49 840 3.4% 795 3.2% 1,635 6.7% 23,270 3.8% 24,625 4.0% 47,895 7.8% 3.4% 50-54 645 2.6% 520 2.1% 1,165 4.8% 20,830 3.4% 20,990 3.4% 41,820 6.8% 2.8% 55-59 315 1.3% 335 1.4% 650 2.6% 14,675 2.4% 14,855 2.4% 29,530 4.8% 2.2% 60-64 200 0.8% 220 0.9% 420 1.7% 10,935 1.8% 11,430 1.9% 22,365 3.7% 1.9% 65-74 215 0.9% 290 1.2% 505 2.1% 15,130 2.5% 16,770 2.7% 31,900 5.2% 1.6% 75+ 55 0.2% 170 0.7% 225 0.9% 7,380 1.2% 11,100 1.8% 18,480 3.0% 1.2%Total 12,145 49.6% 12,350 50.4% 24,500 100.0% 301,495 49.4% 309,235 50.6% 610,730 100.0% 4.0%Numbers may not add due to rounding.
Table 2 - Age Groups
Lisgar Mississauga Lisgar as a % of
Mississauga
Page 2 City of Mississauga, Planning and Building Department February 2004

February 2004 City of Mississauga, Planning and Building Department Page 3
Rank Ethnic Origin Lisgar % Mississauga % Lisgar as a % of Mississauga
1 Canadian 2,275 9.3% 43,835 7.2% 5.2%2 East Indian 2,260 9.2% 56,785 9.3% 4.0%3 Italian 1,365 5.6% 30,505 5.0% 4.5%4 Polish 1,045 4.3% 28,915 4.7% 3.6%5 English 990 4.0% 24,780 4.1% 4.0%6 Portuguese 970 4.0% 24,105 4.0% 4.0%7 Chinese 865 3.5% 32,455 5.3% 2.7%8 Jamaican 735 3.0% 14,880 2.4% 4.9%9 Filipino 610 2.5% 21,415 3.5% 2.8%10 Irish 285 1.2% 8,520 1.4% 3.3%11 Scottish 225 0.9% 9,550 1.6% 2.4%12 German 225 0.9% 6,025 1.0% 3.7%13 Egyptian 220 0.9% 3,545 0.6% 6.2%14 Black 200 0.8% 2,440 0.4% 8.2%15 Greek 190 0.8% 4,240 0.7% 4.5%16 Guyanese 165 0.7% 2,585 0.4% 6.4%17 Maltese 165 0.7% 2,435 0.4% 6.8%18 West Indian 150 0.6% 3,240 0.5% 4.6%19 Croatian 135 0.5% 6,745 1.1% 2.0%20 French 135 0.5% 3,330 0.5% 4.1%
Other Single Responses 3,015 12.3% 106,530 17.4% 2.8%Multiple Responses 8,275 33.8% 173,870 28.5% 4.8%Total Responses 24,500 100.0% 610,730 100.0% 4.0%
Table 3 - Population by Ethnic Origin (Single Responses)Ethnic origin refers to the ethnic or cultural origins of a person's ancestors. An ancestor is someone from whom a person is descended and is usually more distant than a grandparent. It is not the same as place of birth, citizenship or nationality. People who responded to more than one category were counted as multiple responses.
Rank Language Lisgar % Mississauga % Lisgar as a % of Mississauga
1 English 20,695 84.5% 452,470 74.1% 4.6%2 Polish 900 3.7% 22,610 3.7% 4.0%3 Punjabi 380 1.6% 21,365 3.5% 1.8%4 Arabic 335 1.4% 9,470 1.6% 3.5%5 Spanish 310 1.3% 8,160 1.3% 3.8%6 Tagalog (Filipino) 305 1.2% 10,325 1.7% 3.0%7 Gujarati 255 1.0% 3,575 0.6% 7.1%8 Cantonese 240 1.0% 10,580 1.7% 2.3%9 Portuguese 230 0.9% 9,180 1.5% 2.5%10 French 225 0.9% 4,485 0.7% 5.0%
Numbers may not add due to rounding.
Table 4 - Total Population by Home Language (Top 10 Single Responses)Home language is the language spoken most frequently. Some people may have indicated more than one language if multiple languages were spoken equally often.

Rank Place of Birth Lisgar % Mississauga % Lisgar as a % of Mississauga
1 Poland 935 10.1% 24,565 8.6% 3.8%2 India 920 10.0% 33,420 11.7% 2.8%3 Jamaica 570 6.2% 12,200 4.3% 4.7%4 Philippines 550 5.9% 18,625 6.5% 3.0%5 United Kingdom 520 5.6% 18,115 6.3% 2.9%6 Portugal 440 4.8% 13,625 4.8% 3.2%7 Pakistan 385 4.2% 13,580 4.7% 2.8%8 Guyana 385 4.2% 7,590 2.7% 5.1%9 Trinidad and Tobago 370 4.0% 7,120 2.5% 5.2%10 Italy 270 2.9% 12,375 4.3% 2.2%
All other places of birth 3,890 42.1% 124,485 43.6% 3.1%Total 9,235 100.0% 285,640 100.0% 3.2%
Table 5 - Place of Birth for Immigrants
Rank Place of Birth Lisgar % Mississauga % Lisgar as a % of Mississauga
1 Pakistan 240 16.6% 8,605 14.3% 2.8%2 India 235 16.2% 12,370 20.6% 1.9%3 Hong Kong 50 3.4% 1,445 2.4% 3.5%4 Egypt 50 3.4% 1,160 1.9% 4.3%5 Poland 45 3.1% 1,800 3.0% 2.5%6 United States 45 3.1% 1,080 1.8% 4.2%7 Romania 45 3.1% 855 1.4% 5.3%8 United Kingdom 45 3.1% 610 1.0% 7.4%9 Colombia 45 3.1% 470 0.8% 9.6%10 Jamaica 40 2.8% 1,195 2.0% 3.3%
All other places 610 42.1% 30,555 50.8% 2.0%Total 1,450 100.0% 60,125 100.0% 2.4%
Numbers may not add due to rounding.
Table 6 - Place of Birth for Immigrants Arriving Between 1996 and 2001
Page 4 City of Mississauga, Planning and Building Department February 2004

February 2004 City of Mississauga, Planning and Building Department Page 5
Period of Immigration Lisgar % Mississauga % Lisgar as a % of Mississauga
Before 1961 340 3.7% 21,695 7.6% 1.6%1961-1970 1,200 13.0% 33,680 11.8% 3.6%1971-1980 1,845 20.0% 50,650 17.7% 3.6%1981-1990 2,720 29.5% 65,470 22.9% 4.2%1991-1995 1,670 18.1% 54,020 18.9% 3.1%1996-2001 1,455 15.7% 60,125 21.1% 2.4%Total 9,230 100.0% 285,640 100.0% 3.2%
0-4 years 1,205 13.0% 24,550 8.6% 4.9%5-19 years 2,630 28.5% 80,655 28.2% 3.3%20 years and over 5,400 58.5% 180,435 63.2% 3.0%Total 9,230 100.0% 285,640 100.0% 3.2%
1st generation 8,645 50.0% 270,270 56.3% 3.2%2nd generation 4,115 23.8% 100,635 21.0% 4.1%3rd generation and over 4,535 26.2% 108,790 22.7% 4.2%Total 17,295 100.0% 479,700 100.0% 3.6%
Generation status refers to when a respondent or the respondent's ancestors become residents of Canada. The 1st generation refers to individuals born outside of Canada and are the first generation to live in Canada. The 2nd generation refers to individuals whose parents were born outside of Canada and the 3rd generation and over refers to individuals with grandparents or previous ancestors born outside of Canada.
Table 7 - Total Population by Immigration Characteristics
Table 7a - Total Immigrant Population by Period of Immigration
Table 7b - Total Immigrant Population by Age at Immigration
Table 7c - Total Population 15 Years of Age and Over by Generation Status
Rank Religion Lisgar % Mississauga % Lisgar as a % of Mississauga
1 Roman Catholic 11,875 48.5% 252,195 41.3% 4.7%2 No Religion 2,490 10.2% 71,895 11.8% 3.5%3 Anglican 1,615 6.6% 37,250 6.1% 4.3%4 United Church 1,510 6.2% 37,940 6.2% 4.0%5 Hindu 1,090 4.4% 29,165 4.8% 3.7%6 Muslim 980 4.0% 41,840 6.9% 2.3%7 Christian, n.i.e.1 560 2.3% 17,990 2.9% 3.1%8 Baptist 550 2.2% 11,350 1.9% 4.8%9 Sikh 490 2.0% 23,425 3.8% 2.1%10 Pentecostal 440 1.8% 9,180 1.5% 4.8%
1 n.i.e. - not included elsewhereNumbers may not add due to rounding.
Table 8 - Total Population by Selected ReligionsReligion refers to specific religious denominations, groups or bodies as well as to sects, cults or other religiously defined communities or systems of belief.

Lisgar % Mississauga % Lisgar as a % of Mississauga
Less than grade 9 520 3.3% 32,360 7.4% 1.6%Grades 9 to 13 3,625 23.1% 116,800 26.8% 3.1% Without high school graduation certificate 1,535 9.8% 57,245 13.1% 2.7% With high school graduation certificate 2,085 13.3% 59,550 13.7% 3.5%Trades certificate or diploma 1,285 8.2% 38,440 8.8% 3.3%College 4,595 29.3% 103,885 23.9% 4.4% Without certificate or diploma 1,070 6.8% 29,020 6.7% 3.7% With certificate or diploma 3,525 22.5% 74,865 17.2% 4.7%University 5,660 36.1% 144,325 33.1% 3.9% Without degree 1,260 8.0% 39,495 9.1% 3.2% Without certificate or diploma 800 5.1% 25,250 5.8% 3.2% With certificate or diploma 455 2.9% 14,245 3.3% 3.2% With bachelor's degree or higher 4,405 28.1% 104,825 24.0% 4.2%Total 15,680 100.0% 435,810 100.0% 3.6%1n.i.e. - not included elsewhereNumber may not add due to rounding.
Table 10 - Education Levels for Population 20 Years of Age and Over
Visible Minority Group Lisgar % Mississauga % Lisgar as a % of Mississauga
South Asian 2,945 12.0% 91,145 14.9% 3.2%Black 1,855 7.6% 37,850 6.2% 4.9%Chinese 1,025 4.2% 35,950 5.9% 2.9%Filipino 645 2.6% 24,620 4.0% 2.6%Arab 380 1.6% 11,415 1.9% 3.3%Latin American 320 1.3% 9,265 1.5% 3.5%Southeast Asian 190 0.8% 10,015 1.6% 1.9%Korean 110 0.5% 5,170 0.9% 2.1%West Asian 60 0.2% 4,205 0.7% 1.4%Japanese 35 0.1% 1,975 0.3% 1.8%Visible minority, n.i.e.1 570 2.3% 9,955 1.6% 5.7%Multiple visible minorities 290 1.2% 4,750 0.8% 6.1%All others 16,070 65.6% 364,405 59.7% 4.4%Total 24,500 100.0% 610,730 100.0% 4.0%
Table 9 - Visible Minority Population
Visible minority refers to the visible minority group to which the respondent belongs. It is defined by the Employment Equity Act as "persons other than Aboriginal peoples, who are non-Caucasian in race or non-white in colour."
Page 6 City of Mississauga, Planning and Building Department February 2004

February 2004 City of Mississauga, Planning and Building Department Page 7
Lisgar % Mississauga % Lisgar as a % of Mississauga
Never legally married (single) 4,190 24.2% 144,860 30.2% 2.9%Legally married (and not separated) 11,720 67.8% 275,180 57.3% 4.3%Separated, but still legally married 375 2.2% 13,900 2.9% 2.7%Divorced 595 3.4% 25,285 5.3% 2.4%Widowed 420 2.4% 20,480 4.3% 2.1%Total 17,295 100.0% 479,700 100.0% 3.6%
Not in a common law relationship 16,590 95.9% 458,040 95.5% 3.6%In a common law relationship 705 4.1% 21,660 4.5% 3.3%Total 17,295 100.0% 479,700 100.0% 3.6%
Table 11 - Population by Marital Status
Table 11a - Total Population 15 Years of Age and Over by Legal Marital Status
Table 11b - Total Population 15 Years of Age and Over by Common-law Status
Lisgar % Mississauga % Lisgar as a % of Mississauga
Married couples 5,790 94.2% 135,085 92.6% 4.3% Without children at home 1,185 19.3% 38,880 26.7% 3.0% With children at home 4,605 74.9% 96,205 65.9% 4.8% 1 child 1,350 21.9% 31,580 21.6% 4.3% 2 children 2,360 38.4% 44,265 30.3% 5.3% 3 or more children 900 14.6% 20,360 14.0% 4.4%Common-law couples 355 5.8% 10,825 7.4% 3.3% Without children at home 150 2.5% 6,000 4.1% 2.5% With children at home 205 3.3% 4,820 3.3% 4.3% 1 child 85 1.4% 2,310 1.6% 3.7% 2 children 100 1.6% 1,795 1.2% 5.6% 3 or more children 20 0.3% 715 0.5% 2.8%Total 6,145 100.0% 145,910 100.0% 4.2%
Table 12 - Total Couple Families by Family Structure
Lisgar % Mississauga % Lisgar as a % of Mississauga
Female parent 505 85.6% 20,540 83.4% 2.5% 1 child 265 44.0% 12,135 49.3% 2.2% 2 children 210 34.9% 6,120 24.8% 3.4% 3 or more children 40 6.7% 2,285 9.3% 1.8%Male parent 85 14.4% 4,100 16.6% 2.1% 1 child 50 9.0% 2,400 9.7% 2.1% 2 children 15 2.7% 1,320 5.4% 1.1% 3 or more children 15 2.7% 380 1.5% 3.9%Total 590 100.0% 24,635 100.0% 2.4%Numbers may not add due to rounding.
Table 13 - Lone Parent Families by Sex of Parent

Lisgar % Mississauga % Lisgar as a % of Mississauga
Number of non-family persons 1,415 5.8% 60,010 9.8% 2.4% Living with relatives 615 2.5% 16,705 2.7% 3.7% Living with non-relatives only 375 1.6% 13,190 2.2% 2.8% Living alone 420 1.7% 30,110 4.9% 1.4%Number of family persons 23,085 94.2% 550,035 90.2% 4.2%Total 24,500 100.0% 610,045 100.0% 4.0%
Table 14 - Total Number of Persons in Private Households
Non- family persons refers to an individual not part of the census family group. Family persons are part of the census family group - which consists of a married couple (with or without children of either or both spouses), a couple living common-law (with or without children of either or both partners) or a lone parent of any marital status, with at least one child living in the same dwelling.
Lisgar % Mississauga % Lisgar as a % of Mississauga
1 person 420 6.0% 30,110 15.4% 1.4%2 persons 1,290 18.6% 48,680 25.0% 2.6%3 persons 1,495 21.5% 37,140 19.0% 4.0%4-5 persons 3,275 47.2% 66,100 33.9% 5.0%6 or more persons 465 6.7% 13,110 6.7% 3.5%Total 6,935 100.0% 195,145 100.0% 3.6%Average number of persons in private households 3.5 - 3.1 - -
Table 15 - Total Number of Private Households by Household Size
Lisgar % Mississauga % Lisgar as a % of Mississauga
One-family households 6,080 87.7% 149,680 76.7% 4.1%Multiple-family households 315 4.5% 9,960 5.1% 3.2%Non-family households 545 7.8% 35,510 18.2% 1.5%Total 6,935 100.0% 195,145 100.0% 3.6%Numbers may not add due to rounding.
A one-family household consists of a single family (e.g., a couple with or without children). A multiple-family household is made up of two or more families occupying the same dwelling. A non-family household consists either of one person living alone or of two or more persons who share a dwelling, but do not constitute a family
Table 16 - Total Number of Private Households by Household Type
Page 8 City of Mississauga, Planning and Building Department February 2004
February 2004 City of Mississauga, Planning and Building Department Page 9
Lisgar % Mississauga % Lisgar as a % of Mississauga
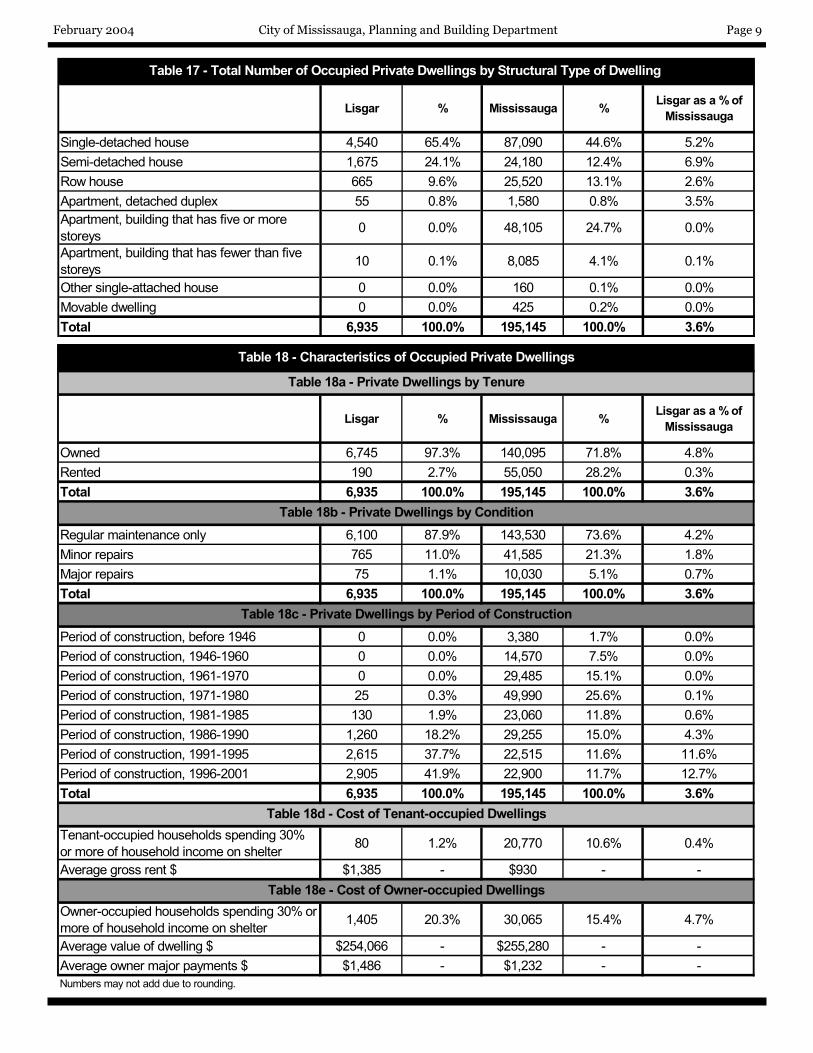
Single-detached house 4,540 65.4% 87,090 44.6% 5.2%Semi-detached house 1,675 24.1% 24,180 12.4% 6.9%Row house 665 9.6% 25,520 13.1% 2.6%Apartment, detached duplex 55 0.8% 1,580 0.8% 3.5%Apartment, building that has five or more storeys 0 0.0% 48,105 24.7% 0.0%
Apartment, building that has fewer than five storeys 10 0.1% 8,085 4.1% 0.1%
Other single-attached house 0 0.0% 160 0.1% 0.0%Movable dwelling 0 0.0% 425 0.2% 0.0%Total 6,935 100.0% 195,145 100.0% 3.6%
Table 17 - Total Number of Occupied Private Dwellings by Structural Type of Dwelling
Lisgar % Mississauga % Lisgar as a % of Mississauga
Owned 6,745 97.3% 140,095 71.8% 4.8%Rented 190 2.7% 55,050 28.2% 0.3%Total 6,935 100.0% 195,145 100.0% 3.6%
Regular maintenance only 6,100 87.9% 143,530 73.6% 4.2%Minor repairs 765 11.0% 41,585 21.3% 1.8%Major repairs 75 1.1% 10,030 5.1% 0.7%Total 6,935 100.0% 195,145 100.0% 3.6%
Period of construction, before 1946 0 0.0% 3,380 1.7% 0.0%Period of construction, 1946-1960 0 0.0% 14,570 7.5% 0.0%Period of construction, 1961-1970 0 0.0% 29,485 15.1% 0.0%Period of construction, 1971-1980 25 0.3% 49,990 25.6% 0.1%Period of construction, 1981-1985 130 1.9% 23,060 11.8% 0.6%Period of construction, 1986-1990 1,260 18.2% 29,255 15.0% 4.3%Period of construction, 1991-1995 2,615 37.7% 22,515 11.6% 11.6%Period of construction, 1996-2001 2,905 41.9% 22,900 11.7% 12.7%Total 6,935 100.0% 195,145 100.0% 3.6%
Tenant-occupied households spending 30% or more of household income on shelter 80 1.2% 20,770 10.6% 0.4%
Average gross rent $ $1,385 - $930 - -
Owner-occupied households spending 30% or more of household income on shelter 1,405 20.3% 30,065 15.4% 4.7%
Average value of dwelling $ $254,066 - $255,280 - -Average owner major payments $ $1,486 - $1,232 - -Numbers may not add due to rounding.
Table 18b - Private Dwellings by Condition
Table 18c - Private Dwellings by Period of Construction
Table 18d - Cost of Tenant-occupied Dwellings
Table 18e - Cost of Owner-occupied Dwellings
Table 18 - Characteristics of Occupied Private Dwellings
Table 18a - Private Dwellings by Tenure

Lisgar % Mississauga % Lisgar as a % of Mississauga
Employed 13,240 76.5% 329,650 68.7% 4.0%Unemployed 530 3.1% 18,455 3.9% 2.9%Not in the labour force 3,525 20.4% 131,595 27.4% 2.7%Total 17,295 100.0% 479,700 100.0% 3.6%Unemployment rate 3.8 - 5.3 - -
Table 19 - Population 15 Years and Over by Labour Force Activity
Lisgar % Mississauga % Lisgar as a % of Mississauga
Manufacturing 2,200 16.0% 61,780 17.7% 3.6%Wholesale trade 1,455 10.6% 27,240 7.8% 5.3%Retail trade 1,400 10.2% 38,555 11.1% 3.6%Professional,scientific and technical services 1,280 9.3% 29,475 8.5% 4.3%Finance and insurance 1,080 7.8% 22,450 6.4% 4.8%Transportation and warehousing 935 6.8% 24,055 6.9% 3.9%Healthcare and social assistance 835 6.1% 23,200 6.7% 3.6%Educational services 705 5.1% 16,470 4.7% 4.3%Accommodation and food services 600 4.3% 18,275 5.3% 3.3%Public administration 575 4.2% 10,675 3.1% 5.4%Other services (except public administration) 540 3.9% 13,935 4.0% 3.9%Administrative and support, waste management and remediation services 530 3.8% 15,690 4.5% 3.4%
Construction 505 3.7% 15,320 4.4% 3.3%Information and cultural industries 465 3.4% 11,165 3.2% 4.2%Real estate and rental and leasing 325 2.4% 7,820 2.2% 4.2%Arts, entertainment and recreation 125 0.9% 4,390 1.3% 2.8%Utilities 90 0.6% 1,810 0.5% 5.0%Management of companies and enterprises 35 0.2% 540 0.2% 6.5%Agriculture, forestry, fishing and hunting 20 0.1% 630 0.2% 3.2%Mining and oil and gas extraction 15 0.1% 340 0.1% 4.4%Industry - Not applicable 65 0.5% 4,295 1.2% 1.5%Total 13,770 100.0% 348,110 100.0% 4.0%Numbers may not add due to rounding.
Table 20 - Total Labour Force by Industry Division
The labour force by industry division is based on the 1997 North American Industry Classification System (NAICS).
Page 10 City of Mississauga, Planning and Building Department February 2004

February 2004 City of Mississauga, Planning and Building Department Page 11
Lisgar % Mississauga % Lisgar as a % of Mississauga
Business, finance and administration occupations 3,150 22.9% 78,055 22.4% 4.0%
Sales and service occupations 2,790 20.3% 73,305 21.1% 3.8%Management occupations 2,335 17.0% 46,055 13.2% 5.1%Trades, transport and equipment operators and related occupations 1,495 10.8% 43,920 12.6% 3.4%
Natural and applied sciences and related occupations 1,370 9.9% 29,535 8.5% 4.6%
Social science, education, government service and religion 980 7.1% 20,275 5.8% 4.8%
Processing, manufacturing and utilities 740 5.4% 29,890 8.6% 2.5%Health occupations 500 3.6% 13,275 3.8% 3.8%Art, culture, recreation and sport 230 1.7% 7,475 2.2% 3.1%Primary industry 110 0.8% 2,025 0.6% 5.4%Occupation - Not applicable 70 0.5% 4,295 1.2% 1.6%Total 13,770 100.0% 348,110 100.0% 4.0%
The labour force by occupation is based on the 2001 National Occupational Classification for Statistics.
Table 21 - Total Labour Force by Occupation
Lisgar % Mississauga % Lisgar as a % of Mississauga
Car, truck, van, as driver 10,260 82.4% 231,240 74.7% 4.4%Public transit 1,180 9.5% 45,530 14.7% 2.6%Car, truck, van, as passenger 765 6.1% 21,915 7.1% 3.5%Walked 140 1.1% 7,940 2.6% 1.8%Other method 60 0.5% 1,420 0.5% 4.2%Bicycle 25 0.2% 825 0.3% 3.0%Taxicab 25 0.2% 420 0.1% 6.0%Motorcycle 0 0.0% 105 0.0% 0.0%Total 12,460 100.0% 309,395 100.0% 4.0%Numbers may not add due to rounding.
Table 22 - Total Employed Labour Force by Mode of Transportation

Category Lisgar % Mississauga %
Under $10,000 85 1.2% 7,205 3.7%$ 10,000 - $19,999 120 1.8% 11,100 5.7%$ 20,000 - $29,999 195 2.8% 13,335 6.8%$ 30,000 - $39,999 300 4.3% 16,940 8.7%$ 40,000 - $49,999 430 6.2% 17,505 9.0%$ 50,000 - $59,999 470 6.8% 17,410 8.9%$ 60,000 - $69,999 625 9.0% 17,685 9.1%$ 70,000 - $79,999 635 9.1% 16,025 8.2%$ 80,000 - $89,999 720 10.4% 14,310 7.3%$ 90,000 - $99,999 725 10.4% 12,010 6.2%$100,000 and over 2,635 38.0% 51,620 26.4%Total 6,935 100.0% 195,145 100.0%Average household income $95,474 - $80,442 -
Table 23 - Household Income in 2000 of All Private HouseholdsHousehold income is the sum of the total incomes of all members of that household. Total income is calculated from all sources, including employment income, income from government programs, pension income, investment income and any other money.
Category Lisgar % Mississauga %
Without income 925 5.4% 28,815 6.0%Under $1,000 595 3.4% 21,165 4.4%$ 1,000 - $ 2,999 700 4.1% 20,475 4.3%$ 3,000 - $ 4,999 595 3.4% 16,685 3.5%$ 5,000 - $ 6,999 525 3.0% 17,480 3.6%$ 7,000 - $ 9,999 730 4.2% 23,495 4.9%$10,000 - $11,999 470 2.7% 16,760 3.5%$12,000 - $14,999 650 3.8% 25,600 5.3%$15,000 - $19,999 795 4.6% 33,225 6.9%$20,000 - $24,999 815 4.7% 31,995 6.7%$25,000 - $29,999 820 4.7% 31,880 6.6%$30,000 - $34,999 1,230 7.1% 36,375 7.6%$35,000 - $39,999 1,215 7.0% 29,910 6.2%$40,000 - $44,999 1,155 6.7% 27,775 5.8%$45,000 - $49,999 875 5.1% 20,065 4.2%$50,000 - $59,999 1,550 9.0% 31,965 6.7%$60,000 and over 3,640 21.1% 66,025 13.8%Total 17,295 100.0% 479,700 100.0%Numbers may not add due to rounding.
Table 24 - Individual Income in 2000 of Population 15 Years of Age and Over
Individual income is the total income from all sources, including employment income, income from government programs, pension income, investment income and any other money income. Lisgar Mississauga
Male $50,138 $43,010Female $30,903 $26,845
Table 25 - Individual Average Income (Age 15 Years and Over)
Average Income—see Table 25. Refers to the average total money received from the following sources during calendar year 2000 by persons 15 years of age and over: wages and salaries; net farm income; net non-farm income from unincorporated business and/or professional practice; federal Child Tax benefits; Old Age Security pension and Guaranteed Income Supplement; benefits from Canada or Quebec Pension Plan; benefits from Unemployment Insurance; other income from government sources; dividends, interest on bonds, deposits and savings certificates, and other investment i n c o m e ; r e t i r e m e n t p e n s io n s ; superannuation and annuities, including those from RRSPs and RRIFs; other money income.
For further information on the City of Mississauga please visit our website at www.mississauga.ca
The data presented in this community profile is from a custom tabulation of 2001 Census of Canada data prepared for the City of Mississauga by Statistics Canada. It is calculated from 20% sample data. This data does not include the institutional population or the 4.0% census undercount.
February 2004 City of Mississauga, Planning and Building Department Page 12