Ta2.09 5 bersales.philippines digitization ppp bersales jan 14 2017

12th National Convention on Statistics (NCS) EDSA Shangri-La Hotel, Mandaluyong City
October 1-2, 2013
1SEC 2012: THE NEW PHILIPPINE SOCIOECONOMIC CLASSIFICATION SYSTEM
by
Lisa Grace S. Bersales, Nicco de Jesus, Luzviminda Barra, Judy Mercado, Beatrice Gobencion and Michael Daniel Lucagbo
For additional information, please contact: Author’s name : Lisa Grace S. Bersales Designation : Professor and Vice President for Planning and Finance Affiliation : University of the Philippines Address : University of the Philippines, Magsaysay Ave., Diliman, Quezon City Tel. no. : +632-9282866 E-mail : [email protected] Author’s name : Nicco de Jesus Designation : Chairman Affiliation : Research Committee, Marketing and Opinion Research Society of the Philippines (MORES) Address : Unit 31 Martino Building #52 Libertad Corner Kanlaon, Mandaluyong City Tel. no. : +632-533 6653 E-mail : [email protected] Author’s name : Luzviminda Barra Designation : Commercial Director Affiliation : TNS Philippines Address : Tel. no. : E-mail : Author’s name : Judy Mercado Designation : Affiliation : Address : Tel. no. : E-mail : Author’s name : Beatrice Gobencion Designation : Affiliation : Address : Tel. no. : E-mail : Author’s name : Judy Mercado Designation : Affiliation : Address : Tel. no. : E-mail :

1SEC 2012: THE NEW PHILIPPINE SOCIOECONOMIC CLASSIFICATION
by
Lisa Grace S. Bersales, Nicco de Jesus, Luz Barra, Judy Mercado, Beatrice Gobencion, and Michael Daniel Lucagbo
ABSTRACT
Research professionals from the Marketing and Opinion Research Society of the Philippines (MORES) endorsed in 2012 the use of 1SEC, a new marketing segmentation system for Filipino households. MORES, in collaboration with the National Statistics Office and the U.P. School of Statistics, started in 2010, the development of a single socioeconomic classification for use by all market research agencies. The result is 1SEC which includes the following: (1) nine socioeconomic clusters constructed using hierarchical and non-hierarchical cluster analyses; (2) a list of determinants of the socioeconomic clusters households developed using ordered logistic regression models; and, (3) an instrument for use in the field to determine a household’s socioeconomic classification. 1SEC has 9 SEC household groupings based on expenditure pattern of the households provided by data on the 36,000+ households of the 2009 Family Income and Expenditure Survey (FIES). The least spending households are grouped under Cluster 1 while the highest spending households fall under Cluster 9. Forty five percent (45% ) of Philippine households belong to the three least spending household groups (i.e. Cluster 1-3) while only 20% belong to the top 3.Socioeconomic distributions by urban/rural and by region were also constructed. Ordered logistic regression modeling produced significant determinants grouped as follows:(1) Quality of consumers in the household (e.g. number of employed members, level of education, etc);(2) Number of selected energy-using facilities owned (e.g. TV, microwave oven, computers);(3) Urban and regional membership;(4) Transport type ownership;(5) Water source type; (6) Connectivity (or number of phones);(7) Living Space Assets (e.g. number of sala sets);(8) Living Shell (i.e. type of wall and type of roof);and,(9) Tenure of Home (i.e. whether house is owned or rented). An instrument to classify a household into the SEC was developed using the results of the ordered logistic regression. It is referred to as the 1SEC instrument. The 1SEC instrument has been made available to all MORES members and research agencies with members under MORES for validation. Keywords: 1SEC, MORES, hierarchical cluster analysis, non-hierarchical cluster analysis, ordered logistic regression
I. Historical Background
The Socioeconomic Classification (SEC) of households in the Philippines was first brought up in 1980 when the six-year old Marketing and Opinion Research Society(MORES) came out with a guide in 1980. A more formal approach was proposed by Mr. Tony Concepcion in 1983 in a presentation made with the San Miguel Corporation. From 1984 to 1986, consultations and presentations ensued from both research agencies and research clients (primarily marketing research departments of corporate entities). In 1986, Dr. Eduardo “Ned” Roberto published “The Validity of the SEC of the Philippine Markets”. In 1990, then National Statistics Office (NSO) head Butch Africa was asked to deliver a talk on Income Classification upon the invitation of then MORES President Mahar Mangahas. In 1991, a Unified MORES Guidelines for SEC Households was adopted after a committee consisting of Mercy Abad, Dennis Arroyo, Ime Balquin, Azucena Barredo, Rosanna Callero, Antonio

Concepcion, Menchu Esteban, Purita Gamboa, Rosario Henares, Carmen Lim, Mahar Mangahas, Alice Pascual , Agnes Tayao, and Sally Zaballa endorsed it. However, not all members adopted the guidelines. In 1999, MORES President Bienvenido Niles, Jr. and then Darrah Estrada asked Dr. Ned Roberto to conduct another study.
In 1991, the market research industry adopted the five SEC tiers: AB, C1, C2, D, and E. Three sets of SEC variables were adopted to classify households, namely, Home Appearance, Household Head’s educational attainment, and Home facilities. Using a 5-point scale in rating each variable, households were classified along agreed tier system: AB- 30-35 points, C1-25-29 points, C2-20-24 points, D- 15-19 points, and E – 7-14 points.
Unfortunately, not all members carried out the standardization scheme given that many agencies by this time had in-house or mother company standards to follow. The mandate in 1991 was to use the unified standard and for research houses to compare with other country experiences. Only the Philippine Survey and Research Center (PSRC) followed the industry mandate. Sofres, Asia Research Organization (ARO), AC Nielsen, and Trends MBL followed in-house standards.
In 1999, the SEC standardization issue was again taken on by a new team led by Dr. Ned Roberto. This team included Sharon Moyano, Jenny Intac, Nennette Natividiad, Belen Quiambao and assistance from the University of the Philippines School of Statistics. The objective of the research team was to find out the discriminating power of the 5-class system across tiers and to find out if the number of SEC classes plays an important role in classifying efficacy. Using the Wilks Lambda statistics and the two-group discriminant function the team had basically two conclusions: First, the most correct classification came from extreme ends (ie. Class A vs Class E) and the least correct classification arose from adjacent tiers. Secondly, the number of SEC classes plays no significant determining role in classifying efficacy. The team also found out that income was the most significantly discriminating across SEC classes and was also the most temporally stable. The 1999 team recommended integrating approaches such as the SWS Self-Perception of Class Belonging. It also recommended exploring how to work with the National Statistics Office (then the NCSO), in getting respondent’s estimation of household income and expenditure.
In 2004, at the 7th National MORES Congress, a new study was presented that pointed
to use a new integrated instrument. A comparison of the 2004 and the 1999 findings shows that
while indicators for SEC prediction would vary depending on the times, there are recurring
commonalities and themes in developing an SEC instrument. These are: a) Need for
parsimony; b) Predictive power is strongest for the extremes (e.g. A vs E); c) Qualitative
variables more than facility ownership tend to be better predictors for middle class; d)
Determinants’ tendency to change over time due to technological assimilation, economic
progress, lifestyle change (e.g. airconditioners, mobile phones, etc used to be significant
determinants).
As Philippine marketing research industry successfully self-organized into a mature
professional organization in the 1980s, marketing research agencies entered the 1990s where
marketers of fast moving consumer goods (FMCG) faced stiffer competition from an
increasingly liberalized market. Marketers needed the option of exploring alternative research
approaches and service offers to sustain competitiveness in the market. The only hitch was that
the marketing ‘scoreboard’ so to speak, were still not comparable.
In the meantime, local research agencies were also increasingly adhering to in-house
standards with global and regional alignments still inane of the evolving need for SEC
classification. On the government side, the National Statistics Office (NSO) was also evolving
after organizational changes from the previous NCSO set-up. Lastly, academe was largely
perceived as a last resort consulting resource tapped only for one-off projects.
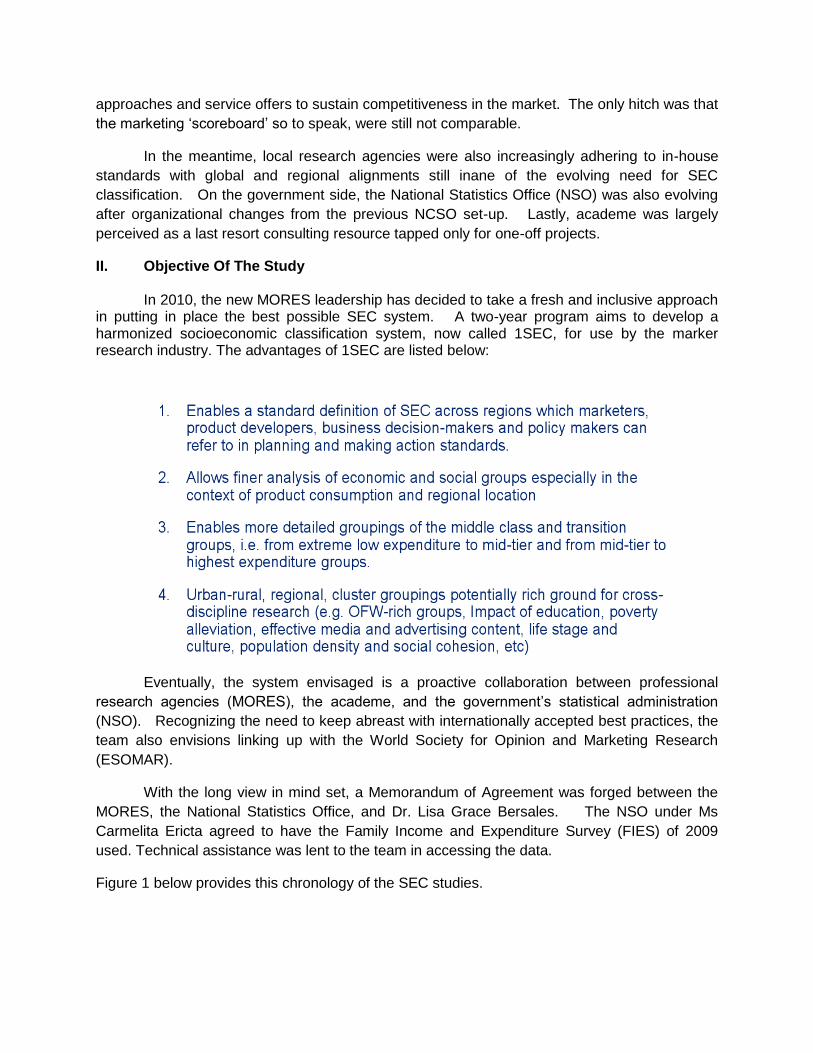
II. Objective Of The Study In 2010, the new MORES leadership has decided to take a fresh and inclusive approach
in putting in place the best possible SEC system. A two-year program aims to develop a harmonized socioeconomic classification system, now called 1SEC, for use by the marker research industry. The advantages of 1SEC are listed below:
Eventually, the system envisaged is a proactive collaboration between professional
research agencies (MORES), the academe, and the government’s statistical administration
(NSO). Recognizing the need to keep abreast with internationally accepted best practices, the
team also envisions linking up with the World Society for Opinion and Marketing Research
(ESOMAR).
With the long view in mind set, a Memorandum of Agreement was forged between the
MORES, the National Statistics Office, and Dr. Lisa Grace Bersales. The NSO under Ms
Carmelita Ericta agreed to have the Family Income and Expenditure Survey (FIES) of 2009
used. Technical assistance was lent to the team in accessing the data.
Figure 1 below provides this chronology of the SEC studies.
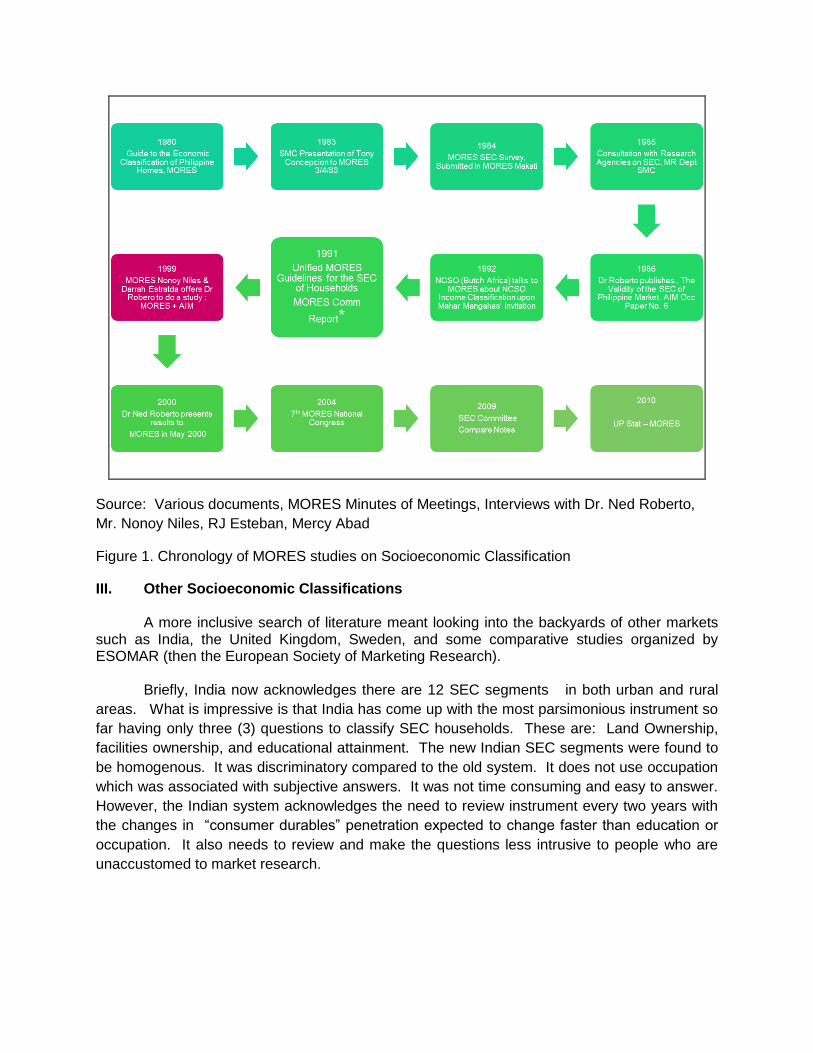
Source: Various documents, MORES Minutes of Meetings, Interviews with Dr. Ned Roberto,
Mr. Nonoy Niles, RJ Esteban, Mercy Abad
Figure 1. Chronology of MORES studies on Socioeconomic Classification
III. Other Socioeconomic Classifications
A more inclusive search of literature meant looking into the backyards of other markets such as India, the United Kingdom, Sweden, and some comparative studies organized by ESOMAR (then the European Society of Marketing Research).
Briefly, India now acknowledges there are 12 SEC segments in both urban and rural
areas. What is impressive is that India has come up with the most parsimonious instrument so
far having only three (3) questions to classify SEC households. These are: Land Ownership,
facilities ownership, and educational attainment. The new Indian SEC segments were found to
be homogenous. It was discriminatory compared to the old system. It does not use occupation
which was associated with subjective answers. It was not time consuming and easy to answer.
However, the Indian system acknowledges the need to review instrument every two years with
the changes in “consumer durables” penetration expected to change faster than education or
occupation. It also needs to review and make the questions less intrusive to people who are
unaccustomed to market research.

Source: Market Research Society of India, 2011
Figure 2. The INDIAN SEC DISTRIBUTION, 2011
The United Kingdom1, as with the Sweden2 and most industrialized countries, has the
benefit of a comprehensive occupation-based classification system of the economic head of the
household.
As more and more economies become closely knit, classification standards become of
paramount importance. This includes the SEC.
In Europe, SEC is among the many harmonization initiatives unfurling under the ESEC , or the European Socio-economic Classification (ESeC) project3. Inspired by Goldthorpe’s theoretical framework, it focuses on employment relations. It is based on the International Standard Classification of Occupations (ISCO). The ESEC however has been influenced by the United Kingdom. Both professional statisticians and academics have voiced criticisms of the project in recent years. Because of these developments, the future of the French classification of occupations and socio-occupational categories (PCS) needs to be reconsidered in a new light.
The ESEC is being developed under a consortium of academics from various
universities4.
In dynamic Asian regions, the Philippines will be seeing economic integration starting
soon.
1 The National StatisticsSocio-economic Classification User Manual. Office for National Statistics. National Statistics. 2005 edition
2 Published in Reports on Statistical Co-ordination 1982:4, Statistics Sweden
3Brousse, Cecile. ESeC: the European Union’s Socio-economic Classification Project. Courrier des statistiques, English series no.
15, 2009 4 The consortium was formed in response to an invitation to tender from the
European Commission’s Directorate-General for Research in 2004.

Before it does, there is an urgent need to exploit untapped benefits of a synergistic
collaboration of knowledge economy sector namely: Research agencies, marketers, a proactive
and integrated government statistical system, a progressive academe, and technologists.
Important results of the review of past MORES and other studies highlight the following
considerations used by the study discussed in this paper.
Table 1. Highlights of past studies on SEC
IV. Methodology Using FIES 2009, various combinations of segmentation were employed using cluster
analysis. Total household income only, total household expenditure only, and a combination of total household income and total household expenditure were employed as cluster analysis drivers. Non-hierarchical cluster analysis was first done to produce initial clusters and hierarchical cluster analysis was done to produce 12-cluster down to 5-cluster segments. The team finally decided on the 9-cluster segments since the 10 to 12 clusters produced upper SEC segments with percentages lower than 1% while 5 to 8 clusters provided segments considered too granular.
Expenditure-based clusters were finally selected since the goal of the SEC study is to
form clusters that capture households’ consumption patterns.

The ordered logistic model was used in determining significant variables available in FIES to predict a household’s cluster. Several models were developed using different levels of disaggregation ( e.g.,from total expenses on food down to expenses on meat) to transforming quantitative variables to bivariate variables ( e.g., from expenses in LPG (in pesos) to whether LPG was used for fuel or not ). Other variables include demographic characteristics of the household, the household head, and the spouse. Proxy variables for energy were arrived at by using a national energy consumption rate per facility. Steps like this were useful in translating expenditure variables (e.g. power consumption of the household) into discrete count data (e.g. number of facilities owned). The final choice of variables retained in the model considered both statistical significance and feasibility for field use. The latter is the reason for transforming quantitative variables to bivariate variables. The MORES 1SEC team (from PSRC, TNS/Kantar, Nielsen) provided guidance in determining feasibility of use in the field. All in all, after one and half years’ worth of trial and error, an instrument prototype was arrived at that can be asked below 10 minutes per household. This was significant considering the best MORES instrument in 2004 can be asked between 1 and 1.5 hours. A more precise instrument based on the ordered logistic regression modeling of quantitative variables only may be developed. This is how the University of the Philippines developed a similar instrument for the reforms it is developing for its Socialized Tuition Fee Assistance Program (STFAP).
The final instrument was first presented to the industry on July 4, 2012 in the event of the MORES National Congress held in Plantation Bay, Cebu. To finally validate claims that the instrument can be operationalized on field, MORES members were enjoined to adopt the 1SEC instrument and give feedback for comparison purposes. A formal validation project is being pursued by the 1SEC team with the generous support of major research houses. This is targeted to be launched this year. V. Results
There are 9 SEC household groupings which tend to spend in the same way based on the 36,000+ households included in the 2009 Family Income and Expenditure Survey (FIES). The least spending households are grouped under Cluster 1 while the highest spending households fall under Cluster 9. (For practical purposes, MORES is adopting number labels instead of letter labels to minimize association with previous SEC segments (i.e. A, B, C1, C2, D, E). As shown in Figure 1, about 45% of Philippine homes belong to the three least spending household groups (i.e. Cluster 1-3) while only about 20% belong to the top 3 spending household groups. Figure 3 shows the 1SEC pyramid by SEC. Figure 4, on the other hand, shows the percentage allocation.
Figure 3. 1SEC Pyramid, Total Philippines

Figure 4. Distribution of Philippine Households by 1SEC Clusters
Socioeconomic distributions by region were also constructed. It is noted that NCR has an inverted pyramid, different from the picture for other regions.
Regions Philippines National Capital Region North Central Luzon South Luzon, Bicol Visayas Mindanao
1 SEC CLUSTER
PYRAMID
POPULATION
DENSITY, Pop Per
Sq Km
295 18,166 237 317 303 212
The MORES 1SEC allows a granular examination of the how households are spread in
urban and rural areas. Interestingly, the middle class is uniformly distributed across segments in the urban
areas. Practically, all of the highest spending homes are also in urban areas. As shown in the figure below.
Figure 5. Regional 1SEC Pyramids

Figure 6. 1SEC Pyramids by Urban-Rural Disaggregation
A combined pyramid chart below in Figure 6 shows that after 1SEC cluster No. 3, urban areas are concentrated in urban areas. In contrast, households falling under 1SEC cluster 4, that is Clusters 1, 2, 3 are concentrated in rural areas.
The Philippines can be mapped in terms of urban-rural SECs as the figure shows below.
With a high population density in NCR, the Philippines could be one of the countries which has put most of the golden eggs in just one basket – so to speak.
On the other hand, economic planners, industrialists, and infrastructure services entities might find opportunities in grooming the next mega centers as NCR saturates itself beyond what the region can bear.
Figure 6. 1SEC Pyramids by Region and by Urban-Rural disaggregation

As the world witnesses the rapid shift of rapid economic growth from West to East, all the more interest in measuring the up and rising segments from the middle class.
Ordered logistic regression modeling produced significant determinants grouped as follows:(1) Quality of consumers in the household (e.g. number of employed members, level of education, etc);(2) Number of selected energy-using facilities owned (e.g. TV, microwave oven, computers);(3) Urban and regional membership;(4) Transport type ownership;(5) Water source type; (6) Connectivity (or number of phones);(7) Living Space Assets (e.g. number of sala sets);(8) Living Shell (i.e. type of wall and type of roof);and,(9) Tenure of Home (i.e. whether house is owned or rented). The following graphical illustration, Figure 7, shows the determinants and Annex 1 provides the 1SEC instrument. Using the 9 variable groups, 25 items were used in the instrument.
Figure 7. Significant Determinants of 1SEC
The ordered logistic regression has the following hit rates in predicting 1SEC clusters of households. These hit rates are the percentage of correctly classified households:
TRUE CLUSTER
PREDICTED CLUSTER Total
1 2 3 4 5 6 7 8 9
1 1423 513 90 16 4 1 0 0 0 2047
69.52 25.06 4.4 0.78 0.2 0.05 0 0 0
2 1562 2134 1179 406 146 39 2 0 0 5468
28.57 39.03 21.56 7.43 2.67 0.71 0.04 0 0
3 686 1881 2164 1435 925 311 81 14 0 7497
9.15 25.09 28.86 19.14 12.34 4.15 1.08 0.19 0
4 124 524 987 940 1053 587 207 56 1 4479
2.77 11.7 22.04 20.99 23.51 13.11 4.62 1.25 0.02
5 52 213 526 697 1077 885 507 202 8 4167
1.25 5.11 12.62 16.73 25.85 21.24 12.17 4.85 0.19
6 11 64 167 290 623 769 716 427 36 3103

0.35 2.06 5.38 9.35 20.08 24.78 23.07 13.76 1.16
7 3 16 65 149 344 568 783 834 139 2901
0.1 0.55 2.24 5.14 11.86 19.58 26.99 28.75 4.79
8 0 4 19 33 104 229 464 1070 638 2561
0 0.16 0.74 1.29 4.06 8.94 18.12 41.78 24.91
9 0 1 2 1 5 16 45 196 649 915
0 0.11 0.22 0.11 0.55 1.75 4.92 21.42 70.93
Total 4003 5612 5496 4142 4228 3310 2610 2494 1243 33138
The MORES 1SEC offers a glimpse into the distribution characteristics between
countries like India and the Philippines.
Table 2. SEC Systems: India and the Philippines.
India Philippines
SEC % SEC %
A1 0.5 9 2.8
A2 1.8 8 7.7
A3 3.0 7 8.8
B1 4.0 6 9.4
B2 5.1 5 12.6
C1 7.0 4 13.5
C2 7.2 3 22.6
D1 11.4 2 16.5
D2 15.1 1 6.1
E1 19.5
E2 15.8
E3 9.6
Total 100.0 Total 100.0
Source: Indian Marketing Research Society and Marketing and Opinion Research Society of the Philippines
Social scientists as well as marketers on the look out for new segments to sell their
products and services are in a better position to analyze opportunities using the Gini ratio. The GINI ratio distribution of some indicators for 1SEC in Figure 8 shows that ownership of vehicles and appliances such as microwave oven, airconditioner, computer are the most discriminating between the rich and the poor. Meals our of the home, purchase of books and admission tickets for shows are also provided in the computation of the Gini indicator even if these were not significant in the modeling.

Figure 8. Gini Ratios for Selected Indicators
VI. Next Steps
The MORES 1SEC Project is a multi-sector system-wide initiative that aims to
harmonize classification standards across marketing research houses. It is not a one-off
project.
The next stage in building the system involves listing operational standards in
implementing the 1SEC instrument on field. This stage is projected to be started in the fourth
quarter and hopefully done by yearend in time for operational endorsement next year.
MORES is formalizing longer term working agreements with the National Statistics Office
(NSO) and the University of the Philippines to sustain the momentum gained in the past two
years. This comes at a fortuitous time when the Family Income and Expenditure (FIES) will
soon be an annual product of the
As it closely works with the newly integrated Philippine Statistical Administration (PSA)
where the FIES will be run annually, the MORES hopes to establish closer working ties with the
statistical system and academe in sharpening the 1SEC model and its corresponding
instruments (the current one being Version 1.0).
Already, the MORES has formally invited NSO to send an official representative to the
MORES Research Committee.

MORES also hopes to fast-track working with the statistical academic circles.
MORES lastly hopes to integrate with the international research standards (foremost of
which is ESOMAR5) closer in order to be globally attuned to best practices.
Phase 4 ,the validation of 1SEC instrument, is currently being done. Talks with major
market research agencies to fund a customized validation study have been done. This study
will measure operational and practical implications of following implementing the 1SEC
instrument. It consists of at least a sample size of 2,000 to measure how well the instrument
works in nine (9) regional groups in urban and rural Philippines. Target implementation period
is October 2013.
Down the road, the MORES 1SEC team hopes to see a more formal collaboration that will accelerate community sharing of knowledge and technology resources related to HARMONIZED METRICS, the first of which is the 1SEC instrument. This collaboration should enable more harmonization projects across MORES-Academe-Government- and International sectors such as the ESOMAR.
5 World Association for Opinion and Marketing Research

Annex 1
MORES 1SEC Instrument
PROJECT NAME: _____________________
Q1 Length of Interview : Start to End AREA LAUNDRY SERV (p 4 wks) MAIN WATER SOURCE Miindanao 0 Not paid for laundry 0 Others (dug well, stream, rain,
peddler, etc) 1
Visayas 1 Paid for laundry 4 Shared 2 South Luzon 3 Own use 3 North/Central Luzon Bicol
2 1
Any HHold Member TRAVELED by Plane; paid by self or HHold ( p 4 wks)
Metro Manila 7 None 0 HW EMPLOYMENT STATUS Has 5 Not employed 0 LOCALE Employed (full/part-time)/self-
employed 2
Rural 0 HHold Member Currently Enrolled in PRIVATE School
Urban 2 None 0 HHEAD WORK SECTOR Has 4 No job 0 TOTAL HHOLD MEMBERS EMPLOYED (in p 6 months)
_____ Agri/fishery 1
HIRED SCHOOL TRANSPORT (p 4 wks) Trade (stores), Eatery 2 HHOLD TYPE Not paid for school transport 0 Others 3 Extended/ w/ non-related
families/persons 1 Paid for school transport 3
Single/Nuclear 3 HHEAD OCCUPAT’L STATUS Financial Assistance from Abroad in p 12
months No job 0
HHOLD HEAD CIVIL STATUS None 0 Others 1 Married 1 Has 2 Mgrs, supervisors, gov’t
officials, corp execs 2
Not (single/separated/ widowed/divorced)
3
# of DURABLES/FACILITIES OWNED HOUSE OWNERSHIP HHEAD EDUCT’L ATTAINMENT Stereo/CD _____ Not own 1 No schooling 0 TV _____ Own 2 Elementary 2 VHS/VCD/DVD/VTR _____ High school
3 Refrigerator/freezer _____ # of Senior Citizens
Voct’l (Tech course)/ College undergraduate
4
Washing machine _____ 60 years and above _____
College graduate 6 Aircon _____ Graduate (MBA)degree holder 10 Computer/laptop Phones (landline & mobile) _____ HOUSE TYPE (observation) VEHCLE OWNERSHIP Sala Set/Sofa _____ Single detached 0 # of cars _____ Duplex 0 # of jeep/ motorcycles/tricycles _____ TOILET FACILITY Apartment/townhouse/condo 2 None 0 Others 0 Others (pail system, etc) 3 FUEL TYPES for COOKING Open-pit 1 Not use any below 0 Closed-pit 2 Wood 1 Water-sealed (with flush) 4 Charcoal 1 LPG 4 DOMESTIC SERV (p 4 wks) No helper/boy/driver 0 Has paid helper/boy 7
Location/ Distict Spot/ Precinct No
Name of Respondent Age Sex
Address
Between And
Landline # Cellphone # Office #

ROOF TYPE (observation) Salvaged/makeshift materials
0
Mixed but predominantly salvaged materials
1
Light materials (cogon, nipa, anahaw)
2
Mixed but predominantly light materials
2
Mixed but predominantly strong materials
3
Strong materials (galvanized, iron, all)
4
OUTER WALL TYPE (observation)
Salvaged/makeshift materials 0 Mixed but predominantly
salvaged materials 1
Light materials (cogon, nipa, anahaw)
2
Mixed but predominantly light materials
2
Mixed but predominantly strong materials
3
Strong materials (galvanized, iron, all)
4
For DURABLES: (for each of the durables, we are asked to get the # and there is a multiplier for each to get the total score.
Area # of durables owned
Locale Stereo/CD
House type TV x 2
# HH mem employed
X 4 VHS/VCD/DVD/VTR
HHold type Ref/freezer x 4
HHead civil status Washing machine
HHead Educt’n Aircon x 2
Vehicle ownership Computer/laptop X 2
# of cars x 4 Phones x 2
# of jeep/ moto/rtricycles
x 2 Sala Set/Sofa x 2
Sub-total Sub-total
Fuel types Toilet facility
Domestic services Main water source
Laundry services HW employment
HHold member plane travel HHead work sector
HHold member enrolled HHead occupation
Hired school transport House Ownership
Financial assistance abroad # Senior Citizen - 2
Sub-total House Type
Roof type
Outer wall
Sub-total
GRAND TOTAL
Cluster 1 (23 and below) 1 Cluster 2 (24 - 29) 2 Cluster 3 (30 - 34) 3 Cluster 4 (35 – 38) 4 Cluster 5 (39 – 43) 5 Cluster 6 (44 – 48) 6 Cluster 7 (49 – 54) 7 Cluster 8 (55 - 66) 8

Cluster 9 (67 and above) 9