Liquid/Semiconductor Interfaces through Vibrational Spectroscopy R. Kramer Campen Physical Chemistry...
38
Liquid/Semiconductor Interfaces through Vibrational Spectroscopy R. Kramer Campen Physical Chemistry Department Fritz Haber Institute of the Max Planck Society 1 / 37 25/3/1 3 w/ Maria Sovago, Cho-Shuen Hsieh, Mischa Bonn, Ana Vila Verde
-
Upload
pierce-kelly -
Category
Documents
-
view
222 -
download
0
Transcript of Liquid/Semiconductor Interfaces through Vibrational Spectroscopy R. Kramer Campen Physical Chemistry...
Liquid/Semiconductor Interfaces through
Vibrational Spectroscopy
R. Kramer CampenPhysical Chemistry Department
Fritz Haber Institute of the Max Planck Society
1 / 3725/3/13
w/ Maria Sovago, Cho-Shuen Hsieh, Mischa Bonn, Ana Vila Verde
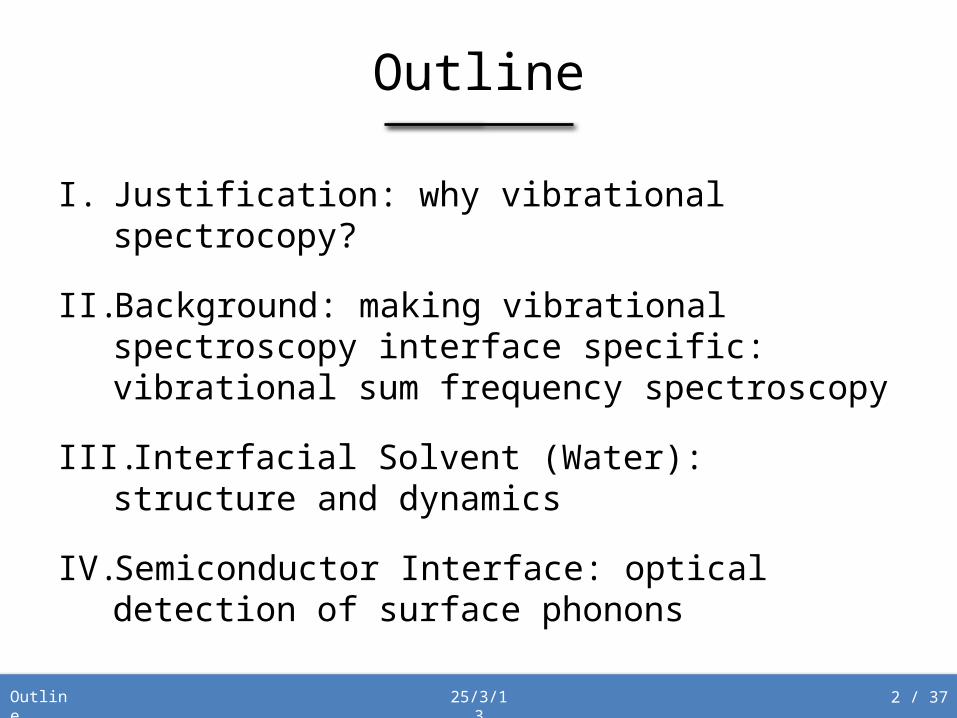
Outline
I. Justification: why vibrational spectrocopy?
II. Background: making vibrational spectroscopy interface specific: vibrational sum frequency spectroscopy
III. Interfacial Solvent (Water): structure and dynamics
IV. Semiconductor Interface: optical detection of surface phonons
2 / 3725/3/13
Outline

Why vibrational spectroscopy?
3 / 3725/3/13
Vibrations report, label free, on inter/intramolecular forces (and structure)
I. Justification
Barth and Zscherp (2002) Quarterly Reviews of Biophysics, 35, 4 from
Zscherp and Heberle (1997) Journal of Physical Chemistry B, 101, 10542
Spectrum of local oscillators modified by environment,
1. Through-bond coupling
2. Hydrogen bonding
3. Transition dipole coupling
Macromolecules (proteins)
4 / 3725/3/13
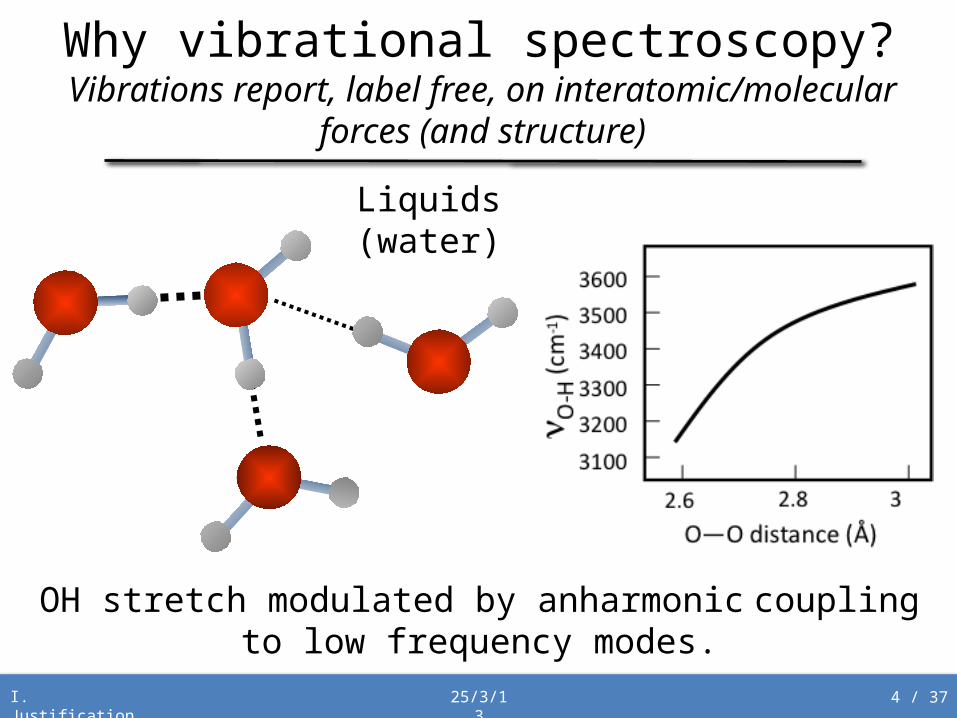
Why vibrational spectroscopy?Vibrations report, label free, on
interatomic/molecular forces (and structure)
Liquids (water)
I. Justification
OH stretch modulated by anharmonic coupling to low frequency modes.
5 / 3725/3/13
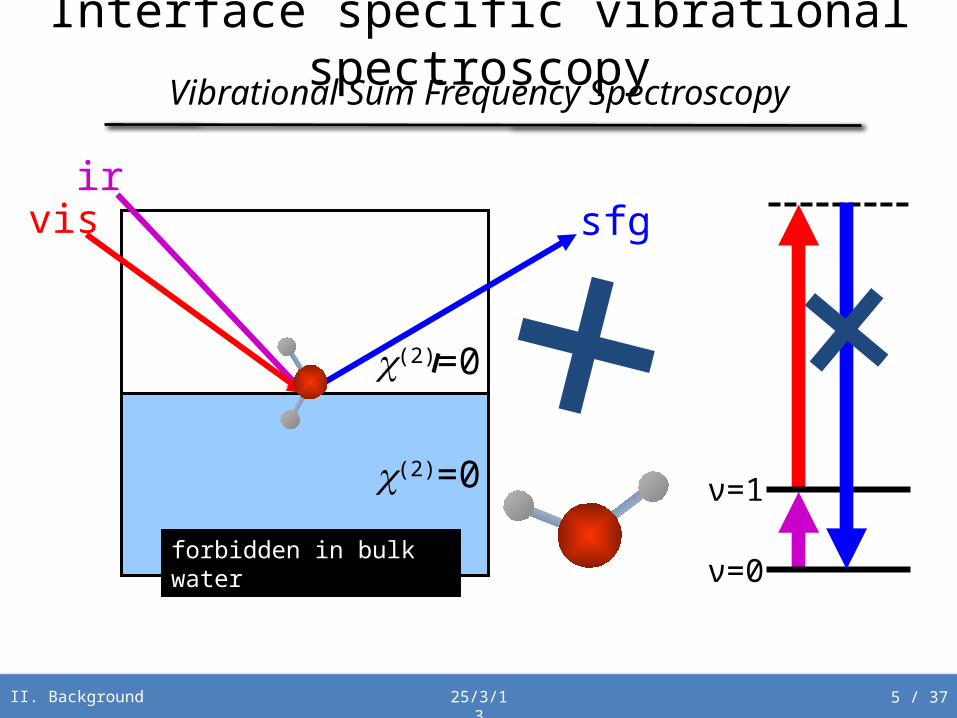
II. Background
Interface specific vibrational spectroscopyVibrational Sum Frequency Spectroscopy
irvis sfg
ν=0forbidden in bulk water
c(2)=0
c(2)=0 ν=1

6 / 3725/3/13
II. Background
What is detected?The field radiated by the second order induced
polarizationInduced polarization can be expanded in a Taylor series
Assuming two incident plane waves and just considering the second order term,

7 / 3725/3/13
Origin of Interfacial SpecificityEven order nonlinear susceptibilities
Second order nonlinear susceptibilities are third rank tensors
…Changing the sign of all indices is equivalent to inverting the axes: the material response must change sign…
But, with inversion symmetry, all directions are equivalent so…
For materials with inversion symmetry (χ(2)=0), inversion symmetry is always broken at interfaces.
II. Background
8 / 3725/3/13
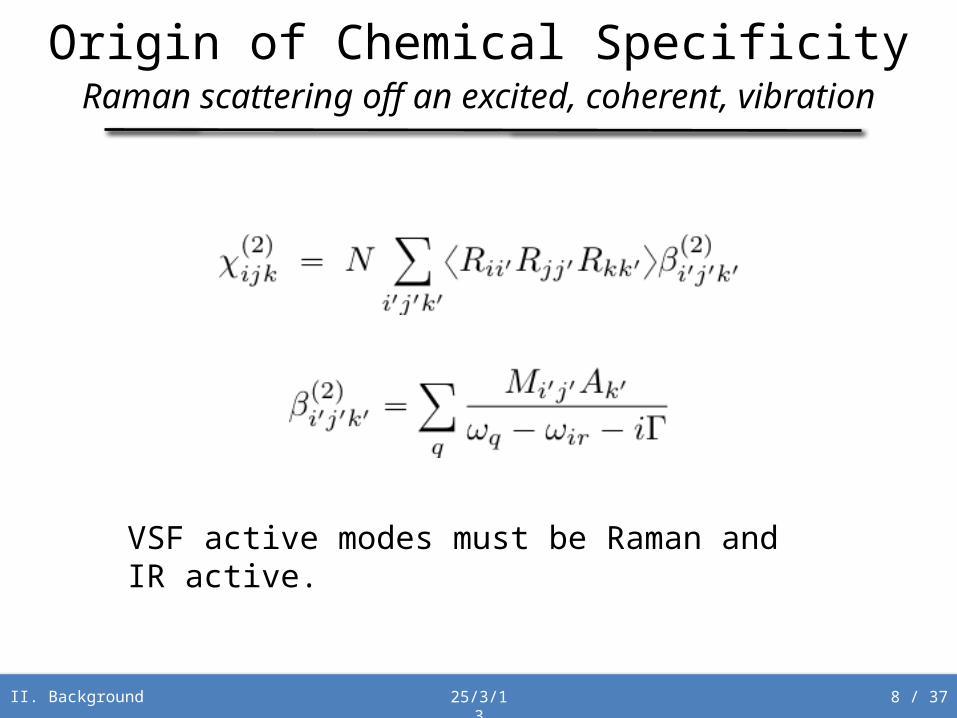
Origin of Chemical SpecificityRaman scattering off an excited, coherent, vibration
II. Background
VSF active modes must be Raman and IR active.
9 / 3725/3/13
III. Solvent to Interface: Structure
III. Approaching the Interface from the Solvent Side:
Interfacial Water Structure
10 / 3725/3/13
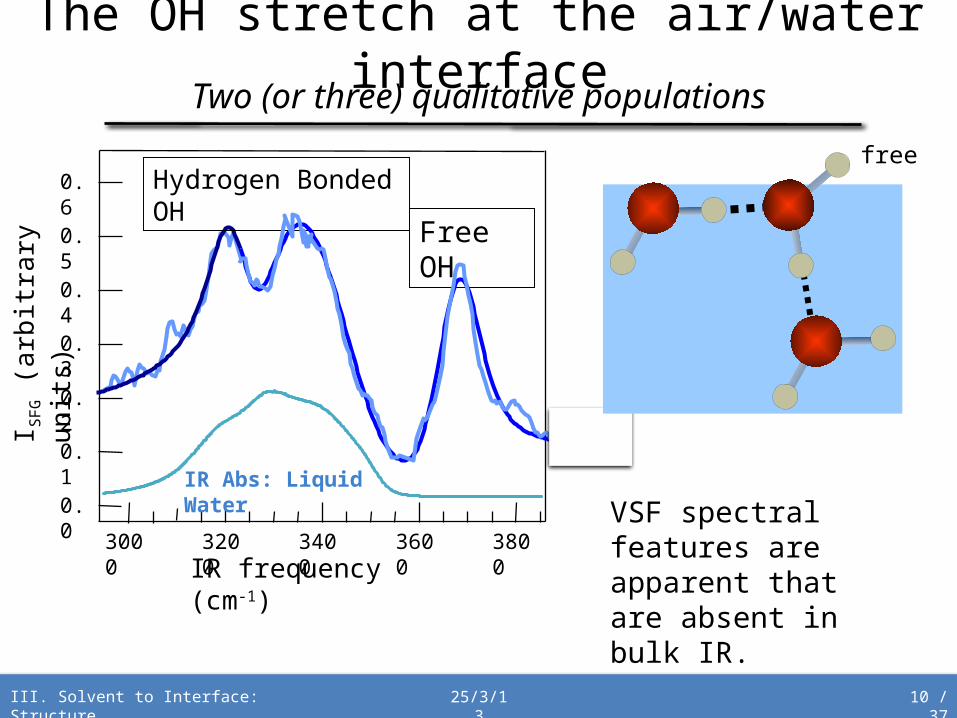
The OH stretch at the air/water interface
Two (or three) qualitative populations
Free OH
0.6
0.5
0.4
0.3
0.2
0.1
0.0
3800360034003200IR frequency (cm-1)
3000
IR Abs: Liquid Water
Hydrogen Bonded OH
I SFG (a
rbitr
ary
units
)
free
III. Solvent to Interface: Structure
VSF spectral features are apparent that are absent in bulk IR.

11 / 3725/3/13
III. Solvent to Interface: Structure
Is the double peaked feature general?Yes!
Double peaked feature appears at all interfaces
Kataoka,…, Cremer (2004) Langmuir, 20(5), 1662
Becraft and Richmond (2005) Journal of Physical Chemistry B, 109(11), 5108
12 / 3725/3/13
III. Solvent to Interface: Structure
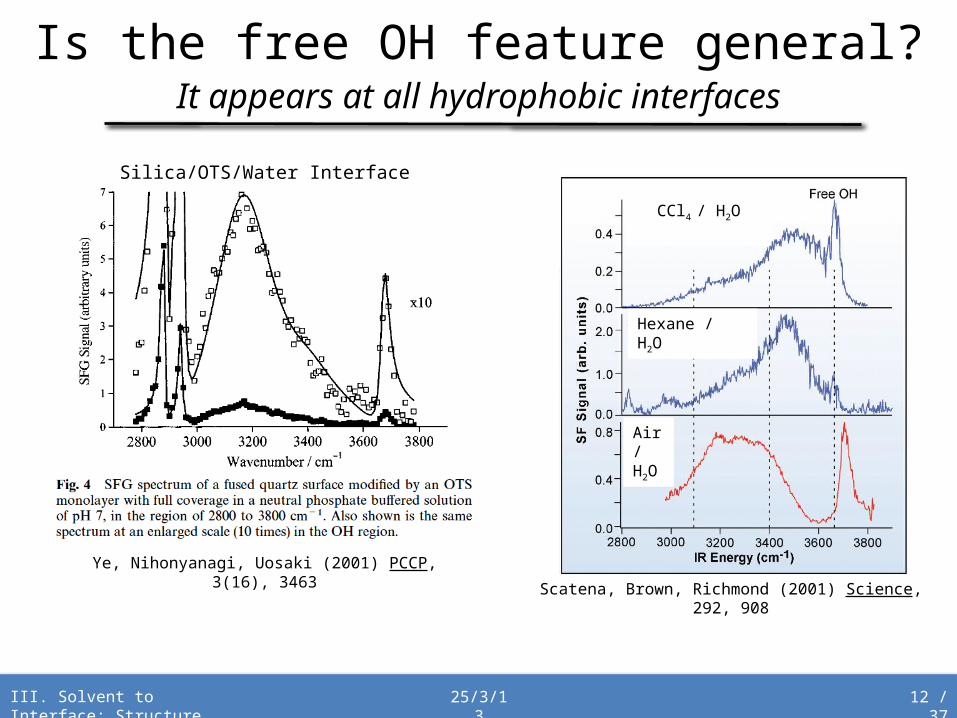
Is the free OH feature general?It appears at all hydrophobic interfaces
CCl4 / H2O
Hexane / H2O
Air/ H2O
Scatena, Brown, Richmond (2001) Science, 292, 908
Silica/OTS/Water Interface
Ye, Nihonyanagi, Uosaki (2001) PCCP, 3(16), 3463
13 / 3725/3/13
III. Solvent to Interface: Structure
0.6
0.5
0.4
0.3
0.2
0.1
0.0
3800360034003200IR frequency (cm-1)
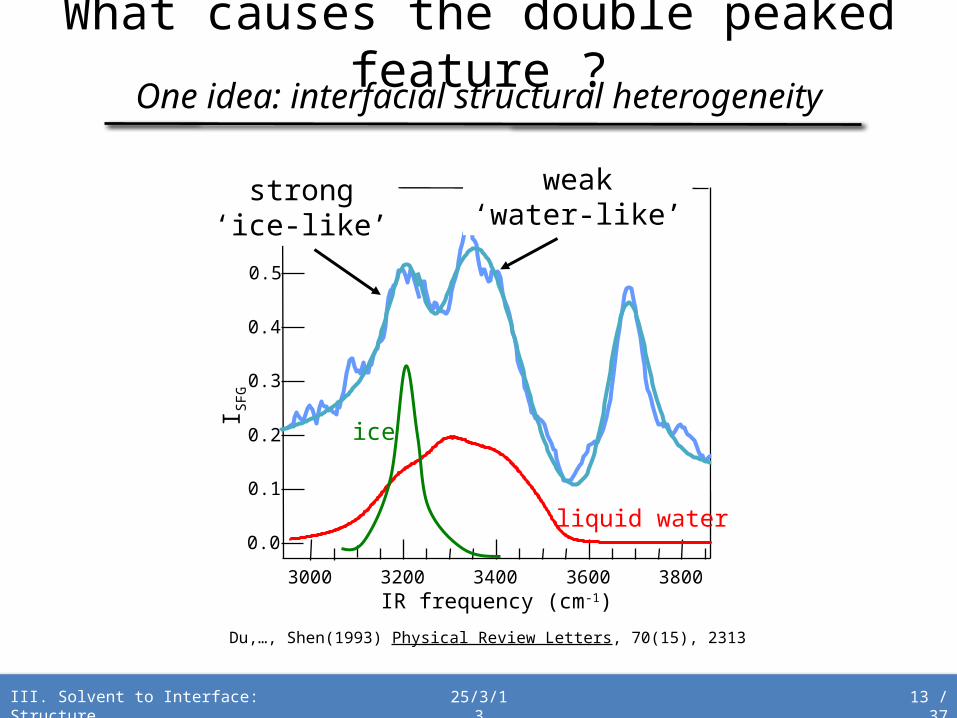
liquid water
3000
I SFG
Du,…, Shen(1993) Physical Review Letters, 70(15), 2313
ice
weak‘water-like’
strong‘ice-like’
What causes the double peaked feature ?
One idea: interfacial structural heterogeneity
14 / 3725/3/13
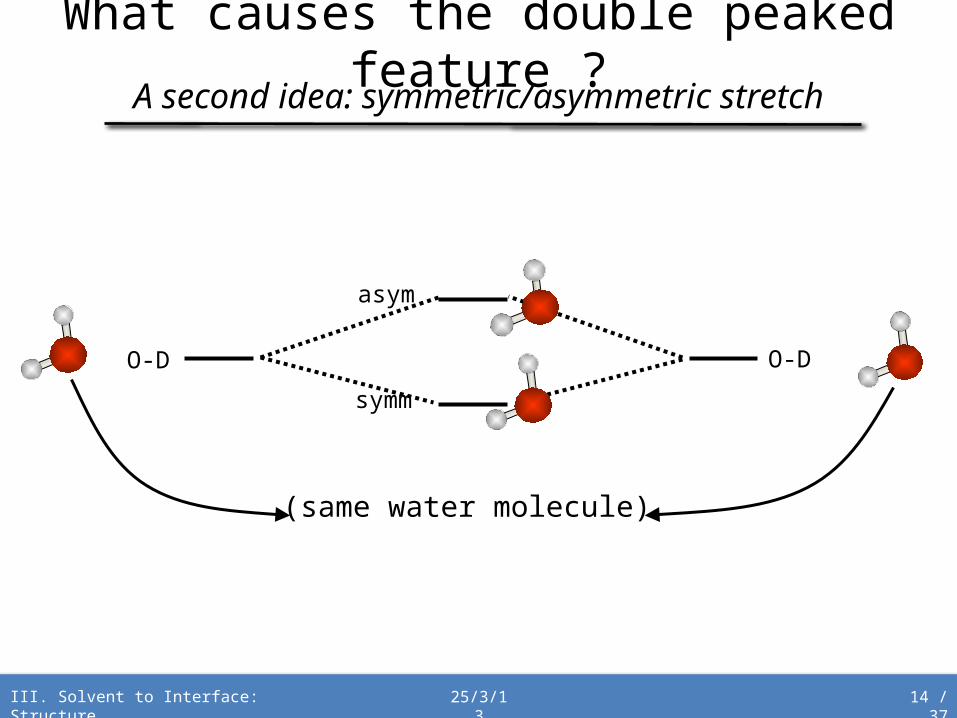
What causes the double peaked feature ?
A second idea: symmetric/asymmetric stretch
O-D O-D
asym
symm
(same water molecule)
III. Solvent to Interface: Structure

15 / 3725/3/13
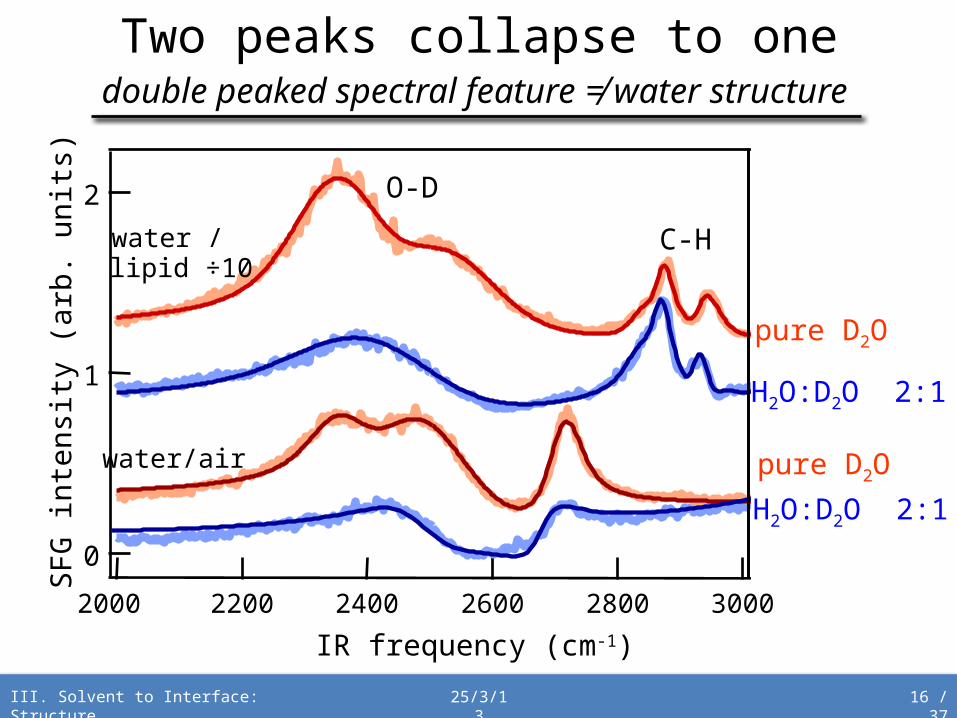
Two peaks should collapse to one
SSAS
Sym/Asym hypothesis
D2O
HDO
SS AS
StrongWeak
D2O
HDO
‘Ice/Liquid-like’ hypothesis
The amplitude of the whole spectrum should change.
How can we distinguish these scenarios experimentally
Isotopic dilution
III. Solvent to Interface: Structure
16 / 3725/3/13
Two peaks collapse to onedouble peaked spectral feature ≠ water structure
2
1
0
SFG
inte
nsi
ty (
arb
. unit
s)
3200300028002600240022002000
IR frequency (cm-1)
O-D
C-Hwater /lipid ÷10
water/air
H2O:D2O 2:1
pure D2O
H2O:D2O 2:1
pure D2O
III. Solvent to Interface: Structure
17 / 3725/3/13
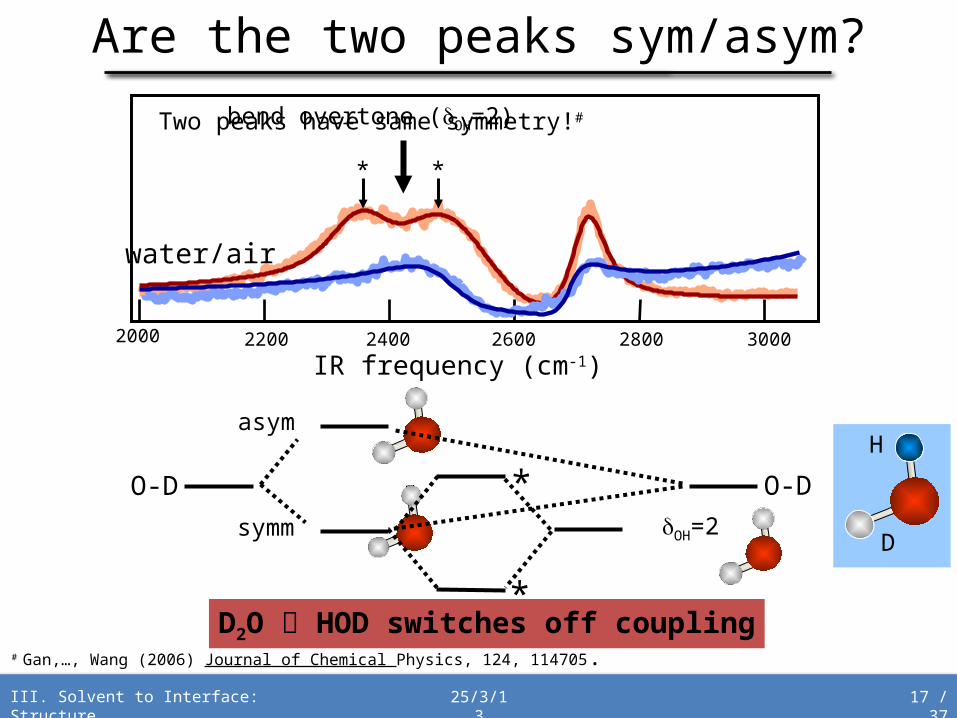
300028002600240022002000
IR frequency (cm-1)
water/air
bend overtone (dOH=2)
O-D O-D
asym
symm dOH=2
*
**
D2O HOD switches off coupling
H
D
*
Two peaks have same symmetry!#
# Gan,…, Wang (2006) Journal of Chemical Physics, 124, 114705.
Are the two peaks sym/asym?
III. Solvent to Interface: Structure

18 / 3725/3/13
freq
uenc
y
stretch mode DOS
coupling offcoupling on
Evanswindow
bend overtone (dOH=2)
300028002600240022002000IR frequency (cm-1)
water/air
bend overtone (dOH=2)
**
Hypothesis one: two peaks are from a Fermi Resonance with the Bend
Overtone
III. Solvent to Interface: Structure
19 / 3725/3/13
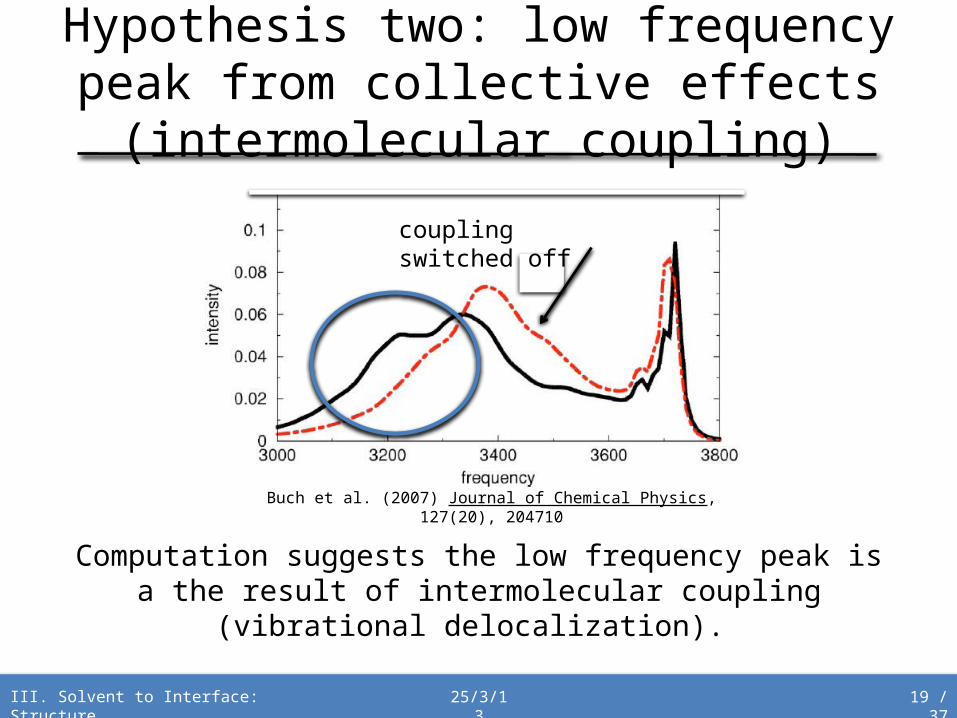
Hypothesis two: low frequency peak from collective effects (intermolecular
coupling)
III. Solvent to Interface: Structure
Buch et al. (2007) Journal of Chemical Physics, 127(20), 204710
coupling switched off
Computation suggests the low frequency peak is a the result of intermolecular coupling (vibrational
delocalization).
20 / 3725/3/13
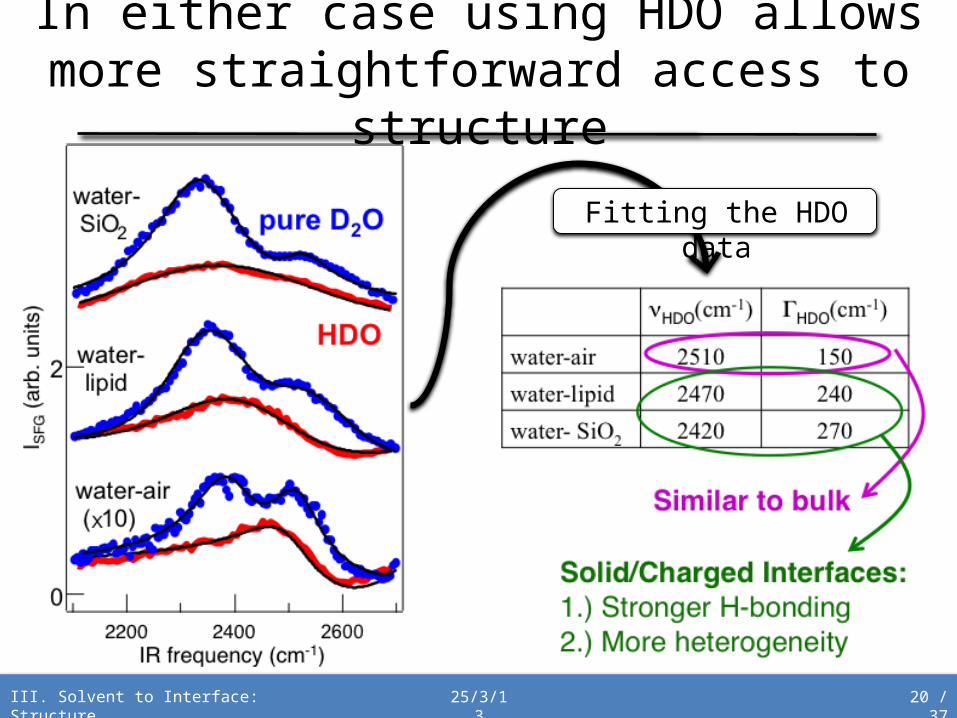
In either case using HDO allows more straightforward access to structure
Fitting the HDO data
III. Solvent to Interface: Structure

25/3/13
III. Solvent to Interface: Dynamics
III. Solvent to Interface: Dynamics
0.6
0.5
0.4
0.3
0.2
0.1
0.0
3800360034003200IR frequency (cm-1)
3000
IR Abs: Liquid Water
I SFG (a
rbitr
ary
units
)
free
Free OH
21 / 37

25/3/13
III. Solvent to Interface: Dynamics
Probing dynamics: IR pump – VSF Probe
IR (100 fs)
vis (100 fs)
SFG
v = 0
v = 1
IR pump (100 fs)
twait
• SFG signal decreases due to depletion of ground state.
• Recovery reflects vibrational relaxation and possibly reorientation.
wait
SFG
pump
22 / 37

25/3/13
III. Solvent to Interface: Dynamics
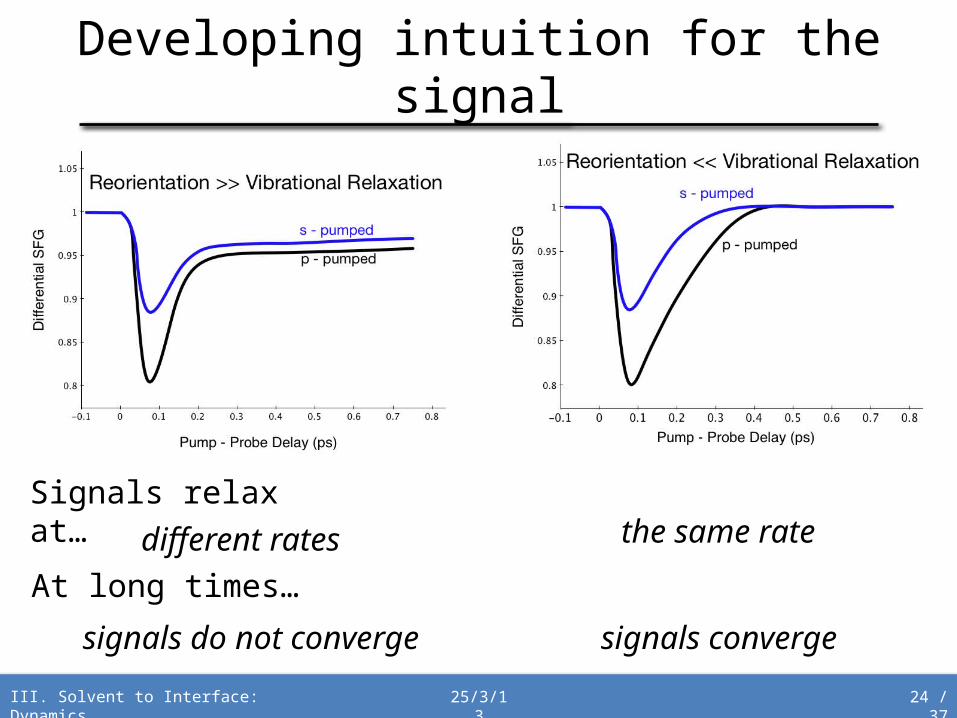
Probing reorientation of the free OH
23 / 37
25/3/13
III. Solvent to Interface: Dynamics
different rates the same rateSignals relax at…
At long times…
signals do not converge signals converge
Developing intuition for the signal
24 / 37

25/3/13
III. Solvent to Interface: Dynamics
Free OH relaxation is intermediate
τp, pump = 640 ± 20 fs
τs. pump = 870 ± 50 fs
25 / 37

25/3/13
III. Solvent to Interface: Dynamics
A brief simulation interlude
•Simulation box is 30*30*60 Å.•Periodic boundary conditions.•NVE at T = 300 K.•Simulation run for 2 ns (step = 1 fs).•SPC/E potential.
26 / 37
25/3/13
III. Solvent to Interface: Dynamics
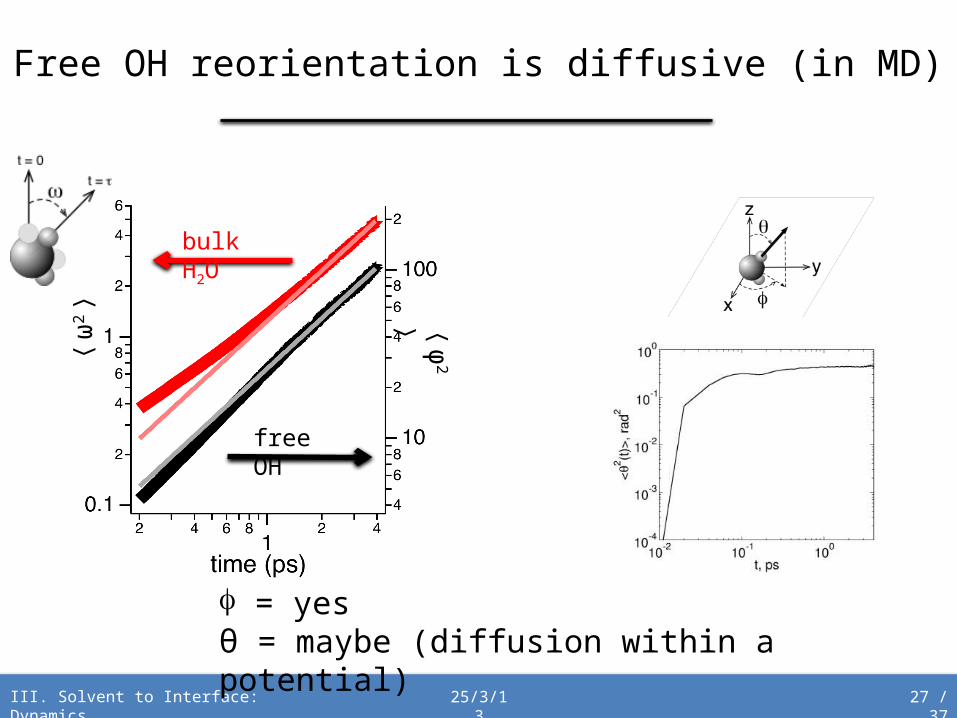
f = yesθ = maybe (diffusion within a potential)
〈ϕ
2
〉
free OH
bulk H2O
〈ω
2
〉Free OH reorientation is diffusive (in MD)
27 / 37
25/3/13
III. Solvent to Interface: Dynamics
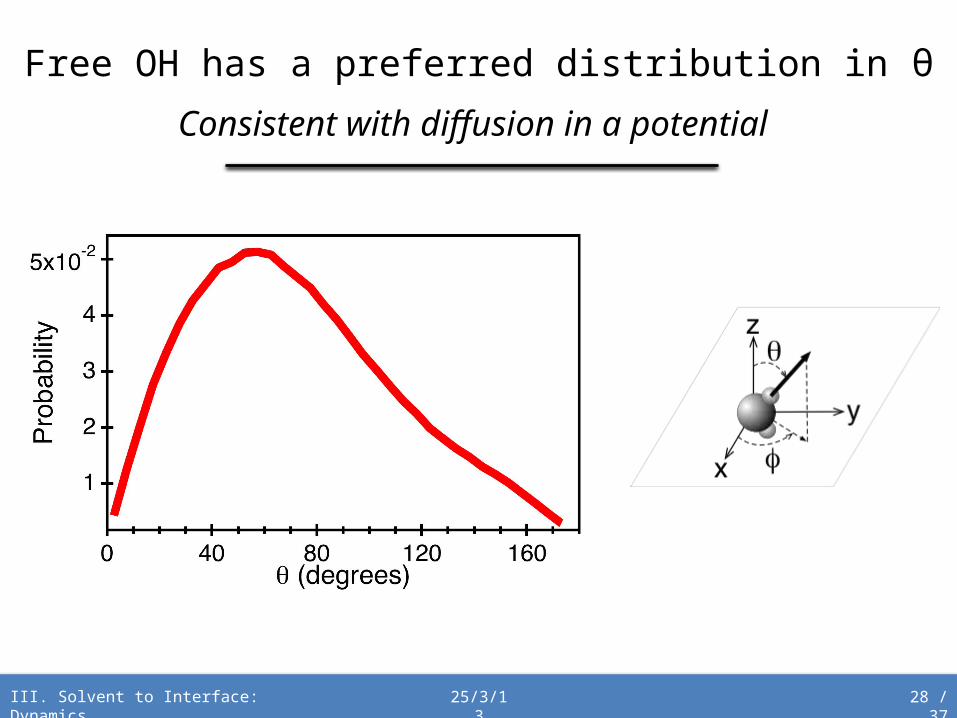
Consistent with diffusion in a potential
Free OH has a preferred distribution in θ
28 / 37
25/3/13
III. Solvent to Interface: Dynamics
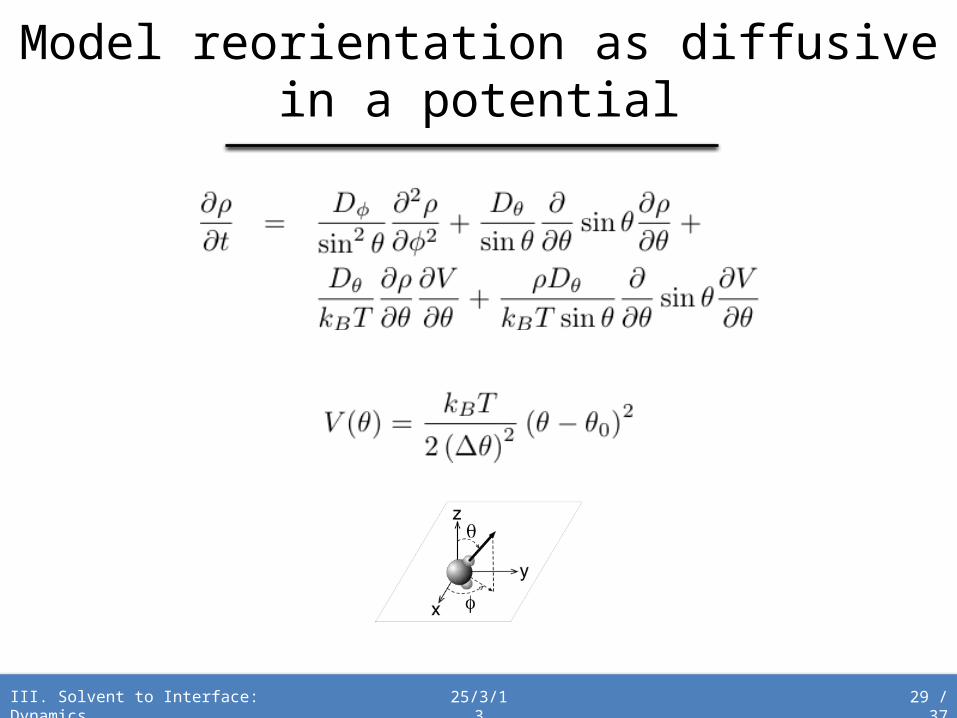
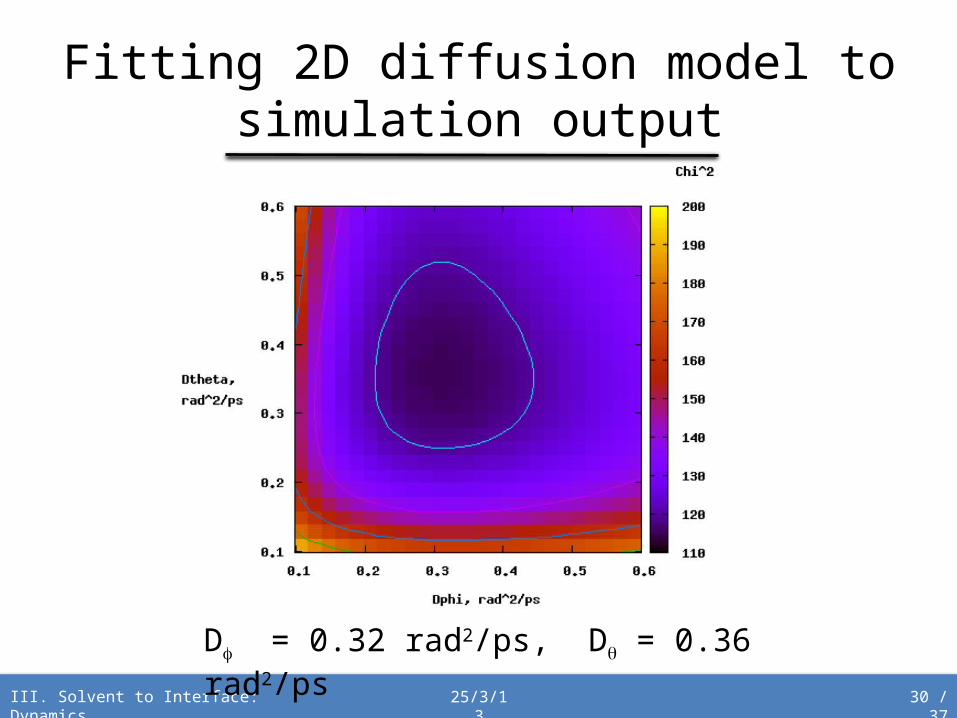
Model reorientation as diffusive in a potential
29 / 37
25/3/13
III. Solvent to Interface: Dynamics
Df = 0.32 rad2/ps, Dq = 0.36 rad2/ps
Fitting 2D diffusion model to simulation output
30 / 37

25/3/13
III. Solvent to Interface: Dynamics
MD results describe data without adjustable parameters
31 / 37

Bulk (arb orient)Dϕ = 0.1 rad2/ps
Dθ = 0.1 rad2/ps
Free OHDϕ = 0.32 rad2/ps
Dθ = 0.36 rad2/ps
On average, free OH reorient ≈ 3x faster than bulk
25/3/13
III. Solvent to Interface: Dynamics
Free OH reorientation relative to bulk
32 / 37
33 / 37IV. Solid to Interface
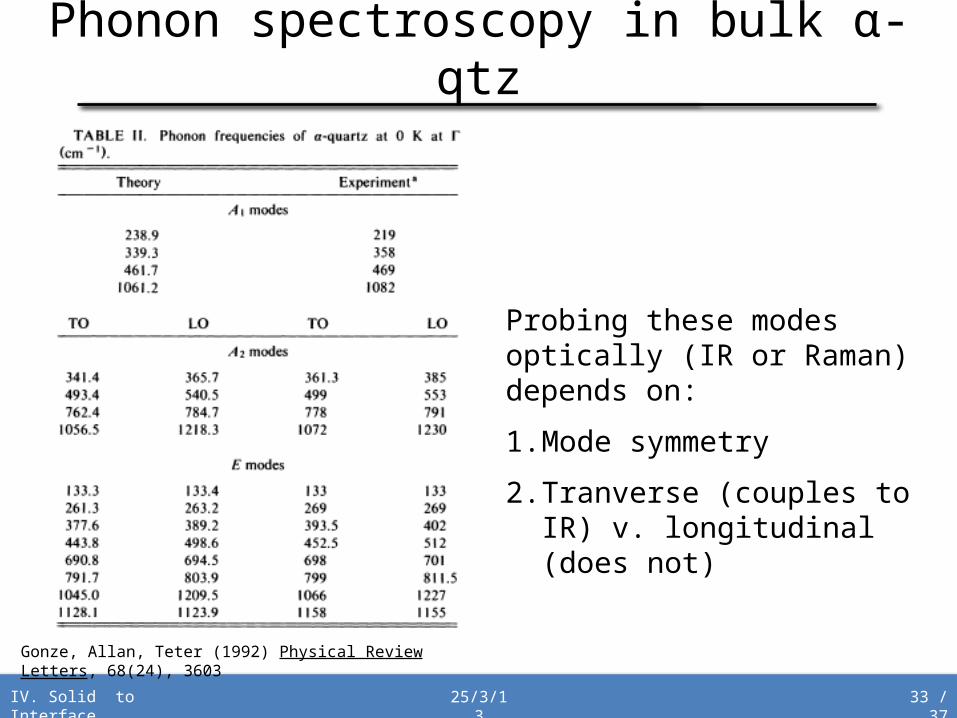
Phonon spectroscopy in bulk α-qtz
Gonze, Allan, Teter (1992) Physical Review Letters, 68(24), 3603
Probing these modes optically (IR or Raman) depends on:
1. Mode symmetry
2. Tranverse (couples to IR) v. longitudinal (does not)
25/3/13

34 / 3725/3/13
VSF probes both IR and Raman active transverse optical phonons: a simplified phonon spectrum that reflects bulk
symmetry.
VSF phonon spectroscopy in bulk α-qtz
Liu and Shen (2008) Physical Review B, 78(2), 024302
IV. Solid to Interface
795 cm-
1
1064 cm-1 1160 cm-1
35 / 3725/3/13
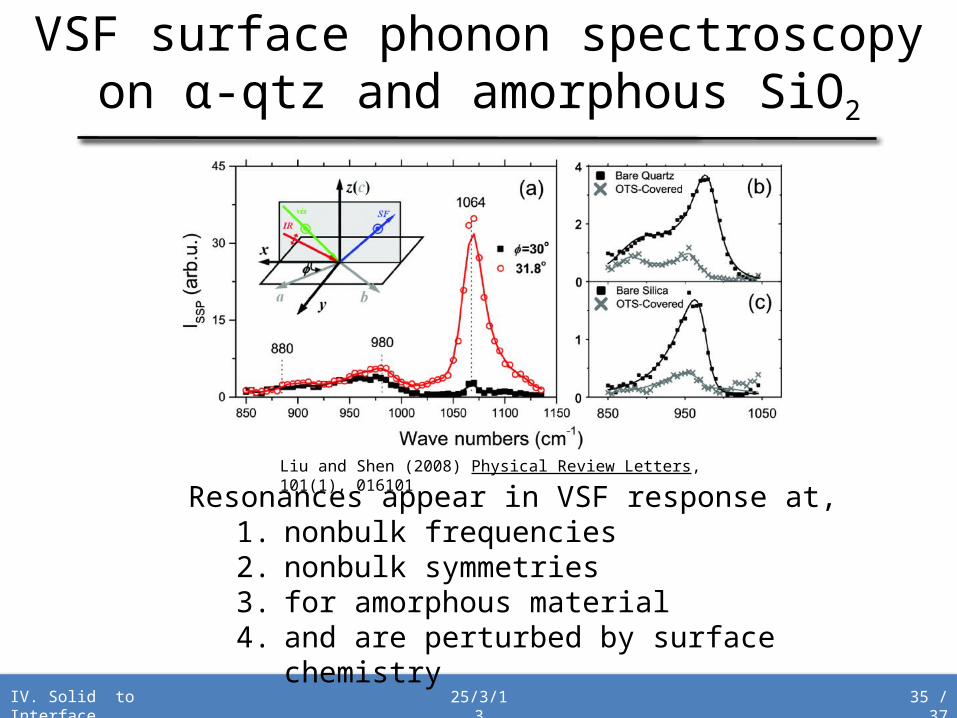
VSF surface phonon spectroscopy on α-qtz and amorphous SiO2
IV. Solid to Interface
Resonances appear in VSF response at,1. nonbulk frequencies2. nonbulk symmetries3. for amorphous material4. and are perturbed by surface
chemistry
Liu and Shen (2008) Physical Review Letters, 101(1), 016101

36 / 3725/3/13
IV. Solid to Interface
VSF surface phonon spectroscopy on α-qtz for tracking surface
reconstruction
wavenumber (cm-1)
after being baked at 100°C
rehydroxylated in ambient air
after being baked at 500°C
rehydroxylated in ambient air
rehydroxylated in boiling water
Si
Si
O
Si
OH
Liu and Shen (2008) Physical Review Letters, 101(1), 016101
Si
OH2
Si
Si
OH2O+
surface damage
= quartz= amorphous silica
+
Conclusions
37 / 3725/3/13
Conclusions
1. Using VSF spectroscopy one can probe both interfacial solvent (most work on water) and surface phonons at buried interfaces.
2. Adding additional pulses to VSF experiments makes it possible to probe structural and energy relaxation dynamics with interfacial specificity.
3. Future work: optically probing the association of interfacial molecules with particular surface sites.
Related Publications (from our previous work the results of which were discussed above)
1. Sovago, Campen, Wurpel, Müller, Bakker, Bonn (2008) Vibrational Response of Hydrogen-Bonded Interfacial Water is Dominated by Interfacial Coupling, Physical Review Letters, 100, 173901
2. Sovago, Campen, Bakker, Bonn (2009) Hydrogen bonding strength of interfacial water determined with surface sum-frequency generation, Chemical Physics Letters, 470, 7
3. Hsieh, Campen, Vila Verde, Bolhuis, Nienhuys, Bonn (2011) Ultrafast Reorientation of Dangling OH Groups at the Air-Water Interface Using Femtosecond Vibrational Spectroscopy, Physical Review Letters, 107(11), 116102
4. Vila Verde, Bolhuis, Campen (2012) Statics and Dynamics of Free and Hydrogen-Bonded OH Groups at the Air/Water Interface, Journal of Physical Chemistry B, 116(31), 9467
bonus page25/3/13