Liquid Waste Management Plan: Stage 2 - 3 Report
170
This report is prepared for the sole use of the District of Squamish. No representations of any kind are made by Urban Systems Ltd. or its employees to any party with whom Urban Systems Ltd. does not have a contract. Copyright 2015. January 2015 Liquid Waste Management Plan: Stage 2 - 3 Report District of Squamish File: 1928.0005.01
Transcript of Liquid Waste Management Plan: Stage 2 - 3 Report

This report is prepared for the sole use of the District of Squamish. No representations of any kind are made by Urban Systems Ltd. or its employees to any party with whom Urban Systems Ltd. does not have a contract. Copyright 2015.
January 2015
Liquid Waste Management Plan: Stage 2 - 3 Report District of Squamish
File: 1928.0005.01

ii | P a g e
Executive Summary The District of Squamish (the District) has developed this liquid waste management plan (LWMP) to guide the District over a 20-year horizon for addressing sanitary sewerage and other liquid waste issues. An LWMP is typically developed over three stages; a Stage 1 report was approved by the Ministry of Environment in September 2013 and this report summarizes Stages 2 and 3 of the process. This report includes the evaluation of liquid waste management options identified in Stage 1, states the preferred direction for liquid waste management in Squamish, and outlines how the LWMP will be implemented over the next twenty years.
The programs and plans that have been recommended to address priority liquid waste issues in Squamish, and their capital and annual costs to develop and implement over the next 20 years, is summarized below:
Enhanced Biosolids Program (no additional costs to create an agreement; $550,000 for capital contingency)
Develop a long-term agreement (e.g. partnership) with Whistler for receiving biosolids from the District to address concerns related to tipping fees, long-term security and overall handling of biosolids.
Only revisit biosolids management options and determine a District-led program if a mutually beneficial partnership does not materialize with Whistler.
Reconsider the feasibility of a neighbourhood energy utility as new developments are approved in the downtown core and upon direction from District Council because the need for the utility is directly related to the types of new energy facilities developed (e.g. new industry in the downtown/port area).
Conduct a business case to optimize biosolids dewatering and hauling e.g. to reduce costs of trucking to alleviate the footprint of the regional program, where possible.
Proceed with the WWTP-Plan including process changes to biosolids (including adding digestion) as a means to regulate the product and reduce odours.
Initiate biosolids quality monitoring (started in 2014) as part of the agreement with Whistler.
Any future capital or operating costs arising at the Whistler facility to be borne by Squamish to accommodate its biosolids (as determined within the agreement) are not known at this time therefore a contingency has been included in the 20 year cost projections.
Leachate Management Plan (no additional costs)
Continue the annual leachate monitoring program at the landfill (ongoing) to characterize the ongoing and long-term effects at the WWTP.

P a g e | iii
Wastewater Treatment Plant - Plan ($12,303,000 for both capital and operating costs)
Design and construct an ultraviolet disinfection system to disinfect sewage effluent based on the results of the Environmental Impact Study on the Squamish River and based on feedback from the Ministry of Environment.
Convert the older bio-reactor to Moving Bed Bioreactor (MBBR) to increase the capacity of the WWTP to achieve compliance with redundancy requirements of the Municipal Wastewater Regulation.
Convert the newer bio-reactor to MBBR to increase the capacity of the WWTP to increase capacity and accommodate growth at lowest net-present value cost.
Design and construct an anaerobic digester (or alternative technology that passes a District business case) to increase the capacity of the WWTP to reduce odours and to recover heat energy for use at the WWTP.
Monitor and report on potential odour issues to define the issue for future improvements and to support communications to local residents.
Implement odour control measures as needed based on monitoring program.
Integrated Stormwater Management Planning ($2,100,000)
Prepare for integrated stormwater management planning in Squamish based on the objective of the LWMP to safeguard the environment from stormwater and sanitary sources.
Develop ISMPs for priority catchments to improve stormwater quality entering watercourses to define risks to environment throughout the District and develop watershed-specific tactics to improve water quality.
Flow Reduction Program: Inflow and Infiltration and Indoor Water Conservation ($2,125,000)
Assess sewer pipe conditions in an ongoing manner to keep pace with renewal and to decrease risk of failure and surfacing of sanitary waste.
Commission flow monitoring stations to monitor for inflow and infiltration as well as to improve flow projects for utility management and finance.
Monitor and report on flow reduction efforts.
Target indoor water conservation to reduce excess water consumption and extend capacity at the WWTP.

iv | P a g e
Source Control Program ($640,000)
Follow the current source control program for approximately 3 years and review effectiveness with respect to program objectives.
Update the Sewer Use Bylaw (concurrently with biosolids/leachate review) based on concerns that the 15 year old Bylaw is not congruent with current sewer utility management practices.
Transition to a more comprehensive program based on the varied and broad nature of source control issues following the review in 3 years of the existing program.
The total cost to develop and implement the programs and plans of the LWMP as laid out above is estimated at $17.17 million over 20 years. However, some programs listed above (approximately $0.88 million) are already an annual budget item (e.g. Source Control Program) therefore the net LWMP costs as it relates to LWMP financing is $16.29 million over 20 years. Overall, the costs for these programs and plans will be recovered through a combination of general tax revenues, utility fees, and development cost charges.

P a g e | v
Contents Executive Summary ...................................................................................................................................... ii
1.0 LIQUID WASTE MANAGEMENT PLAN OVERVIEW ..................................................................................... 1
1.1 Liquid Waste Management Planning in Squamish ....................................................................... 1
1.2 Goals and Objectives .................................................................................................................... 1
1.3 Community Participation ............................................................................................................... 2
1.4 Stage 1 Issues, Opportunities and Options .................................................................................. 2
1.5 Priorities and Principles to Guide Stages 2 and 3......................................................................... 3
2.0 QUALITATIVE EVALUATION OF OPTIONS ................................................................................................ 4
2.1 Triple Bottom Line Evaluation and Prioritization ........................................................................... 4
2.2 Opportunities for Synergies ........................................................................................................... 5
3.0 ENHANCED BIOSOLIDS PROGRAM ......................................................................................................... 7
3.1 Issues and Opportunities with Current Program ........................................................................... 7
3.1.1 External Partnerships ................................................................................................................ 7
3.1.2 Trucking Product to and from Whistler ...................................................................................... 7
3.1.3 Costs to the District ................................................................................................................... 8
3.2 Product Quality and Applications .................................................................................................. 9
3.2.1 Introduction to the OMRR ......................................................................................................... 9
3.2.2 Quality Requirements ................................................................................................................ 9
3.2.3 Process Requirements ............................................................................................................ 10
3.2.4 Use Requirements................................................................................................................... 11
3.2.5 Regulatory Framework for Industrial Uses .............................................................................. 11
3.3 Biosolids Management Options .................................................................................................. 12
3.3.1 Introduction .............................................................................................................................. 12
3.3.2 Disposal to Landfill .................................................................................................................. 12
3.3.3 Use as an Energy Source ....................................................................................................... 13
3.3.4 Land Application for the Growth of Plants ............................................................................... 14
3.4 Discussion ................................................................................................................................... 15
3.5 Preferred Direction and Action Items .......................................................................................... 16
4.0 WASTEWATER TREATMENT PLANT - PLAN........................................................................................... 18
4.1 Goals and Objectives .................................................................................................................. 18
4.2 Key Considerations ..................................................................................................................... 18

vi | P a g e
4.3 Effluent Quality Requirements .................................................................................................... 18
4.3.1 Outfall Assessment ................................................................................................................. 18
4.3.2 Environmental Impact Study ................................................................................................... 20
4.4 Overview of the WWTP - Plan .................................................................................................... 21
4.5 Growth and Flows ....................................................................................................................... 21
4.5.1 Population ............................................................................................................................... 22
4.5.2 Inflow and Infiltration ............................................................................................................... 22
4.5.3 Flow Projections ...................................................................................................................... 22
4.6 Unit Process Capacities .............................................................................................................. 22
4.6.1 Source of Sizing Criteria ......................................................................................................... 23
4.6.2 The Municipal Wastewater Regulation.................................................................................... 24
4.6.3 Discussion of Redundancy Provisions .................................................................................... 26
4.6.4 Options for Meeting Redundancy Provisions .......................................................................... 27
4.6.5 Other Plant Processes ............................................................................................................ 28
4.6.6 The Impacts of Process Modification ...................................................................................... 32
4.6.7 Overall Plant Capacity Upgrade Approaches ......................................................................... 32
4.7 Options for Disinfection ............................................................................................................... 33
4.7.1 Option #1: Chlorination with Chlorine Gas .............................................................................. 34
4.7.2 Option #2: Chlorination with Sodium Hypochlorite .................................................................. 36
4.7.3 Option #3: Ultraviolet Treatment ............................................................................................. 37
4.7.4 Life Cycle Cost Comparison .................................................................................................... 38
4.7.5 Preferred Approach for Plant Upgrades .................................................................................. 39
4.8 Leachate Management ............................................................................................................... 40
4.8.1 Flows ....................................................................................................................................... 40
4.8.2 Quality ..................................................................................................................................... 40
4.8.3 Discussion ............................................................................................................................... 41
4.8.4 Preferred Direction and Action Items ...................................................................................... 42
4.9 Reclaimed Water Use ................................................................................................................. 43
4.9.1 Reclaimed Water Discussion .................................................................................................. 45
4.10 Odour Control .............................................................................................................................. 45
4.10.1 Overview ............................................................................................................................. 45
4.10.2 Preferred Direction and Action Items .................................................................................. 46
4.11 Summary of WWTP - Plan and Cost Recovery .......................................................................... 47

P a g e | vii
5.0 PROGRAM COMMITMENTS .................................................................................................................. 50
5.1 Integrated Stormwater Management Plan .................................................................................. 50
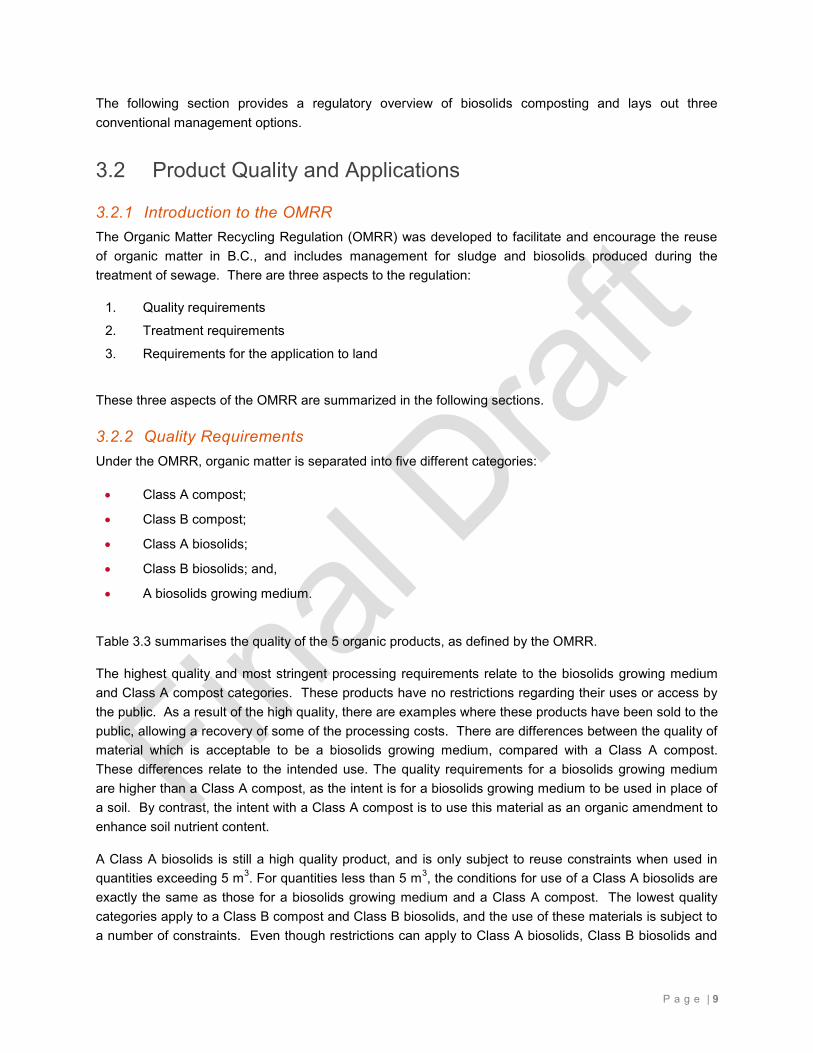
5.1.1 Overview ................................................................................................................................. 50
5.1.2 Moving Towards Integrated Stormwater Management Planning ............................................ 52
5.1.3 Priority Catchments and Watersheds...................................................................................... 52
5.1.4 Action Items ............................................................................................................................. 54
5.1.5 Funding Requirements and Cost Recovery ............................................................................ 57
5.2 Flow Reduction Program: Inflow and Infiltration and Indoor Water Conservation ...................... 58
5.2.1 Overview ................................................................................................................................. 58
5.2.2 Action Items ............................................................................................................................. 59
5.2.3 Funding Requirements and Cost Recovery ............................................................................ 60
5.3 Source Control Program ............................................................................................................. 61
5.3.1 Overview ................................................................................................................................. 61
5.3.2 Moving Towards a More Comprehensive Program ................................................................ 62
5.3.3 Action Items ............................................................................................................................. 63
5.3.4 Funding Requirements and Cost Recovery ............................................................................ 63
6.0 LIQUID WASTE MANAGEMENT PLAN SUMMARY AND COSTS ................................................................ 65
6.1 Managing Costs and Service Levels ........................................................................................... 65
6.2 Summary of Costs ....................................................................................................................... 65
6.3 Cost Recovery Summary ............................................................................................................ 67
Appendix A: Consultation Materials
Appendix B: Class D Cost Estimates
Appendix C: Additional LWMP Reporting


P a g e | 1
1.0 LIQUID WASTE MANAGEMENT PLAN OVERVIEW
1.1 Liquid Waste Management Planning in Squamish Completing a liquid waste management plan (LWMP) will guide the District over a 20-year horizon for addressing sanitary sewerage and other liquid waste issues.
A LWMP is comprised of three stages, which can broadly be summarized as follows:
Stage 1 Discuss principles and vision for the community
Identify local issues and opportunities
Create a list of possible liquid waste management options
Stage 2 Complete a technical evaluation of the possible options
Evaluate the costs and benefits of the possible options
Identify the preferred direction
Stage 3 Outline how the plan will be implemented
Summarize funding requirements
Formally adopt the LWMP as a Bylaw
Stage 1 of this LWMP was formally approved by the Ministry of the Environment on September 20, 2013. At that time, the District was also granted approval to combine the reporting for Stages 2 and 3 of the LWMP. As such, this report presents the evaluation that was completed for the preliminary liquid waste management options, the preferred direction for liquid waste management in Squamish, and how the LWMP will be implemented over the next twenty years.
1.2 Goals and Objectives A LWMP enables a community to create the vision and road map for systematic improvement of its watershed, through sanitary and urban runoff programs. The two primary objectives of a LWMP are to consult the public and to protect the environment.
Driven by these primary objectives, the LWMP enables the District to:
Accommodate significant growth while simultaneously becoming a leader among British Columbia municipalities in the area of wastewater treatment and environmental responsibility.
Create a long-term plan for wastewater treatment that respects the standards in the Municipal Wastewater Regulation (MWR).

2 | P a g e
Demonstrate fiscal responsibility by integrating the LWMP with the District’s goals for asset management.
Pursue feasible opportunities for waste-to-resource programs.
Involve the public and affected stakeholders in the process to achieve support for local liquid waste management initiatives.
This LWMP will guide the District through the next twenty years for providing services for sanitary and urban runoff issues.
1.3 Community Participation As previously mentioned, one of the primary objectives of a LWMP is to consult the public. While it is a requirement, it is also in a local government’s interest to consult the broader community in order for the LWMP to truly reflect local issues and opportunities and the preferred options to address them.
The District has engaged the public from the beginning of the LWMP process through two primary means: first, by establishing a combined Local and Technical Advisory Committee (referred to as “the Committee”) and also by consulting the broader community at public Open Houses. Furthermore, both the Committee and the public were invited to participate in surveys aimed at seeking input on specific LWMP issues. A tabulated summary of how the District encouraged public participation and incorporated local input into the LWMP process and outcomes (along with sample materials from the events) is provided in Appendix A: Consultation Materials.
Generally, the public and combined Committee support the objectives of this plan.
1.4 Stage 1 Issues, Opportunities and Options Stage 1 of the LWMP focused on identifying local issues and opportunities related to the following:
Collection: Issues and opportunities related to quality and quantity of wastewater, as well as infrastructure and growth.
Treatment: Issues and opportunities related to treatment standards, quality and quantity risks, and receiving water conditions.
Biosolids: Issues and opportunities related to biosolids and compost quality, trucking, and market demands for the finished product.
Stormwater: Issues and opportunities related to urban runoff, sources of pollutants, high-level considerations for growth, and sensitive environmental areas.
Community growth and planning: Considerations for the LWMP from Service Squamish, the Official Community Plan (OCP), and the Growth Management Strategy (GMS), and issues related to growth and land use changes.
To address these issues and opportunities, a list of potential liquid waste management options was identified by District staff and the Committee, with input invited from the local community. These options included:

P a g e | 3
Enhanced Biosolids Program
Wastewater Treatment Plant - Plan
Reduce Sanitary Flows: Inflow and Infiltration and Water Use
Source Control: Influent Quality Leadership
Leachate Optimization/Management
Reclaimed Water: Feasibility Check
Integrated Stormwater Management Plan (ISMP)
A detailed description of the issues and potential options for each of the above is provided in the LWMP Stage 1 Report.
1.5 Priorities and Principles to Guide Stages 2 and 3 Establishing priorities and principles for liquid waste management in Squamish is fundamental to providing direction for the LWMP and the preferred programs and projects which comprise it. Through consultation with the Committee and the community, the highest priority topics in Squamish were identified as:
Reducing I&I and improving accuracy of flow estimates
Growth estimates: the impacts and costs of growth and the reliability of population projections
Disinfection options for treated effluent
Reducing trucking of biosolids and selecting the highest-use of the product
Protecting streams and preserving fish habitat by: reducing pollutants in urban runoff, creating comprehensive inventories of flows and infrastructure, and elevating investments into environmental improvements.
Equal to establishing priorities is applying principles in order to develop solutions that address the issues in a way that resonates with the community. The Committee established such principles, which included:
Protect and enhance ecosystem limits
Monitor system performance
Apply source control solutions
Evaluate costs and benefits to make decisions over the long-term
Plan infrastructure for long-term economic and environmental health
Foster a culture of learning for this generation and the next
These priorities and principles shape the relative level of investment toward evaluation in Stages 2 and 3. By coupling local priorities and principles with technical evaluation, the resulting programs and projects of the LWMP will reflect the unique issues, opportunities, and best liquid waste management options for Squamish.

4 | P a g e
2.0 QUALITATIVE EVALUATION OF OPTIONS
2.1 Triple Bottom Line Evaluation and Prioritization As a first step in the process of assessing the list of potential options for liquid waste management (from the Stage 1 outcomes), a qualitative evaluation was completed for each of the options. This evaluation was completed through a “triple bottom line” lens, whereby the environmental, social and economic benefits and impacts of each option were considered. Coupled with the priorities and principles discussed in Section 1.5, this qualitative evaluation further shaped the relative investment (of time and discussion) toward evaluation of the different management options. It also allowed for the consideration of synergies between programs, as discussed in Section 2.2.
Table 2.1 below summarizes the qualitative triple bottom line evaluation that was completed for the various management options. It also shows which management options align most strongly with the Committee’s priorities and principles for liquid waste management.
Table 2-1 - Qualitative impacts, benefits and considerations of liquid waste management options
Management Option
Qualitative Impacts, Benefits and Considerations Alignment with Priorities and
Principles Environmental Social Economic
WWTP - Plan High benefit to public and environmental health
Low impact
High benefit to recreational value of Squamish River and Howe Sound
Capital and annual costs associated with upgrades
Potential for savings
High
Reduce Sanitary Flows: I&I and Water Use
High benefit Requires public cooperation
Public education
Relatively low cost
Potential for savings at WWTP
Enhanced Biosolids Program
Moderate benefit Requires market for applications
Capital and annual costs associated with upgrades
Potential for savings
Integrated Stormwater Management Plan
High benefit High benefit
Public education
Costs can be scaled
Cost to conduct study and resulting programs, projects
Source Control Program
Moderate benefit Requires public cooperation
Public education
External relationship
Costs can be scaled
High potential for savings at WWTP

P a g e | 5
Management Option
Qualitative Impacts, Benefits and Considerations Alignment with Priorities and
Principles Environmental Social Economic
Leachate Management
Moderate benefit Low impact Capital and annual costs associated with pre-treatment
Potential for savings at WWTP
Low
Reclaimed Water – Feasibility Check
Low to Moderate benefit
Requires market for re-use applications
Capital and annual costs associated with infrastructure
Potential for savings at WWTP
In addition to the economic considerations outlined in this table, it should be noted that dedicated annual funding will be required for all of the liquid waste management options. Particularly for flow reduction, source control, and the ISMP’s, this may represent a shift in funding from one-time, short-term projects to ongoing program based costs.
As shown in Table 2.1, the WWTP - Plan, Flow Reduction, Enhanced Biosolids Program, ISMP, and Source Control Program align most strongly with the Committee’s priorities and principles. These management options will also likely yield the highest environmental, social and economic benefits based on their scope. Therefore, the focus of this LWMP is on the evaluation of these liquid waste management options; synergies between these “primary” management options and the remaining options are explored in the following section.
2.2 Opportunities for Synergies The preliminary list of management options from Stage 1 was developed without consideration for their reach; the objective at that time was only to identify possible solutions for further evaluation in Stages 2 and 3. As shown in Section 2.1, the management options that will likely result in the highest benefit and most strongly align with the priorities and principles will be considered further and technically evaluated in detail. Considering opportunities for synergies between these and the remaining options means that the District can capitalize on its efforts, resulting in further reach across programs and plans.
Opportunities for synergies between the various liquid waste management options are shown in Figure 2.1 below. The size of the circles represents the relative level of investment in the evaluation of each of the options in this LWMP.

6 | P a g e
Figure 2.1 Opportunities for synergies across liquid waste management options
As shown in Figure 2.1, the WWTP - Plan has synergies with almost all of the other options: its scope and reach are considerable and it is therefore a significant focus of this LWMP. Reclaimed water and leachate minimization will be considered as part of the WWTP - Plan, as will sanitary flows and I&I. Based on the issues identified in Stage 1, commitments to reduce sanitary flows and I&I are also explored. The ISMP will also address some of the issues with flows (particularly I&I). Commitments to source control are evaluated, and the reach of these efforts will be expanded by the ISMP, with benefits to the WWTP - Plan.
The Enhanced Biosolids Program relates to the WWTP - Plan in that treatment required for biosolids processing in Squamish should be considered. For this reason, the evaluation of this option is presented first in Section 3.0, and is followed by the WWTP - Plan (Section 4.0) and then Program Commitments (Section 5.0).
WWTP - Plan
Leachate Management
ISMP
Reclaimed Water
Enhanced Biosolids Program
Flow Reduction:
I&I and Water Use
Source Control

P a g e | 7
3.0 ENHANCED BIOSOLIDS PROGRAM Biosolids are a by-product of sanitary sewage treatment. Typically, treated liquid waste is dewatered into sludge, after which it is pasteurized to reduce pathogens. This material may then undergo stabilization to generate a product that is suitable for a variety of applications as a fertilizer or compost. The treated product is known as biosolids.
In Stage 1 of the LWMP, reducing trucking of sludge and finding local reuse applications for biosolids were identified as topics for further evaluation. This is due to the financial and environmental cost of the current biosolids handling process, which involves trucking dewatered sludge to Whistler for pasteurization and stabilization, and then trucking some of the biosolids product back to Squamish for final processing into a composting product (composted product is trucked to US where there is a greater market demand). Most of the current process is handled by Carney’s Waste Systems (Carney’s) as a contract service provider, where the District provides some input (but no operational requirements) after the dewatered sludge leaves the Mamquam Treatment Plant. Other local governments utilize similar services; private service provision is not a concern on its own.
Section 3.1 below explores these issues in greater detail, after which the goals and objectives of an Enhanced Biosolids Program are identified. Finally, other options for processing, treating and handling biosolids and the preferred direction for Squamish is laid out. This is an important component of the LWMP, as the preferred direction will steer the optimization of the wastewater treatment plant and other services.
3.1 Issues and Opportunities with Current Program
3.1.1 External Partnerships The current biosolids handling process involves trucking dewatered sludge to Whistler and trucking the biosolids product back to Squamish for final processing into a composting product. Most of the current process is handled by Carney’s as a contract service provider. This process also requires the Resort Municipality of Whistler (Whistler) to accept the dewatered sludge, which is dependent both on capacity at the Whistler facility and ongoing cooperation with Whistler to continue this partnership.
Carney’s hauls the dewatered sludge to Whistler and there are both trucking and tipping fee costs associated with this. Costs of the program, including summary tonnage statistics, are provided below.
3.1.2 Trucking Product to and from Whistler After dewatering the sludge with the centrifuge, the product is trucked to Whistler. The weights of dewatered product are expressed in kilograms in Table 3.1 as follows:

8 | P a g e
Table 3-1 Dewatered sludged trucked to Whistler
2010 2011
Average daily (kg/d) 4,974 5,438
Highest day (kg/d) 6,660 6,900
Average monthly (kg/mo) 153,292 153,365
Total annual (kg) 1,839,500 1,840,376
The sludge production rates are reasonably consistent from year to year. The liquid sludge before thickening and dewatering is equivalent to 2,200,000 kg of dry solids per year (220,000 m3 at 1% concentration). The total estimated dry solids produced per year is 330,000 kg.
The overall solids balance (in kg of dry solid equivalents) on an annual basis is summarized in Table 3.2:
Table 3-2 Annual solids balance at the wastewater treatment plant
Incoming raw sewage: 700,000 kg
Dewatered waste sludge: 300,000 kg
Plant effluent: 70,000 kg
Consumed in treatment process: 330,000 kg
3.1.3 Costs to the District Staff estimate the annual costs to the utility by means of payments to Carney’s for hauling (17% of total) and tipping fees (at Whistler; 83% of total) amount to approximately $350,000.
The estimated distance from the Mamquam plant to the Callaghan facility in Whistler is approximately 40 km. Based on the average daily production rates, one trip per day is made to haul dewatered sludge to Whistler. The total distance traveled per year (round trip) is 29,200 km. An estimate for greenhouse gas emissions (in the form of CO2) is provided below for a basic environmental cost to the region:
Heavy truck diesel consumption rate: 41 L/100km
29,200 km consumes about 11,970 liters of diesel
31 tonnes of GHG emissions (CO2) per year based on 2.6 kg/L of diesel
However, these costs are part of a broader feasibility study, yet to be conducted, weighing the costs of alternative programs for biosolids management. Ultimately, there is local and civic interest in exploring management options further to determine the preferred balance of costs and benefits in Squamish.
P a g e | 9
The following section provides a regulatory overview of biosolids composting and lays out three conventional management options.
3.2 Product Quality and Applications
3.2.1 Introduction to the OMRR The Organic Matter Recycling Regulation (OMRR) was developed to facilitate and encourage the reuse of organic matter in B.C., and includes management for sludge and biosolids produced during the treatment of sewage. There are three aspects to the regulation:
1. Quality requirements
2. Treatment requirements
3. Requirements for the application to land
These three aspects of the OMRR are summarized in the following sections.
3.2.2 Quality Requirements Under the OMRR, organic matter is separated into five different categories:
Class A compost;
Class B compost;
Class A biosolids;
Class B biosolids; and,
A biosolids growing medium.
Table 3.3 summarises the quality of the 5 organic products, as defined by the OMRR.
The highest quality and most stringent processing requirements relate to the biosolids growing medium and Class A compost categories. These products have no restrictions regarding their uses or access by the public. As a result of the high quality, there are examples where these products have been sold to the public, allowing a recovery of some of the processing costs. There are differences between the quality of material which is acceptable to be a biosolids growing medium, compared with a Class A compost. These differences relate to the intended use. The quality requirements for a biosolids growing medium are higher than a Class A compost, as the intent is for a biosolids growing medium to be used in place of a soil. By contrast, the intent with a Class A compost is to use this material as an organic amendment to enhance soil nutrient content.
A Class A biosolids is still a high quality product, and is only subject to reuse constraints when used in quantities exceeding 5 m3. For quantities less than 5 m3, the conditions for use of a Class A biosolids are exactly the same as those for a biosolids growing medium and a Class A compost. The lowest quality categories apply to a Class B compost and Class B biosolids, and the use of these materials is subject to a number of constraints. Even though restrictions can apply to Class A biosolids, Class B biosolids and

10 | P a g e
Class B compost, these materials should still be regarded as valuable for the enhancement of vegetative growth.
Table 3-3 - Summary of Material Quality Under the B.C. OMRR
Parameter
Medium Type
Biosolids Growing Medium
Class A Compost
Class B Compost
Class A Biosolids (Note 1)
Class B Biosolids
Access Unrestricted Unrestricted Restricted Some
restrictions Restricted
Foreign Matter Content (% dry weight)
< 1 < 1 <1 <1 < 1
Sharp Foreign Matter None present None present None present None present None present
C:N Ratio > 15:1 > 15:1 and <
35:1 N/A N/A N/A
Faecal Coliforms
(MPN/g dry weight) < 1,000 < 1,000 < 2,000,000 < 1,000 < 2,000,000
Maximum Element Concentration (µg/g dry weight)
Arsenic 13 13 75 75 75
Cadmium 1.5 3 20 20 20
Chromium 100 100 1,060 1,060 1,060
Cobalt 34 34 150 150 150
Copper 150 400 2,200 757 2,200
Lead 150 150 500 500 500
Mercury 0.8 2 15 5 15
Molybdenum 5 5 20 20 20
Nickel 62 62 180 180 180
Selenium 2 2 14 14 14
Zinc 150 500 1,850 1,850 1,850
Note 1: The quality criteria for a Class A biosolids is based on Federal requirements, stated in the Trade Memorandum T-4-93. This trade memorandum has no standards for copper or chromium, both of which are important for biosolids and biosolids products. The values stated in Table 3.3 for these metals are the proposed standards which have been indicated as reasonable by the B.C. Ministry of Environment.
3.2.3 Process Requirements In addition to quality requirements, the OMRR also outlines the treatment requirements for each type of organic matter. The treatment requirements relate to pathogen reduction and vector attraction reduction. Pathogen reduction is the decrease in micro-organisms which may have the potential to cause illness or disease and vector attraction reduction is the reduction in the potential for nuisance conditions (e.g. odour, attracting flies, etc.).

P a g e | 11
The requirements for pathogen reduction are outlined in Schedule 1 of the OMRR. In each case, the requirements for pathogen reduction are based on a temperature-time relationship for the destruction of enteric micro-organisms. The temperature-time relationship allows for either short periods of time when the material is exposed to elevated temperature or long periods of time when the material is exposed to low or ambient temperatures. The higher quality biosolids products (biosolids growing medium, Class A compost and Class A biosolids) all require a period of elevated temperature i.e. ≥ 50 oC. Class B products only require low or ambient temperature conditions.
Vector attraction reduction is the process by which the organic matter undergoes a change which will result in a material which is (theoretically) not biologically active. Once vector attraction reduction has been achieved, the final product is stable organically and has a low odour potential. The acceptable vector attraction reduction methods are outlined in Schedule 2 of the OMRR. There are a number of acceptable methods by which vector attraction reduction can be achieved and, unlike the pathogen reduction processes, there is little difference between a Class A process and a Class B process. The most common methods of vector attraction reduction involve biodegradation, mainly composting and digestion (aerobic or anaerobic). Chemicals can also be used for vector attraction reduction, with the most common being an alkaline substance, such as lime.
3.2.4 Use Requirements Under the OMRR, the intent is that the resulting organic matter will be used to enhance vegetation or plant growth. The acceptable uses range from agricultural lands for crop growth, through to urban settings, which can include use of these materials in residential gardens. A Class A compost, a biosolids growing medium and a Class A biosolids (for volumes less than 5 m3/parcel of land) can be used without restriction. However, for a Class B compost, a Class B biosolids or a Class A biosolids (of volumes greater than 5 m3/parcel of land), there is the need to complete a Land Application Plan under the OMRR. The Land Application Plan is to be prepared by a qualified professional and submitted to the B.C. Ministry of Environment before the organic matter is used. There is one exception to this – the potential to reuse organic matter at a landfill site for final cover which may be authorised through the landfill operating permit or closure plan.
3.2.5 Regulatory Framework for Industrial Uses With respect to the use of sludge or biosolids in industrial processes (e.g. cement manufacture) or for an energy source (e.g. incineration or gasification), these approaches are limited in B.C., but would be the responsibility of the industry to ensure that the organic matter is being managed appropriately. The regulatory pathway for any reuse options which do not include the enhancement of vegetative growth would need to be clarified on a case by case basis, but is likely to focus on the responsibilities being placed with the end user, not the sewage treatment plant owner. If the intent is to use sludge or biosolids for the production of energy, it is possible that sludge would have a higher calorific value, depending on the extent to which organic degradation occurs during the production of biosolids. However, the desire for an industry to handle sludge is likely to be limited, due to the pathogen concerns and the increased risk of nuisance conditions, such as odour production.

12 | P a g e
3.3 Biosolids Management Options
3.3.1 Introduction There are three basic options for management of biosolids associated with the District’s sanitary flows:
1. Continue with the status quo – contracting hauling and disposal/re-use to Carney’s Waste Systems
2. Partner with Carney’s to increase the level of service by processing and finishing the product locally to B.C. Organic Matter Recycling Regulation (OMRR) standards (i.e., bypassing the Whistler facility)
3. Develop a District-led plan to increase the level of service by finishing the product locally to OMRR standards (i.e., bypassing the Whistler facility)
The “status quo” option is fairly well known to District staff. Questions raised by the Committee and the public surround other options, which are outlined in this section (prior to providing recommendations for the LWMP).
Effectively considering these options requires background discussion on three ways to dispose of biosolids: to landfill, as an energy source and in land application program.
3.3.2 Disposal to Landfill
Overview
Disposal of sludge or biosolids to landfill does not need authorisation from the MOE, nor would this activity fall under the OMRR. However, agreement to receive the material must be received from the landfill owner and there is the need to ensure that the receipt of the material would not contravene the existing landfill operational permit. The landfill is operated by the District with planning functions provided by the Squamish Lillooet Regional District.
Typically, a landfill focuses on receiving solid wastes, so any sludge or biosolids which are received at a landfill must have been through a dewatering process first, which the District currently utilizes. Although typically no strict number is given with respect to the desired solids content of sludge or biosolids for disposal to landfill, a good rule of thumb is a minimum of 12% for solids content, as this can be achieved by simple dewatering process and resulting material can be handled as a solid.
Generally, the disposal of sludge and biosolids to landfill is becoming less acceptable. In B.C., this is due to the direction and the desire to divert organic materials away from the landfill. Overall, the landfill is not a viable option for regular disposal of biosolids, except for final cover.
Costs
The receipt of sludge and biosolids at landfill sites will incur trucking costs and tipping fees. Moisture content associated with sludge and biosolids is an important factor with respect to both costs. A wetter sludge or biosolids will result in higher trucking and tipping fees, so there is an advantage to achieving higher solids content during dewatering.

P a g e | 13
3.3.3 Use as an Energy Source
Overview
Many industrial processes burn fuel in order to produce some or all of the energy required at the site for operations. The organic content of the sludge/biosolids can result in this form of organic matter being a suitable potential alternative energy source. The presence of organic matter and water content are both important when considering the calorific value of a potential fuel source. Ideally, a potential energy source should have a high organic matter and low water content.
In the untreated form, sludge has a high organic content, which would make it suitable as a potential fuel. However, the organic content will decrease as the sludge naturally biodegrades (e.g. through treatment such as aerobic or anaerobic digestion). Therefore, an old sludge/biosolids will not be as energy efficient as a young untreated biological sludge. However, there will be lower concerns with respect to human health and odours for an old and well degraded sludge/biosolids.
A sludge or biosolids product does not require significant water removal before it can be considered as a suitable energy source. Depending on the burning process, it is possible that a solids content as low as 15% could be suitable, but this would require a sufficient balance with dry material. It is important that this balance is maintained, as the potential result could be the need to supplement the heating process with propane or electricity. For sites where sludge/biosolids is the primary source of fuel, a minimum solids content of 35% is preferred.
Feasibility
A neighborhood energy utility (NEU) feasibility study was conducted (Compass, 2010) pertaining to the developable lands near downtown Squamish. At the time, significant lands were being proposed for development including a large scale ocean front development, a centralized commercial zone and medium-density residential uses in the downtown. The amount of development included a high ratio of commercial space. Overall, the development projections and population growth was significant.
However, economic conditions stalled the project resulting in a more feasible style of development that suits current development drivers, such as industrial business. A revised feasibility study would be required to assess the energy infrastructure (fuel, production, distribution) needed for this style of development. District planning staff suggests that a revised NEU feasibility study could be conducted at Council’s request as new development applications are received.
It is important to note that biomass (including wood waste) was perhaps the most preferred energy source given its low fuel costs and abundant materials available in the region. Also, the 2010 feasibility study projected biomass fuel needs at approximately 20 tonnes per day during the peak heating period. The daily average production of dewatered biosolids from the Mamquam plant is approximately 6 tonnes. When mixed with local organic materials (e.g. wood waste) the waste-fuel available increases, perhaps to the same level as the peak heating fuel needs. As noted previously, having enough fuel for biomass energy does not constitute a feasible energy utility. Therefore, if or when the District reconsiders the energy utility then biosolids should be explored further as the potential energy source.

14 | P a g e
3.3.4 Land Application for the Growth of Plants
Overview
In theory, there are a number of different types of lands to which a Class B biosolids can be applied. These lands can be privately or municipal-owned properties, and the land uses can include agricultural, forestry, disturbed areas, recreational areas, etc. However, for a Class B biosolids, access restrictions to protect public health must be considered along with constraints which are required to protect the environment.
Typically, there is a preference towards lands which are owned by the District whether inside the District boundary or within the Regional District. Squamish has been approached by private biosolids managers to coordinate a land application in areas around the District.
For the application of a Class B biosolids to select lands, a Land Application Plan must be developed by a qualified professional and submitted to the B.C. Ministry of Environment for approval. The Land Application Plan must outline the following:
Application rates based on the characteristics of the material to be applied, the soils and proposed vegetation. This is typically calculated based on the nitrogen concentration, although it is possible that this could be amended in the event that there is an elevated concentration of a substance (e.g. a metal) in the biosolids.
Application requirements, e.g. methodology, tilling, etc.
Identification of public health and environmental concerns.
The determination of appropriate setbacks and mitigative measures. Setbacks apply to a range of different factors such as property lines, roads, streams and wells, etc.
Monitoring requirements before, during and after application.
There are different ways in which to manage the preparation of the Land Application Plan and the actual application of the material. Multiple options exist for land application operations such as:
1. The District could both prepare the Land Application Plan (through a qualified professional) and apply the organic matter. In this scenario, the District would have full control over the application and bear the full responsibilities of both the Plan and the application activities.
2. The District could prepare the Plan (through a qualified professional) but allow a contractor to apply the organic matter. In this scenario, the District would have little control over the application activities but would likely still bear the full responsibilities.
3. The District could use a contractor who is responsible for preparing the Plan and applying the organic matter. In this scenario, the District would have little control over the application activities and the contractor would likely bear the full responsibilities for the land application activities.
Costs
If the District was to pursue land application, the following costs would need to be considered:

P a g e | 15
Development of the land application plan;
Screening of the biosolids, if there is a concern with foreign matter;
Site signage;
Monitoring before, during and after the application;
Transportation to site;
Application of the biosolids, which may require both spreading and tilling; and
Re-vegetation of the area;
Biosolids can be applied to land either as a liquid or solid. There are advantages and disadvantages to both approaches. The key advantage with respect to using a liquid biosolids is an increased ease of application, depending on the application method. However, the application of a liquid will increase trucking costs and additional care will need to be taken with respect to preventing run-off. There is also a greater potential for liquid biosolids to affect shallow groundwater, due to the ability of the liquid portion to migrate down into the soils at a quicker rate than the vegetation is able to use the available nutrients.
It is possible to use sludge/biosolids at a landfill for final cover. This is especially advantageous if the landfill site has limited cover material available and requires additional material for final cover. However, the operation of many landfills does not distinguish between the receipt of sludge/biosolids as a waste and the receipt of biosolids as a resource for cover material. Therefore, a tipping fee may still be incurred (recognizing the lead role the District plays in landfill management, the tipping fee may not be a concern). Additional discussion would be needed to determine if this approach would be acceptable.
3.4 Discussion In Stage 1, the issues and priorities for biosolids centered on two topics:
Reducing trucking of biosolids; and
Finding local reuse applications for compost.
Through the processes of Stages 2 and 3, the picture for biosolids has become more comprehensive and may be characterized in a more balanced light. For example, there are multiple benefits of the existing approach:
District responsibilities for biosolids handling, management and disposal are low
Any land application is currently the responsibility of a contractor and there are no reports of handling the material in an unregulated manner
There is now greater capacity at the Whistler facility with a recent program to divert food waste, and the ability to receive the District’s biosolids is less of a concern
There is interest from both Squamish and Whistler to continue the current practice and to renew the arrangement for the interests of both parties

16 | P a g e
Local competition for selling compost is high and the District currently avoids the challenge of pushing anthropogenic compost into a crowded market which actually prefers organic compost (storing, or, trucking the compost elsewhere to find customers, is currently the responsibility of the District’s contractor)
In summary, the District’s biosolids management plan includes: dewatering, hauling, limited landfill application and distribution to other markets where there is greater demand. The program is delivered without significant operational resources by the District. Therefore, the primary drivers for Squamish to change current practice would come from:
a) The costs of hauling and the tipping fees at the Whistler facility
b) The need, if any, for additional District control and oversight on the operation (may not be desirable anyway)
c) The lack of local reuse under the current approach (opportunities for local reuse appear to be maximized e.g. landfill, energy production, and the product is trucked elsewhere when required for there is greater demand elsewhere).
Therefore, the decision to change from the status quo would be a result of a clear opportunity to save costs and meet the same demands for local reuse. A clear opportunity like this is not currently available.
Based on the discussion above, the following section outlines recommended strategies for enhanced biosolids management in Squamish.
3.5 Preferred Direction and Action Items Based on this evaluation of the existing program, on discussions with the Committee and District staff, and on input from the public, the preferred direction for the management of biosolids generated in Squamish is provided below.
Objective: Enhance the regional effort for biosolids processing, transportation, and applications.
1. By 2016, develop a long-term agreement (e.g. partnership) with Whistler for receiving biosolids from the District.
i. Confirm the terms of the partnership for important topics such as security (e.g. length of agreement), transparency, oversight, communication, reporting, liabilities and responsibilities.
ii. Define cost sharing and cost recovery responsibilities including capital levies, tipping fees and operational responsibilities. District sewer user fees will increase as needed to cover charges in the service agreement as they occur. For now, a contingency fund of $550,000 for any short-term levies has been included in the LWMP (contingency amount reflects 50% of the remaining balance Whistler has on its loan for the facility).
iii. Identify revenue sharing, if any.

P a g e | 17
iv. Explore integrated resource recovery options including energy production in partnership with Whistler.
2. Only revisit biosolids management options and determine a District-led program if a mutually beneficial partnership does not materialize with Whistler.
3. Reconsider the feasibility of a NEU as new developments are approved in the downtown core and upon direction from District Council.
i. Include flexibility within an agreement with Whistler to divert some biomass in the event local energy production becomes feasible.
4. By 2016, conduct a business case to optimize biosolids dewatering and hauling.
i. Study the balance of water content and onsite storage/drying to reduce number of trips and total mass hauled.
ii. Work directly with the District’s private contractor to lower the costs of trucking (financial and GHG) by investigating alternative fuels, more efficient equipment and other fleet optimization techniques.
5. Proceed with the WWTP - Plan including process changes to biosolids and digestion as a means to regulate the product.

18 | P a g e
4.0 WASTEWATER TREATMENT PLANT - PLAN
4.1 Goals and Objectives The ultimate goal of the WWTP - Plan is that flows are discharged to the Squamish River without compromise to public or environmental health. The fundamental objectives of the WWTP - Plan aimed at achieving this goal include:
1. Increase capacity to keep pace with growth.
2. Improve effluent quality to keep pace with regulations.
3. Reduce energy consumption and implement recovery where possible.
4. Repair/improve poorly functioning components
4.2 Key Considerations Based on the objectives of the WWTP - Plan, the following key considerations were identified in Stage 1 for further evaluation in Stages 2 and 3 of the LWMP:
Effluent quality: conduct an outfall assessment, develop effluent criteria through an Environmental Impact Study (EIS), and determine the treatment required to achieve these criteria
Growth: consider the amount and timing of growth, sanitary flows, and I&I
Energy Optimization: consider sources of wastage, examine opportunities for energy recovery
Repairs and Improvements: consider opportunities for automation and replacements
As previously illustrated, the WWTP - Plan has synergies with leachate management and opportunities for reclaimed water use; as such, these are both considered in the WWTP - Plan. Finally, odour control was recently identified as requiring more attention at the WWTP; therefore, all of these considerations are explored in further detail in the following sections.
Two reports were prepared to guide the WWTP - Plan, the Squamish River Environmental Impact Study and the Outfall Assessment. Brief summaries of both reports are provided prior to presenting analysis and design discussion for the plant options.
4.3 Effluent Quality Requirements
4.3.1 Outfall Assessment To support the development of a WWTP - Plan, two supporting studies were completed: an outfall assessment and an EIS. To guide the evaluation in Stages 2 and 3, an outfall assessment was completed. The outfall assessment was provided in a technical memorandum addressed to the District on August 8, 2013; a final revised memorandum (Appendix C) was submitted on January 14, 2014, to

P a g e | 19
reflect updates to flow projections such that they were consistent with the EIS (Appendix C). The purpose, process, key findings, and recommendations of this study are outlined below.
Purpose
The purpose of the outfall assessment was to determine whether the WWTP outfall and discharge dilution in the Squamish River comply with specific provisions in the British Columbia Regulation 87/2012, the Municipal Wastewater Regulation (MWR).
Process
The outfall assessment process was centered on a comparison of the WWTP outfall to specific provisions in the MWR, including:
Requirements for outfall locations
Requirements for marking of outfalls
Requirements for inspection
Requirements for dilution
Requirements for additional study or treatment
The comparison was supported by on-site observations of the outfall and a desktop evaluation of dilution in the Squamish River. Tidal influences were considered as the outfall is located near the upper end of the tidal zone.
Summary of findings
For the 2-year return period 7-day low flow (7Q2), the dilution ratio at the end of the initial dilution zone is 30:1 under high tide conditions and 60:1 under low tide conditions. Based on the information that was available for the assessment and on the results of the desktop dilution analysis, the outfall was found to generally comply with the MWR requirements and dilution in the Squamish River of treated effluent at the end of the dilution zone was found to be adequate.
Recommendations
Several action items were recommended to fill the gaps in information that were identified and to enhance the performance of the outfall. These include the following:
Contract a diver to inspect the outfall so that the configuration and condition can be confirmed. Subsequently, inspection dives must be conducted every five years to be in compliance with the MWR; however, more frequent inspections were recommended based on the dynamic sediment transport conditions in the Squamish River.
The outfall pipe should be inspected for encrustation and/or corrosion and for possible sediment aggradation or burial. During the inspection dive, the District may wish to conduct a dye study to confirm the findings of the desktop dilution analysis.
Collect bathymetric data at the outfall site in conjunction with dive inspections and use this information to inform the potential relocation of the outfall pipe.

20 | P a g e
Updated signage should be installed to indicate the depth of the outfall.
The results of the EIS should inform the need, if any, for advanced treatment beyond what is currently provided at the Mamquam WWTP.
4.3.2 Environmental Impact Study To guide the evaluation in Stages 2 and 3, an EIS was completed for continued effluent release to the Squamish River (the final report was received by the Ministry of Environment in February 2014). The purpose, process, key findings, and recommendations of this study are outlined below.
Purpose
The purpose of the EIS was to evaluate the option of discharging effluent from the treatment plant to the Squamish River and to recommend effluent criteria which will protect public health and the environment. The EIS sought to answer the question: What impact does effluent quality and flow have on the receiving waters, the Squamish river, both now and 20 years from now?
Process
The EIS considered changes in key parameters as a result of increased flows over the 20-year horizon, such as: organics, solids, nutrients (nitrogen and phosphorus), faecal coliforms, and metals. Modelling was completed to estimate the potential resulting concentrations for an effluent release of 16,050 m3/d, which is the 7-day high effluent flow rate for a 2031 population of 27,000 residents (see Section 4.5).
The EIS was also centered on the collection of environmental data for the Squamish River to better understand the environmental thresholds of this receiving water: a series of samples were collected over from August 6, 2013, to September 16, 2013, at both high and low tide conditions and submitted for a variety of analyses (full methodology is described in the EIS).
The EIS recognised federal and provincial standards and existing receiving water uses, including fisheries and recreational use.
Summary of findings
For the 7-day high effluent flow rate of 16,050 m3/d, significant dilution potential is available in the Squamish River, even under low flow conditions. The dilution ratios range from a minimum of 80:1 in February through to a maximum of 14,158:1 in October, with the average dilution ratio being approximately 1,250:1. For the river 7Q2, the dilution ratio was estimated to be in the order of 290:1, based on full river flows. Full results are reported and discussed in the EIS.
Recommendations
From the assessments that were completed, the following effluent criteria are recommended:
CBOD5 to be an average (quarterly average) equal to or less than 25 mg/L, with a maximum of 45 mg/L.
TSS to be an average equal to or less than 25 mg/L, with a maximum of 45 mg/L.

P a g e | 21
Disinfection – the effluent faecal coliform concentration is to be less than or equal to 5,500 counts/100 mL as a geometric mean. If ultraviolet (UV) disinfection is the process of choice, the consideration should be given to a lower threshold (e.g., 1,000 counts/100 mL as a geometric mean), as this is easily achievable with UV disinfection and would provide a safety buffer, given the high recreational use for the Squamish River. If chlorine is used for disinfection, the total residual chlorine concentration is to be less than or equal to 0.02 mg/L.
Ammonia – no treatment is needed to meet the Federal pre-discharge requirements of 1.25 mg/L as un-ionised ammonia. No treatment is needed to meet with Provincial chronic concentrations at the end of the initial dilution zone.
Nitrate – in the event that nitrification occurs, there is no requirement to denitrify.
Phosphorus – treatment is not required, based on the low potential for environmental impacts as a result of the presence of phosphorus in the effluent.
The results of the outfall assessment and the environmental impact study directly affect the proposed WWTP Plan below.
4.4 Overview of the WWTP - Plan The WWTP - Plan was created with the intent of achieving the stated goal and objectives. Therefore, the WWTP - Plan includes:
Actions to accommodate future flows and meet legislated redundancy requirements through capital upgrades, as per the MWR.
Actions to provide effective disinfection of treated effluent, as per the EIS.
Actions to monitor the potential impacts of leachate on the WWTP.
Actions to monitor the potential impacts of odour at the WWTP.
An evaluation of options to achieve the goal and objectives of the WWTP is provided in each section; also evaluated as part of the WWTP - Plan was the feasibility of reclaiming treated effluent for beneficial re-use.
It is assumed that the WWTP will remain at the existing site for the foreseeable future. This is based on the available area of the existing site and the anticipated relocation of the Public Works Yard.
4.5 Growth and Flows In order to determine if the existing WWTP has the capacity and adequate treatment processes to accommodate flows over the 20-year horizon, it is important to establish reasonable estimates of population growth, I&I, and flows over the 2031 planning horizon.

22 | P a g e
4.5.1 Population The 2011 Census population of Squamish is 17,158. Based on a review of historic growth in the community and on population projections in the District’s OCP, it was determined that a future population (2031) of 27,000 will be used for the LWMP, which is the low population projection in the OCP. This population was also used to estimate future seven-day high flows for the dilution analysis in the outfall assessment and for consideration in the EIS.
4.5.2 Inflow and Infiltration Inflow and infiltration currently adds an estimated 5,500 cubic metres per day (m3/d) to the base sanitary flow. For the purpose of estimating future flows and for developing the WWTP - Plan, it is assumed that no improvements will be made in the collection system to reduce I&I and that new sewer extensions will be constructed to minimize I&I; that is, I&I is assumed to remain constant at 5,500 m3/d through to 2031. This is because construction of servicing infrastructure for new developments should result in fewer leaks and condition-related problems.
Reducing I&I through a deliberate strategy is a community priority and forms part of the “Program Commitments” in this LWMP.
4.5.3 Flow Projections Flow rates in 2011 and projected flow rates for 2031 are summarized in Table 4-1. The projected values reflect the assumption that per capita flows and I&I remain the same as 2011, and are for a residential population of 27,000 people.
Table 4-1 - Flow projections for 2031, for a residential population of 27,000 people
Flow 2011 Values 2031 Projection
Average dry weather flow (ADWF) 7,200 m3/d 11,340 m3/d
Average wet weather flow (AWWF) 8,300 m3/d 13,500 m3/d
Inflow and infiltration (I&I) 5,500 m3/d * 5,500 m3/d
Maximum wet weather flow (MWWF) 14,088 m3/d 19,000 m3/d
Seven-day high flow 11,325 m3/d 16,050 m3/d
*estimated
The MWWF projection of 19,000 m3/d represents less than a 10% increase in the maximum Permit flow.
4.6 Unit Process Capacities The Mamquam WWTP has been upgraded and expanded twice since its original construction in 1973. The first expansion occurred in 1996, with a second expansion in 2006. As a result, the facility has double trains for most of the unit processes. The Ministry of Environment Discharge Permit (No. PE-01512) was last amended on April 5, 2001.

P a g e | 23
Kerr Wood Leidal Consulting Engineers completed a Capacity and Risk Assessment of the facility and reported their findings in a Technical Memorandum dated January 24, 2012 (file no. 463.237-300). This Memorandum was provided by the District of Squamish and is used as the basis for the summary that follows.
4.6.1 Source of Sizing Criteria The unit process sizing criteria are extracted from the WEF (World Environment Federation) Manual of Practice No.8, and the ASCE (American Society of Civil Engineers) Manual of Practice No. 76, published as a joint document in 1998. The capacities of screens, pumps, etc. are taken from the recorded values in the January 24, 2012 Technical Memorandum by Kerr Wood Leidal.
It is reported that the bio-reactors (aeration tanks) were originally intended to operate in the “Extended Aeration” mode of the Activated Sludge process. The Extended Aeration process should provide an aeration time between 14-34 hours (average 24 hrs). It has the advantage of minimizing production of waste sludge. The conventional activated sludge process utilizes a 6-hour detention time with lower sludge recycle ratios; the High-Rate Activated Sludge process reduces the detention time even further to 4 hours, with consequent higher production of waste sludge.
Clarification is the next step in the process and the key parameter for sizing clarifiers is the surface loading rate, along with a host of other parameters. Surface loading rates are derived for the average daily flow and the peak hourly flow. The peak hourly flow is typically two times the average daily flow rate.
A sidestream process at the Mamquam plant includes DAF (Dissolved Air Flotation) to thicken the waste sludge prior to dewatering. DAF loading parameters are given in terms of kilograms of solids loading per unit surface area of the DAF tank.
Table 4.2 below provides the theoretical capacities of the aeration bio-reactors at both extended aeration loading rates and conventional activated sludge loading rates; Table 4.3 summarizes clarifier capacities at both average daily flow rates and peak hourly flow rates; and Table 4.4 summarizes loading on the DAF unit at both average daily flow rates and peak hourly flow rates.
Table 4-2 Theoretical capacities of the aeration bio-reactors and activated sludge
Process Bio-Reactors
Year Installed
Volume m3
Extended Aeration Capacity (20 hours) 1
m3/d
Activated Sludge Capacity (6 hours) 2
m3/d
1996 2,500 3,000 10,000
2006 3,016 3,620 14,480
Total 5,516 6,620 24,480

24 | P a g e
Table 4-3 Clarifier capacities at average daily and peak hourly flow rates
Clarifiers Surface Area
m2
Loading at Average Flow (18m3/m2/d) 3
m3/d
Loading at Peak Flow (48m3/m2/d) 4
m3/d
1996 450 8,100 21,600
2006 580 10,440 27,840
Total 1,030 18,540 49,440
Table 4-4 Dissolved air flotation unit loading at average daily and peak hourly flow rates
DAF Surface Area
m2 Loading at Average Flow
(44kg/m2/hr) kg/hr Loading at Peak Flow
(6kg/m2/hr) kg/hr
2006 20 88 120
20 9,500 5 13,000 6
Notes:
1. The extended aeration process requires 20hr detention
2. The conventional activated sludge process requires 6hr detention
3. Clarifier design surface loading rate at average flow is 18m3/m2/d
4. Clarifier design surface loading rate at peak flow is 48m3/m2/d
5. The equivalent daily flow to produce 88kg/hr of sludge
6. The equivalent daily flow to produce 120kg/hr of sludge
A brief comparison of rated capacities with the projected flow horizons in Table 4.1 shows that the two bio-reactors do not have sufficient capacity if operated in the Extended Aeration mode, but do have sufficient capacity if operated in the conventional activated sludge mode, with increased waste sludge production. The clarifiers have sufficient capacity for the 2031 projected flows. The DAF unit is undersized for the future projected loadings.
4.6.2 The Municipal Wastewater Regulation The desired outcome of the Liquid Waste Management Plan is to allow the District of Squamish to comply with the B.C. Municipal Wastewater Regulation (MWR) and the Canadian Wastewater Systems Effluent Regulations (WWSER).
The required effluent quality parameters to meet these regulations are discussed in the Stage 1 LWMP report and are further elaborated in the Environmental Impact Study (EIS) summarized in Section 4.3. The EIS concludes that BOD and TSS concentrations prescribed in the regulations should be met and disinfection of the effluent should be added. Ammonia and Phosphorus reductions are determined to be unnecessary in this receiving environment.

P a g e | 25
The EIS also determined that this facility falls under the Reliability Category II in accordance with the definitions provided in the B.C. MWR. Category II indicates that “permanent or unacceptable damage to the receiving environment, including discharges to recreational waters and land, would not be caused by short term effluent degradation but would be caused by long term effluent degradation”.
The Reliability Category in turn determines the level of redundancy required for each process component. This is given in Table 1 of Section 35 and Section 36 of the MWR. A brief summary of the redundancy provisions for the unit processes at the Mamquam WWTP follows:
Process Redundancy (%) Screening and grit removal: not specified Aeration basins: 75% Secondary clarifiers 50% Sludge thickening (DAF): not specified Disinfection: 50% Aerobic digesters: 50%
The percentage redundancy value is defined as the remaining capacity with the largest unit out of service. Headworks operations such as screening and grit removal are not specified. The MWR also requires that air diffusers have multiple sections and that the oxygen transfer capability must not be measurably impaired with the largest section out of service. It also requires that the remaining capacity of blowers with the largest unit out of service be able to achieve the design maximum oxygen transfer.
Table 4.5 provides a summary of the unit processes and the available redundancy expressed as a percentage of the design flow both in the 2013 values and the 2031 horizon. The design flow in this case has been taken as the “Seven Day High Flow” as expressed in Table 4.1. The table indicates the number of units, capacity of each unit, and comparison to the 2013 and 2031 flows.
Table 4-5 Summary of treatment unit processes and available vs. required redundancy
Process No. of Units
Capacity of Each Unit
m3/d
Existing Max Flow m3/d
Available Redundancy for Existing
Plant 5 %
2031 Max Flow 4
m3/d
Available 2031 Redundancy 5
%
MWR Required
Redundancy 6 %
L.S. #1 3 12,200 9,000 100 16,050 85 -
L.S. #2 3 4,100
Screening 2 18,000 1 9,000 160 16,050 125 50
18,000 2
Degritters 2 18,000 1 9,000 100 16,050 66 -
9,500 2
Bio-Reactors 2 5,000 1 9,000 55 16,050 35 75
7,500 2
Sec. Clarifiers 2 8,100 1 9,000 96 16,050 56 50
10,4402

26 | P a g e
Process No. of Units
Capacity of Each Unit
m3/d
Existing Max Flow m3/d
Available Redundancy for Existing
Plant 5 %
2031 Max Flow 4
m3/d
Available 2031 Redundancy 5
%
MWR Required
Redundancy 6 %
DAF 1 9,500 1 9,000 - 16,050 - -
Centrifuge 1 288 1 9,000 - 16.050 - -
Notes:
1. Train 1 units
2. Train 2 units
3. The 2011 Max Flow is the high 7-day flow for the year should be 11,325 not 9,000
4. The 2031 Max Flow is the projected high 7-day flow for the year should be 16,050, not 14,400
5. The available redundancy is the capacity of the smallest unit as a percentage of the high 7-day flow.
6. The MWR prescribed redundancy expressed as a percentage of Max Flow.
4.6.3 Discussion of Redundancy Provisions There are no MWR redundancy provisions for pump stations. However, it is good practice to provide 100% pumping redundancy in all sewage pump stations, since plugging or mechanical failure is common when pumping raw sewage. There are two pump stations, each equipped with 3 pumps. Each station has better than 100% redundancy with 3 pumps available. As a further standby, an interconnection between the two stations could provide an emergency overflow if one station should fail completely.
There are no MWR redundancy provisions for screening and grit removal. However, good practice would suggest a minimum redundancy of 50% be considered. In this case, even with the largest unit out of service, the screening and de-gritting function can provide 50% capacity for the 2031 horizon.
The MWR redundancy requirement for the aeration basins is 75% with the largest unit out of service. The smaller aeration tank has a volume of approximately 2500 m3. In extended aeration mode (20 hrs detention) this translates to a processing capacity of 3,000 m3/d. The Kerr Wood Leidal risk assessment estimates the capacity at 5,000 m3/d (12-hour retention). This provides approximately 55% redundancy during the current 7-day high flow of 9,000 m3/d.
The smaller secondary clarifier has a capacity of 8100 m3/d using a typical surface loading rate of 18 m3/m2/d. This meets the 50% redundancy requirement at the current 7-day high flow of 9,000 m3/d.
There are no MWR redundancy requirements for the DAF unit or the centrifuge unit.
The EIS recommends that disinfection be added, and the redundancy requirement for disinfection is 50%.

P a g e | 27
There is currently no sludge digestion at the plant. However, if the process is converted to conventional activated sludge or to high rate activated sludge, the amount of waste sludge will increase and digestion should be considered. A digester can also perform the function of thickening, as well as stabilizing.
4.6.4 Options for Meeting Redundancy Provisions In the context of a Liquid Waste Management Plan, there are several approaches to meeting the redundancy provisions. The approaches can be briefly described as follows:
Option 1: Add a third process train
A third train would comprise the aerated bio-reactor and clarifier. While there are many types of bio-reactor/clarifier configurations, a circular configuration similar to the 2006 expansion can be adopted for the purpose of cost estimating. The existing site does not have sufficient room for this third train, and the structure would encroach on the Public Works area to some extent. A conceptual layout is provided on Figure 4-1.
Option 2: Convert to higher reaction rate process
The current extended aeration process is known as a low rate process because of the long hydraulic detention time in the bio-reactor. Variations of the historical activated sludge process include the following with corresponding design parameters:
Detention time Sludge return ratio Concentration
hrs. % mg/L
Low Rate 24 100 6,000
Medium Rate 6 50 3,000
High Rate 4 200 7,000
Higher reaction rates result in a smaller bio-reactor. The smaller existing tank has a volume of 2200 m3. If the process is converted to high rate with a 4 hour detention time, the capacity of the reactor becomes 550 m3/hr, or 13,200 m3/d. This represents more than 75% of the projected design flow of 16,000 m3/d. So operating in high-rate mode can achieve the required redundancy.
However, the long detention time of the low rate extended aeration process achieves a 30-40% reduction of volatile solids (by converting to gas). The short time in the high rate reactor does not achieve much reduction of volatile solids, and consequent greater waste sludge production.
High rate processes are also subject to upset from variable flow rates, so it is advisable that this approach add a filtration step after the secondary clarifier. The filtration step provides additional BOD and TSS removal, and ensures that even with one unit out of service, there are sufficient

28 | P a g e
barriers to BOD or TSS breakthrough. This approach has the added advantage of producing a much better quality of effluent when all units are operating. A filtered effluent typically makes any disinfection process more effective. This approach is depicted on Figure 4-2.
Option 3: Convert the bio-reactors to MBBR
Another approach to increasing the bio-reactor capacity is to install plastic media in the aeration tanks. The plastic media provide a matrix for micro-organisms to grow on. This results in a bio-reactor that carries both a suspended growth mass as well as an attached growth mass in the same vessel. The process is called MBBR (Moving Bed Biofilm Reactor).
The process carries a significantly larger solids concentration in the bio-reactor and a lower detention time (usually 2 hours). It is a flow through process, meaning there is no requirement for sludge recycle and the biomass is self-regulating.
The use of plastic media will require the addition of fine screening to the headworks to avoid entry of larger particles. The inlets and outlets to the tanks must also be screened to prevent loss of the plastic media. This approach is depicted on Figure 4-3.
4.6.5 Other Plant Processes The management of plant residuals includes screenings, grit and sludge. Screenings are partially dewatered and hauled to landfill. The system works well, although operators report that rags periodically pass through the screens and enter the bio-reactor. No upgrade to the screening system is contemplated, unless the process is changed to MBBR.
Grit is removed by means of vortex separators, through a grit classifier and hauled to landfill. No modifications to the grit removal system are contemplated.
Waste sludge is pumped to the Dissolved Air Flotation (DAF) unit. The DAF process thickens sludge from a solids concentration of 1% up to approximately 4%. The thickened sludge is transferred to the Thickened Waste Activated Sludge (TWAS) tank. The liquid fraction is returned to the influent pump station. The DAF unit has a rated loading capacity of 4.4 kg/m2/hr, or the equivalent of a plant flow rate of 9,500 m3/d. This means that a second unit will be required soon. A second centrifuge has been purchased and installed.
The TWAS tank is aerated to reduce odours. However, having a single tank presents some operating challenges. The tank must be cleaned on a regular basis, and a single tank means that the entire sludge process stream must be shut down to allow cleaning or maintenance. A parallel TWAS tank would alleviate these concerns. Sludge from the TWAS tank is transferred to a centrifuge for dewatering. The centrifuge capacity is rated at 12 m3/hr. The current production rate of thickened sludge (4% solids) is approximately 64 m3/d. That results in an operating time of 5.3 hours. The future flow of 16,050 m3/d will result in a sludge production rate of about 120 m3/d, resulting in an operating time of 10 hours per day. The use of a second centrifuge will reduce the operating time.

P a g e | 29
Figure 4-1 Upgrades Approach # 1 – Third process train

30 | P a g e
Figure 4-2 Upgrades Approach #2 - Added filtration

P a g e | 31
Figure 4-3 Upgrades Approach #3 - MBBR

32 | P a g e
4.6.6 The Impacts of Process Modification The discussion of process modifications to increase capacity and achieve compliance with the MWR redundancy provisions, shows that greater quantities of sludge would be produced with the high rate activated sludge process, and with the MBBR process.
The higher rate processes will produce approximately double the quantity of waste sludge. In view of this, it is advisable to include a digester to reduce the volatile solids content. Digestion will convert volatile solids to gas; digestion also has the effect of thickening as well as stabilizing the sludge. Aerobically digested sludge is typically more difficult to dewater than raw sludge. Anaerobically digested sludge is easier to dewater, and has the advantage of producing digester gas which can be used for heating both the digester and the plant. The process also uses less power than the aerobic digester or the DAF. Although detailed energy calculations have not been prepared, if the 3rd plant upgrade approach is selected, the net electricity requirements of the plant will decrease due to: reduced blower requirements in the DAF unit; reduced blower requirements per m3 of flow in the bio-reactors; the opportunity to capture gas from the digestion units and the opportunity to configure the existing infrastructure instead of an additional process train (which would require site works, lighting, heating, etc.).
For the purpose of this comparison, it is assumed that anaerobic digestion would be installed to offset the higher sludge production form high rate processes. If a third process train is considered, it may also be practical to convert from thickening and storage to anaerobic digestion.
4.6.7 Overall Plant Capacity Upgrade Approaches Several approaches are examined to upgrading the plant processing capacity and conform to the MWR redundancy requirements. Approximate capital costs are developed and provided in Appendix B. A summary of the capital cost estimates follows:
1. Construct a third process train: $ 6.0 million (capital)
2. Convert to high rate activated sludge and add final filtration: $ 3.9 million (capital)
3. Convert bio-reactors to MBBR $ 3.1 million (capital)
Each of these approaches requires expansion of sidestream processing units in order to deal with the additional sludge produced. The sidestream plant upgrades are broken down as follows:
a) Additional DAF unit: $ 2.1 million
b) Additional Centrifuge: Budgeted $1 million in 2014
c) Additional TWAS $ 1.5 million
d) Anaerobic Digester $ 2.5 million
The mainstream/sidestream combinations are:
1. Third process train with additional DAF, TWAS and centrifuge
2. High rate conversion with anaerobic digester.
3. MBBR conversion with anaerobic digester.

P a g e | 33
Table 4-6 provides a summary of the capital costs and annual costs of the above three combinations.
Table 4-6 Summary of capital and annual costs (present worth) of upgrade options
Item Combination 1
1+a+b+c
Combination 2
2+b+d
Combination 3
3+b+d
Capital (Mainstream) $6,000,000 $3,900,000 $3,100,000
Capital (Sidestream) $3,600,000 $2,500,000 $2,500,000
Total Capital $9,600,000 $6,400,000 $5,600,000
Increased annual cost $250,000 $270,000 $240,000
Present Worth of increased annual cost $4,000,000 $4,410,000 $3,760,000
Total Present Worth $13,610,000 $10,810,000 $9,360,000
Notes:
For the purpose of the comparison, the capital expenditures are taken in the present.
The increased annual costs are over and above the current annual costs and include increased power consumption and increased processing and hauling of sludge. In the case of combination 1, the sludge quantity is increased by 33% (third train). In the case of Combinations 2 or 3, the sludge quantity is increased by 50% to account for greater waste sludge production.
The Present Worth of the annual cost increases is calculated on the basis of a 2% compound interest savings factor over a 20-year period.
Capital costs include 15% for engineering design and 25% contingency.
Design and construction costs for upgrading the centrifuge were budgeted for in 2014; these costs have not been included in the required funding for WWTP upgrades as recommended in this LWMP.
It is prudent to budget for the range of WWTP - Plan options as additional study is required to finalize the preferred process configuration. For example, it is common to conduct some pilot scale testing of new processes to confirm their feasibility. As a result, it is recommended that the District budget for the range of options however proceed with further study into the lowest option – the most preferred option – as described further below.
4.7 Options for Disinfection Three options for disinfection at the Mamquam wastewater treatment plant are explored in this LWMP: chlorination with chlorine gas; chlorination with sodium hypochlorite; and ultraviolet (UV) treatment. Disinfection by chlorination is the oldest method of disinfection for public water supplies in Canada and the United States, and is highly effective; however, issues have come to light in recent years regarding the use of chemicals and the formation of harmful by-products; in response, alternative disinfection

34 | P a g e
methods such as UV treatment have gained traction and notable examples of their application now exist across Canada and the United States, including Metro Vancouver.
An overview of the process, advantages, disadvantages, and key considerations for the application of these treatment options in Squamish are explored in the following sections.
4.7.1 Option #1: Chlorination with Chlorine Gas
Chlorination and De-chlorination Process
Disinfection with chlorine is a chemical treatment process. When chlorine gas is added to water, it undergoes chemical reactions that eventually produce free available chlorine. This free chlorine damages the cell membrane of microbiological organisms, disrupting enzyme activity and ultimately leading to cell death. Chlorine gas is highly effective at killing most pathogens and it is known to be a reliable treatment method.
The amount of chlorine required for disinfection varies with the presence of other chemical reactions: inorganic compounds such as metals, and natural organic compounds such as humic acids, react with chlorine at different rates. Therefore, to ensure reliable disinfection, more chlorine is typically added to the water or wastewater system than is required for a complete chemical reaction (the chlorine demand). Chlorine which exists in the treated water or wastewater after the chlorine demand has been satisfied is referred to as residual chlorine.
In drinking water systems, residual chlorine is required (and often added as a separate step) to satisfy disinfection throughout the distribution system to the end user. In Squamish, however, residual chlorine in the effluent is a significant consideration as free chlorine is toxic to aquatic life: the EIS recommended that if chlorine is used for disinfection, the total residual chlorine concentration is to be less than or equal to 0.02 mg/L.
In addition to residual chlorine, a key consideration of chlorination is the formation of harmful by-products. When free chlorine reacts with natural organic matter in water and wastewater, it forms by-products known as organochlorides and trihalomethanes (THMs), which are carcinogenic to humans and toxic to aquatic life.
To address the issue of residual chlorine and the formation of harmful by-products, de-chlorination would be required in Squamish. This can be achieved with the addition of a variety of compounds, the most common of which is sulphur dioxide (both as gas and as dry chemicals which form sulphur dioxide in solution). Consideration must be given to sulphur dioxide dosage, as excess overdosing can lead to the formation of sulphate, reduced dissolved oxygen content, and lower pH of the treated effluent. Sulphur dioxide is corrosive and can cause respiratory problems; as such, it necessitates operator training and safe storage and handling practices.
Advantages and Disadvantages
The advantages and disadvantages of chlorination with chlorine gas and de-chlorination with sulphur dioxide are summarized in Table 4-7 below:

P a g e | 35
Table 4-7 Advantages and disadvantages of disinfection of wastewater with chlorine gas
Advantages Disadvantages
Highly effective against most pathogens
Often the most cost effective treatment solution
Typically lower chemical costs than sodium hypochlorite
Chlorine gas is explosive and toxic when inhaled by humans
Sulphur dioxide is corrosive and can cause respiratory problems
Free chlorine is toxic to aquatic life
Chlorine reactions produce harmful THMs and organochlorides
Process requires de-chlorination
Use of chemicals requires safe handling and storage practices and emergency planning
Process requires specialized operator training
Requires ongoing monitoring of free and total residual chlorine
Key Considerations for Squamish
Disinfection with chlorine gas in Squamish requires several key considerations:
Treatment plant operator preference is important as these staff would be the primary handlers of all chlorination and de-chlorination chemicals.
The requirement for de-chlorination necessitates the addition of more chemicals to the treatment process and presents further risk to human and environmental health.
Chlorine gas is explosive and toxic when inhaled by humans, and free chlorine is toxic to aquatic life.
Sulphur dioxide is corrosive and can cause respiratory problems.
Workplaces in which chlorine gas is used or stored must have a comprehensive health and safety program, including work safe policies and procedures, emergency response procedures, training, inspections, and other components (as required by WorkSafe B.C.).
Disinfection with chlorine gas/sulphur dioxide will require the construction of a contact tank, increasing the footprint of the treatment plant.

36 | P a g e
4.7.2 Option #2: Chlorination with Sodium Hypochlorite
Chlorination and De-chlorination Process
Due to the risks associated with the storage and handling of chlorine gas, other forms of chlorination are often applied to water and wastewater treatment, including sodium and calcium hypochlorite. Sodium hypochlorite (often referred to as liquid bleach) is often used in water and wastewater applications, while calcium hypochlorite is often used in swimming pool disinfection; for the purpose of treatment options in Squamish, sodium hypochlorite will be considered.
Sodium hypochlorite is used on a large scale for water and wastewater treatment. When dissolved in water, it produces free available chlorine, which acts as the disinfectant. The remaining processes are similar to the reactions resulting from chlorine gas, including the formation of organochlorides and THMs (with the addition of bromate and chlorate formation).
Like the treatment process involving chlorine gas, chlorination with sodium hypochlorite requires the additional step of de-chlorination to remove residual chlorine and prevent the formation of harmful by-products. This is typically achieved with the addition of sodium thiosulphate, which presents less risk to the receiving environment than other de-chlorinating agents. It is also non-toxic and non-corrosive.
Advantages and Disadvantages
The advantages and disadvantages of chlorination with sodium hypochlorite and de-chlorination with sodium thiosulphate are summarized in Table 4-8 below:
Table 4-8 Advantages and disadvantages of disinfection with sodium hypochlorite
Advantages Disadvantages
Highly effective against most pathogens
Long history and wide-spread use across Canada and the United States
Safer to store and handle than chlorine gas
Free chlorine is toxic to aquatic life
Sodium hypochlorite is corrosive and requires cautious handling practices
Chlorine reactions produce harmful THMs and organochlorides
Process requires de-chlorination
Use of chemicals requires safe handling and storage practices and emergency planning
Process requires specialized operator training
Typically higher chemical costs than chlorine gas
May crystallize and clog mechanical components
Requires ongoing monitoring of free and total residual chlorine
Key Considerations for Squamish
Treatment plant operator preference is important as these staff would be the primary handlers of all chlorination and de-chlorination chemicals.

P a g e | 37
The requirement for de-chlorination necessitates the addition of more chemicals to the treatment process and presents further risk to human and environmental health.
Disinfection with sodium hypochlorite/sodium thiosulphate will require the construction of a contact tank, increasing the footprint of the treatment plant.
4.7.3 Option #3: Ultraviolet Treatment
Ultraviolet Treatment Process
Ultraviolet (UV) disinfection is a physical treatment process whereby short-wave UV rays penetrate the cell membrane of a pathogen and disrupt its DNA, leaving it unable to perform cellular functions and therefore inactivating it. Because of this mechanism, UV treatment is effective at inactivating pathogens that are unaffected by chlorine, such as Giardia and Cryptosporidium. This treatment process does not involve the addition of chemicals and does not produce harmful by-products.
The degree of inactivation by UV radiation is a function of several key factors:
Ultraviolet dose applied to the water, which is a function of UV light intensity and exposure time and is usually measured in microjoules per square centimeter (mJ/cm2) or microwatt seconds per square centimeter (µW·s/cm2).
Flow rate, which affects exposure time.
Ultraviolet transmissivity, which is a characteristic of the water and is affected by suspended solids. Transmissivity is highest in de-ionised water and decreases with turbidity, as suspended particles can shield pathogens from the UV rays.
As public support for chemical treatment processes wanes and treatment plant owners and operators take a more holistic and lifecycle-based approach to providing services, disinfection with UV radiation has become an increasingly favourable alternative to chlorine treatment. It is gaining popularity both as a drinking water and wastewater treatment method. Facilities that use UV radiation include Whistler’s wastewater treatment plant and Metro Vancouver’s drinking water treatment plant, among others.
Advantages and Disadvantages
The advantages and disadvantages of UV disinfection are summarized inTable 4-9 below:
Table 4-9 Advantages and Disadvantages of Disinfection with Ultraviolet Treatment
Advantages Disadvantages
Highly effective against most pathogens
Can inactivate chlorine-resistant pathogens
Does not require ongoing purchase, storage, handling, or addition of chemicals
Can often be retrofitted into existing facilities (smaller footprint than chlorination)
Does not result in formation of harmful by-products
Energy-intensive
Reliability depends in part on characteristics of the wastewater (TSS and turbidity)
Fouling of UV lamps may decrease effectiveness of treatment and requires maintenance
Requires control of hydraulic grade line and flow for optimal UV performance

38 | P a g e
Key Considerations for Squamish
The feasibility of this treatment process for the Mamquam WWTP is dependent on the UV transmittance of the current treated wastewater, capital cost, operating and maintenance costs, operator and staff preference, and public input.
To provide an indication of the feasibility of UV treatment, samples of treated effluent were collected and submitted to a laboratory for analysis of percent UV transmittance. A total of ten samples were taken from February 19, 2014, to April 23, 2014 as part of the regular weekly sampling program. A summary of the results of these analyses is presented in Table 4-10 below:
Table 4-10 Analysis of percent transmissivity of UV radiation
% Transmissivity
(filtered)
% Transmissivity
(un-filtered)
Mean 68.7 65.1
Maximum 70.3 66.8
Minimum 66.5 62.6
Typically, a UV transmittance of 65% is desirable and 60% is acceptable. The results of 10 weeks of treated effluent sampling suggest that UV treatment should be feasible for treated effluent from the Mamquam WWTP. However, the option of adding a filter prior to UV treatment should be considered, as this will allow for greater turn-down on UV lamp intensity and consequently lower annual power costs. These costs are explored further in the next section.
Operator and public preference was also considered in the evaluation of treatment options. Based on discussions with treatment plant operators and through public engagement, the preferred option for disinfection in Squamish is UV treatment.
4.7.4 Life Cycle Cost Comparison High-level capital and annual costs were estimated for each treatment type. A summary of the cost estimation is provided below in Table 4-11. A more detailed breakdown of specific costs is provided in Appendix B.
Table 4-11 Capital and annual costs for each treatment option
Item
Option #1
Chlorination: Gas
(Chlorine, SO2)
Option #2
Chlorination: Liquid
(Hypochlorite/Thiosulphate)
Option #3
Ultraviolet
Radiation
Total Capital $1,575,000 $1,358,000 $952,000
Total Annual $62,700 $354,000 $73,000
Present Worth of Annual Costs
$933,000 $5,267,000 $1,086,000
Total Present Worth $2,508,000 $6,625,000 $2,038,000

P a g e | 39
Notes:
The Present Worth of the annual cost is calculated on the basis of a 2% compound interest savings factor over a 20-year period.
Capital costs include 15% for engineering design and 25% contingency.
As shown in Table 4.11, the most cost effective option for disinfection in Squamish is UV treatment. This cost estimation does not include filtering as suggested in the previous section; therefore, if the District decides to filter, there will be additional (relatively minor) capital costs for the filter but a potentially notable reduction in annual costs. The power costs for UV treatment in Squamish may be in the range of five to 16 times greater than for either chlorination option and contribute to the majority of annual costs. Therefore, the District should consider taking steps (based on the business case) to reduce power consumption wherever possible.
4.7.5 Preferred Approach for Plant Upgrades As discussed in the previous section, the preferred disinfection approach for Squamish is UV treatment. For capacity upgrades, the most favourable financially is option (conversion to MBBR process) and addition of anaerobic digestion, with provision of a second centrifuge for dewatering (which is already underway). When considering the timing of capital improvements, growth and redundancy compliance are the key factors.
The smaller bio-reactor is rated for a processing capacity of 3,000 m3/d. When operating in extended aeration mode, providing only 27% redundancy at the 7-day high flow. It is recommended that this bio-reactor be converted to MBBR in the near term. The second bio-reactor is larger and conversion can occur in approximately 5 years, depending on the pace of growth.
The clarifier redundancy is limited to the older smaller unit, rated at 8,100 m3/d. With a required 50% redundancy, the trigger point flow is 16,200 m3/d. This flow is not projected until 2037. Therefore, expansion of clarifier capacity can be left for the long term.
The following schedule of upgrades (Table 4.12) is suggested. Note that engineering design costs were assumed to be 15% of the total, with 25% contingency on construction costs. It should be noted that this table was developed in concert with staff at the District using the current financial model. If grants, additional DCCs or other sources of revenue were to arise earlier than project, this schedule would be revised.
Table 4-12 Proposed schedule of treatment plant upgrades and capital costs
Item Year Capital Cost
Design UV disinfection system 2015 $142,000
Construct UV disinfection system 2016 $810,000
Design conversion of older (smaller) bio-reactor to MBBR 2017 $165,000
Construction of conversion of older (smaller) bio-reactor to MBBR 2018 $935,000

40 | P a g e
Item Year Capital Cost
Design of anaerobic digester 2019 $375,000
Construction of anaerobic digester 2020 $2,125,000
Design conversion of second bio-reactor to MBBR 2020 $300,000
Construction of conversion of second bio-reactor to MBBR 2021 $1,700,000
Total treatment plant capital costs to 2019 $6,552,000
It should be noted again for clarity that these costs do not include the cost of the centrifuge upgrade, which was budgeted for in 2014 at $1 million. Also, it is recommended to include additional contingencies to account for myriad variables that may affect the type and scale of proposed upgrades.
4.8 Leachate Management Discussion is provided below on the leachate which is received at the sewage treatment plant and the potential for influences on the influent and effluent quality. This information is taken from the 2013 annual landfill monitoring report, the 2014 first quarter landfill monitoring report and the 2013 environmental impact study for the release of effluent from the sewage treatment plant to the Squamish River.
4.8.1 Flows During the wet season, the average total sanitary flows received at the sewage treatment plant are in the order of 8,300 m3/d. Data indicate that the average and maximum leachate flows are 7 m3/d and 22 m3/d, respectively. The leachate flows represent less than 1% increase in the flows received at the sewage treatment plant, for both average and maximum leachate flow conditions. This increase in flows is insignificant to the hydraulics of the sewage treatment plant.
4.8.2 Quality Due to the nature of leachate, there is the potential for several parameters to be present at higher concentrations than domestic sewage. From the available data, the following parameters are higher in the leachate than the District’s domestic sewage: conductivity, hardness, chloride, 5 day carbonaceous biochemical oxygen demand (CBOD5), ammonia and most metals. This evaluation is based on effluent data and the definition of medium strength sewage. (Note that for all quality discussions, the leachate data relate to total BOD5, not CBOD5. An assumption has been made that the concentration of total BOD5 for the leachate is equivalent to CBOD5, which is a conservative approach.) Focusing on the substances which can be removed from a sewage treatment plant by process design (i.e. total suspended solids – TSS, CBOD5 and ammonia),
Table 4-13 summarises the incoming parameters and the resulting increase in the influent concentration. These data assume that the incoming sewage is representative of medium strength sewage and that the leachate concentrations are the maximum recorded concentrations, which is a worst case scenario. Due to the low leachate flow rate, compared with the average sewage treatment plant flows, the changes are not significant and are not expected to influence process operations.

P a g e | 41
Table 4-13 - Influent Changes as a Result of Incoming Leachate
Parameter TSS CBOD5 Total Ammonia
Influent Concentration (mg/L) 220 220 25
Average Leachate Concentration (mg/L) 147 452 197
Maximum Leachate Concentration (mg/L) 219 797 250
Average Increase in Concentration (mg/L) 0 0 0.1
Maximum Increase in Concentration (mg/L) 0 1.5 0.6
For these parameters, the predicted change in effluent quality was estimated, and is based on a worst case scenario that there is no reduction in the leachate contribution of CBOD5, TSS or ammonia. From Table 4-14 the predicted changes in the effluent conditions are too low to be of significance with respect to the ability to meet regulatory effluent quality and the potential for environmental impacts. These predictions are based on recent effluent quality data.
Table 4-14 - Effluent Changes as a Result of Incoming Leachate
Parameter
Increase in Effluent Concentration (mg/L)
Average Leachate Concentration Maximum Leachate Concentration
CBOD5 0.4 2.1
TSS 0.1 0.5
Total Ammonia 0.2 0.7
Given the amount of dilution available, it is also reasonable to assume that parameters such as conductivity and chloride, which are present in higher amounts in the leachate and will pass untreated through the sewage treatment plant, will not result in an issue with respect to the effluent quality or impacts on the receiving environment. It is worth noting that the receiving environment (the Squamish River) is tidal and the water in the vicinity of the outfall is brackish at times, due to the marine influence. Conductivity and chloride associated with brackish water is higher than for freshwater conditions.
A low risk of impact is also expected to be the case for the metals which are present in the leachate. It is estimated that the increase in the effluent metal concentration would be less than 1% as a result of the leachate contribution. This is assuming that there is no reduction in the metal concentration, which is unlikely to be the case as metals tend to migrate to the biosolids, where they will accumulate. There is a risk that the accumulation could result in a measurable increase in the biosolids, but this would need to be evaluated further.
4.8.3 Discussion With the data which are available for the leachate, the low incoming volumes are a key factor for a low potential for detrimental impacts to the treatment processes and effluent quality. The District should continue with the annual leachate monitoring program, but will need to reconsider the current management program if significant changes in leachate flow and/or leachate quality are observed.

42 | P a g e
Currently, there is low potential for detrimental impacts to the treatment processes and effluent quality even though some parameters associated with the leachate are elevated (compared with what would be expected for untreated domestic wastewater). The metals will tend to migrate and accumulate in the biosolids; therefore, further evaluation would be needed with respect to a prediction of impacts.
The more detailed evaluation of potential leachate impacts would need to include data from the influent leachate and biosolids, and confirmation on the approach to be taken with the long-term management of the biosolids. There are several reasons for this:
Currently, District biosolids are only a small contribution to the overall materials processed in Whistler. If the District ever decides to pursue its own biosolids processing facility, the quality of District biosolids (being the sole source) will be significantly more important and will be a key determinant of potential end uses under the OMRR.
Quality criteria for biosolids are outlined in Schedule 4 of the OMRR. In the potential event that biosolids produced at Whistler do not adhere to these criteria, Whistler may wish to explore the source of the issue. Historical quality data for District biosolids as they relate to leachate quality will support this process, should it ever occur.
Whistler may request this information at any time.
It is therefore recommended that the District collect samples on a regular basis of sludge that is sent to Whistler, as discussed in the following section.
There is also the need to consider whether the leachate would be consistent with the requirements of any existing sewer use by-law and any changes which may be made to this by-law as a result of the Liquid Waste Management process.
4.8.4 Preferred Direction and Action Items Based on the discussion presented, it is recommended that the District take the following steps to ensure the long-term responsible management of leachate to the WWTP:
1. Continue the annual leachate monitoring program (ongoing)
2. Initiate biosolids quality monitoring (starting in 2014) if required as part of the agreement with Whistler
Collect samples twice annually (winter/summer) (approx. $350 for lab fees annually)
Test for fecal coliforms, volatile solids, total solids, and metal content
Because these costs are negligible and are only necessary if required by Whistler, they have not been included in the overall LWMP costs.

P a g e | 43
4.9 Reclaimed Water Use Currently, 100% of treated effluent from the WWTP is discharged to the Squamish River. In Stage 1 of the LWMP, it was recommended that the feasibility of opportunities for readily apparent use of reclaimed water, including agriculture and industry water substitutions, be explored in Stage 2.
Perhaps the best example of reclaimed water use in B.C. is in the City of Vernon. For over 40 years, Vernon has spray-irrigated treated effluent onto agricultural lands and golf courses instead of discharging into Okanagan Lake. However, as part of Vernon’s LWMP process, a number of issues were identified with the spray irrigation program, many of which would have to be considered for a similar program in Squamish. These include:
Maintaining an adequate customer base
Potential accumulation of microconstituents
Pumping Costs
Long-term storage needs, if discharge to surface water is to be avoided
Potential over application leading to potential hydrological issues
Cost of the reclamation system
Pricing of reclaimed water
Classification of reclaimed water (“Hazardous”)
Management and administration challenges with spray irrigation users
Standby power for the irrigation system, if discharge to surface water is to be avoided
As a first step to evaluate the feasibility of reclaimed water use in Squamish, the potential volume of reclaimed water that could be used on agricultural land was determined. Agricultural land that was considered included Agricultural Land Reserve (ALR) designated land within the District of Squamish boundary and within a 10 km radius of the Mamquam WWTP. The total ALR within this zone was found to cover approximately 630 ha and is illustrated on Figure 4-4 on the following page. The land illustrated does not depict active agriculture land, simply lands that are registered within the reserve. The 10 km radius was selected as an initial effort to constrain the expense of extending reclaimed water infrastructure to agricultural lands well outside of the existing sanitary infrastructure.
Squamish is one of the wettest inhabited locations in Canada, with over 2,300 mm of precipitation annually. Most of this precipitation occurs in the winter, from October through February, when average monthly precipitation can be around 300 mm. However, the summer months are relatively dry, when rainfall can be less than 60 mm in a month. This seasonal variation in water supply, and the need to regulate the higher demand for outdoor water use that comes with it, is the primary driver of the District’s Outdoor Water Use Bylaw.

Mamquam WastewaterMamquam WastewaterTreatment PlantTreatment Plant
kjM AMQUAM
RD
BAILEY ST
HWY 99 GOVERNMENT RD
WESTWAYAVE
H WY 99
SQUAMISHVL
YRD
GOVERNMENT
RD
HWY 99
THIRD AVE
CENT
ENNIA
LWA
Y
PARADISE VLY RD
SPIT RD
PARADISE VLY RD
FINCH
DR
HWY 99 HWY 99
HWY 99
HWY 99
CO PP
ER
DR
ROSS RDMAMQUAM
RIV FSR
CAT LKRD
SQUAMISH VLY RD
Source: Esri, DigitalGlobe, GeoEye, i-cubed, USDA, USGS, AEX, Getmapping, Aerogrid, IGN, IGP, swisstopo, and the GIS UserCommunity [
0 1 2 3 4Kilometers
Liquid WasteManagement PlanPotential Water
Re-use Opportunities
Figure 4.2U:\Projects_VAN\1928\0005\01\D-Drafting-Design-Analysis\GIS\Projects\MXD\Current\Figure 4.2 - ALRwithin10km.mxd Last revised by: bgushue on 23/05/2014 at 9:11:32 AM
THE ACCURACY & COMPLETENESS OF INFORMATION SHOWN ON THIS DRAWING IS NOT GUARANTEED. IT WILL BE THE RESPONSIBILITY OF THE USER OF THE INFORMATION SHOWN ON THIS DRAWING TO LOCATE & ESTABLISH THE PRECISE LOCATION OF ALL EXISTING INFORMATION WHETHER SHOWN OR NOT.
LegendDistrict of Squamish BoundaryALRALR within 10km of WTP andwithin District Boundary(Approx. 630 ha)
bdawney
Text Box
4-4

P a g e | 45
A rough estimate of irrigation requirements for agricultural lands in the region is 500 mm per growing season. Based on this amount, the estimated annual irrigation demand for 630 ha is 3,150,000 m3/year. The total annual reclaimed water production from the Mamquam plant is 2,830,000 m3/year. It is important to restate that the amount of active land and the need for irrigation is much less than the total amount of land in the reserve, which would create excess reclaimed volumes if this path was chosen.
4.9.1 Reclaimed Water Discussion Although the amount of available reclaimed water may provide a seemingly feasible source for irrigation demands, the story for reclaimed water is much more comprehensive. Consider the following bullets which influence the preliminary evaluation of reclaimed water in Squamish:
The environmental threshold in the Squamish River is high; therefore, protecting the receiving waters from treated effluent is not a driver for reclaimed water (which is a common driver for wastewater re-use).
Although precipitation during the growing season is much less than the winter there are few instances recorded of drought or water scarcity for agricultural users in Squamish. A very common alternative driver to protecting receiving waters is to find a suitable source that lessens the strain on other sources of agricultural water supplies. The source for agricultural irrigation is believed to be groundwater currently owned and operated by individual users. There are no known reports of agriculture users planning to convert to District water supplies.
Squamish’s focus on asset renewal has revealed the need to conservatively manage infrastructure and to cautiously build new systems, in particular doing so only when there is a positive business case for doing so; e.g., new growth is dense enough to support new infrastructure through taxes and utility rates. Receiving agriculture water rates (dollars) in exchanges for tens of kilometers of reclaimed water infrastructure typically does not yield a positive business case.
There is negligible interest in treated effluent re-use by industry at the present time.
Based on the above, there is not enough interest or apparent feasibility to further pursue reclaimed water use at this time. Future drivers for re-evaluating reclaimed water use include water scarcity, industrial opportunity for re-use or unexpected needs to protect receiving waters in the Squamish River.
4.10 Odour Control
4.10.1 Overview Odours have been discussed in multiple sections above and the issue is summarized again here to develop preferred direction.
Odours are currently noticed on a periodic basis typically when prevailing winds switch and create a plug-flow type plume of odour near the plant. There are rarely more than a couple complaints per year even though more and more residents call the neighborhood around the Mamquam Plant home.

46 | P a g e
Although the current process includes open air bioreactors, the primary source of odours comes from the DAF unit and the centrifuge as part of the biosolids handling process. Furthermore, unplanned and planned maintenance programs will inevitably create odours.
Odour monitoring will not eliminate odours; rather, it will provide improved information with which to design any future odour reducing equipment. By implementing a multi-year monitoring program the District can better communicate with the public and neighborhood residents about the severity of the issue and also communicate any reductions in odours as a result of the WWTP - Plan (Option #3). Recently, District staff received direction from Council to include short-term investments into odour monitoring at the plant in a long-term effort to mitigate odours.
4.10.2 Preferred Direction and Action Items It is recommended that the District conducts odour monitoring to characterize the issue at the treatment plant. With the data collected from the monitoring system, informed decisions can then be made as to what capital improvements (if any) are required to address any issues.
The proposed Option #3 for the WWTP Plan includes converting the bioreactors to MBBR and adding digestion which is expected to reduce odours (in part by eliminating the DAF unit altogether). An odour study should be conducted before and after new works are constructed, such as:
Before and after the smaller bioreactor is converted to MBBR in 2016
Before and after the larger bioreactor is converted to MBBR in 2019
Before and after the digester unit is constructed around 2020.
This means an odour study should be completed in 2015, 2017, 2019, and 2021. The studies will serve to characterize the significance of any odour issues and what, if any, impact is observed as a result of system upgrades over time.
To summarize the action items required to address potential odour issues, it is recommended that the District undertake the following:
Install an odour monitoring system at the treatment plant in 2015 ($75,000)
Conduct an odour study in 2015, 2017, 2019, and 2021 ($5,000 per study)
It is recommended that capital upgrades be completed only once the issue has been properly characterized and once possible impacts (benefits) of capacity upgrades are known.

P a g e | 47
4.11 Summary of WWTP - Plan and Cost Recovery The ultimate goal of the WWTP - Plan is that flows are discharged to the Squamish River without compromise to public or environmental health. To achieve this goal and the previously discussed objectives, the following objectives and actions are recommended. The cost of these actions and the recommended timeline by which they are implemented is also provided.
Objectives and Actions:
1. Increase capacity to keep pace with growth
Implement the I/I and Conservation flow management program including proposed budgets; implement capital improvements to reduce flows as business cases suggest.
Upgrade the Mamquam treatment plant to keep pace with growth as outlined in (2) below.
2. Improve effluent quality and treatment plant capacity to keep pace with regulations
Convert the older smaller bio-reactor to MBBR process in 2018. This should increase its processing capacity to 12,000 m3/d and provide the required 75% redundancy. ($1.1 M)
Construct UV disinfection system in 2017 ($0.95 M).
Construct an anaerobic digester in 2020. ($2.5 M)
Convert the second bio-reactor to MBBR process in 2021. ($2.0 M)
Operate the plant and fund for adequate maintenance ($5.1M over 20 years).
3. Optimize energy consumption and implement recovery where possible
Quantify energy savings from the proposed WWTP Plan Option #3 during preliminary design phases and report out savings to Council and the public; apply for rebates where possible to the utility
Determine Squamish’s contribution to resource recovery and energy savings by participating in the biosolids program with Whistler
Update the energy utility feasibility study for the downtown core as new developments trigger the need and based on recommendations by District planning staff
Replace equipment with more efficient and effective models as necessary and determined through business case means and through integration with the District’s asset renewal program
4. Maintain the biosolids program in a similar manner as to the current approach with the following enhancements
Creating a detailed agreement with Whistler for long-term biosolids processing
Optimize the trucking fleet by working directly with the District’s contracted service provider for biosolids handling and hauling

48 | P a g e
5. Monitor contaminant loading from landfill leachate collection system
Continue with monitoring as part of existing program and add biosolids testing (for leachate substances) if required by Whistler
Consider updating 1972 Sewage Usage Bylaw No. 401 to include more modern leachate quality standards (can be done in tandem with Source Control Program)
in addition the planned projects and program above, the District in tandem with the Ministry will establish an Operational Certificate which outlines regulatory requirements for plant operation and reporting. The draft Operational Certificate is provided in Appendix C.
With respect to costs of the WWTP – Plan, the 20-year expenditure projections and revenue structure are laid out in the following table.
Table 4-15 Wastewater Treatment Plant - Plan costs, allocation, and potential revenue sources
Major Program Component
Cost Breakdown: Capital and Annual
Cost Allocations Potential Revenue Sources
Capacity and Disinfection Upgrades
UV Disinfection System
Design: $142,000 (2015)
Construction: $810,000 (2016)
Annual: $73,000 (2017-2034 and ongoing)
70% by existing customers
30% by benefitting properties1
Sanitary Utility Fees/Reserves
DCCs
Convert Older Bio-Reactor to MBBR
Design: $165,000 (2017)
Construction: $935,000 (2018)
Annual: $40,000 (2019-2034 and ongoing)
70% by existing customers
30% by benefitting properties
Sanitary Utility Fees/Reserves
DCCs
Anaerobic Digester Design: $375,000 (2019
Construction: $2,125,000 (2020)
Annual: $160,000 (2021-2034 and ongoing)
35% by existing customers
65% by benefitting properties2
Sanitary Utility Fees/Reserves
DCCs
Convert Second Bio-Reactor to MBBR
Design: $300,000 (2020)
Construction: $1,700,000 (2021)
Annual: $40,000 (2022-2034 and ongoing)
99% by benefitting properties
DCCs
Odour Control
Monitoring System installation: $75,000 (2015)
Odour study: $5,000 (2015)
Odour study: $5,000 (2017)
70% by existing customers
30% by benefitting properties
Utility Fees

P a g e | 49
Major Program Component
Cost Breakdown: Capital and Annual
Cost Allocations Potential Revenue Sources
Odour study: $5,000 (2019)
Odour study: $5,000 (2021)
Total and Final Comments
$7,192,000 to 2021 for design and construction of required upgrades including a $550,000 contingency for potential charges incurred at the Whistler Compost facility.
$313,000 annually for all upgraded components once fully built-out
$95,000 for odour monitoring and studies to 2021
Total: $12,298,000 over 20 years including operations and capital charges
Includes $19,600 annually for influent, effluent and receiving water monitoring and reporting
Costs to be funded through a combination of sewer utility tax revenues, levies, and DCCs
Notes:
1. Existing residents will contribute approximately 70% of flows to the future 7-day high flow (11,325/16,050); therefore, 70% of funds should be covered by existing residents and 30% from future residents.
2. The digester will service both converted bio-reactors once they are operational. For the first reactor, future residents will cover 30% of the cost, but will cover 100% of the cost of the second, as it is required solely due to population growth. The allocation of funds from benefitting properties should therefore be ½ (30%) + ½ (100%), or 65%.

50 | P a g e
5.0 PROGRAM COMMITMENTS Based on community and Committee feedback and on the qualitative triple bottom line evaluation, three key programs and plans were identified for further evaluation in Stages 2 and 3. These include:
An Integrated Stormwater Management Plan (ISMP);
A Flow Reduction Program (I&I reduction and indoor water conservation); and
A Source Control Program
These programs and plans will be implemented in addition to the Enhanced Biosolids Program and the WWTP - Plan to address the priority liquid waste management issues in Squamish.
5.1 Integrated Stormwater Management Plan
5.1.1 Overview
What is it?
An Integrated Stormwater Management Plan (ISMP), also known as an Integrated Rainwater Management Plan (IRMP) and Integrated Watershed Management Plan (IWMP), is a comprehensive study that examines the linkages between drainage servicing, land use planning, and environmental protection. The purpose of an ISMP is to support the growth of a community in a way that maintains or, ideally, enhances the overall health of a watershed.
Integrated stormwater management planning requires shifting our perception of stormwater as peak flow to be drained and conveyed to the nearest receiving body of water, to that of a resource – rainwater – that can be harvested, treated, and beneficially re-used. Integrated stormwater management planning considers the entire water balance and looks at stormwater in terms of overall volume and quality; that is, the entire spectrum of rainfall events are considered, and tools and practices to manage the quantity and quality of stormwater generated during these events are identified and implemented. An ISMP can be a powerful tool that enables a municipality to set a clear direction for what the growing community – and its relationship with the environment – looks like.
Typically, ISMPs are developed according to the following four phases:
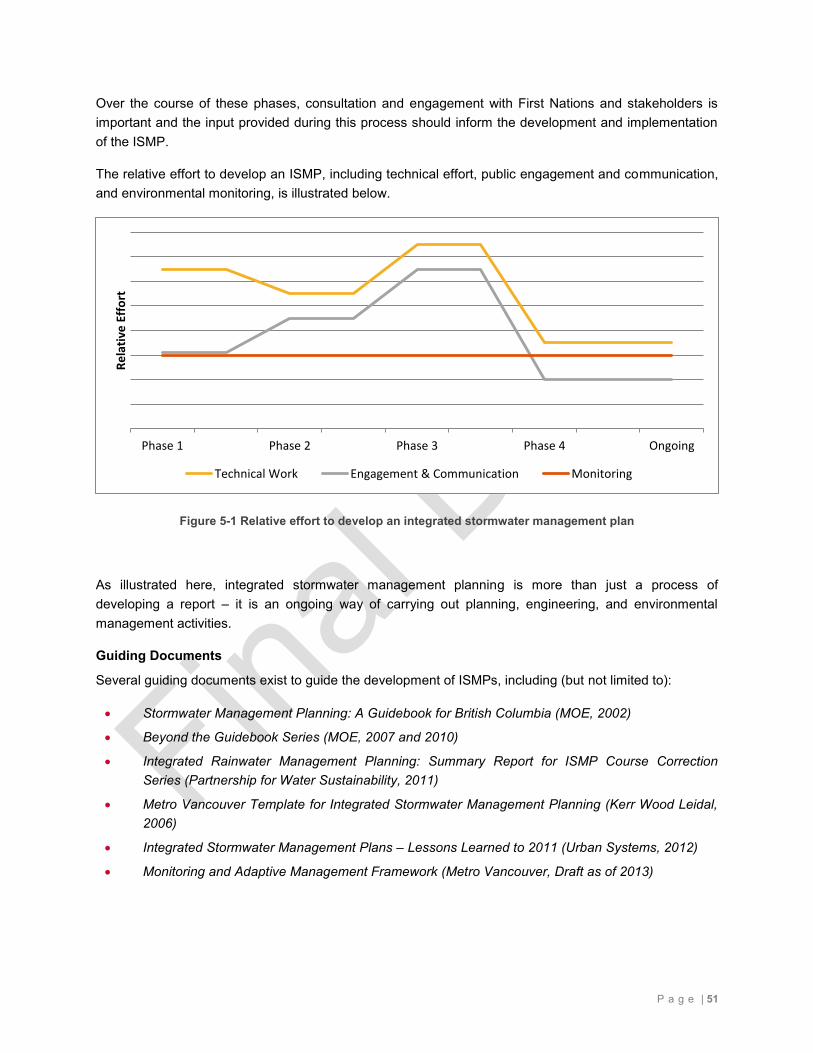
P a g e | 51
Over the course of these phases, consultation and engagement with First Nations and stakeholders is important and the input provided during this process should inform the development and implementation of the ISMP.
The relative effort to develop an ISMP, including technical effort, public engagement and communication, and environmental monitoring, is illustrated below.
Figure 5-1 Relative effort to develop an integrated stormwater management plan
As illustrated here, integrated stormwater management planning is more than just a process of developing a report – it is an ongoing way of carrying out planning, engineering, and environmental management activities.
Guiding Documents
Several guiding documents exist to guide the development of ISMPs, including (but not limited to):
Stormwater Management Planning: A Guidebook for British Columbia (MOE, 2002)
Beyond the Guidebook Series (MOE, 2007 and 2010)
Integrated Rainwater Management Planning: Summary Report for ISMP Course Correction Series (Partnership for Water Sustainability, 2011)
Metro Vancouver Template for Integrated Stormwater Management Planning (Kerr Wood Leidal, 2006)
Integrated Stormwater Management Plans – Lessons Learned to 2011 (Urban Systems, 2012)
Monitoring and Adaptive Management Framework (Metro Vancouver, Draft as of 2013)
Phase 1 Phase 2 Phase 3 Phase 4 Ongoing
Re
lati
ve E
ffo
rt
Technical Work Engagement & Communication Monitoring

52 | P a g e
As indicated by this list and also by the history of ISMPs development and implementation in the Lower Mainland and across B.C., a variety of resources and lessons learned are available to the District as it moves towards integrated stormwater management planning.
5.1.2 Moving Towards Integrated Stormwater Management Planning Typically, ISMPs are developed through significant engagement with local citizens, developers, First Nations, and other interested parties, and are a shared effort between engineering, planning, environmental, and finance staff. The successful development and implementation of ISMPs requires someone to champion the process, dedicated funding, and clear direction on where and how to begin. Therefore, it is in the intent of this LWMP to:
Provide preliminary identification of priority catchments in the District
Identify preliminary annual funding requirements
Propose a timeline for the development of ISMPs
Identify action items to prepare for integrated stormwater management planning
Beyond the preliminary steps identified in this LWMP, District staff and Council will benefit from the many lessons learned by Metro Vancouver municipalities, other communities in B.C., and beyond.
5.1.3 Priority Catchments and Watersheds The Metro Vancouver Template states that ISMPs are most effective when applied to watersheds that are 500 to 750 hectares (ha) in size. The Template further adds that ISMPs can be conducted on watersheds up to 1,500 ha in size; however, beyond that it may become too expensive to implement strategies that achieve a no-net loss within the watershed. However, ISMPs completed to date by Metro Vancouver municipalities have covered watersheds ranging from 200 to 2,500 ha in size. In any case, there should be a strong focus on prioritizing and sizing catchments based on their current and proposed level of developed area.
Pollutant loading is strongly correlated with land use and, by association, percent impervious area. For these reasons, industrial and commercial land uses typically generate the highest pollutant loads, as on-site practices coupled with high percent impervious areas significantly contribute to overall pollutant loading in a community. The evaluation of urban runoff quality in Stage 1 resulted in an estimation of the total pollutant loading, expressed as kilograms (kg), and pollutant loading rates, expressed as kilograms per hectare (kg/ha), for typical non-point source (NPS) pollutants. These pollutants and their estimated annual loads generated in the District include:
Total suspended solids (TSS) – 2,625,000 kg
Chemical oxygen demand (COD) – 2,994,000 kg
Total nitrogen (N) – 55,809 kg
Total lead – 765 kg
Fecal coliforms – 3,740 x 1012 colonies

P a g e | 53
Pollutant loading rates were estimated based on land use, and it was determined that pollutant loading is relatively very high in commercial areas. The existing issue will likely be intensified with development, as the 2008 OCP projects a 67% increase in commercial land use over the next 20 years. While the Stage 1 evaluation did not consider the quantity of urban runoff, it is widely known that impervious cover generates higher runoff rates than impervious cover (regardless of quality). Therefore, addressing existing and future commercial development represents “low hanging fruit” for the District in terms of return on investment: by addressing runoff generated from this land use, more immediate and significant environmental benefits are likely to be realized.
Much of the increase in commercial land use, and much of the community growth, is anticipated in South Squamish (shown as Catchment 3 on Figure 5.2 below). Therefore, developing and implementing ISMPs for this catchment in the near term should be considered high priority. It is anticipated based on the size of the catchment that at least two ISMPs will be required.
Figure 5-2 Drainage catchments in the District of Squamish
Note that these catchments do not correspond to B.C. government-delineated watersheds. There are five such watersheds within the District of Squamish, including: Stawamus, Alice Lake, Mashiter Creek, and two unnamed watersheds. Much of South Squamish is located outside of a delineated watershed, on the shores of Howe Sound. Therefore, for the purpose of this LWMP, prioritization has been characterized by drainage catchments within the District.
N

54 | P a g e
Once ISMPs are developed for the South Squamish area, the District should move on to areas further north, including Catchment 2, Catchment 1, and finally, Catchment 4. Further direction from the Ministry of Environment is required based on the size and schedule of delivering ISMPs for the proposed catchments. This direction is proposed to be received following completion of the LWMP and costs/funding requirements should be updated accordingly.
5.1.4 Action Items As the District moves towards integrated stormwater management planning, the following action items should be undertaken. Generally, it is recommended that the District take 1-2 years to prepare for ISMPs and then begin to develop them in 2016.
1. Identify an in-house ISMP “Champion” (2015)
Having an individual, or a small team, who is passionate about integrated stormwater management, wants to educate staff, Council and the public about the benefits of an integrated approach, has an influential voice in decision making processes, and is willing to see things through from conception to implementation and beyond, has made all the difference in conducting successful ISMP programs.
2. Prepare an ISMP Business Plan (2015-2016)
To set the foundation for the District’s ISMP program, we recommend that the District prepare an ISMP Business Plan. The Business Plan will assist in building integrated stormwater management planning into the overall services provided by the District, in establishing the lead coordinator(s) of the ISMP program, prioritize program implementation in the District, and bring the program in line with other relevant District business plans. Given the time typically involved in developing a Business Plan, we recommend that this initiative run concurrently with the monitoring and data collection program to ensure timely initiation of the monitoring program.
The following initiatives should be completed in support of the Business Plan:
a. Undertake an ISMP funding source review
Given the anticipated ISMP study costs outlined in Section 6, as well as potential ongoing monitoring and data collection costs, the current funding model needs to improve and increase by way of exploring alternative funding models for the ISMP program. Reliable long-term funding is critical typically by way of dedicated reserve building from specialized levies (taxes) or service fees. For example, there are hundreds of stormwater utilities throughout North America which would supplement other forms of revenue such as general revenues, development cost charges, external grants (e.g., B.C. Infrastructure Planning Grant), etc. Opportunities and constraints of each funding model should be identified and structured to maximize the available funding for the ISMP program. Additional considerations to the funding model include:
At a minimum, match the annual asset renewal levels required of the existing infrastructure based on already established asset management plans.
After drainage inventories and environmental assets are catalogued, update the asset renewal requirements and allocate costs to be developed and yet-to-be

P a g e | 55
developed properties (and consider whether to blend cost recovery and revenues into one location e.g. utility or to deliver stormwater programs through a variety of funding sources.
Fund additional capital required to protect and enhance environmental conditions (as determined through upcoming ISMPs) through existing funding mechanisms or through new cost recovery tools to be confirmed following completion of the LWMP.
Identify the appropriate administrative structure for implementing ISMPs and for evolving drainage services. Include the required full-time equivalent staffing, if any, that are required to deliver integrated stormwater services.
b. Conduct a Review and Gap Analysis of Existing District Bylaws, Policies and Criteria
While the ISMP scoping study conducted a cursory review of existing District bylaws, policies and criteria, we recommend that a more comprehensive review and gap analysis be undertaken to identify areas where current documents could be strengthened / improved to better support integrated stormwater management approaches. A regulatory review and gap analysis is a typical component of an ISMP; therefore, it would be more cost effective for the District to conduct this review once in advance of the ISMP program rather than through individual ISMPs.
As part of this review, the District will need to decide whether ISMPs will simply support existing land use plans or if an ISMP can recommend land use amendments if the health of a watershed could be improved as a result. Understanding and communicating this context will be a key factor in shaping the Terms of References for the various ISMPs.
c. Facilitate an Inter-Departmental Workshop on ISMPs
Early and frequent engagement of District staff from multiple departments (Engineering, Planning, Parks, and Environment at a minimum) is essential to buy-in and support for the ISMP program. We recommend that District Engineering staff facilitate an interactive and open discussion with multiple departments regarding integrated stormwater management planning in the District. Topics could include providing background information and education on ISMPs; review and refinement of the proposed ISMP methodology to align with ongoing planning assignments; open discussion to hear each department’s perspectives, priorities, issues and needs; summarize and learn about what other communities are doing about ISMPs, etc.
d. Host an ISMP Workshop with External Stakeholders
We also recommend that the District host a workshop with external stakeholders on integrated stormwater management in the District. Potential external groups could include:
Squamish River Watershed Society
Squamish Streamkeepers Society

56 | P a g e
Squamish Environment Society
Quest University
Major land developers
The intent of the workshop would be to introduce the concept of integrated stormwater management planning, state the District’s position on ISMPs (including priorities and timeframes), seek background information and feedback from the group, and identify key issues or concerns that external stakeholders may have with the process and/or watershed-specific issues. The District should also explore partnership opportunities with external stakeholders where it makes sense (e.g., monitoring and data collection).
e. Host an ISMP Workshop with Squamish Nation
Similar to the previous action item, we recommend that the District host a workshop (as described above) with Squamish Nation.
3. Initiate a District-wide Environmental Monitoring and Data Collection Program (2015)
Actions to address stormwater issues should be informed by a combination of science and local values. Sound scientific data make for a more technically robust ISMP – they give the District a strong understanding of the current condition and environmental thresholds of watersheds and inform the selection of best management practices, land use decisions, and other choices as part of the implementation plan. Finally, data are required in order to implement a truly adaptive management approach – that is, one that responds to the outcomes of previous efforts and improves on them over time. Data tell us how we are doing, and if our management practices are achieving their desired effect.
As described in Section 5.1.1, Phase 1 of the ISMP process involves taking inventory of available data and information. Therefore, the District should have a good inventory to work from. We recommend that the District initiates an environmental monitoring and data collection program as soon as possible in order to obtain adequate data for input in the first ISMPs. The Metro Vancouver Monitoring and Adaptive Management Framework (Draft as of 2013) (MAMF) requires that member municipalities collect and report hydrometric (stream flow), water quality, and benthic invertebrates data. Although the District is not a member municipality of Metro Vancouver and is therefore not required to do so, we recommend that the District follows a similar approach as outlined in the MAMF.
a. Establish a District-wide sampling protocol and reporting mechanism – to develop consistent sampling procedures for hydrometric, benthic invertebrate and water quality data collection, and a framework for reporting results. This initiative will establish a baseline to ensure that consistent sampling procedures are followed throughout the District for data collection.
b. Select monitoring site(s) – for each watershed where an ISMP is required, select appropriate sampling site(s) for the three types of data (hydrometric, benthic and water quality) to be collected. Sampling locations will be dependent on several factors, such as

P a g e | 57
the dominant stream characteristics at the sampling location, the dominant characteristics of the area draining to the sampling location, presence of active construction sites, site access for sampling, etc.
c. Decide who will be responsible for program implementation – the District, or streamkeeper groups with District oversight, could implement the monitoring and data collection program. The District should review staff capacity and interest and assign the responsibility for implementation accordingly.
Monitoring and data collection can be expensive; therefore, the establishment of a District-wide sampling protocol will be important to identify funding requirements. The District may need to adopt a phased approach to monitoring to suit funding limitations.
4. Complete the inventory of drainage infrastructure in the District (2015)
Further to the previous action item, an inventory of all stormwater assets is required to develop a baseline for infrastructure planning as part of the ISMP. The storm water system is made up of 31 km of storm water mains, multiple lift stations for major rainfall events, 420 catchbasins, and 72 km of drainage ditches. However, these are rough figures only because it is estimated that less than half of the drainage infrastructure has been properly inventoried and mapped. Any strategies arising from the ISMP should be supported by a complete drainage inventory.
5. Develop South Squamish ISMPs (2016-2018)
As the highest-priority catchment in the District, ISMPs should be developed for the South Squamish (Catchment #1) first. Based on the size of the catchment, it is anticipated that at least two ISMPs will be required.
6. Develop Remaining ISMPs (2020-2024)
Once the highest priority ISMPs are completed, the District should develop and implement ISMPs for the remaining catchments.
5.1.5 Funding Requirements and Cost Recovery Based on the 2011 Lessons Learned document, it is recommended that the District budget about $110 per hectare to develop ISMPs, which is at the low end of typical ISMP costs. The 20-year cost projections and revenue structure for ISMPs in Squamish are laid out in the following table.
able 5-1 Integrated Stormwater Management Planning costs, allocation, and potential revenue sources
Major Program Component
Cost Breakdown: Capital and Annual
Cost Allocations Potential Revenue Sources
Prepare for ISMPs
(Business Plan and Monitoring Program
Setup)
$100,000 Existing parcels/customers General tax based on existing funding to remain as-is

58 | P a g e
Major Program Component
Cost Breakdown: Capital and Annual
Cost Allocations Potential Revenue Sources
Environmental Monitoring Program
(Annual Costs)
$50,000 annually Existing parcels/customers
50%-100% by general tax based on existing funding to remain
0-50% by future user levies to be defined in 2016
ISMPs $230,000 in 2016
$230,000 in 2018
$180,000 in 2020
$180,000 in 2022
$180,000 in 2024
Costs for implementation TBD
Existing parcels/customers
50%-100% by general tax based on existing funding to remain
0-50% by future user levies to be defined in 2016
Total and Final Comments
$2,100,000 over 20 years to be funded through a combination of general tax revenues, user levies, and potentially some DCCs
5.2 Flow Reduction Program: Inflow and Infiltration and Indoor Water Conservation
5.2.1 Overview
Addressing Inflow and Infiltration
As previously stated, I&I currently adds an estimated average of 5,500 m3/d of flow to the WWTP. The recorded MWWF was approximately 16,400 m3/d in 2010 and over 14,000 m3/d in 2011; these are significant increases over the ADWF (7,200 m3/d in 2011) and even AWWF (8,300 m3/d in 2011). This highlights the need to reduce I&I, which may result in long-term savings at the WWTP.
For the purpose of the WWTP - Plan capacity upgrades, it was assumed that no improvements will be made in the collection system to reduce I&I and that new sewer extensions will be constructed to minimize I&I; that is, I&I is assumed to remain constant at 5,500 m3/d through to 2031. However, it is still in the District’s best interests to take focused steps to reduce I&I in the existing system, to ensure that new developments are constructed such that I&I is minimized, and to measure progress over time to determine the savings that may be realized at the treatment plant.
Squamish: Living Water Smart
British Columbia’s Water Plan, “Living Water Smart”, was released by the Provincial government in 2009. The District is currently undertaking a Water Master Plan (WMP) and it is anticipated that the WMP will comprehensively consider how goals of “Living Water Smart” can be realized in Squamish. For the purpose of this LWMP, water use was considered insofar as it relates to flow to the WWTP and the Squamish River.

P a g e | 59
“Living Water Smart” includes two key goals for water conservation:
By 2020, water use in B.C. will be 33 percent more efficient
Fifty percent of new municipal water needs will be acquired through conservation by 2020
Striving to achieve these goals will not only support the Province’s goals, but may result in significant cost savings from deferral of upgrades at the District’s WWTP. Using water more efficiently, and meeting half of new municipal water needs through conservation, will result in less flow to the WWTP and beyond to the Squamish River. Therefore, the District should seek to expand its current water conservation program to a more comprehensive one, both under this LWMP and the future WMP.
The District’s current water conservation efforts are focused on outdoor water conservation in the summer. The District employs a part-time Water Conservation Officer during the summer months to educate residents on, and enforce, its Outdoor Water Use Bylaw. The purpose of this bylaw is to support the effective management of supply and demand of water across the community during the summer months, when water supply is low and demand is high. To deal with this imbalance, the Outdoor Water Use Bylaw outlines restrictions for watering lawns during the summer to certain days and times (depending on location of residency), based on whether the water restrictions are in Stage 1, 2, or 3. In Stage 1, lawn watering is permitted at certain times two days per week; in Stage 2, this reduces to one day per week; and in Stage 3, no lawn watering or washing of vehicles is permitted.
In addition to enforcing the Outdoor Water Use Bylaw, the District provides information on the Outdoor Water Use Bylaw, water conservation tips, and other water system-related information on the District’s website.
Indoor Water Conservation Targets
To support B.C.’s provincial goals for water conservation, to help preserve liquid waste infrastructure, and to lessen the community’s impact on source water, it is recommended that the District aim for a 33% reduction in water use by 2025. This is a more realistic timeline for the District than B.C.’s target year of 2020.
5.2.2 Action Items To address the issue of high sanitary flows as a result of I&I and high indoor water use, the following action items are recommended:
Conduct an assessment of sewer pipe condition every 10 years to identify leaks and other condition-related issues ($63,000 annually starting in 2014)
Commission flow monitoring stations: four locations between 2015 and 2017 ($25,000 per station)
o Monitor flows for five years and then check progress with a sanitary flows study ($25,000 every five years)
Use this LWMP as a preliminary guide to the District’s Water Master Plan to shape the Water Conservation program (2014)
Develop outreach materials to target indoor water use and excessive ICI water users (2015-ongoing)

60 | P a g e
Develop incentives for residents to use low-flow toilets and high-efficiency appliances such as washing machines and dishwashers (2015-ongoing)
Implement action items in the Water Master Plan (2015-ongoing)
5.2.3 Funding Requirements and Cost Recovery The Provincial government is continually updating the criteria for provincial infrastructure grants. The provincial infrastructure grant website indicates that a “water demand management plan” is required before local governments can apply for water related infrastructure funding. It is assumed that the District’s Water Master Plan, currently under development, will be a step towards fulfilling this requirement. There is potential for receiving grant funding for water related infrastructure; however, for the purpose of this LWMP, grants have not been included in the potential cost recovery mechanisms.
Note that the estimated annual costs of $63,000 for sewer condition assessments and $25,000 for indoor water conservation are derived as follows:
Sewer condition assessments can be conducted at a cost of approximately $6 per lineal meter; therefore, for approximately 105 km of sewer pipe, the annual cost to assess all pipes every 10 years is about $63,000.
The average water conservation cost per person is approximately $1.50; therefore, for the District’s current population, the approximate annual cost is $25,000. The amount is projected to grow gradually to account for new population and the dynamic needs of a conservation plan.
The Provincial government is continually updating the criteria for provincial infrastructure grants. The provincial infrastructure grant website indicates that a “water demand management plan” is required before local governments can apply for water related infrastructure funding. It is assumed that the District’s Water Master Plan, currently under development, will be a step towards fulfilling this requirement. There is potential for receiving grant funding for water related infrastructure; however, for the purpose of this LWMP, grants have not been including in the potential cost recovery mechanisms.
The 20-year cost projections and revenue structure for a Flow Reduction Program in Squamish are laid out in the following table.
Table 5-2 Flow Reduction Program costs, allocation, and potential revenue sources
Major Program Component
Cost Breakdown: Capital and Annual
Cost Allocations Potential Revenue Sources
Sewer Condition Assessments
$63,000 annually 70% by existing customers
30% by future customers
100% by Sanitary Utility Fees

P a g e | 61
Major Program Component
Cost Breakdown: Capital and Annual
Cost Allocations Potential Revenue Sources
Flow Monitoring Stations and Progress
Studies
$50,000 (2015)
$50,000 (2016)
$25,000 (2020)
$25,000 (2025)
$25,000 (2030)
70% by existing customers
30% by future customers
100% by Sanitary Utility Fees
Indoor Water Conservation
$25,000 (2015), increasing by $1,000 every year to account for population growth.
70% by existing customers
30% by future customers
50% by Sanitary Utility Fees and 50% by Water Utility Fees
Total and Final Comments
$2,125,000 over 20 years to be funded by user fees
5.3 Source Control Program
5.3.1 Overview
What It Is
A source control program (SCP) focuses on the reduction or elimination of contaminants at their source, before they enter the sewer system. This preventative approach serves two key purposes:
Protect wastewater treatment facilities by contributing to the longevity of infrastructure
o Targeting contaminants at the source means that fewer contaminants are conveyed through the sewer system to the WWTP, thereby reducing contaminant loading on the plant.
Protect the receiving environment (in this case, the Squamish River)
o Reducing contaminant loading on the WWTP will help ensure that the treatment processes remain efficient and effective, thereby reducing the potential for contamination of the Squamish River.
The Current Program
The District initiated a source control program (SCP) in 2013, aimed at targeting significant sources of pollution from industrial, commercial and institutional (ICI) land uses.
Targets fats, oils and grease (FOG)
Supports relationship building with local ICI members of the community and District staff
Builds awareness

62 | P a g e
5.3.2 Moving Towards a More Comprehensive Program It is recommended that the District continues with the newly established SCP and over time, begins to move to a more comprehensive program as early gains are made. The intent is that the District should model its SCP after the Capital Regional District’s (CRD’s) program but tailor it to Squamish’s priorities and resources. This includes incorporating the following over the next 20 years:
Monitoring
Identify priority contaminants (currently, these are FOG but this may change as the community grows)
Establish targets for influent wastewater quality
Monitor influent quality to determine the effectiveness of source control efforts
Regulations and Enforcement
Identify major polluters (currently, these are suspected to be local ICI land users)
Continue to build relationships with residents and businesses
Enforce the Sewer Use Bylaw by conducting site audits, and fine those in breach of the bylaw accordingly
Public Outreach and Education
Build awareness among residents and businesses about the importance of source control through outreach and education initiatives

P a g e | 63
A high-level summary of what this SCP could look like is illustrated below:
The effectiveness of the program should be evaluated every five years and updated as needed. A Source Control Progress Study could be completed for approximately $10,000 every five years in addition to the $30,000 annual costs.
5.3.3 Action Items
1. Follow current program for the next 2-3 years
2. Update Sewer Use Bylaw (can be done concurrently with leachate/biosolids review)
3. Transition to the more comprehensive program over time
5.3.4 Funding Requirements and Cost Recovery This program is currently funded from general revenues; however, it is recommended to consider shifting the cost of the program to user fees given its linkages to water quality and quantity management for both sanitary and storm services. The 20-year cost projections and revenue structure for the Source Control Program in Squamish are laid out in the following table.
Squamish Source Control
Program
Environmental Monitoring
Identify priority contaminants
Establish targets
Monitor for compliance
Regulations and Enforcement
Identify major polluters
Build relationships
Enforce regulations Public Outreach and
Education
ICI
Residential
Focus on prevention
64 | P a g e
Table 5-3 Source Control Program costs, allocation, and potential revenue sources
Major Program Component
Cost Breakdown: Capital and Annual
Cost Allocations Potential Revenue Sources
Source Control Annual Costs
(currently budgeted for)
$30,000 annually 70% by existing customers
30% by future customers
0% - 100% General Tax (depending on whether this program shifts to either stormwater covered by general utilities or sanitary utilities, or both)
Progress Studies $10,000 (2019)
$10,000 (2024)
$10,000 (2029)
$10,000 (2034)
70% by existing customers
30% by future customers
0% - 100% General Tax (depending on whether this program shifts to either stormwater covered by general utilities or sanitary utilities, or both)
Total and Final Comments
$640,000 over 20 years to be funded by general tax revenues, moving towards user fees

P a g e | 65
6.0 LIQUID WASTE MANAGEMENT PLAN SUMMARY AND COSTS
This section summarizes the recommended actions, costs and cost recovery methods to implement the LWMP.
6.1 Managing Costs and Service Levels It is common for any LWMP to increase service levels for a variety of water-environment programs within the community. There are multiple reasons for this with one primary factor being representation on the Committee by members of the community who place water quality and ecosystem health at the top of their values. Their perspectives encourage a forward-looking LWMP that fulfills the Provincial objective to safeguard public health and the environment. Yet, it is also the objective of the Project Team, the Committee, District Staff and Council to balance any increases in service levels with a mix of cost-savings and new revenues to offset the budget-impact of the proposed programs. It is also recommended to adopt a user-pay financing approach whereby those entities that benefit from the proposed works also pay their fair share for making the project a reality.
6.2 Summary of Costs A summary of the major LWMP components, the timeline by which they should be implemented, costs per year over the 20-year horizon (including capital and annual costs) and revenue sources, is provided in Table 6.1 to conclude this section.
The total costs per year (including capital and annual costs) are summarized on Figure 6.1, which precedes Table 6.1.
Recommendations for priority programs and projects and their associated budgetary value over 20 years for Squamish’s 2014 LWMP are outlined below.
Enhanced Biosolids Program (no additional costs to create the agreement; $550,000 included as a capital contingency)
Develop a long-term agreement (e.g. partnership) with Whistler for receiving biosolids from the District to address concerns related to tipping fees, long-term security and overall handling of biosolids.
Only revisit biosolids management options and determine a District-led program if a mutually beneficial partnership does not materialize with Whistler.
Reconsider the feasibility of a neighbourhood energy utility as new developments are approved in the downtown core and upon direction from District Council because the need for the utility is directly related to the types of new energy facilities developed.
Conduct a business case to optimize biosolids dewatering and hauling e.g. to reduce costs of trucking to alleviate the footprint of the regional program, where possible.

66 | P a g e
Proceed with the WWTP - Plan including process changes to biosolids and digestion as a means to regulate the product and reduce odours.
Initiate biosolids quality monitoring (started in 2014) if required as part of the agreement with Whistler.
Any future capital or operating costs arising at the Whistler facility to be borne by Squamish to accommodate its biosolids (as determined within the agreement) are not known and therefore not included here.
Leachate Management Plan (no additional costs)
Continue the annual leachate monitoring program at the landfill (ongoing) to characterize the ongoing and long-term effects at the WWTP.
Wastewater Treatment Plant - Plan ($12,303,000 for both capital and operating costs)
Design and construct an ultraviolet disinfection system to disinfect sewage effluent based on the results of the Environmental Impact Study on the Squamish River and based on feedback from the Ministry of Environment.
Convert the older bio-reactor to Moving Bed Bioreactor (MBBR) to increase the capacity of the WWTP to achieve compliance with redundancy requirements of the Municipal Wastewater Regulation.
Convert the newer bio-rector to MBBR to increase the capacity of the WWTP to increase capacity and accommodate growth at lowest net-present value cost.
Design and construct an anaerobic digester to increase the capacity of the WWTP to reduce odours and to recover heat energy for use at the WWTP.
Monitor and report on potential odour issues to define the issue for future improvements and to to support communications to local residents.
Implement odour control measures as needed based on monitoring program.
Integrated Stormwater Management Planning ($2,100,000)
Prepare for integrated stormwater management planning in Squamish based on the objective of a LWMP to safeguard the environment from stormwater and sanitary sources.
Develop ISMPs for priority catchments to improve stormwater quality entering watercourses to define risks to environment throughout the District and develop watershed-specific tactics to improve water quality.

P a g e | 67
Flow Reduction Program: Inflow and Infiltration and Indoor Water Conservation ($2,125,000)
Assess sewer pipe conditions in an ongoing manner to keep pace with renewal and to decrease risk of failure and surfacing of sanitary waste.
Commission flow monitoring stations to monitor for inflow and infiltration as well as to improve flow projects for utility management and finance.
Monitor and report on flow reduction efforts.
Target indoor water conservation to reduce excess water consumption and extend capacity at the WWTP.
Source Control Program ($640,000)
Follow the current source control program for approximately 3 years and review effectiveness with respect program objectives.
Update the Sewer Use Bylaw (concurrently with biosolids/leachate review) based on concerns that the 15 year old Bylaw is not congruent with current sewer utility management practices.
Transition to a more comprehensive program based on the varied and broad nature of source control issues following the review in 3 years of the existing program.
The total cost to develop and implement the programs and plans of the LWMP as laid out above is estimated at $17.17 million over 20 years. However, some programs listed above (approximately $0.88 million) are already an annual budget item (e.g. Source Control Program) therefore the net LWMP costs as it relates to LWMP financing is $16.29 million over 20 years. Overall, the costs for these programs and plans will be recovered through a combination of general tax revenues, utility fees, and development cost charges.
6.3 Cost Recovery Summary Previous sections of this report outlined how to allocate the costs from changes to levels of service and their preferred funding sources (e.g. benefitting properties such as DCCs or utility fees). This section provides a summary of the funding sources for the costs of the LWMP.
Sewer Utility Fees: the sewer utility rates are in the last year of a phased increase to account for asset renewal and increasing costs of owning and operating the system. From 2010 to 2014 the sewer rates have increased in Squamish by 10% to 15% per year and 2015 is slated to increase in a similar manner. A utility fee increase of 10% was incorporated into the financial model which in part, enabled the schedule of projects (note: if the utility fee increase were to change the LWMP schedule should be redone). Overall, almost half of the costs for the LWMP including most of the costs for treatment projects, sewer related source control, inflow and infiltration and sewer operating costs will be covered by utility fees and reserves (total of $10.13 million).

68 | P a g e
It should also be noted that although the capital and operating costs of the biosolids management agreement with Whistler are not known at this time, future costs are likely to be recovered through enhanced sewer utility fees.
Water Utility Fees: water conservation programs are funded currently through the water fund and are proposed to remain as such. Given that demand reductions benefit both water and sewer utilities, there may rationale to share costs. However, the model includes all cost recovery for conservation from the water fund (total $690,000).
Development Cost Charges: all development cost allocations are itemized throughout the report on a per project basis, with approximately $3.37 million (total) attributed to growth. The District is preparing to update the DCC Bylaw to account for the LWMP projects and to complete other adjustments to the charge. It is important to point out that DCC reserves are expected to be very low (if not exhausted by 2018) which can impact the schedule of treatment upgrades proposed from 2019 to 2021. Two strategies to prepare for the potential shortage of funds in 2018 are to:
Build reserves from growth occurring between 2015-2018 help pay for capital works between 2019 and 2021, and
Borrow with the intent to payback the debt through development charges collected soon after the funds are borrowed (i.e. the projects are listed in the bylaw
Generally, the approach to including DCCs into cost recovery for the LWMP remained centered on development paying its fair-share.
Given the high level of projected growth in Squamish, the introduction of integrated stormwater planning and the public interest in green infrastructure, some consideration to alternative development financing should also be considered to offset the costs of new works and to encourage innovative solutions to protect waterways.
General Taxation: with respect to LWMP costs, revenues from property taxes in Squamish are directed to roads and associated drainage works. Therefore, the costs for integrated stormwater planning and monitoring as outlined in the LWMP are projected to be recovered through taxes (financial model includes ISMP funding of $2,100,000 through general taxation). Also, the current and historic budget levels for stormwater are heavily weighted towards flood protection. Given that stormwater service levels are increasing (e.g. integrated planning) and that flood service levels are expected to change (as a result of the integrated flood hazard management plan), there is likely a strong need to analyse whether roll rates for taxes will be sufficient. This would also be an opportune time to evaluate the benefits of a stormwater-flood utility with dedicated funding sources.
As a final note, the feasibility of receiving senior government funding is difficult to predict therefore grants were not included in the model (but would speed up the schedule). This financial model was developed using the District of Squamish’s financial model which includes its own select assumptions. The discussion above and the graph below act as a summary for the model and conclude the LWMP report.

P a g e | 69
Figure 6-1 Total cost of liquid waste management plans and programs
0
200,000
400,000
600,000
800,000
1,000,000
1,200,000
1,400,000
1,600,000
1,800,000
2,000,000
2,200,000
2,400,000
2,600,000
2,800,000
3,000,000
2015 2016 2017 2018 2019 2020 2021 2022 2023 2024 2025 2026 2027 2028 2029 2030 2031 2032 2033 2034
Tota
l Co
st (
$)
Year
WWTP Annual ISMPs Flow Reduction Source Control WWTP Capital

Table 6.1 Summary of liquid waste management programs and plans, costs, and revenue sources
WWTP Game Plan
Capital
UV Disinfection 142,000 810,000 952,000
MBBR Conversion #1 165,000 935,000 1,100,000
Anaerobic Digester 375,000 2,125,000 2,500,000
MBBR Conversion #2 300,000 1,700,000 2,000,000
Odour Control 80,000 5,000 5,000 5,000 95,000
RMOW Compost Contingency 550,000
Subtotal 222,000 810,000 720,000 935,000 380,000 2,425,000 1,705,000 7,197,000
Annual
UV Disinfection 73,000 73,000 73,000 73,000 73,000 73,000 73,000 73,000 73,000 73,000 73,000 73,000 73,000 73,000 73,000 73,000 73,000 73,000 1,314,000
MBBR Conversion #1 40,000 40,000 40,000 40,000 40,000 40,000 40,000 40,000 40,000 40,000 40,000 40,000 40,000 40,000 40,000 40,000 640,000
Anaerobic Digester 160,000 160,000 160,000 160,000 160,000 160,000 160,000 160,000 160,000 160,000 160,000 160,000 160,000 160,000 2,240,000
MBBR Conversion #2 40,000 40,000 40,000 40,000 40,000 40,000 40,000 40,000 40,000 40,000 40,000 40,000 40,000 520,000
Environmental Monitoring 19,600 19,600 19,600 19,600 19,600 19,600 19,600 19,600 19,600 19,600 19,600 19,600 19,600 19,600 19,600 19,600 19,600 19,600 19,600 19,600 392,000
Subtotal 19,600 19,600 92,600 92,600 132,600 132,600 292,600 332,600 332,600 332,600 332,600 332,600 332,600 332,600 332,600 332,600 332,600 332,600 332,600 332,600 5,106,000
WWTP TOTAL 241,600 829,600 812,600 1,027,600 512,600 2,557,600 1,997,600 332,600 332,600 332,600 332,600 332,600 332,600 332,600 332,600 332,600 332,600 332,600 332,600 332,600 12,303,000
ISMPs
Capital
ISMP Preparation 100,000 100,000
ISMPs 230,000 230,000 180,000 180,000 180,000 1,000,000
Subtotal 100,000 230,000 230,000 180,000 180,000 180,000 1,100,000
Annual
Monitoring 50,000 50,000 50,000 50,000 50,000 50,000 50,000 50,000 50,000 50,000 50,000 50,000 50,000 50,000 50,000 50,000 50,000 50,000 50,000 50,000 1,000,000
Subtotal 50,000 50,000 50,000 50,000 50,000 50,000 50,000 50,000 50,000 50,000 50,000 50,000 50,000 50,000 50,000 50,000 50,000 50,000 50,000 50,000 1,000,000
ISMP TOTAL 150,000 280,000 50,000 280,000 50,000 230,000 50,000 230,000 50,000 230,000 50,000 50,000 50,000 50,000 50,000 50,000 50,000 50,000 50,000 50,000 2,100,000
Flow Reduction
Capital
Flow Monitoring 50,000 50,000 100,000
Flow Reduction Studies 25,000 25,000 25,000 75,000
Subtotal 50,000 50,000 25,000 25,000 25,000 175,000
Annual
Indoor water conservation 25,000 26,000 27,000 28,000 29,000 30,000 31,000 32,000 33,000 34,000 35,000 36,000 37,000 38,000 39,000 40,000 41,000 42,000 43,000 44,000 690,000
Sewer Condition Assessments 63,000 63,000 63,000 63,000 63,000 63,000 63,000 63,000 63,000 63,000 63,000 63,000 63,000 63,000 63,000 63,000 63,000 63,000 63,000 63,000 1,260,000
Subtotal 88,000 89,000 90,000 91,000 92,000 93,000 94,000 95,000 96,000 97,000 98,000 99,000 100,000 101,000 102,000 103,000 104,000 105,000 106,000 107,000 1,950,000
FLOW REDUCTION TOTAL 138,000 139,000 90,000 91,000 92,000 118,000 94,000 95,000 96,000 97,000 123,000 99,000 100,000 101,000 102,000 128,000 104,000 105,000 106,000 107,000 2,125,000
Source Control
Capital
Efectiveness Studies 10,000 10,000 10,000 10,000 40,000
Subtotal 10,000 10,000 10,000 10,000 40,000
Annual
Bylaw enforcement, outreach 30,000 30,000 30,000 30,000 30,000 30,000 30,000 30,000 30,000 30,000 30,000 30,000 30,000 30,000 30,000 30,000 30,000 30,000 30,000 30,000 600,000
Subtotal 30,000 30,000 30,000 30,000 30,000 30,000 30,000 30,000 30,000 30,000 30,000 30,000 30,000 30,000 30,000 30,000 30,000 30,000 30,000 30,000 600,000
SOURCE CONTROL TOTAL 30,000 30,000 30,000 30,000 40,000 30,000 30,000 30,000 30,000 40,000 30,000 30,000 30,000 30,000 40,000 30,000 30,000 30,000 30,000 40,000 640,000
All LWMP Plans and Programs
TOTAL, ALL COSTS 559,600 1,278,600 982,600 1,428,600 694,600 2,935,600 2,171,600 687,600 508,600 699,600 535,600 511,600 512,600 513,600 524,600 540,600 516,600 517,600 518,600 529,600 17,168,000
20252015 2016 2017 2018 2019 2020 2021 2022 2023 202420-year
total2032 2033 20342026 2027 2028 2029 2030 2031

70 | P a g e
Appendix A
Public Consultation Materials

1.0 APPENDIX A: COMMUNITY PARTICIPATION
1.1 Combined Local and Technical Advisory
Committee
The District established a Combined Local and Technical Advisory Committee (the Committee) to represent both public and technical advisors within the community. The Committee’s main objective was to provide input on the overall direction for the LWMP by focusing on the public perspective and acting as a liaison with the community at large.
The Committee was engaged in all stages of the LWMP, as summarized below:
Date Objective Key Messages from the Committee
Meeting
August 2, 2012 Share technical knowledge; review and discuss common principles of LWMP in Squamish; Determine the Committee’s top priorities and principles; discuss how to manage the District’s assets and optimize existing sanitary sewerage operations.
Protect Squamish River and investigate odours at the WWTP. Fish and fish habitat are priorities. Biosolids needs a secure future.
Survey
October 2012 Survey Committee to confirm knowledge gained and begin to orient thinking from issues and opportunities to ideas for solutions.
LWMP is the correct tool for Squamish’s issues. Strong interest in long-term financing for stormwater. Education and outreach needed.
Meeting
October 11, 2012 Reaffirm LWMP objectives and process; provide a clear picture of the benefits, issues and problems resulting from current liquid waste practices in Squamish; provide a long list of potential management options for improvements and plans for the future.
Reaffirm priorities for liquid waste management as outlined in report. Strong interest to carry forward and further discuss management options. Life cycle cost-evaluations will help with decision making.
Treatment Plant
Tour November 13, 2012
Conduct a wastewater treatment plant tour (treatment and sludge processing) with District staff.
n/a
Meeting
November 22, 2012 Discuss collection systems, biosolids, and stormwater; discuss existing treatment plant, compliance, and considerations for the future.
Education and outreach are required to make a significant impact on the environment. WWTP game plan must address lack of disinfection.

Meeting
March 17, 2014 Share the results of the Outfall Assessment and Environmental Impact Study; receive input on disinfection options for Squamish.
Review of environmental concerns in Squamish river as it relates to treated effluent discharge. UV disinfection preferred.
Meeting
May 14, 2014 Review all programs and projects including summary of costs and revenues.
Proceed with programs and projects ensuring growth pays its fair share. Source control program should be expanded 2-3 years into the future to include both sanitary and stormwater practices.
Stage 2-3 Report
Review
Circulate Draft Stage 2-3 report to Committee members to solicit final feedback on the management plan.
TBD
1.2 Public Open Houses
In addition to Committee meetings, the District involved the local community by holding Open Houses through all stages of the LWMP both to inform the public about the LWMP process and to seek input on the plan as it was developed. The following table summarizes the community engagement process as part of the LWMP. Materials that were developed as part of the process are also included in this Appendix.
Date Objective Key Messages from the Public
Open House #1
February 6, 2013 Inform the public about the LWMP objectives and process; receive input regarding issues, priorities, and potential liquid waste management options.
Agreement that LWMP was a good approach to addressing sanitary and stormwater issues. Fish and fish habitat need attention.
Open House #2
July 27, 2013 Inform the public about the LWMP objectives and process; receive input regarding issues, priorities, and potential liquid waste management options.
Concerns, questions and ideas were raised regarding WWTP odours, options for organic biosolids, sea level rise and diking, the landfill, WWTP capacity and treatment, and water use.
Brochure Survey
July-August 2013 Receive input on priorities and concerns and how the public can contribute to protecting the local water environment.
Strong support for biosolids management including maximize re-use in the region. Employ green infrastructure where possible. Water conservation is okay.
Open House #3
March 16, 2014 Share the results of the Outfall Assessment and Environmental Impact Study; receive input on disinfection
Strong support for UV disinfection over chlorination; concerns and support (mixed) for water conservation; user-

options for Squamish.
pay pricing should be considered. Support for informing the public as a means to incentivise behaviour change.
Open House #4 June 7, 2014
Inform the public about the anticipated costs of the LWMP’s programs and plans, and seek input on cost recovery options. In addition to being able to review a visual presentation and converse with Urban and District staff, the public was offered to complete a survey regarding LWMP priorities and cost recovery mechanisms.
Addressing capacity and UV treatment were generally identified as being priorities for WWTP upgrades. Mixed support for an environmental services fee; generally, people seemed to support the concept of environmental revenues but would like to see government efficiency as well.
1.3 Council Presentations
All council meetings are public and input from Council leads to decision making regarding the final Stage 2-3 report including levels of service, budgets and financing.
Date Objective Key Messages from the Public
Council
Presentation #1
December 12, 2012
Provide an overview of Stage 1 process and findings and receive endorsement to continue to Stage 2-3.
Proceed to Stage 2-3.
Committee of the
Whole #1
August 19, 2014
Review full LWMP including program descriptions, costs, levels of service and revenues.
TBD
Council
Presentation #2
Fall 2014
Receive support for the Stage 2-3 report and receive endorsement to submit the plan to the Ministry of Environment.
TBD
The summary of feedback received from the Committee, Council and the public is contained within the Stage 1 Report and the Stage 2-3 Report, particularly as the feedback relates to the management plan.

Sample Consultation Materials 2012 - 2014

LIQUID WASTE MANAGEMENT PLAN
What is a LWMP?
A LWMP outlines a 20-year strategic plan for a local government to:
Finance and manage waste water resource recovery
Responsibly dispose of treated waste water
Adapt to the needs of a growing population
This must be done in a manner that is sufficiently protective of
public health and the environment
Public consultation is a key element of this process

A LWMP enables a community to create the vision and road map for systematic improvement of its watershed, through sanitary
and urban runoff programs.
The two primary objectives of a LWMP are:
consult the public and protect the environment
Objectives of a LWMP
STAGES OF A LWMP
Discuss principles and vision
Define issues and create a list of possible solutions
Costing of solutions
Create a list of preferred solutions
Technical analysis
Create a list of preferred solutions
Receive approval by the Ministry of the
Environment
Costing of solutions
Selection of best apparent alternative
STAGE 1: IDENTIFY COMPLETE
STAGE 2: EVALUATE PRESENT
STAGE 3: ADOPT FUTURE
Document the plan

Issues and Opportunities Identified in Stage 1 of the LWMP
Stormwater Urban runoff
Sources of pollutants High-level considerations for growth
Sensitive environment areas
Community Growth and Planning Considerations from Service Squamish
Official Community Plan and Growth Management Strategy Growth and land use changes
Treatment Treatment standards
Quality and quantity risks Receiving water conditions
Collection Quality and quantity of waste water
Infrastructure and growth
Biosolids Biosolids/compost quality
Transportation Market demands for the finished product

Highest Priorities for Stage 2
Reducing inflow and infiltration and their impact on flow, and improving accuracy of flow estimates
Knowing how Squamish will grow: the impacts and costs of growth, and the reliability of population projections
Disinfection options for treated effluent
a. Reducing pollutants in urban runoff
b. Creating a complete database of infrastructure and flows
c. Turning our investments into environmental improvements
Environmental Impact Study
TRIPLE-BOTTOM LINE PRIORITIZING
Protecting streams and preserving fish habitat by:
What is most important for the LWMP?

Options to Address the Issues According to the Priorities
Liquid Waste Management
Option - Program
Key Topics and Examples of Stage 2 Analysis
Wastewater Treatment Plant Game Plan
• Meeting Municipal Wastewater Regulations • Improving nutrient removal • Introducing upgrades as the population grows
Squamish Biosolids Program
• Identifying market and customer opportunities • Determining local and regional government roles • How can this be financed?
Reduce Sanitary Flows I&I and Water Use
• Incentives for household water conservation • Setting reduction targets • Obtaining accurate sanitary flow measurements
Source Control: Influent Quality Leadership
• Reducing fats, oil, grease, metals, etc. • Public education programming • Meeting regulations/permitting, etc.
Leachate Optimization • Landfill processes such as discharge • Opportunities and constraints • Flow and concentration management
Reclaimed Water: Feasibility Check
• Opportunities for readily apparent use of reclaimed water for agriculture and industry
Squamish ISMP • Integrated Stormwater Management Plan (ISMP) • Reducing common urban runoff pollutants • Addressing the impact of population growth

Summary
Concerns & Ideas
Consulting the public throughout the development of a LWMP is a key element of the process.
Your concerns and ideas regarding the options for liquid waste management and the direction of District of Squamish LWMP
are appreciated.

liquid waste management plan

Outlines a 20-year strategic plan for a local government to:
Finance and manage waste water resource jJrecovery Responsibly dispose of treated waste water
Adapt to the needs of a growing population
What is a liquid waste management plan (LWMP)?
TREATMENT - Treatment standards; Quality and quantity risks; Receiving water conditions
COLLECTION - Quality and quantity of waste water infrastructure and growth
BIOSOLIDS - Biosolids/compost quality; Transportation; Market demands for the finished product
STORMWATER - Urban runoff; Sources of pollutants; High-level considerations for growth; Sensitive environment areas
COMMUNITY GROWTH AND PLANNING - Considerations from Service Squamish, Official Community Plan and Growth
Management Strategy; Growth and land use changes
This must be done in a manner that is sufficiently protective of public health and the environment. Public consultation is a key element of this three-stage process.
ISSUES AND OPPORTUNITIES IDENTIFIED IN STAGE 1 OF THE PROCESS

How do we decide which options are best for Squamish?

what should our liquid waste management plan look like?
Our LWMP will help ensure Squamish remains a vibrant and resilient community into the future.
It should reflect our values, concerns, and ideas.
In your view, what are the biggest priorities and/or concerns regarding our water environment? (e.g., rivers, streams, Howe Sound, etc.)
Treatment plant effluent quality Stormwater runoff Other: ____________________
Impacts of growth High water use/flows Other: ____________________
How can you see yourself contributing to protecting our water environment?
Conserving water Being mindful of what I pour down
the drain Other: ____________________
Having my own rain garden Contributing to new programs Becoming more informed Other: ____________________
Please share your concerns, ideas, or comments

Date: March 16, 2014 To: David Roulston, District of Squamish cc: Trevor Hamelin, Ministry of Environment From: Brittney Dawney, Ehren Lee, Urban Systems File: 1928.0005.01 Subject: Memorandum – Liquid Waste Management Plan – Stage 2-3 Open House #3: Farmers’
Market This memorandum summarizes a recent public consultation event as part of the process for the District of Squamish (the District) Liquid Waste Management Plan (LWMP). Public consultation is a key element of the LWMP development process as stated by the Ministry of Environment but also because the longevity of the plan hinges on local support for the selected projects and programs. Receiving public input shapes the final plan. Included with this memo are the information materials disseminated during the event (appended) and a compilation of residents’ views and input that were shared with the Open House facilitators. The results can be shared with the Combined Committee members and the Ministry of Environment.
1. Overview of Stage 2-3 Open House #3
The Open House was held on Sunday, March 16, 2014, from 11:00am to 3:00pm at the Squamish Farmers Market. The Farmers’ Market is a popular weekend event and is attended by many residents and visitors to the area. The Open House was facilitated by David Roulston (District Staff) and Ehren Lee and Brittney Dawney of Urban Systems. The presence of the LWMP booth at the Farmer’s Market was advertised in the Chief newspaper and the District’s weekly e-newsletter with an incentive of a free watersport rental provided to residents providing feedback. Two presentation boards were displayed at the District’s booth, providing a high-level overview of the following:
» what a LWMP is; » a summary of the issues and opportunities identified in Squamish; » the highest priorities for Stage 2 evaluation; » information regarding
o disinfection pros, cons and costs; o biosolids management and the issues in Squamish to be addressed; and o potential programs and plans, e.g., source control, water conservation, integrated
stormwater management, and inflow and infiltration management.
These materials gradually build on the information presented at the first two open house events and were summarized within a brochure available for residents to take home or read at the booth. The intent of the booth was to foster discussion and dialogue and to share perspectives. The event was very successful with up to 40 visitors and discussions.

2. Input from Residents
Many residents were vocal about their concerns, questions, and ideas regarding liquid waste management in Squamish. Concerns and questions that were shared included the following:
» Odours from the WWTP » Strong support for UV disinfection over chlorination » Source control programs are a must but the LWMP should be cautious about ‘too big, too fast’;
therefore, select easy-quick wins to gain local support » Water conservation is crucial and user-pay pricing should be considered. Water metering is a
viable option and should be suggested (either LWMP or water master plan). » There is willingness to change the approach to biosolids/composting but only if the business case
is clear » Heavy metals cited as a primary local concern from effluent discharge to Squamish River even
though the analysis from the EIS suggests otherwise o Note: stormwater education surrounding heavy metals is likely to gain traction in
Squamish. » Integrated stormwater management is important » Utilize public education as a means to incentivize behavioural change
Residents who provided feedback did appear to be generally concerned about the environment and interested in how individual and collective practices across the District may impact it. The LWMP is gaining momentum which is positive for the community. In summary, the consultation at the Open House garnered valuable input which will be considered during the continued evaluation of management options in Stage 2 and Stage 3 of the LWMP process. The input was excellent and the dialogue approach was worthwhile. The next open house will center on the total costs of the program. If you have questions or concerns, please contact us directly. URBAN SYSTEMS LTD. Brittney Dawney, EIT Ehren Lee, P.Eng Water Strategy Consultant Water Strategy Consultant /bd/el U:\Projects_VAN\1928\0005\01\M-Meeting-Notes\Farmers Market July 2013\2013-07-29-MEM-LWMP Stage 2 Open House Summary.docx

WASTEWATER TREATMENT TO PROTECT
THE SQUAMISH RIVER
6 The District of Squamish is undertaking a Liquid Waste Management Plan
6 An Environmental Impact Study (EIS) was completed for wastewater discharge to the Squamish River
6 Due to the recreational use of the River, the District needs to disinfect the treated wastewater
BIOSOLIDS AND COMPOSTING IN SQUAMISH
PROTECTING OUR ENVIRONMENT BY MANAGING
OUR LIQUID WASTE
Option #1Option #1
What do YOU think? Come speak with us at the District of Squamish Booth
about treatment options and for your chance to WIN A WATERSPORT RENTAL!
Option #1Option #2
6 The District of Squamish is undertaking a Liquid Waste Management Plan
6 Biosolids are a product of treated waste that have many beneficial uses, such as compost.
6 The District of Squamish is undertaking a Liquid Waste Management Plan
What do YOU think? Come speak with us at the District of Squamish Booth
about this process and for your chance to WIN A WATERSPORT RENTAL!
What do YOU think? Come speak with us at the District of Squamish Booth
about these options and for your chance to WIN A WATERSPORT RENTAL!
Treatment Plant
Truck to Whistler
Pasteurize Truck to Squamish
Compost in Squamish
Option #1What do you think of the current process?Integrated Stormwater
Management Plan
Inflow & Infiltration Reduction Program
Indoor Water Conservation Program
Source Control Program
What do you think of the two disinfection options?
Beneficial Product for
Sale
Chlorination / De-Chlorination
Can create harmful
byproductsWidely Used
Highly Effective
Involves ChemicalsSome Risk
to Fish & People
Ultraviolet Treatment
Doesn’t Involve Chemicals
Highly Effective
High Energy ConsumptionEasy to
Operate & Maintain
Option #1What do you think about the programs being considered to better manage our liquid waste?


LIQUID WASTE MANAGEMENT PLAN
What is a LWMP?
A LWMP outlines a 20-year strategic plan for a local government to:
Finance and manage waste water resource recovery
Responsibly dispose of treated waste water
Adapt to the needs of a growing population
This must be done in a manner that is sufficiently protective of
public health and the environment
Public consultation is a key element of this process

Issues and Opportunities Identified in Stage 1 of the LWMP
Stormwater Urban runoff
Sources of pollutants High-level considerations for growth
Sensitive environment areas
Community Growth and Planning Considerations from Service Squamish
Official Community Plan and Growth Management Strategy Growth and land use changes
Treatment Treatment standards
Quality and quantity risks Receiving water conditions
Collection Quality and quantity of waste water
Infrastructure and growth
Biosolids Biosolids/compost quality
Transportation Market demands for the finished product

LIQUID WASTE MANAGEMENT PLAN
What is a LWMP?
A LWMP outlines a 20-year strategic plan for a local government to:
Finance and manage waste water resource recovery
Responsibly dispose of treated waste water
Adapt to the needs of a growing population
This must be done in a manner that is sufficiently protective of
public health and the environment
Public consultation is a key element of this process

A LWMP enables a community to create the vision and road map for systematic improvement of its watershed, through sanitary
and urban runoff programs.
The two primary objectives of a LWMP are:
consult the public and protect the environment
Objectives of a LWMP
STAGES OF A LWMP
Discuss principles and vision
Define issues and create a list of possible solutions
Costing of solutions
Create a list of preferred solutions
Technical analysis
Create a list of preferred solutions
Receive approval by the Ministry of the
Environment
Costing of solutions
Selection of best apparent alternative
STAGE 1: IDENTIFY COMPLETE
STAGE 2: EVALUATE PRESENT
STAGE 3: ADOPT FUTURE
Document the plan

Issues and Opportunities Identified in Stage 1 of the LWMP
Stormwater Urban runoff
Sources of pollutants High-level considerations for growth
Sensitive environment areas
Community Growth and Planning Considerations from Service Squamish
Official Community Plan and Growth Management Strategy Growth and land use changes
Treatment Treatment standards
Quality and quantity risks Receiving water conditions
Collection Quality and quantity of waste water
Infrastructure and growth
Biosolids Biosolids/compost quality
Transportation Market demands for the finished product

Highest Priorities for Stage 2
Reducing inflow and infiltration and their impact on flow, and improving accuracy of flow estimates
Knowing how Squamish will grow: the impacts and costs of growth, and the reliability of population projections
Disinfection options for treated effluent
a. Reducing pollutants in urban runoff
b. Creating a complete database of infrastructure and flows
c. Turning our investments into environmental improvements
Environmental Impact Study
TRIPLE-BOTTOM LINE PRIORITIZING
Protecting streams and preserving fish habitat by:
What is most important for the LWMP?

Options to Address the Issues According to the Priorities
Liquid Waste Management
Option - Program
Key Topics and Examples of Stage 2 Analysis
Wastewater Treatment Plant Game Plan
• Meeting Municipal Wastewater Regulations • Improving nutrient removal • Introducing upgrades as the population grows
Squamish Biosolids Program
• Identifying market and customer opportunities • Determining local and regional government roles • How can this be financed?
Reduce Sanitary Flows I&I and Water Use
• Incentives for household water conservation • Setting reduction targets • Obtaining accurate sanitary flow measurements
Source Control: Influent Quality Leadership
• Reducing fats, oil, grease, metals, etc. • Public education programming • Meeting regulations/permitting, etc.
Leachate Optimization • Landfill processes such as discharge • Opportunities and constraints • Flow and concentration management
Reclaimed Water: Feasibility Check
• Opportunities for readily apparent use of reclaimed water for agriculture and industry
Squamish ISMP • Integrated Stormwater Management Plan (ISMP) • Reducing common urban runoff pollutants • Addressing the impact of population growth

Summary
Concerns & Ideas
Consulting the public throughout the development of a LWMP is a key element of the process.
Your concerns and ideas regarding the options for liquid waste management and the direction of District of Squamish LWMP
are appreciated.

liquid waste management plan

Outlines a 20-year strategic plan for a local government to:
Finance and manage waste water resource jJrecovery Responsibly dispose of treated waste water
Adapt to the needs of a growing population
What is a liquid waste management plan (LWMP)?
TREATMENT - Treatment standards; Quality and quantity risks; Receiving water conditions
COLLECTION - Quality and quantity of waste water infrastructure and growth
BIOSOLIDS - Biosolids/compost quality; Transportation; Market demands for the finished product
STORMWATER - Urban runoff; Sources of pollutants; High-level considerations for growth; Sensitive environment areas
COMMUNITY GROWTH AND PLANNING - Considerations from Service Squamish, Official Community Plan and Growth
Management Strategy; Growth and land use changes
This must be done in a manner that is sufficiently protective of public health and the environment. Public consultation is a key element of this three-stage process.
ISSUES AND OPPORTUNITIES IDENTIFIED IN STAGE 1 OF THE PROCESS

How do we decide which options are best for Squamish?

what should our liquid waste management plan look like?
Our LWMP will help ensure Squamish remains a vibrant and resilient community into the future.
It should reflect our values, concerns, and ideas.
In your view, what are the biggest priorities and/or concerns regarding our water environment? (e.g., rivers, streams, Howe Sound, etc.)
Treatment plant effluent quality Stormwater runoff Other: ____________________
Impacts of growth High water use/flows Other: ____________________
How can you see yourself contributing to protecting our water environment?
Conserving water Being mindful of what I pour down
the drain Other: ____________________
Having my own rain garden Contributing to new programs Becoming more informed Other: ____________________
Please share your concerns, ideas, or comments

District of Squamish Liquid Waste Management PlanQuestionnaire
The District’s draft Liquid Waste Management Plan is calling for new programs and plans tobetter protect public and environmental health in Squamish.
Recommended Plan / Program and Cost Why Do We Need It?
Upgrades to the wastewater treatment plant$ 8.1 million over 20 years
to accommodate the growth of our communityto provide disinfection treatment because of ourrecreational activities in Squamish River and HoweSoundto control odours from the plant
Integrated stormwater management program$ 2.1 million over 20 years
to protect our environment as our communitygrowsto guide how we develop our community
Ongoing source control efforts$ 0.64 million over 20 years($ 40,000 added to current budget)
to protect our sewer infrastructureto protect our environment from harmfulsubstances
Flow Reduction Program» Indoor water conservation program» Sewer condition assessments» Sewer flow monitoring
$ 2.1 million over 20 years($ 1.7 million added to current budget)
to lower our water consumptionto reduce flows to the wastewater treatmentplantto maintain and protect our existing sewer system
Continue with our current biosolidsmanagement program but seek to reduce costs$ 7 million over 20 years(continue with current budget)
our existing program supports resource recoverythere are opportunities to reduce trucking costs
These programs and plans will be funded through a combination of general tax revenues,utility fees, and development charges.

District of Squamish Liquid Waste Management PlanQuestionnaire
1. What do you think should be the District’s biggest priorities with respect to funding?Funding programs and plans that support community growthFunding programs and plans that support environmental protectionFunding programs and plans that protect and maintain our current infrastructureAll of the aboveOther: ______________________________________________________
Comments:
2. Would you support a new environmental services fee to support the integratedstormwater management program?
YesNo
Comments:
3. How would you order in terms of highest priority the following upgrades to thetreatment plant?
UV treatment because it disinfects effluent before it is released to the SquamishRiverOdour control because it’s affecting public healthIncreasing capacity to better accommodate peak flows from a growingcommunityNo preference; I would prefer the Province dictates what we do
Comments:

3/8/2013
1
DISTRICT OF SQUAMISHLIQUID WASTE MANAGEMENTPLANCombined Committee Meeting #2October, 2012
Desired Meeting ResultsCombined Committee Meeting #2
DMRs
Results
• The list of Stage 1 issues iscomplete
• All ideas have been proposed
• Active, creative meeting

3/8/2013
2
Combined Committee Meeting #2Agenda
What How Who Time
LWMP Fundamentals: Reviewof Mtg #1
Presentation Peter 5:00 to 5:10
LWM Issues Check:Mtg 1 results + 3 StarsExercise
Presentation +Break Out
Groups
Ehren 5:10 to 5:40
Break 5:40 to 5:50
Survey Results Presentation +Group
Discussion
Ehren 5:50 to 6:10
Plan Outcomes Presentation Ehren 6:10 to 6:20
LWM Ideas Mind Map Collaboration Teams 6:20 to 6:50
LWMP BackgroundAuthority comes from the “EnvironmentalManagement Act” (BC)
Interim guidelines in 2011 (update)
Approval from Minister of Environment
Two primary objectivesProtect public health and environmentEffectively consult with public

3/8/2013
3
LWMP ProcessStage 1 “Identify”
Define issues and create list of possible/reasonablesolutionsDiscussion of principles and vision
Stage 2 “Evaluate”Technical analysis, costing of solutions, and creatinglist of preferred solutions
Stage 3 “Adopt”Selection of best apparent alternative,
document the plan, sign-off from MoEBeginStage 1
EndStage 3
Stage 2
What is Liquid Waste?
Technical AreasFocus on water-based pollution
Sanitary CollectionSanitary TreatmentBiosolidsEffluent Re-entry or Reclaimed Water Re-UseStormwater and Urban Runoff
Management PlanPrioritiesObjectivesNew practices

3/8/2013
4
The CommitteeCommittee Role and Terms of Reference
Identify design criteria, brainstorming solutions,provide technical input and recommendations.
Provide input, focusing on the public and businessperspective. Provide on-going liaison with public andrepresent the needs of the entire community.
Major contributor to the outputs of the LWMP forconsideration by District Council and sign-off by MoE
The CommitteeHow to engage with one another
Be open to diversityYour ideas get better with someone else’s inputEmbrace your audience and take interest in what isimportant to them
Keep your terms of reference handyRemind each other when we are off task
Be specific and conciseWrite down your comment first, if it helps

3/8/2013
5
HAVE WE GOT THE ISSUESCOVERED?
My Top 3 PrioritiesObjective
to describe and report out your top 3priorities for LWM in Squamish.
Reminder:consider your roleand the terms of
Reference
In only one sentence, describe each of your top 3 priorities and be specificabout what concerns you most.
123

3/8/2013
6
Table of Priorities from Mtg 15 Themes
InnovationStream and River ProtectionGrowth ResilientAssets, Finance and AffordabilityTreatment Plant Game Plan
Table of Priorities from Mtg 1

3/8/2013
7
Complete Stage 1 Issues Table:Committee + Technical Memo Consolidation
Issues Review – 3 Stars Exercise
Consult updated table + Meeting #1 Feedback
Work in groups of three to complete the 3 StarExercise
For each LW category, select:
…The list of Stage 1 issues is complete… (DMR #1)

3/8/2013
8
SURVEY RESULTS
Survey Summary
Allow for additional LWMP input, in betweencommittee meetings
10 diverse questions
Confirm knowledge already gained; AND, beginto orient our thinking towards ideas
Additional comments welcomed and provided
Further discussion on Thursday

3/8/2013
9
Key ObservationsWe are getting the hang of this LWMP thingLooking for MORE for enviro protectionSome hesitation for water-reuseLooking for proven ways of engaging the public
Survey Summary

3/8/2013
10
Survey Summary
Survey Summary

3/8/2013
11
Survey Summary
Survey Summary

3/8/2013
12
Survey Summary
Survey Summary

3/8/2013
13
Survey Summary
Survey Summary

3/8/2013
14
Survey Summary
For reflection and discussionBest public engagement sessions you’veparticipated in?
What concerns are there about water reuse?
Let’s discuss the skepticism regardingbusiness and residents managing liquidwaste?

3/8/2013
15
PLAN OUTCOMES
LWMP SolutionsThree categories:
Conceptual capital projectse.g. wetland
Defined programsEducation about bad spills
Policy responsesCouncil/community takes a position

3/8/2013
16
LWMP SolutionsConceptual Capital
ProjectsDefined Management
ProgramsPolicies
e.g. treatment plant gameplan
e.g. Catchbasin SpillEducation
e.g. Council/communitytakes a position
Committee problem solving is best suited for…
Guide andreview Define,
Design,Implement
Guide andreview
Treatment Plant Game Plan1. Characterize the Squamish River to determine required
effluent quality.Conduct EIS
2. Develop better control of plant inflowLimit inflow/infiltration and high-strength wastes
3. Optimize the process to reduce power consumptionInvestigate energy recovery

3/8/2013
17
Treatment Plant Game Plan4. The existing site will remain for the long-term.
Optimize processes for smaller footprint
5. Integrate growth and financeAvoid large investments (or over capacity) before customers arepaying
6. Stage 2 will include a 20 year optimization plan for thetreatment plant
ProgramsSpecific terms for implementation and performancereviewList of types of activities and their impact
Budgets, benefits, and timelines
Essential they are founded on local valuesExercise to mind map these together

3/8/2013
18
LWMP SolutionsProgram Examples:
LWMP SolutionsProgram Examples:

3/8/2013
19
IDEASMINDMAP
Principles of LWM in SquamishObjective
to review and discuss common principlesfor LWM in Squamish.to pick your group’s top 5 principles andreport out
Reminder:consider your roleand the terms of
Reference
# Why? (in a few brief words)

3/8/2013
20
Using Principles to Generate Ideas1.Build and operate infrastructure for long term economic and environmental health 18%
7.Monitor the performance of the liquid waste system and impacts on the receivingenvironment; use the information to adapt and collaborate to manage evolving issues 15%
6.Reduce material concentrations to be introduced to ecosystems only in such forms andquantities as can be absorbed by the receiving systems without material harm 11%
9.Manage assets and optimize existing sanitary sewerage operations 9%
4.Foster a culture of learning about liquid waste management for this generation and the next 9%
8.Use innovative approaches and technologies 8%2.Ensure decisions and actions are affordable and do not accumulate liabilities for futuregenerations 7%
10.Pursue liquid waste resource recovery and energy management to reduce the footprint ofLW systems 7%
5.Protect, restore and enhance natural ecosystems especially those which contain rare orendangered species 5%
3.Apply decision-making processes (business cases) which are transparent, inclusive andrespectful of the interests of all affected parties 4%
11.Reduce wet weather flows 4%
12.Reduce liquid wastes at their source 3%
HIGH
MEDIUM
LOW
Mind Mapping IdeasIssues have been grouped for maximum effectBuild on the ideas through mind-mapping
Split into two mind-map teamsEach receive 3 broad ideasSome terms/help providedUse your issues to map your ideas

Vancouver, BC
Subject: LWMP – Committee Meeting #4 Date: March 17, 2014 Meeting Date: 2pm to 4pm Location: Squamish Library File: 1928.0005.01 Prepared By: Ehren Lee Distribution: All Attendees Company Email David Roulston DoS [email protected] Bob Smith DoS [email protected] Stacy Bell DoS [email protected] Caroline Ashekian DoS [email protected] Sabina Foofat DoS [email protected] Ehren Lee Urban Systems [email protected] Peter Gigliotti Urban Systems [email protected] Joanne Harkness Urban Systems [email protected] Trevor Hamelin Ministry of Environment [email protected] Joe Paul RM of Whistler [email protected] Paul Wick Squamish First Nation [email protected]
1.0 MEETING AGENDA
a. Squamish Wastewater 101 b. Squamish River Environmental Impact Study - Overview
Information, methodology, results and endocrine disruptors c. Disinfection
Options, economics, discussion d. Biosolids
Options, life-cycle costing, discussion e. Plant Sizing for Growth
MWR, current flows, two-options for comparison ____________________________________________________________________________
2.0 MEETING NOTES 1. Wastewater 101: discussion ensued regarding the fundamentals of wastewater management.
2. Environmental Impact Study: discussion ensued as laid out in the agenda including the following salient points:
i. Study conducted in line with the Terms of Reference agreed upon by District and Ministry in January 2013.
ii. Primary goal of EIS to develop effluent criteria. Under a LWMP, there is the possibility to deviate from the MWR where it aligns with local environmental context.
iii. Background water quality data are limited to sampling over the summer of 2013, but what has been collected generally shows, good water quality with periods of high sediment, which is expected for a flowing system, due to natural sediment scour. Sampling was

MEETING NOTES Subject: Liquid Waste Management Plan: Start Up Workshop Meeting Date: March 17, 2014 File: 1928.0005.01 Page 2 of 3
Vancouver, BC
undertaken during critical time of year when recreational activities are highest, flows are lowest, and water temperature is high (August to September).
iv. Analysis focused on discharge modeling under typical monthly flows and also for the standard low river flow period.
v. Incidences of micro-organisms that are present in feces and the indication is that the effluent release is influencing these concentrations in the vicinity of the outfall. Disinfection is required for this site based on the results of the EIS, which has been received by the Ministry.
vi. Metals are not a primary concern in effluent.
vii. Leachate from landfill was being treated at the plant and released during water quality sampling.
viii. Dilution in Squamish River is excellent.
ix. Endocrine disrupting substances were discussed including difficulties in sampling and testing for key constituents and the preliminary nature of the scientific community on this topic. There was support around the table for exploring partnerships with a university and for providing simple communication materials to reduce the amount of constituents in wastewater influent (although minor to begin with). Also, some removal of endocrine disrupting substances likely occurring already at the plant.
x. EIS discussion completed with summary notes as follows: need for disinfection; no change to major processes (i.e. quality based changes); and, to initiate long-term support for monitoring of endocrine disrupting substances. There was also some discussion of improving community education and source control to try and reduce EDS entering WWTP.
3. Disinfection: discussion ensued regarding the advantages and disadvantages for three types of disinfection: gas chlorination (and dechlorination), liquid chlorination (and dechlorination) and UV inactivation. Salient points from the discussion includes:
i. Public safety is a concern and hauling and using gas/liquid chlorine throughout the community is considered a risk.
ii. It was noted that failure of a gas chlorination system could pose a risk to residents in the area, whereas UV failure relegates water quality ‘back’ to the current level.
iii. It was noted that a 3rd chlorine option may be on-site generation. Urban to potentially update the cost comparison to include on-site generation option if the UV transmissivity is deemed low for the manufacturer’s recommended range and other treatment is needed.
iv. District operators expressed their support for UV and general consensus around the table was that UV is preferred unless UV Transmittance testing indicates UV to be ineffective.
4. Biosolids: discussion ensued regarding the existing approach (Squamish Whistler Squamish) and the potential options for local processing (thereby saving the expense/footprint of sending to Whistler). Salient points from the discussion includes:
i. Capacity at the Whistler plant increased significantly and loading from Squamish is less of a concern now that food scraps have been diverted.
ii. There is an over-supply of composting materials in the area which can force Whistler to store materials for long periods of time, or reuse compost at the landfill or it can be hauled away to other regions where there is greater demand (as noted previously).

MEETING NOTES Subject: Liquid Waste Management Plan: Start Up Workshop Meeting Date: March 17, 2014 File: 1928.0005.01 Page 3 of 3
Vancouver, BC
iii. Cost of existing program is est. $350,000/year including $5,000/month and $25,000/month for hauling and tipping fees, respectively.
iv. Economies of scale typically don’t favour individual communities processing biosolids alone, especially when there are regional partners.
v. Local (Squamish) concerns for odours are high.
vi. There was caution regarding land and operational (capital, ongoing, staffing, storing, etc.) costs for a District-led program.
vii. There is interest in comparing the options in a business case type format which can be an output of the LWMP. A high-level, qualitative review can be conducted to inform the recommendations of the LWMP, including the future need to prepare long-term plan for biosolids management.
viii. In the interim (or longer) there is strong interest in evolving the existing ‘contracting’ role for biosolids with Whistler to one that is a partnership including terms for long-term capacity, pricing and responsibilities.
5. Collection System: discussion ensued regarding the need for conservation (indoor reductions); I/I management, leachate changes; and oil and grease reductions.
6. Mamquam Plant Sizing: discussion ensued regarding the factors affecting the size of the plant (hydraulically) including the redundancy requirements in the regulations, the impact of inflow and infiltration, population growth and the existing configuration of the plant. Takeaways from the discussion include:
i. For next meeting, Urban to provide a comparison between two sizing scenarios: a) following the MWR, and, b) sizing the plant to reduce current I/I (in the face of growth) while keeping the performance target on effluent water quality.
ii. Ministry of Environment staff communicated the need for source control programs and achieving reductions on I/I while District staff commented that a ‘reasonable level of reductions is okay’ but there should be some caution for bold reductions (I/I is a complex, distributed issue with typically a large focus on private side fixes). Ultimately, plant sizing should help guide how to ‘save’ for the plant instead of absolute design parameters at this time. One outcome of the LWMP is likely to implement I/I management programs and use the effectiveness of the program (e.g. actual reductions achieved) to confirm plant design criteria in the future.
7. Next Meeting: to be held in April to summarize the projects and programs of the LWMP and review the draft Stage 2-3 report.
___________________________________________________________________________________
URBAN SYSTEMS LTD. Ehren Lee, P.Eng /el \\usl.urban-systems.com\projects\Projects_VAN\1928\0005\01\M-Meeting-Notes\March 2014 Committee meeting\2014-03-18-committee meeting #4 meeting notes.doc

DISTRICT OF SQUAMISH
LIQUID WASTE MANAGEMENT PLAN
Stage 2-3: Committee Meeting #4
March 2014

Desired Meeting Results Combined Committee Meeting #4
Purpose: To discuss the Environmental Impact Study (EIS) and provide input on disinfection and biosolids.
Desired Meeting Results
• Satisfied with EIS findings.
• Discussed rationale for upgrades at the plant.
• Input received on EIS, disinfection and biosolids.

Overview
LWMP Process
Stage 1 - Review
Process
Issues
Priorities
Long list of management options
Community engagement
Stage 2 - 3
Qualitative prioritization
EIS and Outfall Assessment
Game Plan for the WWTP
Draft commitments for other programs; e.g. I&I
Funding and reporting

LWMP Process
Stage 1 – “Identify”
Define issues and concerns
Identify feasible solutions
Stage 2 - “Evaluate”
Evaluate options and select the preferred
Stage 3 – “Adopt”
Enacted by By-law legal document
Begin Stage 1 End Stage 3
Stage 2
Expanding thinking Converging thinking
Today’s Focus
LWMP Priorities Review
Environmental Impact Study
Squamish River
Federal and provincial requirements
What we learned and what we recommend
Game Plan for WWTP
Areas of Key Input EIS
Disinfection
Biosolids

Stage 1: Management Options
Liquid Waste Management Option - Program
Key Topics and Examples of Stage 2 Analysis
Wastewater Treatment Plant (WWTP) Game Plan
• Striving for Municipal Wastewater Regulations • Safeguarding Squamish River • Introducing upgrades as the population grows
Enhanced Squamish Biosolids Program
• Identifying market and customer opportunities • Determining local and regional government roles • Affordability
Reduce Sanitary Flows: Inflow and Infiltration (I&I) and Water Use
• Incentives for household water conservation • Setting reduction commitments • Obtaining accurate sanitary flow measurements

Stage 1: Management Options
Liquid Waste Management Option - Program
Key Topics and Examples of Stage 2 Analysis
Source Control: Influent Quality Leadership
• Reducing fats, oil, grease, metals, etc. • Public education programming • Meeting regulations/permitting, etc.
Leachate Management • Flow and concentration management
Reclaimed Water: Feasibility Check
• Opportunities for readily apparent use of reclaimed water for agriculture and industry
Squamish Integrated Stormwater Management Plan (ISMP)
• Reducing common urban runoff pollutants • Minimizing the impacts of urban runoff on receiving environment • Addressing the impacts of population growth

Water Usage Schematic
WATER SOURCE
FLUSHING
WASHING
DRINKING / COOKING
WASTEWATER
DIVERSION/ EXTRACTION
TREATMENT
RIVER, LAKE, AQUIFER

What’s in wastewater?
Must Consider Suspended particles (TSS), Dissolved metals and organics (TDS)
Nutrients (P, N), Biochemical Oxygen Demand (BOD), Micro-organisms
Must Consider: Increased turbidity
Toxicity to fish and other aquatic life
Nutrients promote growth of aquatic plants
BOD depletes natural dissolved oxygen
Micro-organisms increase risk of disease

Basic Treatment Plant Components
FROM COLLECTION
SYSTEM
SCREENING GRIT
REMOVAL BIO-REACTOR CLARIFIER DISINFECTION CLARIFIED EFFLUENT
DEBRIS GRIT
TO LANDFILL
BIOSOLIDS RETURNED TO ENVIRONMENT
SLUDGE PROCESSING • DIGESTION • DEWATERING • COMPOSTING
EFFLUENT RE-ENTERS
WATERSHED OR AQUIFIER
RETURN WASTE

The Existing Squamish Plant
Front end screens and degritter units
Suspended growth bio-reactors
Clarifiers with adjustable sludge return/waste ratios
Disinfection is not currently practiced

SLUDGE PROCESSING
BIOREACTOR
CLARIFIER
BIOREACTOR
FRONT END

Squamish River: EIS
Overview of the EIS process
Key components of the EIS
Key outcomes

Squamish River: EIS
Overview to the EIS Process
Purpose – to recommend effluent criteria which will protect public health and the environment
Focus – continued effluent release to the Squamish River
Recognises Federal and Provincial standards and existing water uses, including fisheries and recreational use
Summarise current status of endocrine disrupting substances
Terms of reference finalised in January 2013

Squamish River: EIS
Background information – Squamish River
Key uses are recreational and fisheries
No water licenses and 1 authorised discharge (Mamquam sewage treatment plant)
Historical industrial use but limited current industrial use
Limited water quality data – sampling over the summer 2013
Low concern with current water quality
Bacteriological data indicate potential influence from effluent release

Squamish River: EIS
Environmental Impact Study - Methodology
Effluent 20-year 7-day high flow protections: 16,050 m3/d
Average month and 7Q2 low river flows
Background water quality from summer river monitoring
Considered changes in key parameters: organics, solids, nutrients (nitrogen and phosphorus), faecal coliforms and metals
Would the changes result in unacceptable river conditions?

Squamish River: EIS
Environmental Impact Study – Primary Outcomes
Average dilution ratio 1,250:1; 7Q2 dilution ratio 290:1
CBOD5 and TSS to be 25 mg/L average, 45 mg/L maximum
Ammonia – no treatment needed to meet Federal or Provincial requirements
Nitrate – no treatment needed
Phosphorus – no treatment needed
Disinfection ≤ 5,500 counts/100 mL (geometric mean) – to protect recreational use. If chlorine used, need to dechlorinate
Recommended reliability category II

Squamish River: EIS
Primary Outcomes – Endocrine Disrupting Substances
Interfere with the endocrine system – at very low concentrations
Complex to understand – limitations with monitoring and understanding bio-degradation pathways
Treatment approaches: attachment to sludge, biological treatment and advanced treatment (activated carbon, oxidation, etc.)
No advantages with implementing advanced treatment
Need direction from higher levels of government
Where possible, manage at source

WWTP Game Plan
Goal: Flows are discharged without compromise to public health or the environment
Objectives:
1. Increase capacity to keep pace with growth
2. Improve effluent quality to keep pace with regulations (focus of this discussion)
3. Optimize energy consumption and implement recovery where possible
4. Repair/improve poorly functioning components

WWTP Game Plan: Expansion
Background on MWR How it guides us:
…requires secondary treatment for up to 2x ADWF…
…requires redundancy of 75% of design flow with one unit out of service…
Open to alternatives so long as a) federal bypass needs met and b) effluent quality remains high
Address I/I and water conservation too
Final Committee meeting: compare and select Game Plan options
MWR-Hydraulics
Custom Squamish approach

WWTP Game Plan: Disinfection
Disinfection is achieved with the use of a powerful oxidant such as chlorine or ozone
Ultra-violet light is also effective at destroying bacteria if the water is reasonably clear
If chlorination is used, de-chlorination is also necessary as fish are very sensitive to chlorine

WWTP Game Plan: Disinfection
Chlorination UV Treatment
Ad
van
tage
s
- Broadly used as a treatment process
- Typically lower capital cost than UV treatment
- Effectively inactivates giardia and cryptosporidium
- Typically lower operating and maintenance costs than chlorination
- Requires no handling or storage of chemicals
- Highly effective and reliable
- Can often be retrofitted in plants
Dis
adva
nta
ges
- Chlorination must be followed by de-chlorination
- Requires handling and storage of chemicals
- Typically higher operating and maintenance costs than UV
- Energy intensive
- Typically higher capital costs than chlorination
- UV lamps can foul, which requires maintenance
Key
Fact
ors
- Residual chlorine concentration must be less than or equal to 0.02 mg/L (EIS)
- Feasibility is dependent on quality of effluent (must exhibit sufficient UV transmittance)

WWTP Game Plan: Disinfection
Key topics for discussion:
Operator / District preference
Public opinion
Health and safety
Adequacy of UV transmittance
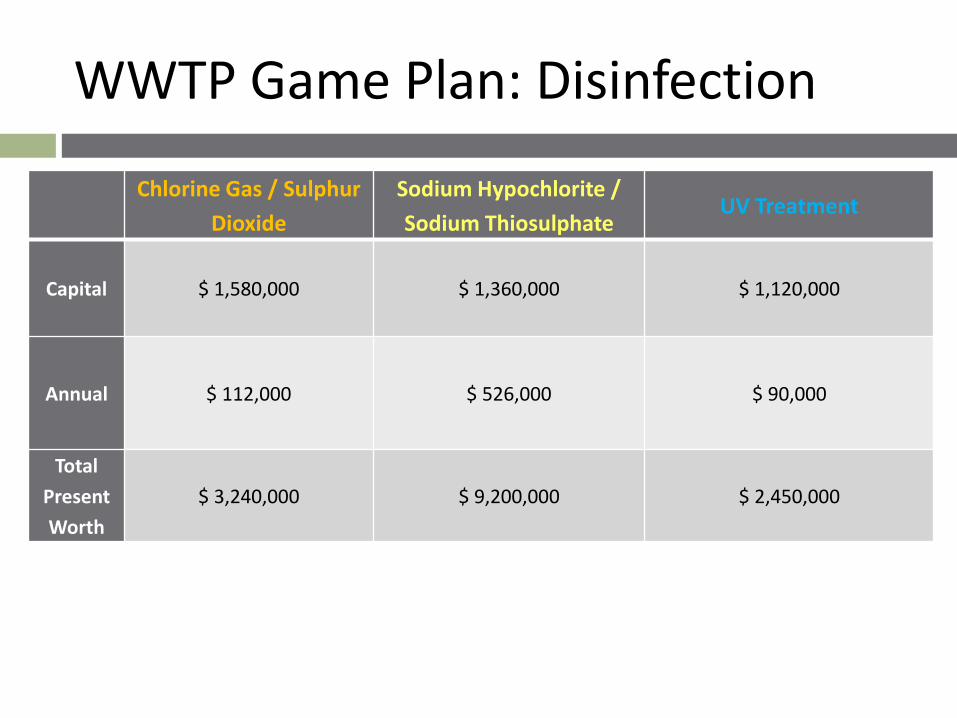
WWTP Game Plan: Disinfection
High-level costing
Questions for discussion
Chlorine Gas / Sulphur
Dioxide
Sodium Hypochlorite /
Sodium Thiosulphate UV Treatment
Capital $ 1,580,000 $ 1,360,000 $ 1,120,000
Annual $ 112,000 $ 526,000 $ 90,000
Total
Present
Worth
$ 3,240,000 $ 9,200,000 $ 2,450,000

WWTP Game Plan: Biosolids
Aerobic digestion
Stabilize and thicken
Dewatering with a centrifuge
Increases the solids content from 3-4% to 20-25%
Stabilized dewatered sludge is known as biosolids
Biosolids can be beneficially used
BC OMRR (Organic Matter Recycling Regulation)

WWTP Game Plan: Biosolids
LWMP biosolids priorities Reduce cost and footprint of trucking
Develop long-term security
Ensure final product is environmentally safe
Option 1: Status Quo Squamish Plant Carney’s Whistler Carney’s
landfill/USA/reuse
Advantages: already established; District person-power requirements are low; semi-regional
Disadvantages: trucked twice; uncertain future; expensive trucking costs

WWTP Game Plan: Biosolids
Option 2a and 2b: Reduce Trucking Squamish Plant Carney’s/District landfill/USA/reuse
100% Processed in Squamish
Advantages: 100% processed in Squamish; lowers trucking; more certainty for future
Disadvantages: creates two processing facilities in the region; potentially more operational/environment responsibility for District

Stage 2-3: Next Steps
Consult the public
Further refine options
Outline financial strategy
Committee meeting #5
Consult the public
Council
Distribute draft report
Adoption of the LWMP

Vancouver, BC
Subject: LWMP – Committee Meeting #5 Date: May 14, 2014 Meeting Date: 10am to 12pm Location: Municipal Hall – Central Meeting Room File: 1928.0005.01 Prepared By: Ehren Lee Distribution: All Attendees Company Email David Roulston DoS [email protected] Christine Matthews DoS [email protected] Sabina Foofat DoS [email protected] Ehren Lee Urban Systems [email protected] Peter Gigliotti Urban Systems [email protected] Jack Cooley Squamish Streamkeepers [email protected] Cindy Watson Vancouver Coastal Health [email protected] Paul Wick Squamish First Nation [email protected]
1.0 MEETING AGENDA
a. WWTP Plan – Options 1, 2 and 3
Options, treatment processes, digesters, odours, disinfection and biosolids b. Overall LWMP Program Overview
Program components, objectives and spending levels c. Spending Level Review d. Comments and discussion
____________________________________________________________________________
2.0 MEETING NOTES 1. WWTP Plan: There is strong Committee support for the recommended WWTP Plan Option #3 which
includes converting existing bioreactors to ‘moving bed bio-film reactors’ (MBBR). Key reasons for the support for this Option is the low cost (capital and operating) and the reduced construction footprint.
2. Digestion: There is strong Committee support to consider digestion (including gas recovery for boiler heating) as a key method of enabling additional flows in the plant (to accommodate growth) and for handling odours which currently off-gas in the DAF and centrifuge processes. Monitoring odour pre-post MBBR conversion and constructing the digester is recommended.
3. Disinfection: Confirmed that UV disinfection is the preferred method by the Committee, by the Public and by Staff.
4. Biosolids: There is strong support for proceeding with biosolids management under the current approach including two improvements: creating a detailed long-term agreement with Whistler and to develop new ways to reduce trucking impacts such as fleet optimization.
5. Integrated Stormwater Management Planning: There is strong support to initiate integrated stormwater planning in Squamish by aligning with select components from the Metro Vancouver experience. The program in Squamish will evolve gradually as new funding is defined and secured. There was additional encouragement from the Committee (which matches public sentiments to date)

MEETING NOTES Subject: Liquid Waste Management Plan: Committee Meeting #5 Meeting Date: May 14, 2014 File: 1928.0005.01 Page 2 of 2
Vancouver, BC
to include a strong but focused public engagement program to influence resident and business behaviors for on-site water-related-activities e.g. car washing, landscaping, and construction practices.
6. Source Control Program: There is strong support for the source control program currently underway including a focus on sanitary issues initially. Eventually, a study should be completed to develop a comprehensive long-term source control program which allows the current program to adapt to future sanitary and stormwater needs.
7. Flow Management – I/I and Conservation: This program is recommended to proceed with initial funding as proposed with minor increase to I/I budgets to include additional pipe assessments (approx. $12,000+ per year over originally proposed budget). Both I/I and Conservation programs will adapt over time as new information is collected, significant results are achieved and as revised objectives are pursued.
8. Final Steps: Urban Systems to complete the Draft Stage 2-3 Report in late May including providing a two week window for Committee feedback. During this time and into June 2014, Staff and Urban Systems will finalize the budget-schedule for the programs and projects with the aim of striking a balance between new works and affordability.
9. Public Feedback: A Farmer’s Market booth is scheduled for late May or early June to receive final feedback on the proposed programs, projects and spending levels prior to presenting the Stage 2-3 Report to Council in the summer. ________________________________________________________________________________
URBAN SYSTEMS LTD. Ehren Lee, P.Eng /el U:\Projects_VAN\1928\0005\01\M-Meeting-Notes\May 14 2014 Committee Meeting\2014-05-14-committee meeting #5 meeting notes.doc

P a g e | 71
Appendix B
Class D Cost Estimates

72 | P a g e
Table B.1 Wastewater Treatment Plant Upgrades – Capital Cost Estimates: Third Train
Component Cost ($)
Common excavation 50,000
Demolition 50,000
Concrete 850,000
Aeration equipment supply 400,000
Clarifier equipment Supply 750,000
Sludge pumps and ancillary 100,000
Steel divider walls 350,000
Installation of equipment and steel walls 800,000
Electrical and controls 380,000
SCADA 120,000
Process piping 320,000
Site work 140,000
Sub-total 4,310,000
E&C (40%) 1,724,000
TOTAL $ 6,034,000
Table B.2 Wastewater Treatment Plant Upgrades – Capital Cost Estimates: Parallel TWAS
Component Cost ($)
Common excavation 30,000
Concrete 500,000
Aeration equipment and diffusers 220,000
Process piping and pumps 100,000
Installation 70,000
Electrical and controls 140,000
Sub-total 1,060,000
E&C (40%) 424,000
TOTAL $ 1,484,000
Table B.3 Wastewater Treatment Plant Upgrades – Capital Cost Estimates: Second DAF

P a g e | 73
Component Cost ($)
Building extension (200 m2) 440,000
DAF Package Supply 480,000
DAF Installation 240,000
Process piping 120,000
Electrical and controls 140,000
SCADA 40,000
HVAC and odour control 30,000
Sub-total 1,490,000
E&C (40%) 596,000
TOTAL $ 2,086,000
Table B.4 Wastewater Treatment Plant Upgrades – Capital Cost Estimates: Disc Filter Facility
Component Cost ($)
Building (480 m2) 960,000
Concrete 120,000
Disc filters supply 640,000
Disc filters installation 320,000
Process piping 280,000
Electrical and controls 250,000
SCADA 80,000
HVAC and odour control 120,000
Sub-total 2,770,000
E&C (40%) 1,108,000
TOTAL $ 3,878,000

74 | P a g e
Table B.5 Wastewater Treatment Plant Upgrades – Capital Cost Estimates: MBBR Conversion
Component Cost ($)
Media purchase 950,000
Addition of fine screens to headworks 320,000
Installation of media and screens 240,000
Electrical and controls 260,000
New diffusers 140,000
New blowers 220,000
SCADA 60,000
Sub-total 2,190,000
E&C (40%) 876,000
TOTAL $ 3,066,000
Table B.6 Wastewater Treatment Plant Upgrades – Capital Cost Estimates: New Anaerobic Digester (2 cells)
Component Cost ($)
Common excavation 30,000
Concrete 360,000
Sludge mixing equipment 180,000
Floating covers and gas capture 380,000
Boilers and heat exchangers 260,000
Sludge pumps 50,000
Yard piping 80,000
Process piping 120,000
Electrical and controls 230,000
SCADA 80,000
Sub-total 1,770,000
E&C (40%) 708,000
TOTAL $ 2,478,000

P a g e | 75
Table B.7 Cost Comparison of Disinfection Options
Component Gas
(Chlorine/SO2)
Liquid
(Hypochlorite/Thiosulphate) Ultraviolet
Capital
Building 400,000 250,000 180,000
Yard piping 100,000 100,000 100,000
Contact tanks 240,000 240,000 60,000
Diffusers 60,000 60,000 -
Equipment 160,000 90,000 150,000
Equipment installation 80,000 50,000 90,000
Slurry slaker - 100,000 -
HVAC 30,000 18,000 12,000
Electricity (power) 15,000 22,000 48,000
Controls/SCADA 40,000 40,000 40,000
Sub-total 1,125,000 970,000 680,000
E&C (40%) 450,000 388,000 272,000
Total Capital $1,575,000 $1,358,000 $952,000
Annual
Chlorine gas ($1.20 / kg) 14,000 - -
SO2 gas ($2.00 / kg) 11,700 - -
Hyopchlorite ($2.50 / L) - 244,000 -
Thiosulphate - 73,000 -
Power 1,000 3,000 16,000
Lamp replacement - - 12,000
Ballast replacement - - 8,000
Parts allowance 6,000 4,000 7,000
Labour allowance 30,000 30,000 30,000
Total Annual 62,700 354,000 73,000
Present Worth
(2% compounded over 20 yrs) 933,000
5,267,000 1,086,000
TOTAL PRESENT WORTH 2,508,000 6,625,000 2,038,000

76 | P a g e
Appendix C
Other LWMP Reports