Liquid-Solid Phase Equilibria of Paraffinic Systems...
24
Chapter 11 © 2013 Alcazar-Vara and Buenrostro-Gonzalez, licensee InTech. This is an open access chapter distributed under the terms of the Creative Commons Attribution License (http://creativecommons.org/licenses/by/3.0), which permits unrestricted use, distribution, and reproduction in any medium, provided the original work is properly cited. Liquid-Solid Phase Equilibria of Paraffinic Systems by DSC Measurements Luis Alberto Alcazar-Vara and Eduardo Buenrostro-Gonzalez Additional information is available at the end of the chapter http://dx.doi.org/10.5772/54575 1. Introduction Several industrial sectors around the world deal with paraffinic wax in their processes or make use of it in their products. Hence, understanding physical properties of paraffins is of industrial importance. Some of these industrial sectors are: petroleum production, petroleum refining and products, chemical, energy and consumer products [1]. However, as it has been widely reported in literature [2-6], one of the most affected industrial sectors by the paraffin crystallization phenomena is the petroleum industry. Crude oils contain heavy paraffins that may form solid wax phases at low temperature in the pipelines and hydrocarbon production facilities. The problems caused by wax precipitation decreasing production rates and failure of facilities, are a major concern in the production and transportation of hydrocarbon fluids [7]. Paraffin waxes are mixtures of a wide range of high molecular weight alkanes that can crystallize from crude oils or solutions primarily due to temperature decreasing. They are rather non-polar molecules and their interactions are expected to be van der Waals or London dispersion type [4]. Paraffin waxes consist of branched (iso), cyclic and straight chain (normal) alkanes having chain lengths in excess of 17 carbon atoms (C17) and potentially up to and over C100 [8]. However, despite the fact that crude oils are extremely complex systems containing a multitude of components, it is generally accepted that the crystallizing materials that form the deposits are primarily n- alkanes [9-10]. Therefore, in order to obtain a greater insight on the formation of wax deposits to prevent and solve these problems, it is necessary to get a deep knowledge of the mechanisms involved on the n-paraffins crystallization process. Other industrial problems associated to the paraffin phase behavior have been reported in literature and summarized below. In diesel fuels production operations, fuel-filter plugging and other associated fuel handling problems can occur in cold weather due to paraffin crystallization. Moreover, fuels produced from Fischer–Tropsch syntheses that are currently
Transcript of Liquid-Solid Phase Equilibria of Paraffinic Systems...

Chapter 11
© 2013 Alcazar-Vara and Buenrostro-Gonzalez, licensee InTech. This is an open access chapter distributed under the terms of the Creative Commons Attribution License (http://creativecommons.org/licenses/by/3.0), which permits unrestricted use, distribution, and reproduction in any medium, provided the original work is properly cited.
Liquid-Solid Phase Equilibria of Paraffinic Systems by DSC Measurements
Luis Alberto Alcazar-Vara and Eduardo Buenrostro-Gonzalez
Additional information is available at the end of the chapter
http://dx.doi.org/10.5772/54575
1. Introduction
Several industrial sectors around the world deal with paraffinic wax in their processes or make use of it in their products. Hence, understanding physical properties of paraffins is of industrial importance. Some of these industrial sectors are: petroleum production, petroleum refining and products, chemical, energy and consumer products [1]. However, as it has been widely reported in literature [2-6], one of the most affected industrial sectors by the paraffin crystallization phenomena is the petroleum industry. Crude oils contain heavy paraffins that may form solid wax phases at low temperature in the pipelines and hydrocarbon production facilities. The problems caused by wax precipitation decreasing production rates and failure of facilities, are a major concern in the production and transportation of hydrocarbon fluids [7]. Paraffin waxes are mixtures of a wide range of high molecular weight alkanes that can crystallize from crude oils or solutions primarily due to temperature decreasing. They are rather non-polar molecules and their interactions are expected to be van der Waals or London dispersion type [4]. Paraffin waxes consist of branched (iso), cyclic and straight chain (normal) alkanes having chain lengths in excess of 17 carbon atoms (C17) and potentially up to and over C100 [8]. However, despite the fact that crude oils are extremely complex systems containing a multitude of components, it is generally accepted that the crystallizing materials that form the deposits are primarily n-alkanes [9-10]. Therefore, in order to obtain a greater insight on the formation of wax deposits to prevent and solve these problems, it is necessary to get a deep knowledge of the mechanisms involved on the n-paraffins crystallization process.
Other industrial problems associated to the paraffin phase behavior have been reported in literature and summarized below. In diesel fuels production operations, fuel-filter plugging and other associated fuel handling problems can occur in cold weather due to paraffin crystallization. Moreover, fuels produced from Fischer–Tropsch syntheses that are currently
Applications of Calorimetry in a Wide Context – Differential Scanning Calorimetry, Isothermal Titration Calorimetry and Microcalorimetry 254
being investigated for converting natural gas to liquids (fuels) can be particularly problematic due to amounts of higher molecular weight paraffin wax produced [1]. Phase equilibrium data of n-alkane systems with different solvents are of importance for the safe and efficient operation of chemical plants. They are necessary for high-pressure polymerization processes and for the design of oil-recovery processes. Besides its importance for technological processes such as crystallization and purification at high pressure, phase equilibrium properties provides a good tool for examining the thermodynamic nature of many systems [11].Recently, the use of phase change material (PCM) thermal energy storage has gained considerable attention because of its high storage density (amount of energy stored per unit mass), and a narrow temperature range for charging and discharging the storage. Paraffin waxes have been used as PCM for many applications because of their advantageous thermal performances and phase behavior [12]. Finally, the control of crystallization processes is a problem of quite general relevance, which appears in many practical fields such as pharmaceutical and specialty chemical industries [13-15]. “Crystal design or engineering” enables, in principle, a direct handling of the structure, size, and shape of crystals entering into the elaboration of materials. Classical means of controlling size, morphology, and polymorphic expression of crystals make use of parameters such as temperature, pH, supersaturation, and solvent quality [15].
Some experimental techniques reported in literature such as Microscopy and X-ray diffraction are powerful methods to determine the crystal structures but give limited insight into the crystallization process [16], while others methods used to get the liquid-solid equilibrium of paraffins have been used [17-18], but they are very complex due to they require the establishment of the equilibrium at each temperature of interest and the measurement of the composition of the phases present. Finally, visual methods have been also reported to measure solubility and phase behavior of paraffin waxes [1, 19]; however, these methods cannot be applied to test dark samples (e.g. black crude oils) [20]. Hence, for the study and measurement of paraffin crystallization process, Differential scanning calorimetry (DSC) is an experimental method widely used due to its simplicity, accuracy and fast response to monitor the phase transitions during cooling and heating that gives related thermodynamic quantities such as heat capacity and enthalpies of transition [3, 14, 16, 20-23]. DSC has been usually used for the determination of wax appearance and/or dissolution temperatures (WAT or WDT) in petroleum products [3, 20]. The WAT or cloud point is the singularly most important parameter relating to wax formation [4] and it is the temperature at which waxes first crystallize from solution during a cooling process. So that accurate WAT measurements by using reliable methods such as DSC are desirable since it represents a key factor to characterize the wax precipitation phenomena.
The objective of this chapter is to present the use of DSC technique on the measurement and characterization of the liquid-solid phase equilibria of paraffins. First, the details of the DSC method and the experimental conditions used to get the key properties to characterize the liquid-solid phase equilibria of paraffins are described. Then, experimental studies about the effect of the chemical nature of solvent and asphaltenes on liquid-solid phase behavior of paraffinic model systems; are presented and discussed in these sections in order to show

Liquid-Solid Phase Equilibria of Paraffinic Systems by DSC Measurements 255
specific applications on the use of the Calorimetry to carry out relevant studies of phase equilibria properties. Finally, this chapter presents the characterization of the wax precipitation phenomena by using DSC measurements in crude oils that present solids deposition problems during their production and transporting, where the results obtained by using DSC technique are compared with those obtained with other techniques such as rheometry, spectroscopy and densitometry; in order to show advantages and disadvantages of the use of DSC method to measure liquid-solid phase equilibria of wax in crude oils.
2. DSC methodology applied to measure liquid-solid phase equilibria of paraffins
As it was mentioned above, there are many experimental works in literature [3, 14, 16, 20-23, 28-30] reporting the use of DSC to study the paraffins crystallization process. In this section, it is described the DSC methodology to characterize the liquid-solid phase equilibria of paraffins in model systems and crude oil samples. The objective of this section is to provide the details of the DSC technique and the experimental conditions used to get the key properties that characterize the liquid-solid phase equilibria of paraffins.
The measurement principle of differential scanning calorimetry (DSC) is based on the measurement of the difference in the heat flows to the sample crucible and reference crucible. These heat flows are directly proportional to the temperature difference between the furnace and crucible, but inversely proportional to the thermal resistance of the system. In Figure 1 is shown the measuring cell, furnace and liquid nitrogen cooling chamber of the Shimadzu DSC-60A differential scanning calorimeter used in the experiments to be presented in this work.
Figure 1. DSC measuring cell and temperature control system (Source: Shimadzu).

Applications of Calorimetry in a Wide Context – Differential Scanning Calorimetry, Isothermal Titration Calorimetry and Microcalorimetry 256
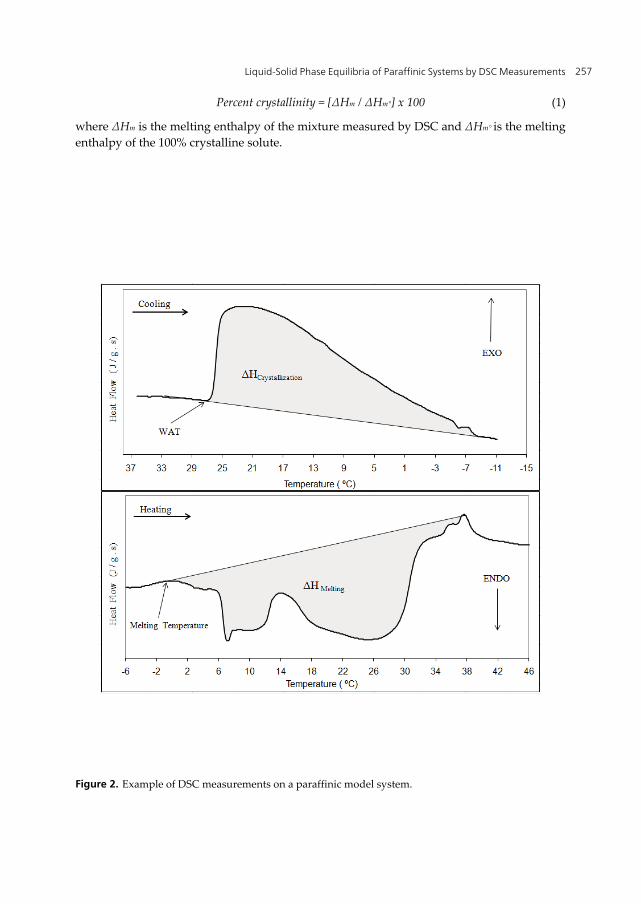
The method to obtain the liquid-solid phase equilibrium properties from DSC experiments is explained below. A calibration procedure of the DSC equipment should be performed before carrying out the experiments by using Indium or series of high purity normal paraffins as standard [22]. Each sample (between 10 and 20 mg) is first heated until reaching a temperature higher than expected crystallization onset temperature (WAT) but without reaching the boiling point of the sample. Then, the sample is held isothermally for 1 min., and then cooled to the desired temperature at a pre-defined rate. The cooling/heating rate can be variable; in general low heating/cooling rates would be desirable from an equilibrium point of view [20]. However, by using low cooling rates higher WAT are obtained with a loss of sensitivity to identify the DSC peak onsets, whereas high cooling rates depress measured WAT due to supercooling effects [20]. Differences about ± 1°C on DSC WAT measurements have been observed when using 1, 5 and 10 °C/min as cooling rates in single paraffin solutions [16]; whereas for crude oil mixtures and by using low cooling rates of 0.1 to 1 °C/min, differences about ± 1-2°C were reported [31] Therefore, in the experiments presented in the following sections, we employ a heating/cooling rate of 5 °C/min because it provided sufficient experimental speed and sensitivity to identify onsets of the exo and endothermic peaks. In order to delete any thermal history effects, two heating/cooling cycles are employed, so that crystallization and melting properties are obtained from the second cycle. The crystallization onset temperature (WAT) is determined as the onset of the exothermal peak during the cooling process corresponding to the liquid–solid transition. Under heating conditions, the melting temperature is recorded as the onset of the endothermal peak, whereas the wax disappearance temperature (WDT), temperature at which the last precipitated paraffin re-dissolves in the oil or solution, can be recorded as the endset of the solid–liquid endotherm. Finally, due to that the total energy released during cooling or heating process is proportional to the area between the base line and the exothermal peak or endothermal peak, respectively, the enthalpies of crystallization and melting of the waxy model systems are calculated from the integration of heat flow curve.
In Figure 2 is shown the determination of the equilibrium temperatures (WAT and melting temperature) as well as the enthalpies from the DSC thermograms according to the method explained above.
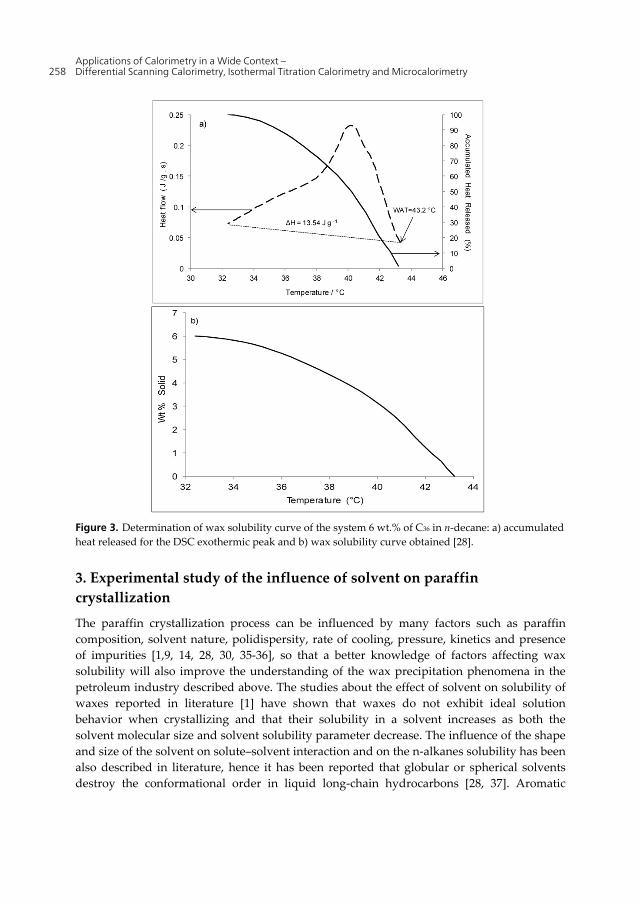
The DSC technique allows also the determination of the wax precipitation or solubility curve (amount of precipitated wax at different temperatures) as it has been reported [18, 28, 32-33]. It is carried out by assuming that the amount or fraction of precipitated wax in the total wax content is proportional to the percent of accumulated heat released in the total heat released (Crystallization enthalpy), thus the amount of precipitated wax at different temperatures can be determined by dividing the accumulated heat released by the heat of crystallization. This procedure is depicted in Figure 3, where the accumulated heat released for the exothermic peak related to the crystallization of the system 6 wt % of C36 in n-decane is plotted as an example [28].
Finally, by using DSC data, we can determine the degree of crystallinity for pure solutes in solvent systems or mixtures by using the following equation [28, 34]:
Liquid-Solid Phase Equilibria of Paraffinic Systems by DSC Measurements 257
Percent crystallinity = [ΔHm / ΔHm°] x 100 (1)
where ΔHm is the melting enthalpy of the mixture measured by DSC and ΔHm° is the melting enthalpy of the 100% crystalline solute.
Figure 2. Example of DSC measurements on a paraffinic model system.
Applications of Calorimetry in a Wide Context – Differential Scanning Calorimetry, Isothermal Titration Calorimetry and Microcalorimetry 258
Figure 3. Determination of wax solubility curve of the system 6 wt.% of C36 in n-decane: a) accumulated heat released for the DSC exothermic peak and b) wax solubility curve obtained [28].
3. Experimental study of the influence of solvent on paraffin crystallization
The paraffin crystallization process can be influenced by many factors such as paraffin composition, solvent nature, polidispersity, rate of cooling, pressure, kinetics and presence of impurities [1,9, 14, 28, 30, 35-36], so that a better knowledge of factors affecting wax solubility will also improve the understanding of the wax precipitation phenomena in the petroleum industry described above. The studies about the effect of solvent on solubility of waxes reported in literature [1] have shown that waxes do not exhibit ideal solution behavior when crystallizing and that their solubility in a solvent increases as both the solvent molecular size and solvent solubility parameter decrease. The influence of the shape and size of the solvent on solute–solvent interaction and on the n-alkanes solubility has been also described in literature, hence it has been reported that globular or spherical solvents destroy the conformational order in liquid long-chain hydrocarbons [28, 37]. Aromatic
Liquid-Solid Phase Equilibria of Paraffinic Systems by DSC Measurements 259
solvents have been reported as a help in both inhibiting wax crystal formation and decreasing the amount of the wax deposited [38]. The experimental studies reported in literature have been carried out evaluating the effect of the solvent on cloud point or wax dissolution temperatures. Nevertheless, the wax gelation and deposition processes are actually originated due to the amount of paraffin crystals formed during cooling below WAT. This makes important to evaluate the influence of solvent on the amount of crystallized paraffin at temperatures below WAT. Therefore, in this section is presented an application of the Differential Scanning Calorimetry (DSC) to study the liquid-solid phase behavior of a high molecular weight n-paraffin: hexatriacontane (C36H72), in presence of solvents of different chemical nature in order to get a better understanding of the interactions solute-solvent on the paraffin crystallization mechanism.
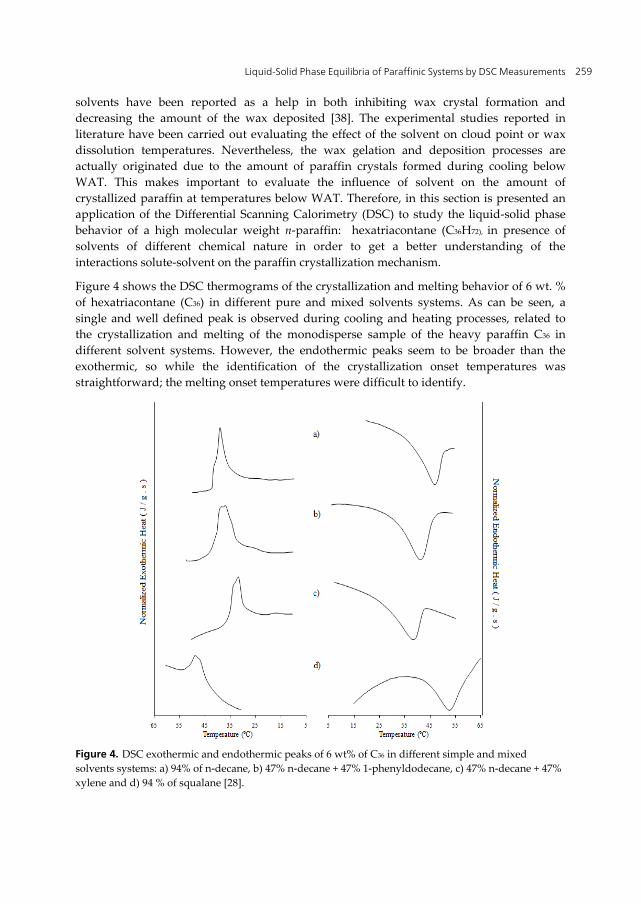
Figure 4 shows the DSC thermograms of the crystallization and melting behavior of 6 wt. % of hexatriacontane (C36) in different pure and mixed solvents systems. As can be seen, a single and well defined peak is observed during cooling and heating processes, related to the crystallization and melting of the monodisperse sample of the heavy paraffin C36 in different solvent systems. However, the endothermic peaks seem to be broader than the exothermic, so while the identification of the crystallization onset temperatures was straightforward; the melting onset temperatures were difficult to identify.
Figure 4. DSC exothermic and endothermic peaks of 6 wt% of C36 in different simple and mixed solvents systems: a) 94% of n-decane, b) 47% n-decane + 47% 1-phenyldodecane, c) 47% n-decane + 47% xylene and d) 94 % of squalane [28].
Applications of Calorimetry in a Wide Context – Differential Scanning Calorimetry, Isothermal Titration Calorimetry and Microcalorimetry 260
Crystallization and melting properties of the model systems investigated are shown in Table 1. The influence of the solvent aromaticity over the solution of C36 in n-decane was studied by adding mono-aromatic solvents: xylene and 1-phenyldodecane. The data show clearly the effect of the solvent chemistry on those properties. Lower values of crystallization and melting enthalpies are obtained in presence of aromatic solvents. The magnitude of the enthalpies decrease is related to the aromaticity of the solvent mixture, where greater aromaticity causes a greater diminishing of crystallization and melting enthalpies. Hence, the aromatic single rings interspersed among hexatriacontane molecules hinder their interactions, preventing an efficient ordering during cooling, then the paraffin crystal networks of a solid phase formed in such circumstance result significantly less ordered, as indicated by the lower values of the crystallinity index calculated from DSC data (see Table 2) for the model systems with aromatic solvents.
Solvent System WAT (°C)
Enthalpy of Crystallization
(J/g)
Melting Temperature
(°C)
Enthalpy of Melting
(J/g)
WDT (°C)
Solvent system aromaticity a
94 % n-decane 43.2 13.54 30.52 12.48 45.6 0 47% n-decane +
47% xylene 37.5 8.05 11.96 9.31 37.92 0.43
47% n-decane + 47% 1-
phenyldodecane47.5 10.66 20.25 10.09 41.82 0.12
94 % squalane 54.5 6.36 37.1 12.56 52.89 0 a Calculated as the aromaticity factor of aromatic solvent multiplied by its molar fraction in the mixture, where aromaticity factor of the xylene and 1-phenyldodecane are 0.75 and 0.333 respectively.
Table 1. Crystallization and melting properties of the system 6 % of C36 in different solvents systems [28]
Solvent System Onset Crystallization
Temperature (°C)
Endset Crystallization
Temperature (°C)
ΔTa
(°C)Δt b
(min)
DSC Crystallinity c
(%) 94 % n-decane 43.2 32.4 10.08 2.16 7.21
47% n-decane + 47% xylene
37.5 23.5 14 2.8 5.38
47% n-decane + 47% 1-phenyldodecane
47.5 22.5 25 5 5.83
94 % squalane 54.5 41.08 13.42 2.68 7.26 a ΔT = Onset - Endset b For a cooling rate = 5 °C/min c For a melting enthalpy of hexatriacontane = 172.9 J/g [39]
Table 2. DSC crystallization data of the system 6 % of C36 in different solvent systems [28]

Liquid-Solid Phase Equilibria of Paraffinic Systems by DSC Measurements 261
A way to explain the depressing effect of aromatic solvents over the enthalpies of crystallization and melting is through the entropy change that suffers the system during liquid - solid phase transition. It can be assumed that magnitude of the entropy change in the crystallization and melting processes for a paraffinic – aromatic mixture is lower than that for a 100% aliphatic system, like the C36 - n-decane system, because of the poor crystal network ordering of the solid phase formed in presence of aromatic solvents, which is reflected in the lower values of their crystallinity index. On another hand, a crystal network with greater disorder introduced by the aromatic molecules of the solvent is weaker, so its melting temperature tends to be lower. The WAT is also lowered due to the presence of aromatic solvents; however, in the case of the 1-phenyldodecane, a less aromatic solvent than xylene and with a greater molecular weight than decane, its aliphatic chain of 12 carbons has a significant “ordering” effect in the paraffinic crystal network that surpasses the effect of its aromatic rings regards to the depressing of the WAT and melting temperature observed with the xylene.
In contrast, by changing the solvent system from n-decane to squalane (a C24 aliphatic chain with six methyl branches), the WAT is significantly increased to 54.5 °C with a dramatic depression of the enthalpy of crystallization. This behavior is influenced by the size and structure of the solvent, in a similar way to that observed for the 1-phenyldodecane – n-decane solvent system. The methyl branches of the C24 iso-paraffin inhibits the efficient ordering of C36 molecules during crystallization process, forming a less ordered solid phase than that formed in C36-decane system, which is reflected in the low enthalpy of crystallization measured (6.36 J/g), on the other hand, the highest WAT observed is a consequence of the greater size of squalane with respect to decane. In fact, as has been reported, solubility decreases (greater WAT) as the solvent size increases due to the inability of the bigger solvent molecule to effectively contact and solvate the solute [1]. Furthermore, despite the disorder in the crystalline arrangement caused by the six methyl branches of the squalane, the effect of its size (24 carbon length) results in the highest values of both temperature and enthalpy of melting.
Table 1 shows also the WDT of C36 in different solvents during melting process. Under ideal conditions, the values of WAT and WDT should be similar; however, as has been reported [22] differences between both values can be attributed to the experimental uncertainty and kinetic effects (e.g. supercooling). Our DSC results showed differences in the range between 0.88-5.38 °C which could be attributed to the heating/cooling rate used of 5 °C/min. The effect of solvent chemistry on WDT of C36 was similar to that observed for the melting temperature discussed above.
The results presented before showed a significant influence of solvent chemistry on crystallization and melting of C36; however, in order to get a better understanding of the paraffin crystallization process in presence of solvents of different chemical structure at temperatures below WAT, solubility curves were obtained by using the DSC data as can be seen in Figure 5. As expected, the crystallization process of C36 in squalane starts before respect to the other systems, as a consequence of solvent chain length, followed by the other mixtures according to their respective WATs.
Applications of Calorimetry in a Wide Context – Differential Scanning Calorimetry, Isothermal Titration Calorimetry and Microcalorimetry 262
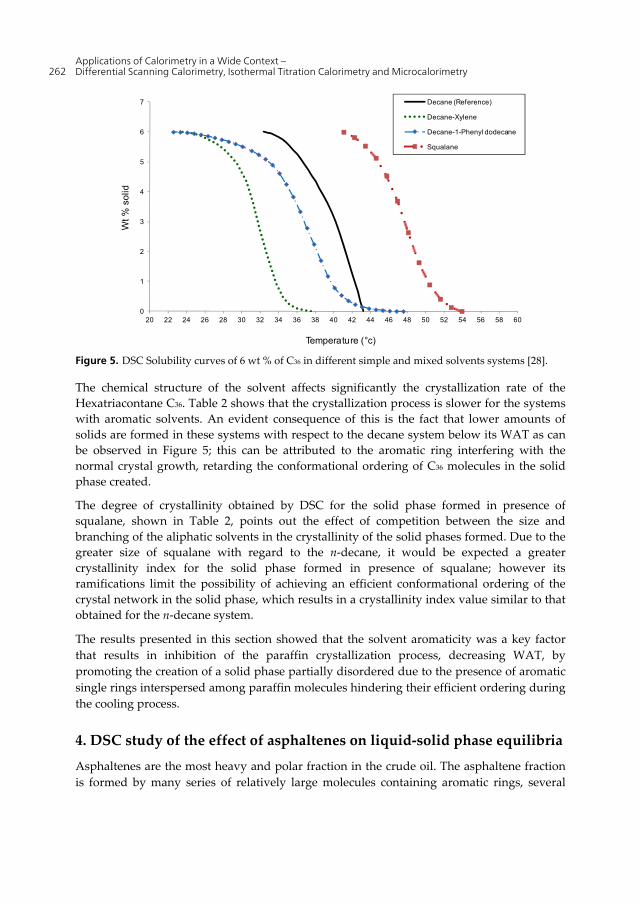
Figure 5. DSC Solubility curves of 6 wt % of C36 in different simple and mixed solvents systems [28].
The chemical structure of the solvent affects significantly the crystallization rate of the Hexatriacontane C36. Table 2 shows that the crystallization process is slower for the systems with aromatic solvents. An evident consequence of this is the fact that lower amounts of solids are formed in these systems with respect to the decane system below its WAT as can be observed in Figure 5; this can be attributed to the aromatic ring interfering with the normal crystal growth, retarding the conformational ordering of C36 molecules in the solid phase created.
The degree of crystallinity obtained by DSC for the solid phase formed in presence of squalane, shown in Table 2, points out the effect of competition between the size and branching of the aliphatic solvents in the crystallinity of the solid phases formed. Due to the greater size of squalane with regard to the n-decane, it would be expected a greater crystallinity index for the solid phase formed in presence of squalane; however its ramifications limit the possibility of achieving an efficient conformational ordering of the crystal network in the solid phase, which results in a crystallinity index value similar to that obtained for the n-decane system.
The results presented in this section showed that the solvent aromaticity was a key factor that results in inhibition of the paraffin crystallization process, decreasing WAT, by promoting the creation of a solid phase partially disordered due to the presence of aromatic single rings interspersed among paraffin molecules hindering their efficient ordering during the cooling process.
4. DSC study of the effect of asphaltenes on liquid-solid phase equilibria
Asphaltenes are the most heavy and polar fraction in the crude oil. The asphaltene fraction is formed by many series of relatively large molecules containing aromatic rings, several
0
1
2
3
4
5
6
7
20 22 24 26 28 30 32 34 36 38 40 42 44 46 48 50 52 54 56 58 60
Wt
% s
olid
Temperature (°c)
Decane (Reference)
Decane-Xylene
Decane-1-Phenyl dodecane
Squalane

Liquid-Solid Phase Equilibria of Paraffinic Systems by DSC Measurements 263
heteroaromatic and napthenic ring plus relatively short paraffinic branches [8]. Some authors have proposed that asphaltenes form aggregates with a core formed by aromatic regions, and aliphatic chains on the periphery interacting with the surrounding oil [40-41].
The aliphatic portions of the asphaltene permit an interaction of asphaltenes with waxes. A handful of studies have evaluated the asphaltene-wax interactions and their effect on wax crystallization and gelation properties [28-30, 42-45]. The study of the influence of the asphaltenes and their chemical nature on the wax crystallization phenomena of paraffinic model systems; is presented in this section. DSC measurements allowed getting crystallization properties of paraffinic model systems in presence of asphaltenes of different origin with different molecular structure.
The effect of asphaltenes was studied on liquid-solid equilibrium of the binary system: tetracosane (C24H50) - octacosane (C28H58). The composition used in these model systems was 15 and 10 wt% of C24 and C28 respectively in the following solvent systems: a) 75% of decane, b) mixture of 37.5 % of decane + 37.5 % of xylene and c) mixture of 37.5 % of decane + 37.0 % of xylene + 0.5 % of asphaltenes. The asphaltene samples used in this study, labeled as AsphPC and AsphIri, were extracted from two Mexican crude oils of the southern region. These asphaltenes of different chemical nature were characterized by using elemental analysis, vapor pressure osmometry, 1H and 13C NMR spectroscopy in order to get their molecular parameters. Details of the experimental techniques used for the characterization of these asphaltenes and their effect on phase-equilibrium and rheological properties of waxy model systems have been reported recently in literature [28, 30]. Some of the molecular parameters of these asphaltenes are shown in Table 3. As can be seen, the AsphPC asphaltenes are more aromatic than AsphIri asphaltenes, and its aromatic core is also bigger and more condensed, whereas the aromatic core of AsphIri asphaltenes is richer in alkyl substituents comprising methyl groups, alkyl chains and naphthenic rings [30]. DSC exothermic peaks of the model systems are plotted in Figure 6 and their crystallization properties are shown in Table 4.
Symbol Definition Asphaltene sample
AsphIri AsphPC
RA Aromatic rings 7.09 20.69
fa Aromaticity factor 0.50 0.67
Condensation index 0.53 0.71
n Average number of carbon atoms per alkyl
substituents 5.99 5.47
Aromatic substitution index 0.55 0.37
nac Average length of the alkyl chains 11.84 11.12
Table 3. Molecular parameters of AsphPC and AsphIri asphaltenes [30]

Applications of Calorimetry in a Wide Context – Differential Scanning Calorimetry, Isothermal Titration Calorimetry and Microcalorimetry 264
Figure 6. DSC exothermic peaks of the binary system C24-C28 in different solvent systems and with asphaltenes of different chemical nature [28].
Solvent System WAT(°C)
Enthalpy of Crystallization (J/g) Endset
(°C) ΔTa (°C)
Δtb
(min)
Decane 26.5 37.09 7 19.5 3.9
Decane-Xylene 24.81 36.51 6.09 18.72 3.74
Decane-Xylene + AsphIri 25.66 58.42 1 24.66 4.93
Decane-Xylene + AsphPC 21.77 33.01 0.53 21.24 4.24 aΔT = WAT - Endset; b For a cooling rate = 5 °C / min
Table 4. DSC crystallization data of the binary system C24-C28 in different solvent systems and with asphaltenes [28]
As can be observed, the presence of an aromatic solvent as the xylene decreases slightly both WAT and crystallization enthalpy due to the disorder-effects generated by the aromaticity as was discussed before. However, crystallization properties were notably affected by the presence of asphaltenes where their chemical nature played an important role. It has been reported that flocculated asphaltenes providing nucleation sites for waxes increase WAT [44], but also it has been reported [30] that asphaltenes decreased very slightly the WAT. According with other studies [45] the effect of the asphaltenes on the WAT depends of the aggregation state of the asphaltenes.
In these model systems, the results obtained showed a slight increasing of WAT due to presence of the aliphatic asphaltenes (AsphIri) and a decreasing in presence of the more aromatic asphaltenes (AsphPC) with respect to the C24-C28 in decane-xylene model system
0
0.2
0.4
0.6
0.8
1
1.2
051015202530
No
rmal
ized
exo
the
rmic
he
at
( J
/ g.
s)
Temperature (°C)
Decane
Decane-Xylene
Decane-Xylene + AsphIri
Decane-Xylene + AsphPC
Liquid-Solid Phase Equilibria of Paraffinic Systems by DSC Measurements 265
without asphaltenes. For another hand, the crystallization heat increases significantly in presence of AsphIri asphaltenes, whereas diminishes moderately in presence of AsphPC asphaltenes. These results make evident the effect of the chemical nature of different asphaltenes over the crystallization behavior of paraffinic systems. A greater abundance of aliphatic chains in AsphIri asphaltenes permits a better interaction with the paraffins of the C24-C28 system promoting co-crystallization phenomena, where the asphaltenes are partially integrated to the crystal network and probably acting as nucleation sites, causing a slight increasing of WAT. Moreover, the partial immobilization of the paraffins engaged in the interactions with the asphaltene alkyl chains may promote a “quasicrystallization” phenomenon of the paraffins in the asphaltene network, such interaction results in exothermic effects as has been reported in literature [46, 47], which explains the significant increasing of crystallization heat of the model system with AsphIri asphaltenes as observed in Table 4. On the other hand, the most aromatic asphaltenes (AsphPC) with a bigger and more condensed aromatic core and with a smaller amount of aliphatic substituents inhibit in some extent the paraffin-asphaltene interactions so that they cannot be incorporated to the paraffin crystal structure hindering nucleation process and crystal network growth, which results in a WAT decreasing with a lower crystallization enthalpy due to the formation of a disordered solid phase.
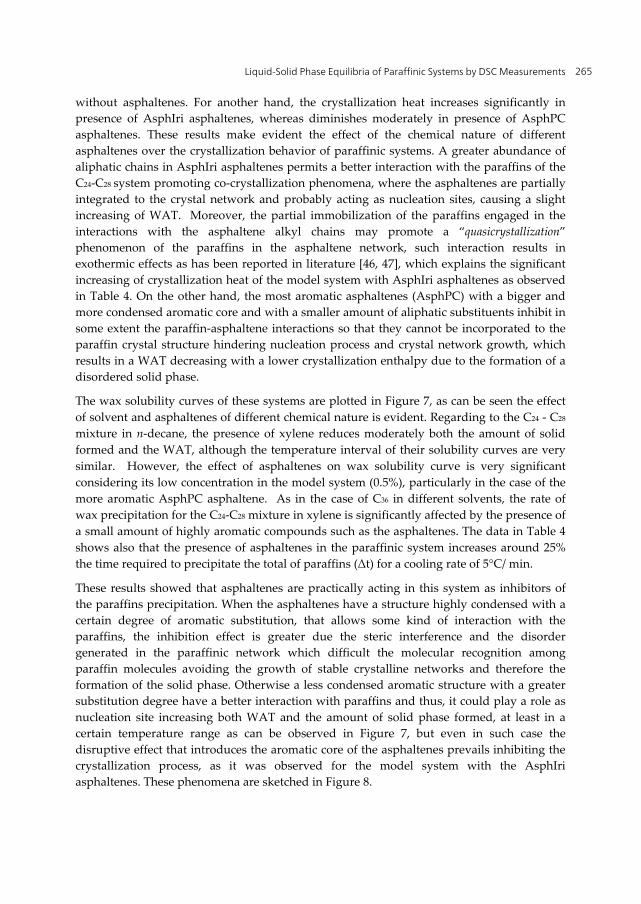
The wax solubility curves of these systems are plotted in Figure 7, as can be seen the effect of solvent and asphaltenes of different chemical nature is evident. Regarding to the C24 - C28 mixture in n-decane, the presence of xylene reduces moderately both the amount of solid formed and the WAT, although the temperature interval of their solubility curves are very similar. However, the effect of asphaltenes on wax solubility curve is very significant considering its low concentration in the model system (0.5%), particularly in the case of the more aromatic AsphPC asphaltene. As in the case of C36 in different solvents, the rate of wax precipitation for the C24-C28 mixture in xylene is significantly affected by the presence of a small amount of highly aromatic compounds such as the asphaltenes. The data in Table 4 shows also that the presence of asphaltenes in the paraffinic system increases around 25% the time required to precipitate the total of paraffins (Δt) for a cooling rate of 5°C/ min.
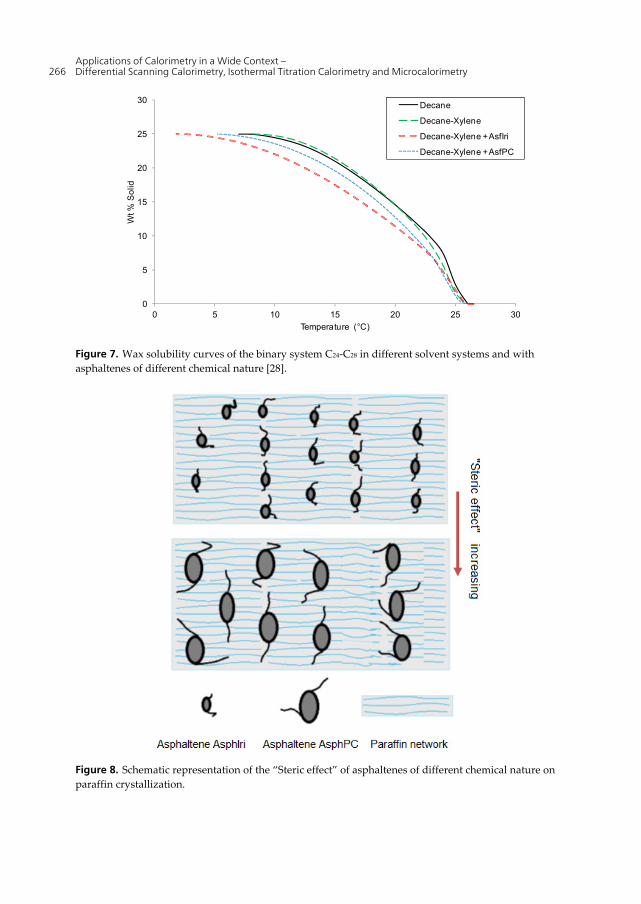
These results showed that asphaltenes are practically acting in this system as inhibitors of the paraffins precipitation. When the asphaltenes have a structure highly condensed with a certain degree of aromatic substitution, that allows some kind of interaction with the paraffins, the inhibition effect is greater due the steric interference and the disorder generated in the paraffinic network which difficult the molecular recognition among paraffin molecules avoiding the growth of stable crystalline networks and therefore the formation of the solid phase. Otherwise a less condensed aromatic structure with a greater substitution degree have a better interaction with paraffins and thus, it could play a role as nucleation site increasing both WAT and the amount of solid phase formed, at least in a certain temperature range as can be observed in Figure 7, but even in such case the disruptive effect that introduces the aromatic core of the asphaltenes prevails inhibiting the crystallization process, as it was observed for the model system with the AsphIri asphaltenes. These phenomena are sketched in Figure 8.
Applications of Calorimetry in a Wide Context – Differential Scanning Calorimetry, Isothermal Titration Calorimetry and Microcalorimetry 266
Figure 7. Wax solubility curves of the binary system C24-C28 in different solvent systems and with asphaltenes of different chemical nature [28].
Figure 8. Schematic representation of the “Steric effect” of asphaltenes of different chemical nature on paraffin crystallization.
0
5
10
15
20
25
30
0 5 10 15 20 25 30
Wt %
So
lid
Temperature (°C)
Decane
Decane-Xylene
Decane-Xylene + AsfIri
Decane-Xylene + AsfPC

Liquid-Solid Phase Equilibria of Paraffinic Systems by DSC Measurements 267
5. Wax precipitation study in crude oils by DSC measurements
With the ongoing trend in deep water developments, flow assurance has become a major technical and economic issue. The avoidance or remediation of wax deposition is one key aspect of flow assurance [3-4, 6-7]. In order to develop solutions to the wax deposition problem is necessary to get a deep understanding of the crystallization phenomena in which the crude oil composition, particularly the content of high molecular weight paraffins and asphaltenes have a significant impact [29]. Comparison of experimental methods for measurement of wax precipitation in crude oils have been reported in literature [5, 21, 24-27, 29], where wax detection limits vary depending on the measurement technique, oil composition, thermal history, time of measurement and fluid properties related to crystal nucleation and growth [27]. In this section is presented a characterization of the wax precipitation phenomena in crude oils by using DSC measurements. Wax appearance temperature is measured by using DSC and these results are compared with those obtained by using other techniques such as rheometry, spectroscopy and densitometry in order to show advantages and disadvantages of the use of DSC method to measure liquid-solid phase equilibria of waxes in crude oils. The importance to get the wax melting temperature and crystallinity degree by DSC is analyzed also as key parameters to evaluate the propensity of crude oils to present wax precipitation problems during crude oil production and transporting. Three Mexican crude oils of the southern region labeled as RDO1, RDO2 and J32 are studied in this work. Crude oils RDO1 and RDO2 present wax precipitation and deposition problems during their production and transportation, whereas crude oil J32 presents a severe asphaltene precipitation and deposition problem along the well during primary production. The cloud point temperatures of the crude oils and the crystallization and melting properties of their isolated waxes were determined by using the DSC method according to the procedures and conditions described and presented in section II of this chapter. However, in these experiments for waxes, under heating conditions, the wax melting point was recorded as their endothermic peak temperature.
In Figure 9 are shown the DSC thermograms of crude oils during cooling process. As it has been reported [22], during cooling, a decrease of the solvating power of the oil matrix results in precipitation of solid particles of wax.
The thermograms of crude oils RDO1 and RDO2 show one well defined exothermal peak from which the WAT can be easily determined 19.2 and 18.5°C respectively. In contrast the thermogram of crude oil J32 presents two exothermal peaks, first one well defined, a liquid-solid phase transition whose onset corresponding to a WAT of 28°C and a second one broad not well defined, with an onset around 20.8°C.
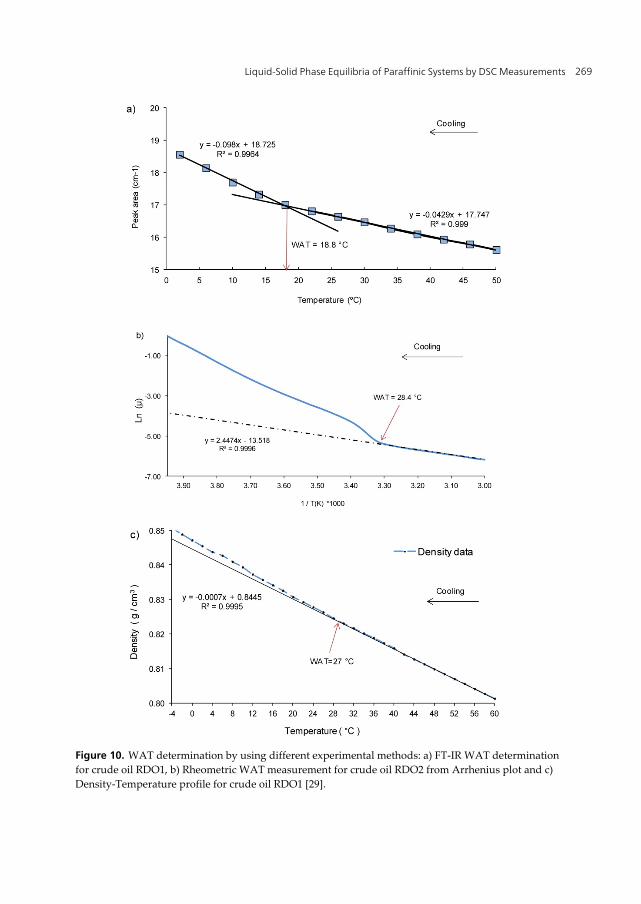
Other methods were employed to determine the WAT of the crude oil samples, these experimental techniques were fourier transform infrared spectroscopy (FT-IR), rheometry and densitometry. Figure 10 shows the WAT determination by these methods described briefly below. FT-IR method is based on the fact that the absorbance between the wave numbers 735 and 715 cm-1 attributed to the rocking vibrations of the long chain methylene (LCM) groups (the major component of the solid wax formed in crude oils), has been found

Applications of Calorimetry in a Wide Context – Differential Scanning Calorimetry, Isothermal Titration Calorimetry and Microcalorimetry 268
to increase with a decrease in temperature due to the formation of a solid phase [48]. Below the WAT, the higher absorptive of the solid phase made up of LCM grups, contributes strongly to the total absorbance, which gives rise a change in the slope of the plot of the area of the absorbance peak (735 to 715 cm-1) of each FT-IR spectrum as a function of the temperature. The temperature where the change in slope occurs is recorded as the WAT as observed in Figure 10 a). Rheometric WAT measurements were carried on the basis that petroleum fluids exhibit non-Newtonian behavior below WAT and Newtonian behavior above the WAT which follows the Arrhenius temperature dependence:
µ = A e Ea / RT (2)
where µ is the Newtonian dynamic viscosity, A is the Arrhenius pre-exponential factor, Ea is the activation energy of viscous flow, R is the universal gas constant and T is the absolute temperature. The formation and growing of solid wax crystals dispersed in the crude oil medium causes a viscosity increasing during a cooling process [35]. In this way, from viscosity-temperature curves, WAT is recorded as the temperature of the deviation of the Arrhenius law as it is shown in Figure 10 b). Finally, the WAT determination by using densitometry method is carried out by identifying the temperature at which a sharp change in the slope of density – temperature curve obtained during a cooling process that become evident the onset of wax crystallization as can be observed in Figure 10 c).
Figure 9. Exothermic peaks from DSC Thermograms of crude oils during cooling [29].
Título del eje
Crude oil RDO1
WAT
Cooling
EXO
Hea
t F
low
(m
W)
Crude oil RDO2
WAT
4 6 8 10 12 14 16 18 20 22 24 26 28 30
Temperature (ºC)
Crude oil J32
WATSolid-solid phase transition
Liquid-Solid Phase Equilibria of Paraffinic Systems by DSC Measurements 269
Figure 10. WAT determination by using different experimental methods: a) FT-IR WAT determination for crude oil RDO1, b) Rheometric WAT measurement for crude oil RDO2 from Arrhenius plot and c) Density-Temperature profile for crude oil RDO1 [29].
Applications of Calorimetry in a Wide Context – Differential Scanning Calorimetry, Isothermal Titration Calorimetry and Microcalorimetry 270
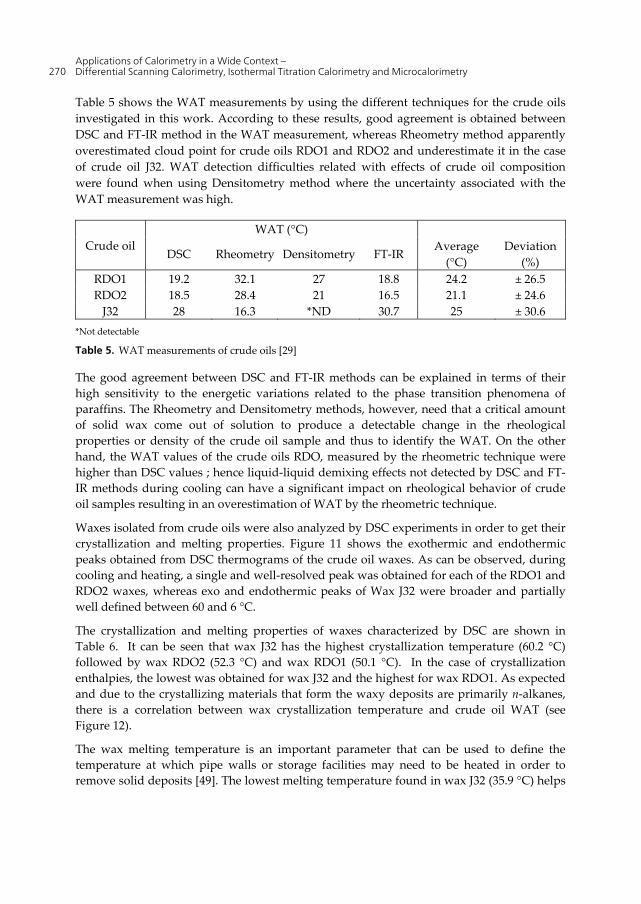
Table 5 shows the WAT measurements by using the different techniques for the crude oils investigated in this work. According to these results, good agreement is obtained between DSC and FT-IR method in the WAT measurement, whereas Rheometry method apparently overestimated cloud point for crude oils RDO1 and RDO2 and underestimate it in the case of crude oil J32. WAT detection difficulties related with effects of crude oil composition were found when using Densitometry method where the uncertainty associated with the WAT measurement was high.
Crude oil WAT (°C)
DSC Rheometry Densitometry FT-IR Average
(°C) Deviation
(%) RDO1 19.2 32.1 27 18.8 24.2 ± 26.5 RDO2 18.5 28.4 21 16.5 21.1 ± 24.6
J32 28 16.3 *ND 30.7 25 ± 30.6 *Not detectable
Table 5. WAT measurements of crude oils [29]
The good agreement between DSC and FT-IR methods can be explained in terms of their high sensitivity to the energetic variations related to the phase transition phenomena of paraffins. The Rheometry and Densitometry methods, however, need that a critical amount of solid wax come out of solution to produce a detectable change in the rheological properties or density of the crude oil sample and thus to identify the WAT. On the other hand, the WAT values of the crude oils RDO, measured by the rheometric technique were higher than DSC values ; hence liquid-liquid demixing effects not detected by DSC and FT-IR methods during cooling can have a significant impact on rheological behavior of crude oil samples resulting in an overestimation of WAT by the rheometric technique.
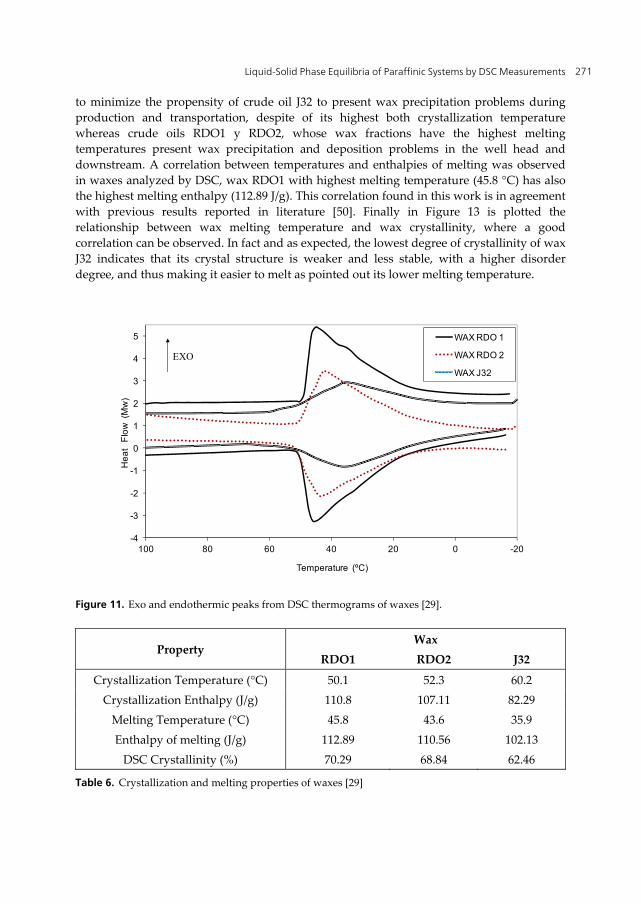
Waxes isolated from crude oils were also analyzed by DSC experiments in order to get their crystallization and melting properties. Figure 11 shows the exothermic and endothermic peaks obtained from DSC thermograms of the crude oil waxes. As can be observed, during cooling and heating, a single and well-resolved peak was obtained for each of the RDO1 and RDO2 waxes, whereas exo and endothermic peaks of Wax J32 were broader and partially well defined between 60 and 6 °C.
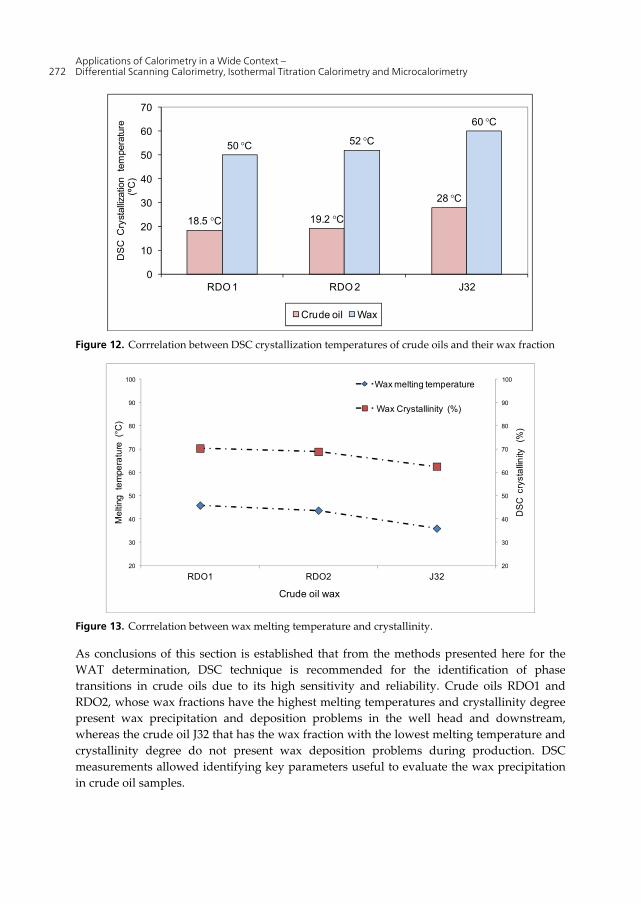
The crystallization and melting properties of waxes characterized by DSC are shown in Table 6. It can be seen that wax J32 has the highest crystallization temperature (60.2 °C) followed by wax RDO2 (52.3 °C) and wax RDO1 (50.1 °C). In the case of crystallization enthalpies, the lowest was obtained for wax J32 and the highest for wax RDO1. As expected and due to the crystallizing materials that form the waxy deposits are primarily n-alkanes, there is a correlation between wax crystallization temperature and crude oil WAT (see Figure 12).
The wax melting temperature is an important parameter that can be used to define the temperature at which pipe walls or storage facilities may need to be heated in order to remove solid deposits [49]. The lowest melting temperature found in wax J32 (35.9 °C) helps
Liquid-Solid Phase Equilibria of Paraffinic Systems by DSC Measurements 271
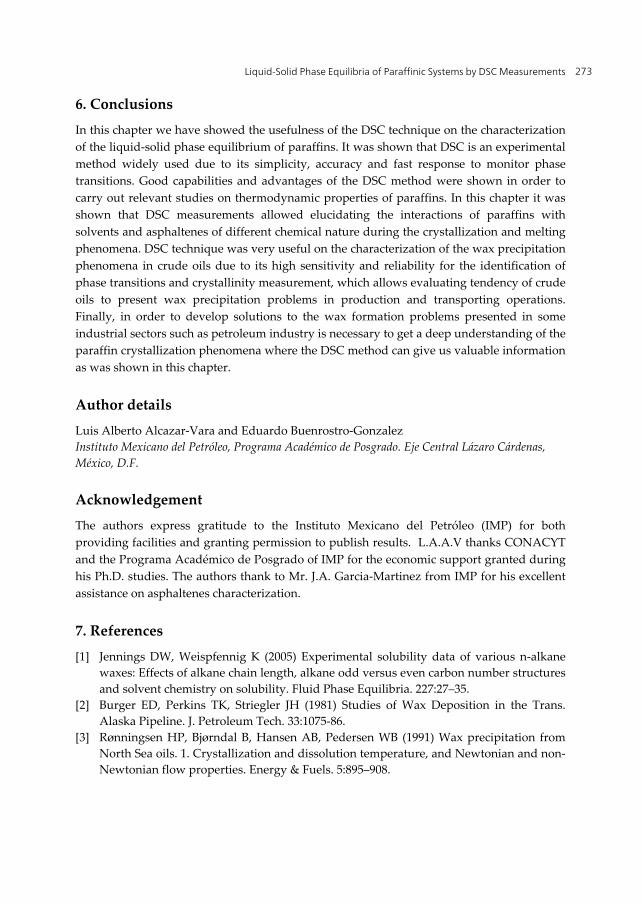
to minimize the propensity of crude oil J32 to present wax precipitation problems during production and transportation, despite of its highest both crystallization temperature whereas crude oils RDO1 y RDO2, whose wax fractions have the highest melting temperatures present wax precipitation and deposition problems in the well head and downstream. A correlation between temperatures and enthalpies of melting was observed in waxes analyzed by DSC, wax RDO1 with highest melting temperature (45.8 °C) has also the highest melting enthalpy (112.89 J/g). This correlation found in this work is in agreement with previous results reported in literature [50]. Finally in Figure 13 is plotted the relationship between wax melting temperature and wax crystallinity, where a good correlation can be observed. In fact and as expected, the lowest degree of crystallinity of wax J32 indicates that its crystal structure is weaker and less stable, with a higher disorder degree, and thus making it easier to melt as pointed out its lower melting temperature.
Figure 11. Exo and endothermic peaks from DSC thermograms of waxes [29].
Property Wax
RDO1 RDO2 J32
Crystallization Temperature (°C) 50.1 52.3 60.2 Crystallization Enthalpy (J/g) 110.8 107.11 82.29
Melting Temperature (°C) 45.8 43.6 35.9 Enthalpy of melting (J/g) 112.89 110.56 102.13
DSC Crystallinity (%) 70.29 68.84 62.46
Table 6. Crystallization and melting properties of waxes [29]
-4
-3
-2
-1
0
1
2
3
4
5
-20020406080100
He
at
Flo
w (
Mw
)
Temperature (ºC)
WAX RDO 1
WAX RDO 2
WAX J32
EXO
Applications of Calorimetry in a Wide Context – Differential Scanning Calorimetry, Isothermal Titration Calorimetry and Microcalorimetry 272
Figure 12. Corrrelation between DSC crystallization temperatures of crude oils and their wax fraction
Figure 13. Corrrelation between wax melting temperature and crystallinity.
As conclusions of this section is established that from the methods presented here for the WAT determination, DSC technique is recommended for the identification of phase transitions in crude oils due to its high sensitivity and reliability. Crude oils RDO1 and RDO2, whose wax fractions have the highest melting temperatures and crystallinity degree present wax precipitation and deposition problems in the well head and downstream, whereas the crude oil J32 that has the wax fraction with the lowest melting temperature and crystallinity degree do not present wax deposition problems during production. DSC measurements allowed identifying key parameters useful to evaluate the wax precipitation in crude oil samples.
18.5 °C 19.2 °C
28 °C
50 °C 52 °C
60 °C
0
10
20
30
40
50
60
70
RDO 1 RDO 2 J32
DS
C C
ryst
alliz
atio
n t
empe
ratu
re(º
C)
Crude oil Wax
20
30
40
50
60
70
80
90
100
20
30
40
50
60
70
80
90
100
RDO1 RDO2 J32
DS
C c
ryst
alli
nity
(%
)
Me
lting
te
mpe
ratu
re (
°C)
Crude oil wax
Wax melting temperature
Wax Crystallinity (%)
Liquid-Solid Phase Equilibria of Paraffinic Systems by DSC Measurements 273
6. Conclusions
In this chapter we have showed the usefulness of the DSC technique on the characterization of the liquid-solid phase equilibrium of paraffins. It was shown that DSC is an experimental method widely used due to its simplicity, accuracy and fast response to monitor phase transitions. Good capabilities and advantages of the DSC method were shown in order to carry out relevant studies on thermodynamic properties of paraffins. In this chapter it was shown that DSC measurements allowed elucidating the interactions of paraffins with solvents and asphaltenes of different chemical nature during the crystallization and melting phenomena. DSC technique was very useful on the characterization of the wax precipitation phenomena in crude oils due to its high sensitivity and reliability for the identification of phase transitions and crystallinity measurement, which allows evaluating tendency of crude oils to present wax precipitation problems in production and transporting operations. Finally, in order to develop solutions to the wax formation problems presented in some industrial sectors such as petroleum industry is necessary to get a deep understanding of the paraffin crystallization phenomena where the DSC method can give us valuable information as was shown in this chapter.
Author details
Luis Alberto Alcazar-Vara and Eduardo Buenrostro-Gonzalez Instituto Mexicano del Petróleo, Programa Académico de Posgrado. Eje Central Lázaro Cárdenas, México, D.F.
Acknowledgement
The authors express gratitude to the Instituto Mexicano del Petróleo (IMP) for both providing facilities and granting permission to publish results. L.A.A.V thanks CONACYT and the Programa Académico de Posgrado of IMP for the economic support granted during his Ph.D. studies. The authors thank to Mr. J.A. Garcia-Martinez from IMP for his excellent assistance on asphaltenes characterization.
7. References
[1] Jennings DW, Weispfennig K (2005) Experimental solubility data of various n-alkane waxes: Effects of alkane chain length, alkane odd versus even carbon number structures and solvent chemistry on solubility. Fluid Phase Equilibria. 227:27–35.
[2] Burger ED, Perkins TK, Striegler JH (1981) Studies of Wax Deposition in the Trans. Alaska Pipeline. J. Petroleum Tech. 33:1075-86.
[3] Rønningsen HP, Bjørndal B, Hansen AB, Pedersen WB (1991) Wax precipitation from North Sea oils. 1. Crystallization and dissolution temperature, and Newtonian and non-Newtonian flow properties. Energy & Fuels. 5:895–908.
Applications of Calorimetry in a Wide Context – Differential Scanning Calorimetry, Isothermal Titration Calorimetry and Microcalorimetry 274
[4] Leontaritis KJ (1995) The Asphaltene and Wax Deposition Envelopes. The Symposium on Thermodynamics of Heavy Oils and Asphaltenes, Area 16C of Fuels and Petrochemical Division, AIChE Spring National Meeting and Petroleum Exposition, Houston, Texas, March 19-23.
[5] Hammami A, Raines MA (1999) Paraffin Deposition from Crude Oils: Comparison of Laboratory Results to Field data. SPE Journal. 4(1):9-18.
[6] Alboudwarej H, Huo Z, Kempton E (2006) Flow-Assurance Aspects of Subsea Systems Design for Production of Waxy Crude Oils. SPE Annual Technical Conference and Exhibition in San Antonio, Texas, USA. 24-27 September.
[7] Coutinho JAP, Edmonds B, Moorwood T, Szczepanski R, Zhang X (2006) Reliable wax predictions for flow assurance. Energy & Fuels. 20:1081–1088.
[8] Speight JG (1999) The Chemistry and Technology of Petroleum (3rd ed.), Marcel-Dekker, New York.
[9] Garcia MD, Orea M, Carbognani L, Urbina A (2001) The Effect of Paraffinic Fractions on Crude Oil Wax Crystallization. Petroleum Science and Technology. 19(12):189–196.
[10] Garcia MD, Urbina A (2003) Effect of Crude Oil Composition and Blending on Flowing Properties. Petroleum Science and Technology. 21(5-6):863–878.
[11] Domanska U, Morawski P (2005) Influence of Size and Shape Effects on the High-Pressure Solubility of n-Alkanes: Experimental Data, Correlation and Prediction. Journal of Chemical Thermodynamics. 37:1276-1287.
[12] He B, Martin V, Setterwall F (2004) Phase Transition Temperature Ranges and Storage Density of Paraffin Wax Phase Change Materials. Energy. 29: 1785–1804.
[13] Giron D (2002) Applications of Thermal Analysis and Coupled Techniques in Pharmaceutical Industry. Journal of thermal analysis and Calorimetry. 68: 335-357.
[14] Senra M, Panacharoensawad E, Kraiwattanawong K, Singh P, Fogler HS (2008) Role of n-Alkane Polydispersity on the Crystallization of n-Alkanes from Solution. Energy & Fuels. 22:545–555.
[15] Marie E, Chevalier Y, Eydoux F, Germanaud L, Flores P (2005) Control of n-Alkanes Crystallization by Ethylene-Vinyl Acetate Copolymers. Journal of Colloid and Interface Science. 290(2):406-418.
[16] Guo X, Pethica BA, Huang JS, Prud’homme RK (2004) Crystallization of Long-Chain n-Paraffins from Solutions and Melts As Observed by Differential Scanning Calorimetry. Macromolecules. 37:5638–5645.
[17] Van Winkle TL, Affens WA, Beal EJ, Mushrush GW, Hazlett RN, DeGuzman J (1987) Determination of Liquid and Solid Phase Composition in Partially Frozen Middle Distillate Fuels. Fuel. 66(7):890-896.
[18] Coutinho JAP, Ruffier-Meray V (1997) Experimental Measurements and Thermodynamic Modeling of Paraffinic Wax Formation in Undercooled Solutions. Ind. Eng. Chem. Res. 36:4977– 4983.
[19] Bhat NV, Mehrotra AK (2004) Measurement and Prediction of the Phase Behavior of Wax-Solvent Mixtures: Significance of Wax Disappearance Temperature. Ind. Eng. Chem. Res. 43(12): 3451-3461.
Liquid-Solid Phase Equilibria of Paraffinic Systems by DSC Measurements 275
[20] Hammami A, Ratulowski J, Coutinho JAP (2003) Cloud Points: Can We Measure or Model them? .Petroleum Science and Technology. 21(3&4):345-358.
[21] Hammami A, Raines MA (1999) Paraffin Deposition from Crude Oils: Comparison of Laboratory Results to Field data. SPE J. 4(1): 9-18
[22] Hansen AB, Larsen E, Pedersen WB, Nielsen AB (1991) Wax precipitation from North Sea crude oils. 3. Precipitation and dissolution of wax studied by differential scanning calorimetry. Energy & Fuels. 5:914–923.
[23] Guo X, Pethica BA, Huang JS, Adamson DH, Prud’homme RK (2006) Effect of Cooling Rate on Crystallization of Model Waxy Oils with Microcrystalline Poly(ethylene butane). Energy & Fuels. 20:250–256.
[24] Monger-McClure TG, Tackett JE, Merrill LS (1999) Comparisons of Cloud Point Measurement and Paraffin Prediction Methods .SPE Production & Facilities. 14(1):4–10.
[25] Lira-Galeana C, Hammami A (2000) Wax Precipitation from Petroleum Fluids: A Review. in: Asphaltenes and Asphalts 2. Yen TF, Chilingarian G eds. Elsevier Science Publishers: Holland. pp. 557-608.
[26] Leontaritis KJ, Leontaritis JD (2003) Cloud Point and Wax Deposition Measurement Techniques. SPE Paper No. 80267, SPE International Symposium on Oilfield Chemistry, Houston, Texas. February 5-8.
[27] Coutinho JAP, Daridon JL (2005) The Limitations of the Cloud Point Measurement Techniques and the Influence of the Oil Composition on its Detection. Petroleum Science and Technology. 23: 1113-1128.
[28] Alcazar-Vara LA, Buenrostro-Gonzalez E (2012) Experimental Study of the Influence of Solvent and Asphaltenes on Liquid-Solid Phase Behavior of Paraffinic Model Systems by using DSC and FT-IR Techniques. Journal of Thermal Analysis and Calorimetry. 107(3): 1321-1329.
[29] Alcazar-Vara LA, Buenrostro-Gonzalez E (2011) Characterization of the Wax Precipitation in Mexican Crude Oils. Fuel Processing Technology. 92(1): 2366–2374.
[30] Alcazar-Vara LA, Garcia-Martinez JA, Buenrostro-Gonzalez E (2012) Effect of Asphaltenes on Equilibrium and Rheological Properties of Waxy Model Systems. Fuel. 93: 200–212.
[31] Svetlichnyy DS, Didukh AG, Aldyarov AT, Kim DA, Nawrocki M, Baktygali AA (2011) Study of Heat Treatment and Cooling Rate of Oil Mixtures Transported by “Kumkol-Karakoin-Barsengir-Atasu” Pipeline. Online journal Oil and Gas Business. Available: http://www.ogbus.ru/eng/authors/Svetlichnyy. Accessed 2012 April 13.
[32] Han S, Huang Z, Senra M, Hoffmann R, Fogler HS (2010) Method to Determine the Wax Solubility Curve in Crude Oil from Centrifugation and High Temperature Gas Chromatography Measurements. Energy & Fuels. 24:1753-1761.
[33] Coto B, Martos C, Peña JL, Espada JJ, Robustillo MD (2008) A New Method for the Determination of Wax Precipitation from non-Diluted Crude Oils by Fractional Precipitation. Fuel. 87: 2090-2094.
[34] Conti DS, Yoshida MI, Pezzin SH, Coelho LAF (2006) Miscibility and Crystallinity of Poly(3-hydroxybutyrate)/Poly(3-hydroxybutyrate-co-3-hydroxyvalerate) Blends. Thermochimica Acta. 450:61–66.
Applications of Calorimetry in a Wide Context – Differential Scanning Calorimetry, Isothermal Titration Calorimetry and Microcalorimetry 276
[35] Paso K, Senra M, Yi Y, Sastry AM, Fogler HS (2005) Paraffin Polydispersity Facilitates Mechanical Gelation. Ind. Eng. Chem. Res. 44:7242-7254.
[36] Vieira LC, Buchuid MB, Lucas EF (2010) Effect of Pressure on the Crystallization of Crude Oil Waxes. II. Evaluation of Crude Oils and Condensate. Energy & Fuels. 24:2213-2220.
[37] Domanska U, Morawski P (2005) Influence of Size and Shape Effects on the High-Pressure Solubility of n-Alkanes: Experimental Data, Correlation and Prediction. Journal of Chemical Thermodynamics. 37:1276-1287.
[38] Rakotosaona R, Bouroukba M, Petitjean D, Dirand M (2008) Solubility of a Petroleum Wax with an Aromatic Hydrocarbon in a Solvent. Energy & Fuels. 22:784–789.
[39] Dirand M, Bouroukba M, Chevallier V, Petitjean D, Behar E, Ruffier-Meray V (2002) Normal Alkanes, Multialkane Synthetic Model Mixtures, and Real Petroleum Waxes: Crystallographic Structures. Thermodynamic Properties and Crystallization. J. Chem. Eng. Data. 47:115−143.
[40] Mullins OC, Betancourt SS, Cribbs ME, Dubost FX, Creek JL, Andrews AB, Venkataramanan L (2007) The Colloidal Structure of Crude Oil and the Structure of Oil Reservoirs. Energy & Fuels. 21(5):2785-2794.
[41] Carbognani L, Rogel E (2003) Solid Petroleum Asphaltenes Seem Surrounded by Alkyl layers. Petroleum Science and Technology. 21(3-4):537-556.
[42] Garcia MD, Carbognani L (2001) Asphaltene-Paraffin Structural Interactions. Effect on Crude Oil Stability. Energy & Fuels. 15(5):1021-1027.
[43] Venkatesan R, Ostlund JA, Chawla H, Wattana P, Nyden M, Fogler HS (2003) The Effect of Asphaltenes on the Gelation of Waxy Oils. Energy & Fuels. 17(6):1630-1640.
[44] Kriz P, Andersen SI (2005) Effect of Asphaltenes on Crude Oil Wax Crystallization. Energy & Fuels. 19(3):948-953.
[45] Tinsley JF, Jahnke JP, Dettman HD, Prud’home RK (2009) Waxy Gels with Asphaltenes 1: Characterization of Precipitation, Gelation, Yield Stress, and Morphology. Energy & Fuels. 23(4):2056-2064.
[46] Mahmoud R, Gierycz P, Solimando R, Rogalski M (2005) Calorimetric Probing of n-Alkane-Petroleum Asphaltene Interactions. Energy & Fuels. 19:2474 –2479.
[47] Stachowiak C, Viguie J-R, Grolier J-P, Rogalski M (2005) Effect of n-Alkanes on Asphaltene Structuring in Petroleum Oils. Langmuir. 21:4824-4829.
[48] Roehner RM, Hanson FV (2001) Determination of Wax Precipitation Temperature and Amount of Precipitated Solid Wax versus Temperature for Crude Oils using FT-IR Spectroscopy. Energy & Fuels. 15:756–763.
[49] Flow assurance design guideline (2001) Deepstar IV project. [50] Alghanduri LM, Elgarni MM, Daridon JL, Coutinho JAP (2010) Characterization of
Libyan Waxy Crude Oils. Energy & Fuels. 24:3101–3107.