LIQUID PHASE 13C DYNAMIC NUCLEAR POLARIZATION STUDY …
86
LIQUID PHASE 13 C DYNAMIC NUCLEAR POLARIZATION STUDY OF MONOSUBSTITUTED AROMATIC COMPOUNDS by Li Song Thesis submitted to the Faculty of the Virginia Polytechnic Institute and State University In partial fulfillment of the requirements for the degree of Master of Science IN CHEMISTRY APPROVED: _________________________ Harry C. Dorn, Chairman __________________ _____________________ James Wolfe Mark R. Anderson September 18, 1997 Blacksburg, Virginia Key Words: Carbon, Dynamic, Nuclear, Polarization
Transcript of LIQUID PHASE 13C DYNAMIC NUCLEAR POLARIZATION STUDY …

LIQUID PHASE 13C DYNAMIC NUCLEAR POLARIZATIONSTUDY OF MONOSUBSTITUTED AROMATIC COMPOUNDS
by
Li Song
Thesis submitted to the Faculty of the
Virginia Polytechnic Institute and State University
In partial fulfillment of the requirements for the degree of
Master of Science
IN
CHEMISTRY
APPROVED:
_________________________Harry C. Dorn, Chairman
__________________ _____________________James Wolfe Mark R. Anderson
September 18, 1997
Blacksburg, Virginia
Key Words: Carbon, Dynamic, Nuclear, Polarization

LIQUID PHASE 13C DYNAMIC NUCLEAR POLARIZATIONSTUDY OF MONOSUBSTITUTED AROMATIC COMPOUND
by
Li Song
Committee Chairman: Harry C. DornChemistry
(ABSTRACT)
In this work, liquid phase 13C DNP experimental data were collected in a flow
transfer system for different mono-substituted aromatic compounds, such as, anisole,
nitrobenzene and halobenzenes. These substitute groups covered a wide range of
electronic effects from strong electron donating groups to strong electron withdrawing
groups.
Hammett linear free energy relationship was used to quantitatively study the
electronic effect of substituent on the 13C DNP enhancement. It was found that the 13C
DNP enhancements at meta and para positions exhibits a reasonable correlation. A better
correlation of 13C DNP enhancements with the Hammett inductive factor was observed.
A large scalar dominated enhancement at ipso (C-1) position was observed for
iodobenzene. This suggests that facile transfer of spin polarization to the C-1 carbon via
the highly polarizable iodine atom is possible and the dominate electron transfer
mechanism for this system.
A model of polarization transfer via spin diffusion of abundant 1H spins was
examined. The results indicate that it is not important.

iii
This thesis is dedicated to my parents and my wife.

iv
ACKNOWLEDGMENTS
I would like to express my sincere appreciation to my research advisor, Dr. Harry
C. Dorn, for his incomparable guidance, support, encouragement and understanding
given to me throughout the course of this work. I fell very fortunate to have had him as
my research advisor.
Many thanks to my committee member, Dr. James Wolfe and Dr. Mark Anderson
for their times, comments and suggestions.
I also would like to extend my appreciation to my colleagues of Dr. Dorn’s
research group. In particular, I’d like to thank Dr. Ziqi Sun for many helpful discussions
and taught me how to run the DNP experiment. Ms. Sandy Salido helped me a lot on
improving this thesis. Mr. Paul Burbank did a lot of work on repairing the HPLC pump.
Thanks also to: Mr. Tom Glass, Mr. Bill Bebout and Mr. Geno Iannaccone for
their help on showing me how to make the T1 measurement and probe tuning experiment.
I offer my deepest gratitude to my family and particularly to my parents for their
love and support. Finally, this thesis is dedicated to my wife for her understanding and
encouragement throughout this entire process.
This work was partial financial supported by NSF and EPA.
v
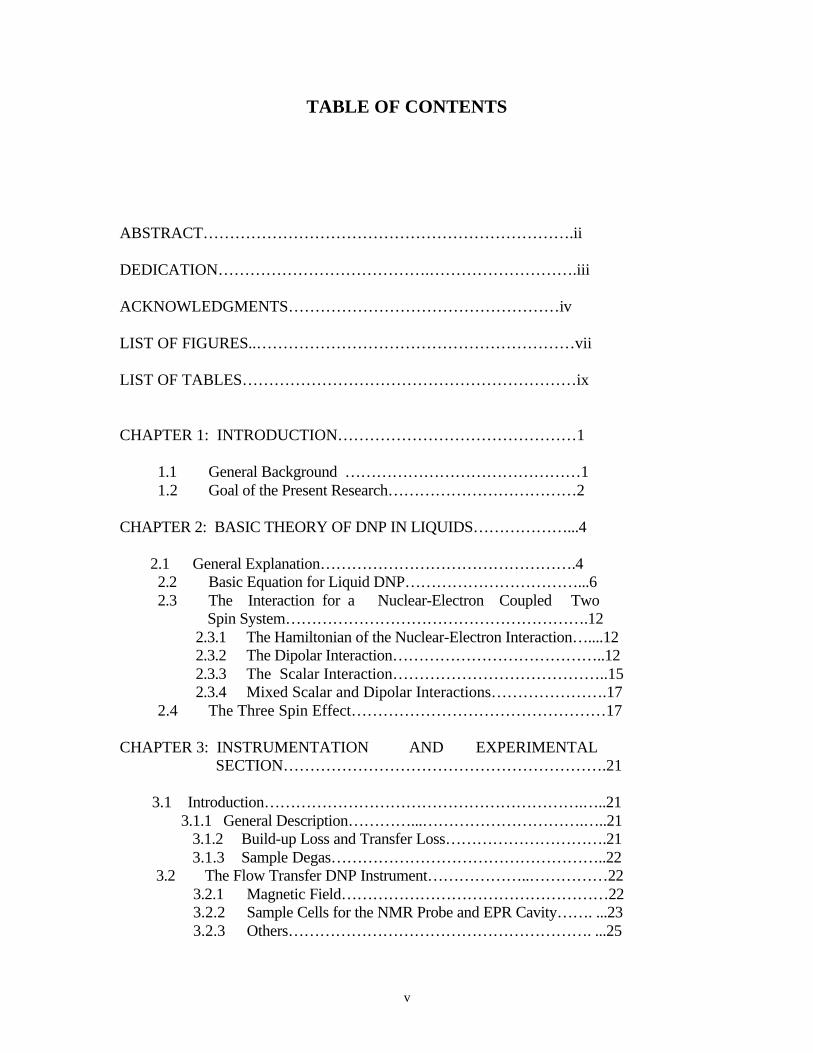
TABLE OF CONTENTS
ABSTRACT…………………………………………………………….ii
DEDICATION………………………………….……………………….iii
ACKNOWLEDGMENTS……………………………………………iv
LIST OF FIGURES..……………………………………………………vii
LIST OF TABLES………………………………………………………ix
CHAPTER 1: INTRODUCTION………………………………………1
1.1 General Background ………………………………………11.2 Goal of the Present Research………………………………2
CHAPTER 2: BASIC THEORY OF DNP IN LIQUIDS………………...4
2.1 General Explanation………………………………………….42.2 Basic Equation for Liquid DNP……………………………...62.3 The Interaction for a Nuclear-Electron Coupled Two Spin System………………………………………………….12
2.3.1 The Hamiltonian of the Nuclear-Electron Interaction…....122.3.2 The Dipolar Interaction…………………………………..122.3.3 The Scalar Interaction…………………………………..152.3.4 Mixed Scalar and Dipolar Interactions………………….17
2.4 The Three Spin Effect…………………………………………17
CHAPTER 3: INSTRUMENTATION AND EXPERIMENTAL SECTION…………………………………………………….21
3.1 Introduction…………………………………………………….…..21 3.1.1 General Description…………...………………………….…..21
3.1.2 Build-up Loss and Transfer Loss………………………….213.1.3 Sample Degas……………………………………………..22
3.2 The Flow Transfer DNP Instrument………………..……………223.2.1 Magnetic Field……………………………………………223.2.2 Sample Cells for the NMR Probe and EPR Cavity……. ...233.2.3 Others…………………………………………………. ...25
vi
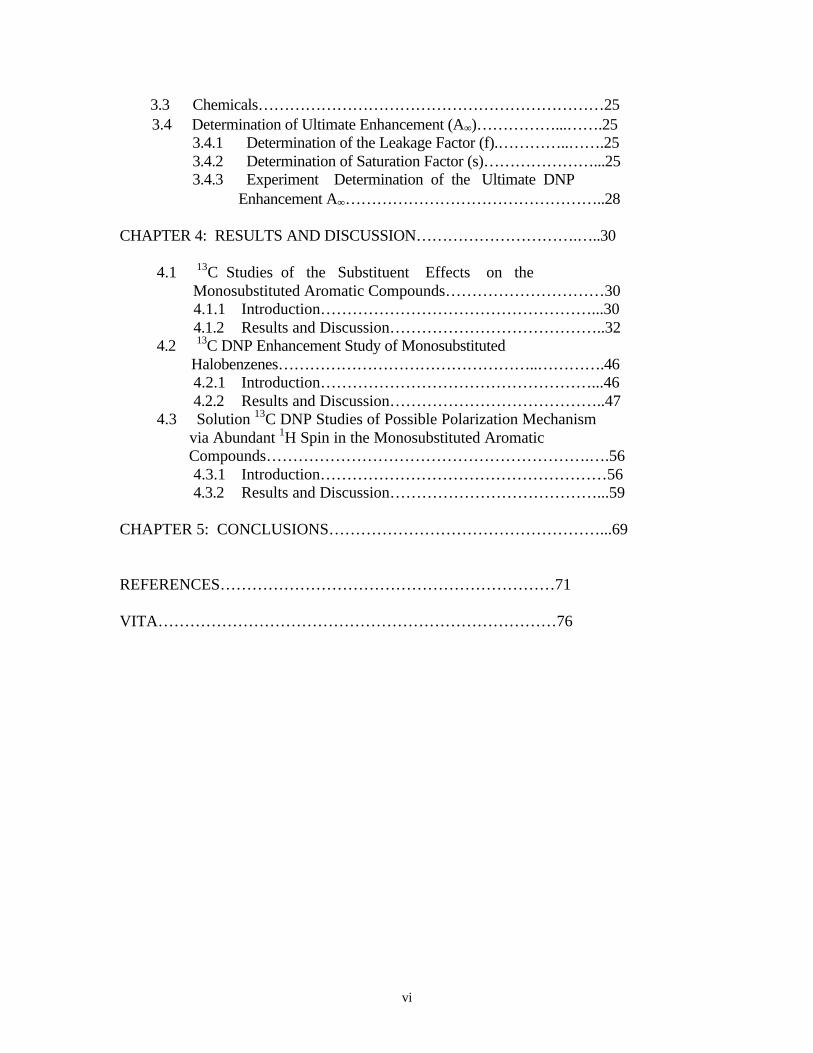
3.3 Chemicals…………………………………………………………25 3.4 Determination of Ultimate Enhancement (A∞)……………...…….25
3.4.1 Determination of the Leakage Factor (f).…………..…….253.4.2 Determination of Saturation Factor (s)…………………...253.4.3 Experiment Determination of the Ultimate DNP Enhancement A∞…………………………………………..28
CHAPTER 4: RESULTS AND DISCUSSION………………………….…..30
4.1 13C Studies of the Substituent Effects on the Monosubstituted Aromatic Compounds…………………………30
4.1.1 Introduction……………………………………………...304.1.2 Results and Discussion…………………………………..32
4.2 13C DNP Enhancement Study of Monosubstituted Halobenzenes…………………………………………..………….46
4.2.1 Introduction……………………………………………...464.2.2 Results and Discussion…………………………………..47
4.3 Solution 13C DNP Studies of Possible Polarization Mechanism via Abundant 1H Spin in the Monosubstituted Aromatic Compounds…………………………………………………….….56
4.3.1 Introduction………………………………………………564.3.2 Results and Discussion…………………………………...59
CHAPTER 5: CONCLUSIONS……………………………………………...69
REFERENCES………………………………………………………71
VITA…………………………………………………………………76

vii
LIST OF FIGURES
Fig. 2.1 Energy Level Diagram of the Nucleus-Electron Spin Coupled System with I=1/2 and S=1/2 (Cited from Ref. 9)…………..….5
Fig. 2.2 Nucleus-Electron Coupling Systems: (a) Two Spin Coupling System; (b) Three Spin Coupling System……………………....28
Fig. 3.1 Low to High Magnetic Field Flow Transfer DNP Experimental Apparatus (Cited From Ref. 10)…………………23
Fig. 3.2 Low to High Field Cells (Cited From Ref. 10)…………….……24
Fig. 3.3 13C 200 MHz Spin-Lattice Relaxation Time Plot for 0.50M Anisole/0.1M TEMPO in Cyclohexane……………………26
Fig. 3.4 13C Power Plot of Cyclohexane…………………………….27
Fig. 4.1 Meta 13C DNP Enhancements as a Function of the Hammett σm
Constant (from the comprehensive data given by Exner54)……35
Fig. 4.2 Para 13C DNP Enhancements as a Function of the Hammett σp
Constant (from the comprehensive data given by Exner54)……..36
Fig. 4.3 Meta 13C DNP Enhancements as a Function of the Hammett σI
Constant (from the comprehensive data given by Exner54)……..37
Fig. 4.4 Para 13C DNP enhancements as a Function of the Hammett σI
Constant (from the comprehensive data given by Exner54)……..38
Fig. 4.5 Para 13C DNP enhancements as a Function of the Hammett σI
Constant (from the comprehensive data given by Exner54)……..39
Fig. 4.6 LLIT 13C DNP Spectrum (50.1 MHz) for 50/50 (v/v) % Benzonitrile/Cyclohexane with 0.1 M TEMPO: (a) static NMR Spectrum (360 scans); (b) Flow DNP Spectrum (360 scans)…….40

viii
Fig. 4.7 LLIT 13C DNP Spectrum (50.1 MHz) for 20/80 (v/v) % Benzaldehyde/Cyclohexane with 0.1 M TEMPO: (a) static NMR Spectrum (3000 scans); (b) Flow DNP Spectrum (735 scans)……42
Fig. 4.8 LLIT 13C DNP Spectrum (50.1 MHz) for 20/80 (v/v) % Anisole/Cyclohexane with 0.1 M TEMPO: (a) static NMR Spectrum (1357 scans); (b) Flow DNP Spectrum (620 scans)….44
Fig. 4.9 Possible Electron Density Transfer Mechanisms……………48
Fig. 4.10 LLIT 13C DNP Spectrum (50.1 MHz) for 50/50 (v/v) % Chlorobenzene/Cyclohexane with 0.1 M TEMPO: (a) static NMR Spectrum (360 scans); (b) Flow DNP Spectrum (360 scans)…...50
Fig.4.11 LLIT 13C DNP Spectrum (50.1 MHz) for 50/50 (v/v) % Fluorobenzene/Cyclohexane with 0.1 M TEMPO: (a) static NMR Spectrum (3800 scans); (b) Flow DNP Spectrum (2000 scans)...52
Fig.4.12 LLIT 13C DNP Spectrum (50.1 MHz) for 50/50 (v/v) % Iodobenzene/Cyclohexane with 0.1 M TEMPO: (a) static NMR Spectrum (540 scans); (b) Flow DNP Spectrum (540 scans)…...54
Fig.4.13 Possible Mechanism for 13C DNP enhancements……………57
Fig.4.14 Polarization Transfer Mechanism Models (Via Abundant 1H Spins and Mutual Hydrogen Spin Flips)………58
Fig.4.15 LLIT 13C DNP Spectrum (50.1 MHz) for (a) 60/40 (v/v) % Benzene/Cyclohexane with 0.1 M TEMPO (32 scans); (b) 40/30 (v/v) % Benzene-d6/Cyclohexane with 0.1 M TEMPO (64 scans)..61
Fig.4.16 LLIT 13C DNP Spectrum (50.1 MHz) for (a) 50/50 (v/v) % Toluene/Cyclohexane with 0.1 M TEMPO (360 scans); (b) 50/50/10 (v/v) % Toluene-d6/CCl4/Cyclohexane with 0.1 M TEMPO (360 scans)……………………………………………63
Fig.4.17 LLIT 13C DNP Spectrum (50.1 MHz) for (a) 50/50/10 (v/v) % Bromobenzene/CCl4/Cyclohexane with 0.1 M TEMPO (420 scans); (b) 50/50/10 (v/v) % Bromobenzene-d5 /CCl4/Cyclohexane with
0.1 M TEMPO (1280 scans)……………………………66

ix
LIST OF TABLES
Table 4.1 13C Ultimate DNP Enhancements of 1-Chlorobezene, 1,2-Dichlorobenzene, 1,3,5-Trichlorobezene, Nitrobenzene and Toluene………………………………..31
Table 4.2 13C Ultimate DNP Enhancements for the Mono- Substituted Benzene/ TEMPO System………………..…33
Table 4.3 LLIT 13C DNP Relaxation and Enhancement Data for 50/50 (v/v) % Benzonitrile/Cyclohexane with
0.1 M TEMPO………………………………………41
Table 4.4 LLIT 13C DNP Relaxation and Enhancement Data for 20/80 (v/v) % Benzaldehyde/Cyclohexane with 0.1 M TEMPO……………………………………43
Table 4.5 LLIT 13C DNP Relaxation and Enhancement Data for 20/80 (v/v) % Anisole/Cyclohexane with 0.1 M TEMPO………………………………………..45
Table 4.6 13C DNP Enhancement (A∞) Summary of Four Monosubstituted Halobenzene…………………………….47
Table 4.7 LLIT 13C DNP Relaxation and Enhancement Data for 50/50 (v/v) % Chlorobenzene/Cyclohexane with 0.1 M TEMPO……………………………………51
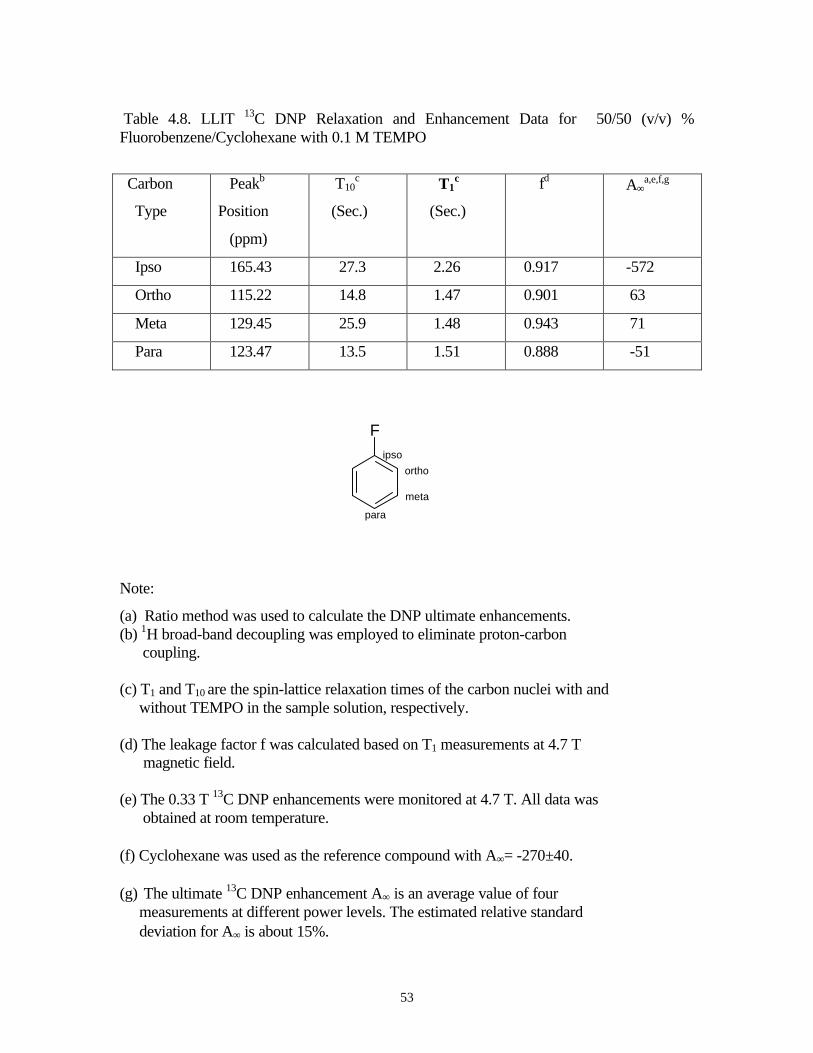
Table 4.8 LLIT 13C DNP Relaxation and Enhancement Data for 50/50 (v/v) % Fluorobenzene/Cyclohexane with 0.1 M TEMPO…………………………………53
Table 4.9 LLIT 13C DNP Relaxation and Enhancement Data for 50/50 (v/v) % Iodobenzene/Cyclohexane with 0.1 M TEMPO…………………………………55
Table 4.10 13C DNP Enhancement (A∞) Summary of Three Monosubstituted benzenes and Their Deuteron Analogs…….59
Table 4.11 LLIT 13C DNP Relaxation and Enhancement Data for 60/40 (v/v) % Benzene/Cyclohexane and 40/30 (v/v) % Benzene-d6/Cyclohexane with 0.1 M TEMPO……………….62

x
Table 4.12 LLIT 13C DNP Relaxation and Enhancement Data for 50/50 (v/v) % Toluene/Cyclohexane with 0.1 M TEMPO...…64
Table 4.13 LLIT 13C DNP Relaxation and Enhancement Data for 50/50 (v/v) % Toluene-d8/Cyclohexane with 0.1 M TEMPO..65
Table 4.14 LLIT 13C DNP Relaxation and Enhancement Data for 50/50/10 (v/v) % Bromobenzene/CCl4/Cyclohexane with 0.1 M TEMPO………………………………………67
Table 4.15 LLIT 13C DNP Relaxation and Enhancement Data for 50/50/10 (v/v) % Bromobenzene-d5 /CCl4/Cyclohexane with 0.1 M TEMPO………………………………………68

1
CHAPTER 1. INTRODUCTION
1.1 General Background
Purcell and Bloch and their co-workers first discovered the nuclear resonance effect
in 1945[1,2]. Since then, this physics experiment has shown great interest for chemists, for
this made it possible to use the technique of NMR as a spectroscopic method for studying
chemical compounds.
However, NMR has always suffered from the low sensitivity due to the extremely
small energy differences involved in nuclear spin transitions. For example, the population
rate between higher and lower energy levels at room temperature for 13C nuclei in a field of
4.7 T, which corresponds to a resonance frequency of 50.2 MHz, is 1.000008. The
population difference is thus very small, even for the most sensitive nucleus 1H. The
detection limits are in the range of 10-3 ~10-6g, which is two to three orders less sensitive in
magnitude than other spectroscopic methods such as mass spectroscopy, fluorescence
spectroscopy[9]. In the past 50 years, a lot of techniques have been developed to improve
the sensitivity of NMR[3,4]. Generally, there are three ways that can be used to increase the
sensitivity. The first one is to increase the magnetic field. The second one is to lower the
sample temperature. These two methods can only improve the signal-to-noise ratio by one
order in magnitude. The third one is to use the double magnetic resonance technique in
which the polarization transfer process is involved. Generally speaking, for any polarization
transfer technique, the theoretical signal enhancement is proportional to γS/γI . γS is the
magnetogyric ratio of some sensitive nuclear spin usually 1H or electron spin. γI is the
magnetogyric ratio of insensitive nuclei such as 13C and 15N. Nuclear-nuclear polarization

2
transfer techniques such as INEPT (insensitive nuclei enhanced by polarization
transfer)[57,58,59] and DEPT (distortionless enhancement by polarization transfer)[60,61]
can only increase the signal-to-noise by one order or less. This is mainly because the
difference of gyromagnetic ratio (γ) between sensitive nucleus and insensitive nucleus is so
small. Comparing to the γ of nuclear spin, the γ of electron spin is much larger which is two
to three orders larger in magnitude than the nuclear spin. Electron-nuclear double resonance
technique, which is also called dynamic nuclear polarization (DNP), provides a very
powerful and cheap approach to increase the sensitivity of the observed NMR signals. For
example, an enhanced factor of 660 and 2640 for 1H and 13C nuclei, respectively, can be
predicted.
As mentioned above DNP is an electron-nuclear double resonance technique, the
system subjected to DNP study usually contains of two non-identical spins: a nuclear spin
system which comes from solution and an unpaired electron spin system which comes from
the free radical. In solution, due to random molecular motion, the unpaired electron spins
interact with the nuclear spins. Because this kind of intermolecular interaction is spatial and
time dependent, the DNP technique not only can be used to dramatically improve the
sensitivity of the NMR signal but also can be used to study weak intermolecular
interactions, such as the molecular motion, mean distances for species in solutions, and
weak radical/solvent complex formation[5,6,7,8].
1.2 Goal of Present Research
Carbon-thirteen NMR has played a very important role in organic compounds
structure elucidation in liquids. However, due to very low natural abundance of 13C and low
gyromagnetic ratio, 13C NMR has always suffered the great disadvantage of very low
sensitivity. The DNP technique is a potential valuable tool in enhancing these weak NMR
signals. Great efforts have been made to study 13C DNP. According to previous 13C DNP
studies of monosubstituted aromatic compounds[9,10], it is hard to understand if there is any
relationship between 13C DNP enhancements of ring carbon and different substituted
groups. Thus the major objectives of this research work are: 1) to further reveal the

3
association between the different substituted groups with the 13C DNP enhancements of ring
carbon, 2) to study the mechanism of electron spin density transfer between TEMPO and the
carbon nuclei, and 3) to study the possibility of the intramolecular spin density transfer
within the benzene ring.

4
CHAPTER 2. BASIC THEORY OF DNP IN LIQUIDS
2.1 General Explanation
Dynamic nuclear polarization (DNP) is a double resonance technique. In a normal
DNP experiment, a stable free radical is added into the sample solution usually at a
concentration of 0.001 ~ 0.1M. When a nucleus with spin quantum number I=1/2 is placed
in a static magnetic field, the Zeeman effect will cause the spin energy level of the nuclear
spin split into two, +1/2 and –1/2. The relative population difference of the nuclear spins is
called polarization. At equilibrium conditions, the spin populations in the higher and lower
spins energy level follow the Boltzmann distribution. If free radical is added into this
solution, due to the random molecular motion, the unpaired electron spins, which comes
from the free radical, will interact with the nuclear spins. This interaction is called nuclear-
electron coupling. This kind of nuclear-electron coupled system is subject to DNP study.
Experimentally, the nuclear resonance is observed at the same times or right after the
irradiation of an electron resonance in the same sample.
For an electron and nuclear coupled system with spin quantum number Sz, Iz=±1/2,
the energy level diagram is shown in Figure 2.1.
The possible states are denoted by +-, ++, --and -+. The plus or minus sign by
convention represents the spins aligning with or against the magnetic field while the first
sign refers to the electron spin S and the second sign to the nuclear spin I.
From the viewpoint of energy level, the lowest nuclear magnetic energy level is labeled

5
Figure 2.1. Energy Level Diagram of the Nucleus-Electron Spin Coupled System with I=1/2 and S=1/2 (Cited from Ref. 9).
plus, and because the magnetic moment of the electron has the opposite sign to that of the
nuclear, the lower electron magnetic level is labeled minus.
In this diagram, Wi represents the nuclear relaxation transition probability. The
transitions between the energy levels 1-2, 3-4, 1-3 and 2-4 are single quantum transitions
that are theoretically allowed. Specifically, the transitions 1-2 and 3-4 are the nuclear
transitions which involves changes in the Iz spin quantum number of –1/2 to +1/2 and of
+1/2 to –1/2. These transitions can be observed in the NMR spectrum. The transitions 1-3
and 2-4 are the electron transitions which involve changes in the Sz spin quantum number of
+1/2 to –1/2 and of –1/2 to +1/2. These transitions can be saturated by the microwave
radiation. For the electron-nuclear coupled system, the rapid random diffusion of the
molecule ensures that the solute molecules are near a free radical many times during the
nuclear relaxation time. This strong pairwise interaction between the electron and nuclear

6
magnetic dipoles can induce two spin transitions coupled together in which the electron and
nucleus make simultaneous flips.
Based on the type of interaction between electron and nucleus, there are four
important coupled forms. The S-I- and S+I+ transitions represent the dipolar coupling, the
S-I+ and S+I- represent scalar coupling.
For an electron-nuclear coupled system, at thermal equilibrium, there is more
electron spin in the lower energy level than in the higher level. In the double resonance
experiment, first the electron transition Ws of the free radical is strongly saturated. This will
make the populations of the electron at low and high energy levels tend to be equal. This
means that some of the population is transferred from low energy levels 1 and 3 to high
energy levels 2 and 4. After the saturation of the electron spin transition, a relaxation process
will restore the population at each different energy level back to the equilibrium condition.
For electron nuclear scalar coupling, the dominant W0Sc relaxation will cause the nucleus to
perform an I- to I+ transition simultaneously and the result is that nuclei originally in the high
nuclear energy level are transferred to lower energy level. Thus the population of lower
nuclear level becomes greatly increased. This causes an increase in the nuclear population
differences between I- and I+ spin levels and therefore the NMR signal intensity is increased.
Specifically, the nuclear population at lower energy level N+ is much larger than the
population at higher energy level N- and an enhanced positive NMR absorption signal will
be observed. On the other hand, if the dipolar transition is the dominant relaxation process,
the W2D relaxation will cause an I+ to I- nuclear spin transition resulting in the nuclear
population of N- to be larger than N+. An enhanced negative emission NMR signal will be
observed.
2.2 Basic Equations for Liquid DNP
A quantity used to measure the nuclear population difference between higher and
lower level spins is termed polarization. For a nucleus with spin quantum number I, the
nuclear polarization is generally expressed as[11]

7
where m is the magnetic quantum number corresponding to a distribution energy level in the
magnetic field. The number of nuclear spins corresponding to the energy level m is Nm and
the experimentally observable value of the nuclear spin operator Iz is <I>.
The larger the nuclear polarization, the stronger the NMR signal. Thus, a
quantitative understanding for the enhancement factor of DNP can begin by considering the
rate of the population change for the individual energy states. At thermal equilibrium, the
ratio of the population at the higher spin state N- to the lower spin state N+ is governed by a
Boltzmann distribution, according to the following equation:
where T is the absolute temperature and K is Boltzmann constant.
For the 13C nucleus in the magnetic field of 4.7 Tesla and at 293 K, the value for N-
/N+ is approximately 1.000008. This value indicates a very small polarization. For an
electron–nuclear coupled two spin system, the changing rate of the population N++ at |++ >
state can be expressed as[12]
In this formula, the superscript zero represents the population of the Boltzmann equilibrium
in the absence of a magnetic field. There are some similar equations for the other states. The
relationship between the expectation value of nuclear spin <Iz> and electron spin <Sz> to the
appropriate population difference are given as:
)2.2()exp(KT
h
NN υ
−=+
−
)3.2)()(()()())((0
110
00
2
0
2101 NNWWNNWNNWNNWWWWdTdN D
S
D
S
DD
−+−++−+−−−−−++++++ −++−+−+−+++−=
( )1.211
IN
NP z
mm
mm
I I
m
I==
∑∑

8
<Iz> = k[(N++-N+-)-(N-+-N--)] 2.4
<Sz> =k[(N-+-N++)-(N---N+-)] 2.5
by combining equation 2.2 with 2.3 and 2.4, the changing rate of the observed NMR signal
is given by:
where I0 and S0 are the values of <Iz> and <Sz>, respectively. At the steady
state condition d<Iz>/dt = 0, then equation 2.6 is reduced to
.
Finally, the detailed derivation of <Iz> in the form of nuclear transition probabilities
has been performed by Solomon[13], and is expressed as
In this formula, the three terms in the bracket have some physical meaning, and will be
defined as follows:
Nuclear-electron coupling factor
Leakage factor
)6.2())(())(22(00020102100 SSWWWIIWWWWWdt
Idz
ScDD
z
DDScDz −><−−−−><++++−=><
( ) ( )7.22
0
102100
0020 SS
WWWWWWWWII zDDScD
ScDD
z−
++++
−−+=
( ) )8.2(22
2
21
0
0
0
0
102100
2100
2100
002
0
×−
×+++
+++×
+++
−−+=
+ IS
SSS
WWWWWWWWW
WWWWWWW
IIZ
DDScD
DDScD
DDScD
ScDD
Z
)9.2(2 2100
002
WWWWWWW
DDScD
ScDD
+++
−−=ρ

9
Saturation factor
substituting these factors in eq. 2.8 and using the relation S0/I0 = γS/γI, we will have:
<Iz>=I0(1+ρfsγs/γI) 2.12
by rewriting equation 2.12 and defining the observed DNP enhancement as
Aobs=(<IZ>-I0)/I0, the DNP enhancement A can be expressed as
The observed DNP enhancement Aobs can be determined experimentally and is
dependent on experimental conditions. Its value can not be used to evaluate the
experimental results. It needs to be converted to the ultimate enhancement A∞. Under the
condition of complete saturation(s=1) and total relaxation via electron-nuclear coupling
(f=1), the ultimate DNP enhancement A∞ is defined as:
∞ =A s
I
ργγ
( . )2 14
In comparing equation 2.14 with equation 2.13, the ultimate DNP enhancement can
be obtained easily via dividing the observed DNP enhancement by the f factor and s factor.
( )11.20
0
SSS ZS
−=
( )13.2γγ
ρI
Sobs
fsA =
( ) ( )10.222
2
102100
2100
WWWWWWWWW
DDScD
DDScD
f++++
+++=

10
Among the three factors in the equation 2.13 the most important one is the coupling
factor ρ. Also in Eq. 2.14, it can see that γS and γI are constant for certain nuclei. The
ultimate DNP enhancement is only dependent on the coupling factor ρ and the
intermolecular interaction. Therefore the coupling intensity and the coupling mechanism is
solely contained in this factor. The coupling factor ρ can range from -1 for a pure scalar
electron-nuclear interaction ( )0 1 20
D D D
W W W= = = to +0.5 in the case of pure dipolar
interaction ( )00
Sc
W = . In practice, both scalar and dipolar interactions can be present.
According to equation 2.14, the ultimate DNP enhancement will range between 1/2(γS/γI)
to -γS/γI. Specifically, if scalar relaxation is the dominant relaxation process
( )0 2 0
Sc D D
W W W>> , , a positive scalar dominated enhancement will be observed. On the
other hand, if dipolar relaxation dominates ( )2 0 0
D D Sc
W W W, >> , a positive dipolar
dominated enhancement will be observed.
The leakage factor f measures the nuclear relaxation time percentage which
comes from the free radical among the total nuclear relaxation time. It determines the
efficiency that the nuclear spin is relaxed by the electron spin. Experimentally, we can
determine the f factor by the follow equation:
f TT
= −1 0
10
(2.15)
where T1 and T10 are the relaxation times of the sample in the presence and absence of
free radical, respectively. The value of the f factor can range from 0 for no relaxation via
electron-nuclear coupling to 1 for total relaxation via electron-nuclear coupling,
depending on the concentration of free radical in the sample solution. The DNP
enhancement can only be observed when the value of the f factor is larger than 0.8.

11
The third factor in equation 2.13 is the saturation factor S. This value is a measure
of the efficiency of the saturation of the electron spin transition by the microwave power.
The relationship between the expectation value of the electron spin moment <Sz> and the
applied electromagnetic field strength B1s is given by:
where T1S and T2S are the electron spin-lattice and spin-spin relaxation times. Substituting
equation 2.16 into equation 2.11, we get:
Now equation 2.13 can be rewritten as:
Experimentally, we can obtain the s factor easily by an extrapolation method[14].
Since (B1s)2 is proportional to the microwave power P, equation 2.18 can be changed to
the form:
( )16.21
21
2
1
20
TTBSS
SSSS
Z γ+=
( )17.21
21
2
1
2
21
2
1
2
TTBTTB
SSSS
SSSSSγ
γ+
=
( )19.21
11
21
1
+=
−
TTPf
SSI
SA αγ
γρ
)18.2(110
0
TTf −=

12
where α is a constant. According to equation 2.19, a plot A-1 versus P-1 will give a straight
line with intercept (ρfγS/γI)-1. The reciprocal of this intercept is the enhancement at S = 1.
Therefore the S factor under certain microwave power can be extrapolated by making a ratio
of the observed enhancement at that microwave power P to the enhancement at complete
saturation condition S= 1.
The reciprocal of the intercept gives the enhancement with the correction of
saturation factor. The slope of the plot tells of the efficiency of the microwave power.
2.3 The Interaction for a Nuclear-Electron Coupled Two Spin System
2.3.1 The Hamiltonian of the Nuclear-Electron Interaction
For a nuclear-electron coupled system, the spin Hamiltonian of magnetic
interaction is expressed as:[15]
where γS and γI are the electron and nuclear spin gyromagnetic ratios, respectively. ŝz and
Îz are the electron and nuclear spin operators. In this formula, the first two terms are
electron and nuclear Zeeman terms, respectively. These describe the interaction of
electron and nuclear spin with the external steady magnetic field B0. The last three terms
are the respective time-dependent nuclear-electron, nuclear-nuclear, and electron-electron
interaction terms. Among these three coupling terms, Ĥ IS(t) is the most important one for
the DNP experiment. This time-dependent electron-nuclear interaction solely gives rise to
the electron spin induced relaxation and the DNP enhancement. According to the
mechanism of nuclear-electron interaction, the ( )SIH t$ can be further reduced into two
( ) ( ) ( ) ( )21.2ˆ ˆˆˆˆˆ 00 tHtHtHIBSB SSIIISIZSH +++−−= hh γγ
( )0 1 20
D D D
W W W= = =

13
terms. One is called the dipolar interaction term ( )SI
D
H t$ . The other term is called the
scalar interaction term, ( )SI
Sc
H t$ .
2.3.2 The Dipolar Interaction
Dipolar interaction is analogous to classic dipolar coupling between two bar magnets. The
dipolar interaction Hamiltonian is expressed as
Since the dipolar coupling arises from the interaction of the nuclear and electron
magnetic dipoles, this interaction takes place whenever an unpaired electron and a magnetic
nucleus are present in the same solution. In low viscosity liquids, due to the random
molecular motion, the dipolar part of the interaction is averaged to zero and does not
contribute to the time-independent interactions. But it does provide a time-dependent
interaction (relaxation and DNP). Three types of modulation models have been proposed.
Each of which is characterized by corresponding spectral density functions Jt(ωi) and the
molecular correlation time τt.
1). Relative transnational diffusion model[16]
In this model, the electron and nuclear spins are in the center of the different
molecules and no complexation of free radical and sample molecule forms. The time-
dependent interaction arises from fluctuation in the interspin distance. The spectral
density function is expressed as[17-19]
Jt(ωi) ≅[1+0.9(ωiτt)1/2+1.5(ωiτt)
3/2]-1 . (2.24)
( )22.2ˆˆˆ HHHSc
SI
D
SISI+=
( )( ) ( )23.2ˆˆˆ3
35
2ˆ
⋅−
⋅⋅=
rrHrSIrSr
SI
D
SI
vrr
hγγ

14
In this formula, ωI is the Larmor frequency of the coupled nuclear-electron pair,
and takes the values of ωI, ωI + ωS, ωS - ωI for the transition probability of single, double
and zero quantum, respectively. The transnational correlation time τt is characterized by
the following equation,[20]
where dt is the closest distance between the free radical and the receptor molecule. The
symbols rI and rS are the radii of the sample molecule and the free radical molecule, and
η is the viscosity of the solution. The radical induced dipolar transition probability is
given by
where Ne is the concentration of the unpaired electron.
2). Rotational diffusion model[21]
This model is effective for the situation that S and I spins are in the same molecule such
as nuclear and free radical spins are in the same molecule or free radical and sample
molecule form a tight bond complex. The transition probability is given by
where np is the number of the receptor nuclei bound near each electron, Np is the
concentration of total nuclei, dr is the average pair radius of the rotating adduct. The
spectral density function Jr(ωi) is given by
( )25.25
122
Tk rrrrd
SI
SItt
ηπτ
+=
( ) ( )26.2,5
2232
32222
01 ωτγγπittetIS
DDD
JdNWWW−=== h
( ) ( )27.2,10
3232
62222
01 ωτγγ jrrp
ep
tIS
DDD
JdNNnWWW
−
=== h

15
where τr, the rotational correlation time is expressed as:
where b is the effective tumbling radius of the molecular complex.
3). Mixed transnational and rotational diffusion[22]
This model is helpful in explaining the situation that the sample molecule and the
free radical form a weak complex, such as hydrogen bonding. The spectral density
function for this model is given by [22]
In this formula, ne is the number of the unpaired electrons in the unit volume. R is a
measure of the relative influence of the rotational diffusion to the mixed modulation of
the dipolar coupling. It is given by
where m is the average number of nuclei associated with a radical molecule. The reduced
spectral density function ft(ωiτt) and fr(ωiτr) are defined as
( ) ( )28.21
122τωωri
iJ
+=
( )29.23
43
kTb
r
ηπτ =
( ) ( ) ( ) ( )30.2,3
32
+= τωτ
ττωτω rirt
rtit
te
iD ffd
nJ R
( )31.24
36
3
nbd
I
tm
Rπ
=
( ) ( )( )
( ) ( )( )
( )32.200 J
JfJJf r
D
i
t
Drirt
D
i
t
Dtit
and ωτωωτω ==

16
Overall, the dipolar interaction is always present in the solution and is distance
dependent. It can provide some information about the distance involving molecular
collisions.
2.3.3 The Scalar Interaction
The time-dependent Hamiltonian for the scalar interaction between the nuclear
spin and the unpaired electron spin is given by
Where ASI is the hyperfine coupling constant. It can be expressed as
ASI = - γSγI h|ψ(0)| 2 (2.34)
ψ(0) represents the wave function of the unpaired electron at the nucleus. Scalar coupling
involves the electron spin density transfer from the unpaired electron to the S orbital of
the nucleus. There are two possible mechanisms which can be used to describe this
interaction, a diffusion model or a sticking model.
1) The Sticking Model[13,23,24]
In this model, there is a finite scalar interaction only during the time when the
electron spin and the nuclear spin are “stuck” together, such as in the case of forming a
weak complex between the free radical and the sample molecule. When these two spins
are stuck together, the scalar interaction is characterized by the coupling constant A.
When the complex falls apart, the coupling constant becomes zero and there will be no
scalar interaction. The scalar transition probability and the spectral density function for
this model can be expressed as
( ) ( )33.2ˆˆˆ SIt AH SI
Sc
SI⋅=
( )( )35.2
12
122
2
+=
+
ττ
Sc
ScSc
D
WW
AW
ISh

17
where τSc is the scalar correlation time. The coupling constant per unit
frequency time 2π, ASc/h, is a measure of the induced electron spin density.
2). The diffusion model[16]
In the diffusion model, the scalar interaction is assumed to be a function of the
distance between the I and S spins. As in the dipolar case, the variation of distance r with
time is responsible for the time dependence of interaction. Thus, unlike the sticking
model, the unpaired electron density produced at the nuclei is not at one instant finite and
then zero. It reaches its maximum value as the radial and sample molecule collide and
then decays to zero again as the molecules recoil from each other. Since the scalar
interaction could involve the electron-orbital overlap with the nucleus, the interspin
distance can be very short, and thus a steep function of the internuclear distance. The
hyperfine coupling constant is assumed to have the form
where rIS is the distance between I and S spins, d is the distance of closest approach
between I and S. A and λ is a constant. The scalar transition probability for the diffusion
model is expressed as
( ) ( )36.21
222
2
τωτω
ScS
Sc
I
SIS
nAJ
m
ASI +=
h
( )[ ] ( )37.2exp dAd
rrA ISIS
IS−−= λ
( ) ( ) ( ) ( ) ( )38.2cossinexp12
2/12/12/1
2/1
32
0
−+= τωτωτω
τωλ
πSSS
SD
dANW eSc

18
where ω=ωS + ωI , Ne is the number of spins, τS is the scalar correlation time and D is the
average diffusion constant of the radical and receptor nuclei.
2.3.4 Mixed Scalar and Dipolar Interactions
As mentioned before, the dipolar interactions are always present between the
electron and nuclei. For some nuclei, such as 13C, the scalar interaction may also be
present in the system. When both interactions are present, it is necessary to combine one
of the dipolar interaction models with one of the model for the scalar interaction. Thus,
there may be many combinations. It is dependent on the particular system.
2.4 The Three Spin Effect
All the basic DNP equations discussed above are based on the assumption that the
polarization of the nuclear spins is exclusively determined by the interaction with the
electron spins and no interaction with other nuclear spin. We have considered only the
direct electron-nuclear two spins coupled interactions. However, in some case, the
monitored nucleus can interact indirectly with the electron spin via the third spin. For
example, the 13C polarization is determined not only by the presence of the unpaired
electron, but also by the presence of the protons. Fig.2.2 illustrates the direct and indirect
electron–13C interaction. Fig. 2.2 (a) is the usual direct transfer of magnetization from the
unpaired electron to the carbon atom, (b) shows the indirect three spin transfer of the
magnetization from the electron spin first to the proton then via the polarized proton spin
to the carbon. The 13C three spin enhancement (A3-spin) is expressed by [25] :
where C
Hρ is the proton-carbon coupling factor and C
H
f is the fraction of total 13C
nuclear relaxation rate due to proton-carbon dipolar coupling. Thus, in the case of thethree-spin effect, the enhancement is corrected as:
( )39.23 γ
γρρC
SH
CH
H
C
H
Cspin ffA −=−

19
(a)
(b)
Figure 2.2 Nucleus-Electron Coupling Systems: (a) Two Spin Coupling System; (b)Three Spin Coupling System
From Eq. 2.38, it can be found the indirect three spin transfer of the magnetization will
result in positive 13C DNP enhancement. Therefore, the three spin effect will decrease the
( )40.2γγ
ρρρC
SS
H
S
H
H
C
H
C
S
C
S
CSA fff
−=
NO...................CR''
H
R R'
.
NO...................
CR''
R R'
.H

20
dipolar dominated 13C DNP enhancements and increase the scalar dominated 13C DNP
enhancements in the solution. For a particular system, the significance of the three spin
effect depends on the effectiveness of the carbon-proton interaction.
Generally, the three spin effect can be eliminated by two ways. the first is by
using triple irradiation experiment. Under the triple irradiation condition, the 13C
enhancement is given by [26] :
In the equation 2.41, the first term is identical to the enhancement for the two spin
system. Because of γS >> γH, so the second term can be neglected. The second method
that can be used to avoid three spin effect is by using high radical concentration. Under
this condition, the relaxation of carbon via proton is suppressed, C
H
f ≅ 0 . Therefore, the
second term in the Eq. 2.40 can be eliminated. In this work, this method was used.
( )41.2γγργ
γρC
HHH
C
H
C
C
SS
C
S
C Sff SA +=

21
CHAPTER 3. INSTRUMENTATION AND EXPERIMENTAL
SECTION
3.1 Introduction
3.1.1 General Description
In our laboratory, a liquid-liquid intermolecular transfer (LLIT) DNP experiment has
been developed [27-31], in which a free radical (in this work. TEMPO, 2,2,6,6-
tetramethylpiperidine 1-oxyl,) is dissolved in the solution containing sample molecules.
During the experiment, the nitrogen degassed sample, conducted by the PEEK tubing, is
pumped though the low and high magnetic field and then back to the sample reservoir. A
HPLC pump with flow rates of 2~8 mL/min is used to make the sample solution recycle.
The electron transition was saturated by the microwave power in the low magnetic field and
then the enhanced DNP signal was detected in the high magnetic field. All of the experiment
was performed at room temperature and under non-spinning and non-locking conditions.
For the 13C DNP experiment, the 1H broad band decoupling technique is used.
3.1.2 Build-up Loss and Transfer Loss[9]
In order to make the electron transition completely saturated. A sufficient residence
time ( 3~5 T1) of the sample in the low magnetic field is necessary. A reduction in signal
intensity will occur for a given nuclei if the flow rate is too rapid to ensure complete build-
up of the polarization. On the other side, after the establishment of the fully polarization, the
enhanced DNP signal must be detected before the nucleus relaxes to equilibrium. This
requires the amount of time spent in the transfer from low to high field should be short
relative to nuclear-electron relaxation time. Transfer losses will result in a reduction of the

22
DNP enhancement. Overall, the improper choice of the flow rate can have a detrimental
effect on the magnitude of the subsequent DNP enhancement.
3.1.3 Sample Degas
Oxygen is a paramagnetic molecule which has two unpaired electrons. In sample
solution, the dissolved oxygen will compete with TEMPO radicals for the interaction with
the monitored nuclei[32] and result in decreasing the DNP enhancement. So, in all
experiments, the liquids were degassed by bubbling dry nitrogen through the solution prior
to and during the experiment.
3.2 The Flow Transfer DNP Instrument
3.2.1 Magnetic Field
A diagram of the instrumental apparatus used in this work is shown in Fig 3.1. There
are two magnetic fields. A low variable electromagnet field with a range of 0 to 0.6 T, which
is used to saturate electron transition, is placed directly under a 4.7 T superconducting
magnet. In order to minimize the influence of the electromagnet on the homogeneity of
superconducting magnet, these two magnets are arranged at 1.2m apart. In this work, the
strength of low magnet was controlled at 0.33T. In the high field, the NMR detecting probe
is a homemade Helmholtz coil probe with two channels. One is the proton channel with the
resonance frequency of 199.5 MHz. The other one is 13C channel with the resonance
frequency of 50.2 MHz. Four standard capacitors were used for tuning and matching.
3.2.2. Sample Cells for the NMR Probe and EPR Cavity
The flow cell used in NMR probe is a self-made glass cell. The size of this cell is
about 2.5 cm long with a volume of 100 µl. A ceramic tube, which can stand the high
pressure arising from the high flow rates, bought from Omega Engineering, Inc. is chosen to
serve as the cell in the low field. The structure and the dimensions of the cells are shown in
Figure 3.2. These two sample cells in the low and high magnetic field were connected by
Polyetheretherkenton(PEEK) tubing with 0.007” O.D..

23
Figure 3.1 Low to High Magnetic Field Transfer DNP Experimental
Apparatus (Cited From Ref. 10)

24
Figure 3.2. Low to High Field Flow Cells (Cited From Ref. 10)
25
3.2.3. Others
In the low fields, the sample in a ceramic cell is placed in a microwave TE102 cavity .
The microwave frequency around 9.3 GHz was used to saturate the unpaired electron
transition of free radical is provided by the Klystron source of an EPR spectrometer. The
microwave power is amplified by a Varian“ K ” series TWT amplifier which is adjustable by
an attenuator in the range of 2 ~ 20 Watts. A HPLC pump with a flow range of 1 ~ 9 ml/min
was used to recycle the liquid sample.
3.3 Chemicals
All of the reagents and solvents were obtained commercially. The Benzene-d6 is
purchased from the Isotic Inc.. All other chemicals were purchased from Aldrich Chemical
Co. and used directly without further purification. TEMPO (2,2,6,6-tetramethyl-1-
piperidingloxy) was used as free radical. This is mainly because that: 1) it is chemically inert
and very stable, 2) it is a relatively small molecule and the unpaired electron is highly
localized on the n-o group, (3) it is commercially available.
3.4 Determination of Ultimate Enhancement (A∞)
3.4.1 Determination of the Leakage Factor f
According to equation 2.10, the leakage factor can be obtained by measuring the
spin lattice relaxation rates of the sample solution in the presence and the absence of the free
radical at the low magnetic field where DNP is developed. Because of the sensitivity and the
spectral resolution limitations in the low field, in this work, the relaxation times measured in
high magnetic field were used to approximate those measured in low field. The high field
spin-lattice relaxation times were measured at 4.7 T magnetic field using a standard inverse
recovery sequence (180°-τ-90°-T)[35]. The sample was sufficiently deoxygenated before
the T1 measurement. The leakage factor f was then calculated based on the high field NMR
data. The relative standard deviation for T1 measurements was between 2~7%. A sample
curve of the T1 measurement is illustrated in Figure 3.3.

26
Figure 3.3 13C 200 MHz Spin-Lattice Relaxation Time Plot for 0.5M
Anisole/0.1M TEMPO in Cyclohexane
3.4.2 Determination of Saturation Factor (s)
First, 13C LLIT DNP enhancement Aobs(P) was measured by using different
microwave power. Experimentally, equation 3.1 can be used to calculate the enhancement at
different power Aobs(P)
( ) ( )1.30MMMA H
HL
ZZobs
P−
=∗
t-M0
M0
MZ
T1 8.642
5.00.0 10.0 15.0 20.0 25.0 30.0 35.0

27
where ZM∗
is the peak height of the enhanced NMR signal at certain microwave power P.
Z
HL
M is the peak height of the flow NMR signal in the absence of the microwave power.
0
H
M is the peak height of the static NMR signal. Then the extrapolated DNP enhancement
( )obs
s
A P= → ∞1
can be obtained from the intercept of the plot of [Aobs(P)]-1 versus P-1 at
optimized flow rate. Finally, the s factor at a particular microwave power can be easily
calculated by eq. 2.19. A sample DNP power plot is shown in Figure 3.4.
Figure 3.4 13C Power Plot of Cyclohexane

28
3.4.3 Experiment Determination of the Ultimate DNP Enhancement A∞
There are two ways that can be used to calculate the ultimate DNP enhancement. One
is called the exhaustive method[27,28,33,34]. This method takes into account as many
variable factors that may cause an error to the final result as possible, such as the low to high
magnetic field strength change, f and s factors. It is closely correlated to the flow transfer
DNP system, so that the calculated result better matched the true value. The disadvantage of
this method is that it requires the instrument to be stable and it is very time consuming, since
the data have to be obtained for a whole range of flow rates. Another way to determine the
ultimate DNP enhancement is called ratio method[10,36]. In this work, most of the DNP
data were collected and processed by the ratio method. This is mainly because some of the
sample solutions cannot be readily studied by the exhaustive method which is more
demanding either on the sensitivity and stability of the instrument or the experimental time.
The procedure of the ratio method is much simple. The s factor is assumed to be same for all
the nuclei in a given experiment. No flow plot or power plot has to be made in the ratio
method. The experiment and calculation for the ultimate DNP enhancement A∞ by using
ration method includes several steps. In detail:
1. to get the peak height of the 13C static NMR, flow NMR and DNP spectra
2. to get the observed 13C DNP enhancement Aobs for the flow transfer system by using
equation 3.1
3. to convert the observed 13C DNP enhancement Aobs obtained from the flow transfer
system to the static DNP system As. A model for the calculation of the ultimate
enhancement in the low to high magnetic field transfer DNP experiment has been
established by K.H. Tsai and H.C. Dorn 9,28. The formula for the converting Aobs to AS
is given as
( )( )
( )2.3
11
111
⋅
−
⋅=
⋅
+−
⋅−
ee
AAFF
obs
S
TV
TV
TV
PKP
c
c
b
b
a
a

29
where T1a, T1b and T1c are the nuclear relaxation times in the regions a, b, and c,
respectively; Va, Vb and Vc are the sample solution volumes in the regions a, b, and c,
respectively; F is the flow rate (µL/sec.) of the sample solution; K is the high to low
magnetic field strength ratio which equals 14.2. By making some approximation:
T1a ≅ T1b ≅ T1c,
Va ≅ 160µL , Vb+Vc ≅ 120 µL,
The static DNP enhancement As can be expressed by the experimental measurable quantities
in the following formula:
4. to get the ultimate DNP enhancement by the following equation:
where A∞ref is the ultimate DNP enhancement of the reference nucleus (in this work 13C in
the cyclohexane is used as reference); AS(P) and Aref (P) are the observed DNP
enhancements for the respective nucleus and the reference nucleus measured under
microwave power P; fref and fS are the f factors of the reference nucleus and sample nucleus,
respectively.
( )( )
( )3.31 1
1
160
120
e
eAAF
Fobs
S
T
TPKP
c
c
⋅−
⋅
−
⋅⋅=
( ) ( )[ ][ ] ( )4.3// ffAAAA SrefrefS
ref PP∞∞
=

30
CHAPTER 4. RESULTS AND DISCUSSION
4.1. 13C Studies of the Substituent Effects on the Monosubstituted Aromatic
Compounds
4.1.1 Introduction
Previous work has demonstrated that the DNP technique provides a potentially
powerful tool for the investigation of the interaction between various molecules and free
radicals. Several flow transfer 13C DNP studies of substituted aromatic compounds have
been previously reported, such as, chlorobenzene, 1,3,5-trichlorobenzene , 1,2-
dichlorobenzene, nitrobenzene and toluene[9,10]. Table 4.1 gives the enhancement
results for these studies. It can be seen that the carbon nucleus attached to the chlorine
for chlorobenzene exhibited a large negative dipolar dominated enhancement, whereas
the carbon adjacent to the C-1 showed a large scalar dominated enhancement ( see
Figure 1. for carbon assignments). Similar results were obtained for 1,3,5-
trichlorobenzene. The large scalar enhancement at the carbon sites adjacent to the
chlorinated carbon position was interpreted in terms of weak complexation of the
TEMPO radical with the weakly acidic hydrogens attached to the carbons of interest in
the aromatic moiety. The driving force for the hydrogen-TEMPO complexation was
attributed to the presence of the electron attracting chlorine atom on adjacent carbon in
the benzene ring. The 13C DNP results of 1,2-dichlorobenzene exhibits a reasonable trend
with the results of mono- and tri-chlorobenzene (see Table 4.1). For nitrobenzene, the
carbon site attached to the nitro group shows a large dipolar dominated DNP
enhancement; whereas, the carbon adjacent to it exhibits a large scalar dominated
enhancement. In contrast to nitrobenzene, all the carbon sites of toluene show negative
dipolar dominated enhancements. Especially the aromatic carbons at the ortho, para and
meta position which exhibit strong dipolar enhancements in contrast to the results for
nitrobenzene. A direct spin density delocalization model[10] was developed to explain
the experimental results. Over all, from the view point of the substituent electronic effect,

31
the results in Table 4.1 show a trend of the electron attracting groups, such as chlorine or
the nitro group, promoting scalar enhancement of all aromatic carbons (except for the
carbon C-1directly connected to the functional group). Whereas, the electron releasing
methyl group yields dipolar enhancement.
Table 4.1 13C Ultimate DNP Enhancements of 1-chlorobezene, 1,2-dichlorobenzene,
1,3,5-trichlorobezene, Nitrobenzene and Toluene
Type Compound C-1 C-2 C-3 C-4 C-5 C-6
A 1-Chlorobezenea -100 140 -17 -23 -17 140
B 1,2-Dichlorobenzenea -120 -120 178 70 70 178
C 1,3,5-Trichlorobezeneb -330 290 -330 290 -330 290
A Nitrobenzeneb -572 587 198 366 198 587
A Tolueneb -423 -185 -196 -192 -196 -185
Figure 1. peak assignment
Note:
a. Liquid phase 13C DNP experiments were furnished by Dr. K. H. Tsai in 1990(Ref. 9).
b. Liquid phase 13C DNP experiments were furnished by Dr. Z. Sun in 1996(Ref. 10).
X1
2
3
4
5
6
A
XX1
2
3
4
5
6
B
1
2
3
4
5
6
X
XX
C

32
All prior mono-substituted benzene DNP studies focused on analyzing substituent effects
of the same substituent on different positions in the same molecule. To date, there are no
systematic studies of the influence of different substituent groups on the 13C DNP
enhancement of monosubstituted aromatics. Therefore, in the present research, a variety
of aromatic compounds were studied in order to observe substituent electronic effects on13C DNP enhancements in monosubstituted aromatics. Since the 13C DNP enhancement is
dependent on electron donating or electron withdrawing properties of the substituent, the
correlation study will provide a delicate probe of these weak intermolecular interaction
effects between the free radical (TEMPO) and the aromatic system by the substituent. In
the present work, eleven mono-substituted aromatic compounds were studied by the 13C
transfer DNP technique. These compounds were chosen on the basis of electronic effects
of the substituents and range from strong electron donating groups to strong electron
withdrawing groups.
4.1.2 Results and Discussion
The 13C DNP enhancement data is summarized in Table 4.2 . Three sample 13C
DNP results and spectra of benzonitrile, anisole and benzaldehyde are presented in Table
4.3-4.5 and illustrated in Figure 4.6-4.8. It can be seen (Table 4.2) that the carbon site
attached to the substituted group exhibits a large dipolar dominated DNP enhancement,
except for the case of iodobenzene. The much larger dipolar dominated enhancement is
probably due to a smaller scalar contribution and lack of three-spin effect[9]. The large
scalar dominated enhancement in iodobenzene may involve a special spin transfer
mechanism which will be discussed in the next section.
The 13C DNP enhancements results in Table 4.2 also show that ortho, meta and
para position exhibit large scalar dominated enhancements for compounds with electron-
withdrawing groups (F, Cl, Br, I, CN, CHO, NO2). Whereas, the dipolar dominated
enhancements are observed in compounds with electron donating substituted groups
(OCH3, CH3, NH2). The 13C DNP results also show that larger magnitude scalar
enhancements for most compound follow the order of ortho > meta > para. These results

33
indicate that the 13C DNP enhancement have a definitive relationship with substituent
electronic effects.
Table 4.2 13C Ultimate DNP Enhancements for the Mono-Substituted
Benzene/ TEMPO System
X Ipso Ortho Meta Para Other
H -199 -199 -199 -199
F -572 63 71 -51
Cl -478 95 11 -32
Br -170 147 50 -9
I 478 111 39 15
CN -281 171 98 22 -204
CHO -456 131 93 78 373
NO2* -572 582 198 366
OCH3 -457 -42 -61 -64 266
CH3 -562 -179 -153 -207 -187
NH2* -318 -22 -131 -145
Note:
* These two A∞ values were determined by Z. Sun in a collaborative study.
ipso
para
ortho
meta
X
34
These results can be interpreted based on the following effects:
1) the inductive effect acts via the σ-bond system and decrease rapidly with distance
from the substituent, 2) the mesomeric effect produces, as a result of interaction through
the π-electron system, an electron excess or deficit (depending on the nature of the
substituent) at the ortho and para position and 3) the steric effect which is greatest at the
C-1 (ipso) and C-2/6 (ortho) position.
Over the past fifty years, the Hammett equation has been widely used in the study
of reactivity in substituted aromatic compounds. It also provides a quantitative way to
analyze the electronic effect of substituents and the corresponding the 13C DNP
enhancement.
Hammett found for a large number of reactions of meta and para substituted
benzene derivatives, a plot of the logarithm of the equilibrium (K) constants for one
reaction (ionization of benzoic acids) vs log (K) for another reaction (ionization of
phenylacetic acids) exhibited a linear relationship[51-53]. This type of relationship is
called a linear free energy relationship. The equation of the line is[55]
where ρ is referred to as the reaction constant which is a measure of the sensitivity of the
equilibrium constant to the changes in the σ value of the substituent. σ is referred to as
the substituent constant. The sign and magnitude of σ for a substituent is a measure of the
capacity of the electron-donating (-) or electron-withdrawing (+) ability of a given group.
The σ constant is further expressed as σm and σp for meta and para positions,
respectively51,53.
Figure 4.1 shows a plot of meta 13C DNP enhancements against σm. It can be seen
that the points for the meta substituents form nearly a straight line with a correlation
( )1.4log0
ρσ=
KK
35
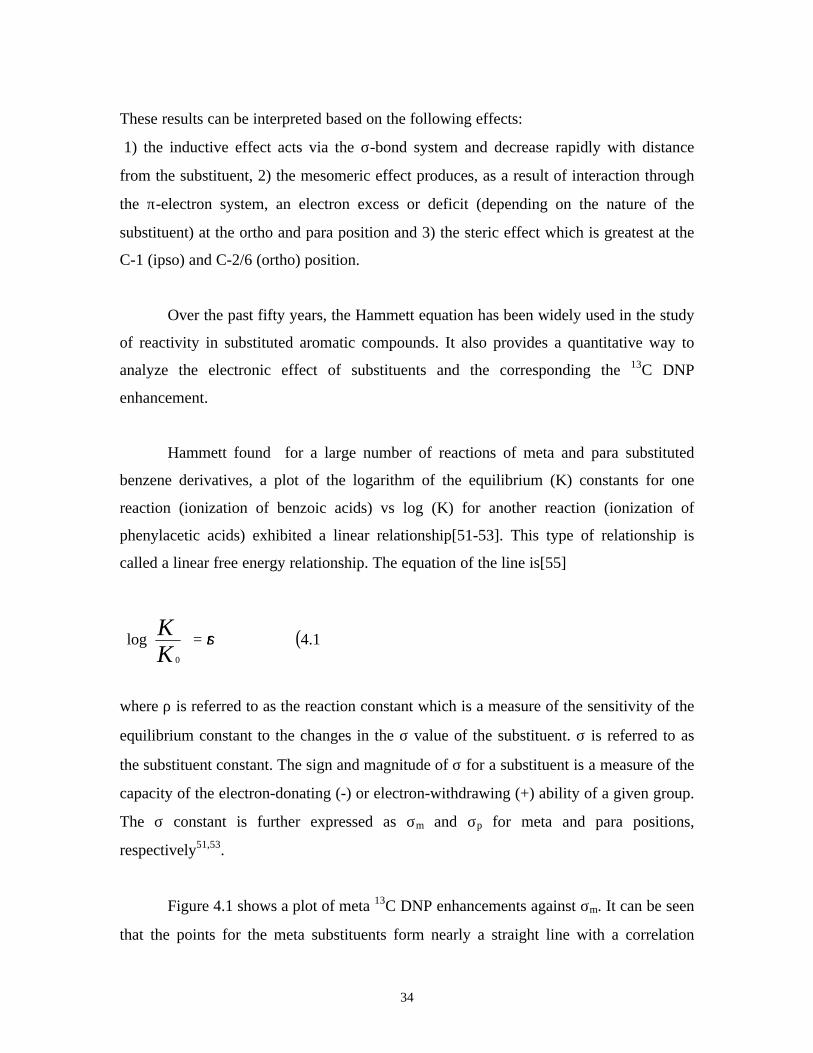
coefficient of 0.9358. The plot of para 13C DNP enhancements from Table 4.2 versus σp
(in Figure 4.2) also exhibits a clear trend except for the deviation of three points
corresponding to the substituents -OCH3, -NO2 and -NH2. The large deviation for these
three compounds may be due to the strong mesomeric effect of
Figure 4.1. Meta 13C DNP Enhancements as a Function of the Hammett σm
Constant (from the comprehensive data given by Exner54)

36
Figure 4.2. Para 13C DNP Enhancements as a Function of the Hammett σp
Constant (from the comprehensive data given by Exner[54])
these substituents. The better correlation of the data at the meta position is possibly due to
the lower important of mesomeric effects transmitted to the meta position in these
compounds.
It is well recognized that a drawback of the normal Hammett constant σ is that it
combines both inductive and mesomeric effects in one parameter, either σm or σp . The

37
modification of the normal Hammett constant by separating the parameters into their
components representing σI and σR which are Hammett inductive and resonance
constants, respectively. The correlation plot of meta and para 13C DNP enhancements
versus σR[54] constant was attempted, and only a linear relationship was obtained with
correlation coefficient 0.6575 and 0.7346. The plot of meta and para 13C DNP
enhancements versus σI are shown in Figure 4.3 and 4.4. Comparison of Figure 4.1 and
4.2 with Figure 4.3 and
Figure 4.3. Meta 13C DNP Enhancements as a Function of the Hammett σI
Constant (from the comprehensive data given by Exner[54])
ubst
itut
e C
ons
tan
t σ I
1 3C D N P E nhance m ent
-300 -200 -100 0 100 200 300
-0.1
0.0
0.1
0.2
0.3
0.4
0.5
0.6
0.7

38
Figure 4.4. Para 13C DNP enhancements as a Function of the Hammett σI
(from the comprehensive data given by Exner[54])
4.4, a better correlation was obtained for both of the meta and para positions with
correlation coefficients, 0.9726 and 0.9554-(NO2 data not including), respectively. A
large deviation is observed for nitrobenzene. This may due to that the 13C DNP
enhancement data for nitrobenzene was measured at different experimental conditions.
As has been mentioned, the inductive parameter σI is an operational measure of the non-
resonance effects. The results suggest that in the ground state of these molecules the
inductive effect is much more important than resonance effect in terms of the electronic
charge distribution on the benzene ring and corresponding correlation with 13C DNP
enhancements.
NO2
39
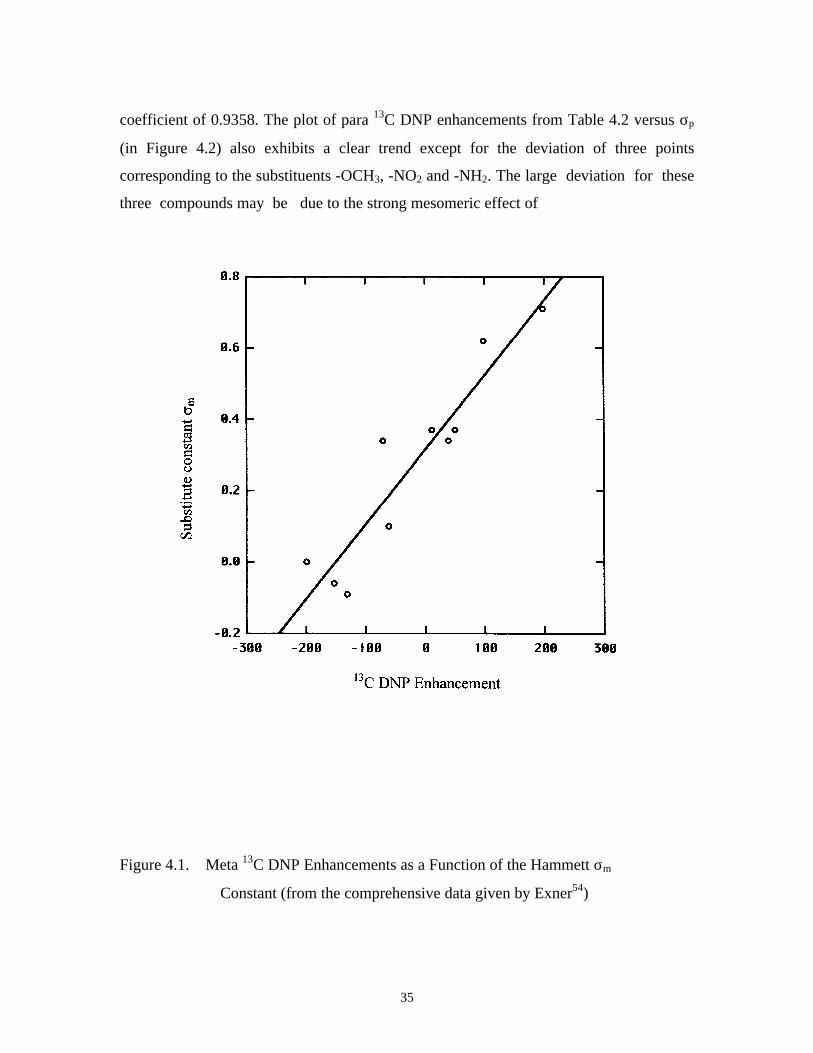
The 13C DNP A∞ enhancements at the ortho (C-2) position are spread over a
magnitude of more than 700, with extreme values for nitrobenzene and benzene. Since
the ortho substituents are bound to the adjacent position, proximity effects such as steric
effects, which are less significant at other positions, could play a significant role at the
ortho position. To date, no Hammett kinds of correlation are observed in chemical
reactions. The plot of ortho 13C DNP enhancements verses Hammett inductive constants
shows a good correlation with correlation coefficient 0.9462(NO2 data not including, see
Fig.4.5). A large deviation is also observed for nitrobenzene. This may due to the same
reason as mentioned above.
Figure 4.5. Ortho 13C DNP Enhancements as a Function of the Hammett σI
(from the comprehensive data given by Exner[54])

40
(a)
(b)
Figure 4.6 LLIT 13C DNP Spectrum (50.1 MHz) for 50/50 (v/v) %
Benzonitrile/Cyclohexane with 0.1 M TEMPO: (a) static NMR Spectrum (360 scans); (b)
Flow DNP Spectrum (360 scans).

41
Table 4.3. LLIT 13C DNP Relaxation and Enhancement Data for 50/50 (v/v) %Benzonitrile/Cyclohexane with 0.1 M TEMPO
Carbon
Type
Peakb
Position
(ppm)
T10c
(Sec.)
T1c
(Sec.)
fd A∞a,e,f,g
Ipso 112.95 24.3 2.89 0.881 -281
Ortho 132.08 16.8 1.46 0.913 171
Meta 129.23 25.5 1.11 0.957 98
Para 132.52 37.4 1.42 0.962 22
-CN 117.70 49.9 1.92 0.962 -204
Note:
(a) Ratio method was used to calculate the ultimate DNP enhancements.
(b) 1H broad-band decoupling was employed to eliminate proton-carbon coupling.
(c) T1 and T10 are the spin-lattice relaxation times of the carbon nuclei with and without TEMPO in the sample solution, respectively.
(d) The leakage factor f was calculated based on T1 measurements at 4.7 T magnetic field.
(e) The 0.33 T 13C DNP enhancements were monitored at 4.7 T. All data was obtained at room temperature.
(f) Cyclohexane was used as the reference compound with A∞= -270±40.
(g) The ultimate 13C DNP enhancement A∞ is an average value of four measurements at different power levels. The estimated relative standard deviation for A∞ is about 15%.
CNipso
para
ortho
meta

42
Figure 4.7 LLIT 13C DNP Spectrum (50.1 MHz) for 20/80 (v/v) %
Benzaldehyde/Cyclohexane with 0.1 M TEMPO: (a) static NMR Spectrum (3000 scans);
(b) Flow DNP Spectrum (735 scans).

43
Table 4.4. LLIT 13C DNP Relaxation and Enhancement Data for 20/80 (v/v) %Benzaldehyde/Cyclohexane with 0.1 M TEMPO
Carbon
Type
Peakb
Position
(ppm)
T10c
(Sec.)
T1c
(Sec.)
fd A∞a,e,f,g
Ipso 136.97 32.0 1.15 0.963 -456
Ortho 129.38 20.1 1.46 0.943 131
Meta 128.79 13.7 1.38 0.899 93
Para 133.83 14.0 1.23 0.912 78
-CHO 190.69 22.8 1.21 0.947 373
Note:
(a) Ratio method was used to calculate the DNP ultimate enhancements.(b) 1H broad-band decoupling was employed to eliminate proton-carbon coupling.
(c) T1 and T10 are the spin-lattice relaxation times of the carbon nuclei with and without TEMPO in the sample solution, respectively.
(d) The leakage factor f was calculated based on T1 measurements at 4.7 T magnetic field.
(e) The 0.33 T 13C DNP enhancements were monitored at 4.7 T. All data was obtained at room temperature.
(f) Cyclohexane was used as the reference compound with A∞= -270±40.
(g) The ultimate 13C DNP enhancement A∞ is an average value of four measurements at different power levels. The estimated relative standard deviation for A∞ is about 15%.
CHOipso
para
ortho
meta

44
Figure 4.8 LLIT 13C DNP Spectrum (50.1 MHz) for 20/80 (v/v) % Anisole/Cyclohexane
with 0.1 M TEMPO: (a) static NMR Spectrum (1357 scans); (b) Flow DNP Spectrum (620
scans).
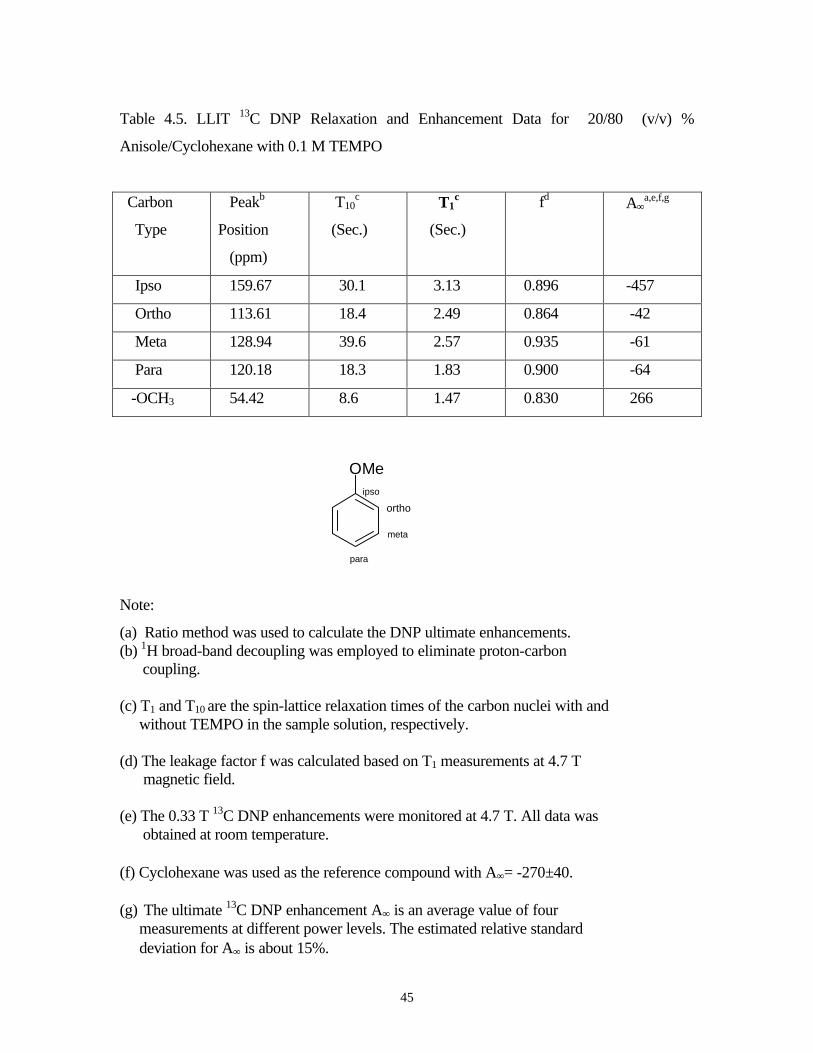
45
Table 4.5. LLIT 13C DNP Relaxation and Enhancement Data for 20/80 (v/v) %
Anisole/Cyclohexane with 0.1 M TEMPO
Carbon
Type
Peakb
Position
(ppm)
T10c
(Sec.)
T1c
(Sec.)
fd A∞a,e,f,g
Ipso 159.67 30.1 3.13 0.896 -457
Ortho 113.61 18.4 2.49 0.864 -42
Meta 128.94 39.6 2.57 0.935 -61
Para 120.18 18.3 1.83 0.900 -64
-OCH3 54.42 8.6 1.47 0.830 266
Note:
(a) Ratio method was used to calculate the DNP ultimate enhancements.(b) 1H broad-band decoupling was employed to eliminate proton-carbon coupling.
(c) T1 and T10 are the spin-lattice relaxation times of the carbon nuclei with and without TEMPO in the sample solution, respectively.
(d) The leakage factor f was calculated based on T1 measurements at 4.7 T magnetic field.
(e) The 0.33 T 13C DNP enhancements were monitored at 4.7 T. All data was obtained at room temperature.
(f) Cyclohexane was used as the reference compound with A∞= -270±40.
(g) The ultimate 13C DNP enhancement A∞ is an average value of four measurements at different power levels. The estimated relative standard deviation for A∞ is about 15%.
OMe
para
ipso
meta
ortho

46
4.2. 13C DNP Enhancements study of Monosubstituted Halobenzenes
4.2.1 Introduction
The importance of scalar coupling at adjacent nuclei by the presence of halogen
nuclei in the same molecule is a well known phenomenon in the DNP studies. Most of these
studies have involved phosphorous and phosphoalkane. For example, 31P in POCl3[40], in
phosphonitrilic chlorides((PNCl2)n=3~7) [411, in C6H5PCl2 and C6H5POCl2 [42], 13C in CCl4
[43,44], and 19F in cyclic chlorofluoroalkanes [45]. Two possible mechanisms have been
postulated. The first one involves an indirect participation mechanism in which adjacent
halogen atoms may affect the electronic environment at the nuclei of interest and thus
enhancing the scalar enhancement. Bates has reported[46] 19F DNP studies of CFCl3 and
CFCl2H at 75 G with the free radical di-t-butylnitroxide (DTBN). Bates found an abnormal
aliphatic fluorine scalar relaxation rate for these two compounds. Limited delocalization of
the unpaired electron to the solvent molecule during transient complex formation would
account for the high scalar component for CFCl2H-DTBN, because the nitroxide-proton
interaction due to hydrogen bonding is known to be very strong[47-49]. However, this
mechanism cannot be used to explain the case of CFCl3. In a second mechanism, it is
suggested that chlorine promotes the scalar polarization. Thus the polarizable chlorine
electrons transmit unpaired electron density from the radical to the fluorine nucleus. This
second possible mechanism is the “direct participation mechanism” in which the polarizable
halogen electrons may transmit unpaired electron density from the free radical to other
nuclei, where the halogen atom acting as a spin messenger. Franklin studied[50] 19F DNP of
a series of fluorochloroethanes and two fluorbromoethanes with the free radical
bis(diphenylene) phenylallyl (BDPA) and galvinoxyl (GALV). The 1,2-
dibromotetrafluoroethane is of interest because the role of the bromine atom can be
compared with that of chlorine atoms in the previous study[50]. If the scalar coupling
component were generated through the direct mechanism involving transmission of spin
information from the easily polarized chlorine atom to the fluorine atom, the more
polarizable bromine atom would promote greater polarization of the fluorine atom. However
the 19F DNP results showed that fluorochloroethanes have a larger scalar component than
fluorobromoethanes. The explanation for this result is that the steric effects for the C2Br2F4

47
may decrease the effectiveness of this mechanism. Over all, a consistent view of the
mechanism for halogen participation remains unclear.
The objective of the present work is to further study the halogens involved electron
density transfer mechanism by examination of the monosubstituted halobenzenes.
4.2.2. Results and Discussion
Four mono-substituted halobenzenes were examined in this study. In comparison
with the 19F DNP study of aliphatic compounds, the 13C DNP study of these halobenzenes
have certain advantages: 1) no protons are attached to the carbon bearing the halogen
substituent, thus, the indirect mechanism is avoided, 2) there is minimum steric hindrance
which prevents the halogen-radical interaction, thus, the steric effect is also small for 13C in
the mono-substituted benzene. Figure 4.10-4.12 present the LLIT 13C DNP spectra for
fluorobenzene, chlorobenzene and iodobenzene. The 13C DNP data are listed in Table 4.7-
4.9 and the 13C DNP enhancement data are summarized in the Table 4.6.
It can be seen that the scalar enhancement for ipso carbon increases in the order of I
> Br > Cl > F. It should be mentioned that this is the first observation of a positive scalar
Table 4.6. 13C DNP Enhancement (A∞) Summary of Four
Monosubstituted Halobenzenes
Compound Ipso Ortho Meta Para
C6H5F -572 63 71 -51
C6H5Cl -478 95 11 -32
C6H5Br -170 147 50 -9
C6H5I 478 111 39 15

48
dominated enhancement observed at the C-1 position in a monosubstituted benzene. Three
different mechanisms may lead to the scalar enhancement: 1) The hydrogen bonding
interaction at ortho hydrogen atom, 2) the radical directly interacts with Cj and 3) polarizable
halogen electrons transmit the unpaired electron density from the free radical to the carbon
atom of interest. Figure 4.9 a. b. c. illustrates these three possible mechanisms[9,10,56].
(a)
(b)
(c)
Figure 4.9 Possible Electron Density Transfer Mechanisms
NO.X
H
NO.
X
N
O.
X
49
Since the fluorine atom has the strongest electron withdrawing-effect among the
halogens, it can be expected that the strongest hydrogen bonding or more acidic Cortho-H
bond would form for the fluorobenzene case. This assumes that the scalar enhancement for
the ipso carbon (C-1) is caused by hydrogen bonding for the hydrogen at the ortho position,
fluorine substitution should lead to the largest scalar enhancement. However the observed
ipso 13C scalar DNP enhancements are in the order of I > Br > Cl > F. Therefore the
hydrogen bonding interaction is apparently not the dominate contribution to the scalar
enhancement. If the TEMPO radical direct interaction with the Cj carbon atom of the
substrate is important. The largest scalar enhancement should be observed for
fluorobenzene. This is because: 1) the Cj in fluorobenzene has lower electron density than
the other halobenzenes, this will promote the electron density transfer from free radical to
the carbon and 2) fluorine has the smallest steric hindrance for the interaction between
TEMPO radical and the Cj site than with other halogen atom substituted substrates.
However this expectation is contrary to the experimental results. Thus, it appears that the
radical direct interaction with Cj is not responsible for the scalar enhancement of Cj.
It follows from the above discussion that the scalar enhancement for Cj in
halobenzenes is caused by specific interactions between the halogen atom and the free
radical. In addition, the polarizable ability of the halogen atoms is in the order of I > Br > Cl
> F. This trend is consistent with the Cj scalar enhancement results. This suggests that the
facile transfer of spin polarization to carbon via the highly polarizable halogen atoms is
possible and the dominate electron transfer mechanism for this system.
50
(a)
(b)
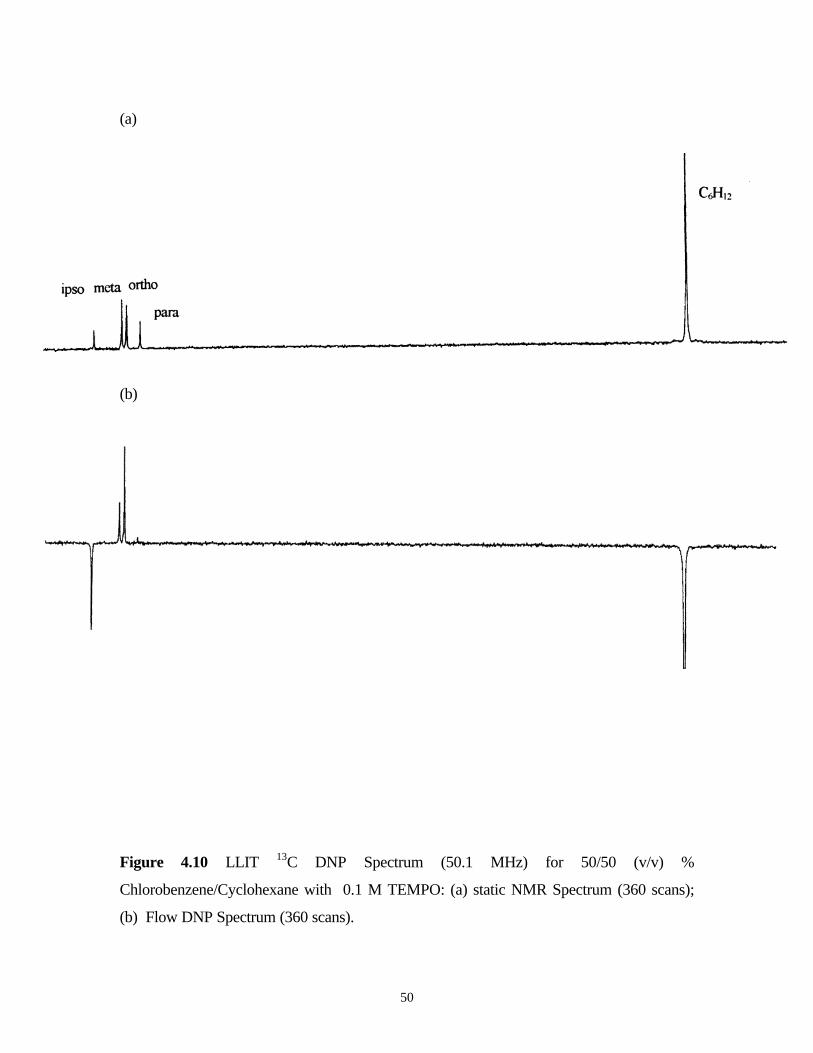
Figure 4.10 LLIT 13C DNP Spectrum (50.1 MHz) for 50/50 (v/v) %
Chlorobenzene/Cyclohexane with 0.1 M TEMPO: (a) static NMR Spectrum (360 scans);
(b) Flow DNP Spectrum (360 scans).

51
Table 4.7. LLIT 13C DNP Relaxation and Enhancement Data for 50/50 (v/v) %Chlorobenzene/Cyclohexane with 0.1 M TEMPO
Carbon
Type
Peakb
Position
(ppm)
T10c
(Sec.)
T1c
(Sec.)
fd A∞a,e,f,g
Ipso 134.41 41.5 1.90 0.954 -478
Ortho 128.50 18.4 1.92 0.895 95
Meta 129.37 13.8 2.30 0.833 11
Para 126.02 15.1 1.73 0.885 -32
Note:
(a) Ratio method was used to calculate the DNP ultimate enhancements.
(b) 1H broad-band decoupling was employed to eliminate proton-carbon coupling.
(c) T1 and T10 are the spin-lattice relaxation times of the carbon nuclei with and without TEMPO in the sample solution, respectively.
(d) The leakage factor f was calculated based on T1 measurements at 4.7 T magnetic field.
(e) The 0.33 T 13C DNP enhancements were monitored at 4.7 T. All data was obtained at room temperature.
(f) Cyclohexane was used as the reference compound with A∞= -270±40.
(g) The ultimate 13C DNP enhancement A∞ is an average value of four measurements at different power levels. The estimated relative standard deviation for A∞ is about 15%.
Clipso
para
ortho
meta
52
(a)
(b)
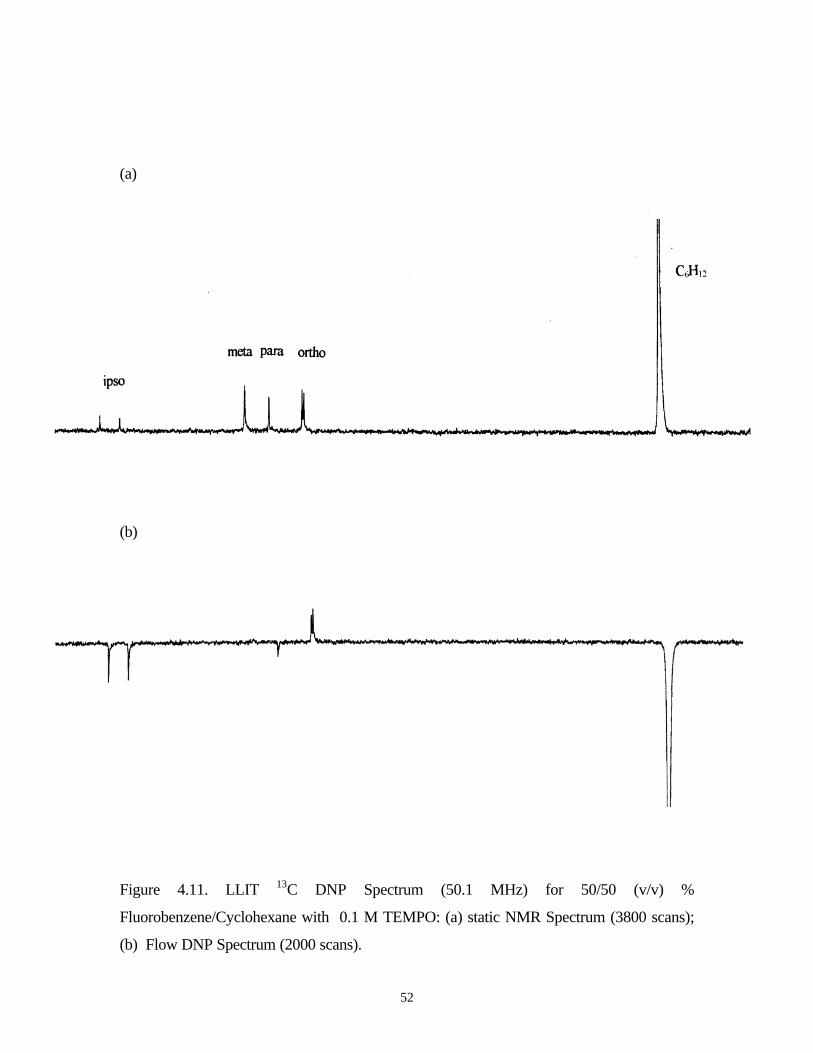
Figure 4.11. LLIT 13C DNP Spectrum (50.1 MHz) for 50/50 (v/v) %
Fluorobenzene/Cyclohexane with 0.1 M TEMPO: (a) static NMR Spectrum (3800 scans);
(b) Flow DNP Spectrum (2000 scans).
53
Table 4.8. LLIT 13C DNP Relaxation and Enhancement Data for 50/50 (v/v) %Fluorobenzene/Cyclohexane with 0.1 M TEMPO
Carbon
Type
Peakb
Position
(ppm)
T10c
(Sec.)
T1c
(Sec.)
fd A∞a,e,f,g
Ipso 165.43 27.3 2.26 0.917 -572
Ortho 115.22 14.8 1.47 0.901 63
Meta 129.45 25.9 1.48 0.943 71
Para 123.47 13.5 1.51 0.888 -51
Note:
(a) Ratio method was used to calculate the DNP ultimate enhancements.(b) 1H broad-band decoupling was employed to eliminate proton-carbon coupling.
(c) T1 and T10 are the spin-lattice relaxation times of the carbon nuclei with and without TEMPO in the sample solution, respectively.
(d) The leakage factor f was calculated based on T1 measurements at 4.7 T magnetic field.
(e) The 0.33 T 13C DNP enhancements were monitored at 4.7 T. All data was obtained at room temperature.
(f) Cyclohexane was used as the reference compound with A∞= -270±40.
(g) The ultimate 13C DNP enhancement A∞ is an average value of four measurements at different power levels. The estimated relative standard deviation for A∞ is about 15%.
Fipso
para
ortho
meta
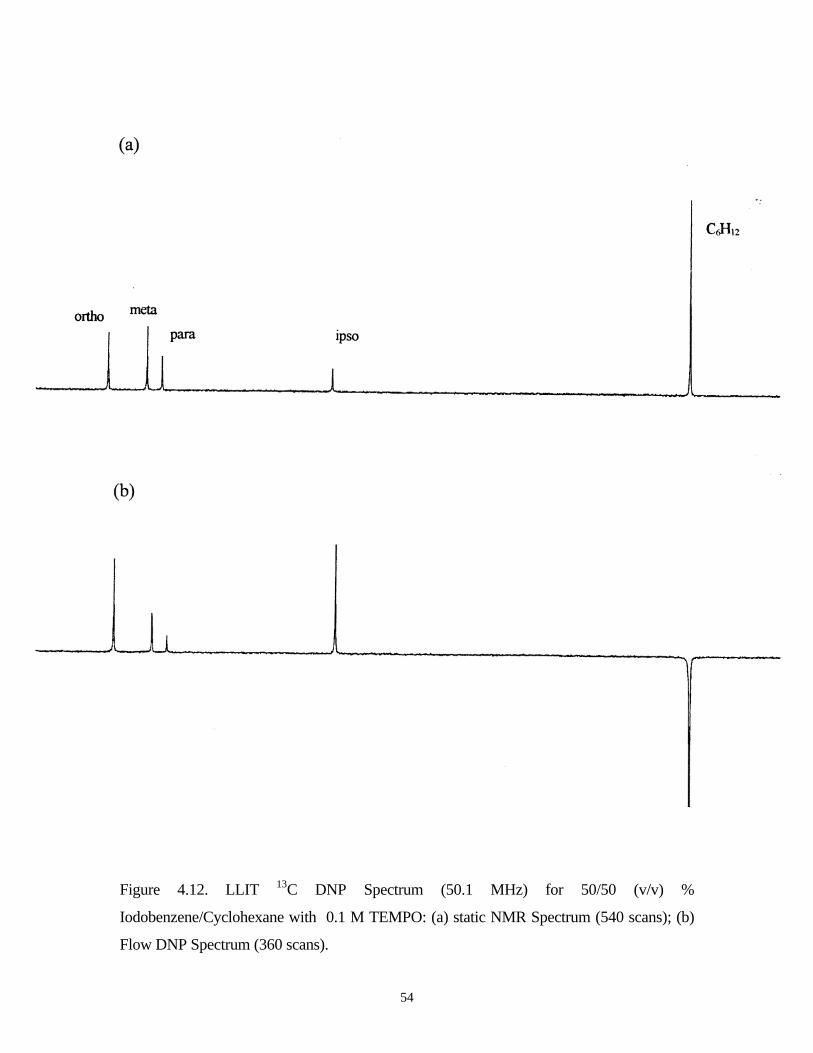
54
Figure 4.12. LLIT 13C DNP Spectrum (50.1 MHz) for 50/50 (v/v) %
Iodobenzene/Cyclohexane with 0.1 M TEMPO: (a) static NMR Spectrum (540 scans); (b)
Flow DNP Spectrum (360 scans).

55
Table 4.9. LLIT 13C DNP Relaxation and Enhancement Data for 50/50 (v/v) %Iodobenzene/Cyclohexane with 0.1 M TEMPO
Carbon
Type
Peakb
Position
(ppm)
T10c
(Sec.)
T1c
(Sec.)
fd A∞a,e,f,g
Ipso 94.78 19.9 0.96 0.952 478
Ortho 137.48 10.5 1.12 0.894 111
Meta 130.11 11.0 0.95 0.914 39
Para 127.26 9.3 0.987 0.894 15
Note:
(a) Ratio method was used to calculate the DNP ultimate enhancements.(b) 1H broad-band decoupling was employed to eliminate proton-carbon coupling.
(c) T1 and T10 are the spin-lattice relaxation times of the carbon nuclei with and without TEMPO in the sample solution, respectively.
(d) The leakage factor f was calculated based on T1 measurements at 4.7 T magnetic field.
(e) The 0.33 T 13C DNP enhancements were monitored at 4.7 T. All data was obtained at room temperature.
(f) Cyclohexane was used as the reference compound with A∞= -270±40.
(g) The ultimate 13C DNP enhancement A∞ is an average value of four measurements at different power levels. The estimated relative standard deviation for A∞ is about 15%.
Iipso
para
ortho
meta

56
4.3. Solution 13C DNP Studies of Possible Polarization Mechanism via Abundant 1H Spin
in the Mono-substituted Aromatic Compounds
4.3.1. Introduction
Previous work has demonstrated that the DNP technique provides a potentially
powerful tool for the investigation of the interaction between various molecules and free
radicals. The study of DNP enhancements can provide direct information on the mechanism
of electron spin density transfer from the free radical (electron donor) to the sample
molecules (electron acceptor). Several possible transfer models have been proposed (see
Fig. 4.12). One is the indirect polarization model[9]. In this model, it is believed that the
formation of the weak hydrogen bond between TEMPO free radical and the proton attached
to carbon plays an important role. For example[9], Tsai and coworkers have studied the 13C
DNP of the chlorobenzene, they found that C-1 carbon exhibits a large negative dipolar
dominated enhancement, whereas, the C-2 carbon exhibits a large scalar dominated
enhancement. The large positive scalar enhancement for C-2 carbon comes from the
possible weak complexation of free radical TEMPO with the proton attached to C-2. The
electron withdrawing chlorine atom causes the enhanced proton donor capability of the C-2
aromatic proton in comparison with benzene proton. The large dipolar dominated
enhancement for ipso carbon (C-1) is probably due to a smaller scalar contribution and lack
of three-spin effects[9]. The second model is direct spin density delocalization model[10]. In
this model, the positive electron spin density from TEMPO is transmitted into the anti-
bonding orbital π∗ of the aromatic molecule. The transmitted electron spin density correlates
with the σ orbitals around the carbon nuclear and induces an excess positive electron spin
density near the carbon-nucleus and excess negative spin densities at the adjacent carbon
nuclei and the hydrogen nucleus.[37] A schematic illustration for these two mechanism are
shown in Figure 4.13 (a) and (b), respectively.

57
(a)
(b)
Figure 4.13. Possible Mechanism for 13C DNP enhancements
δ– δ+
HX NO
HX
NO

58
Besides these mechanisms, is it possible that still have some other models. For example, it
is also possible that the electron spins provide diffusion via abundant proton spins from one
proton to another by mutual spin flips and finally transfer the polarization to the carbon
nucleus. A schematic illustration diagram for this possible transfer model is shown in Figure
4.14.
In order to examine the possible importance of this possible spin transfer model, a
simple experiment was designed.
Figure 4.14 Polarization Transfer Mechanism Models
(Via Abundant 1H Spins and Mutual Hydrogen Spin Flips)
BrD
D
D D
D NO* *
BrH
H
H H
H NO* *

59
4.3.2. Experimental Results and Discussion
Deuterium can be easily incorporated into molecules and has been commonly used
in the studies of mechanistic and structure information. In comparison with the proton, the
deuterium nuclide has low magnetogyric ratio and quadrupole moment (I=1). Since the
proton has only half the mass of the deuteron, the deuteron is less polarizable than the
proton. Previous deuterium DNP studies 9,39 shown that the radical-deuteron coupling is
very inefficient even at very high radical concentrations. Thus, polarization transfer from
one site to another via mutual hydrogen spin flips is suppressed for the deuterated examples.
Based on the above difference between the proton and deuteron, polarization transfer via the
abundant proton spins to the carbon-13, a significant difference between 13C DNP
enhancement of the deuterium substituted species and their protonated analogs should be
expected. The 13C DNP enhancement of Benzene-d6, Toluene-d8, Bromobenzene-d5 and
their protonated species were measured at the same conditions as the respective hydrogen
compounds. The 13C DNP spectra are shown in Figure 4.15.- 4.17. The 13C DNP results are
shown in Table 4.11-4.15. The ultimate enhancements are summarized in Table 4.10.
Table 4.10. 13C DNP Enhancement (A∞) Summary of Three
Monosubstituted benzenes and Their Deuteron Analogs
Compound C-X Ortho Meta Para Other
Benzene -199 -199 -199 -199
Benzene-d6 -205 -205 -205 -205
Bromobenzene -107 147 50 -9
Bromobenzene-d6 -167 102 9 -49
Tolurene -562 -179 -153 -207 -187
Tolurene-d6 -487 -218 -238 -221 -214

60
The results for 13C DNP enhancements in Table 4.6 exhibit no significant
differences between deuteron species and their protonated analogs. This indicates that the
polarization transfer via mutual hydrogen spin flips via the abundant proton spins to the
carbon of interest is not important. The 13C DNP results also show that the DNP
enhancements, at all positions, are slightly more negative in the deuteron case than in the
protonated case. The increasing dipolar dominated enhancements is probably due to the lack
of three-spin effects and a smaller scalar contribution in the deuteron case. From Equation
2.41, it is easy to understand that the low magenetogyric ratio of deuteron will decrease the
three-spin effects. The smaller scalar contribution could also arise from the fact that the
deuteron is a slightly stronger electron donating atom than the proton. This makes all carbon
sites less favorable for the scalar interaction.

61
(a)
(b)
Figure 4.15 LLIT 13C DNP Spectrum (50.1 MHz) for (a) 60/40 (v/v) %
Benzene/Cyclohexane with 0.1 M TEMPO (32 scans); (b) 40/30 (v/v) % Benzene-
d6/Cyclohexane with 0.1 M TEMPO (64 scans).

62
Table 4.11. LLIT 13C DNP Relaxation and Enhancement Data for 60/40 (v/v) %Benzene/Cyclohexane and 40/30 (v/v) % Benzene-d6/Cyclohexane with 0.1 M TEMPO
Carbon
Type
Peakb
Position
(ppm)
T10c
(Sec.)
T1c
(Sec.)
fd A∞a,e,f,g
Benzene 128.24 29.3 1.78 0.939 -199
Benzeze-d6 127.52 49.5 2.10 0.958 -205
Note:
(a) Exhaustive method was used to calculate the DNP ultimate enhancements.
(b) 1H broad-band decoupling was employed to eliminate proton-carbon coupling.
(c) T1 and T10 are the spin-lattice relaxation times of the carbon nuclei with and without
TEMPO in the sample solution, respectively.
(d) The leakage factor f was calculated based on T1 measurements at 4.7 T magnetic field.
(e) The 0.33 T 13C DNP enhancements were monitored at 4.7 T. All data was obtained at
room temperature.
(f) Cyclohexane was used as the reference compound with A∞= -270±40.
(g) The ultimate 13C DNP enhancement A∞ is an average value of four measurements at
different power levels. The estimated relative standard deviation for A∞ is about 15%.

63
(a)
(b)
Figure 4.16 LLIT 13C DNP Spectrum (50.1 MHz) for (a) 50/50 (v/v) %
Toluene/Cyclohexane with 0.1 M TEMPO (360 scans); (b) 50/50/10 (v/v) % Toluene-
d6/CCl4/Cyclohexane with 0.1 M TEMPO (360 scans).

64
Table 4.12. LLIT 13C DNP Relaxation and Enhancement Data for 50/50 (v/v) %Toluene/Cyclohexane with 0.1 M TEMPO
Carbon
Type
Peakb
Position
(ppm)
T10c
(Sec.)
T1c
(Sec.)
fd A∞a,e,f,g
Ipso 137.03 58 3.20 0.944 -562
Ortho 128.73 20 2.83 0.859 -179
Meta 127.94 21 2.82 0.866 -153
Para 125.14 15 2.88 0.808 -207
-CH3 21.02 16.3 2.19 0.865 -187
Note:
(a) Ratio method was used to calculate the DNP ultimate enhancements.
(b) 1H broad-band decoupling was employed to eliminate proton-carbon coupling.
(c) T1 and T10 are the spin-lattice relaxation times of the carbon nuclei with and withoutTEMPO in the sample solution, respectively.
(d) The leakage factor f was calculated based on T1 measurements at 4.7 T magnetic field.
(e) The 0.33 T 13C DNP enhancements were monitored at 4.7 T. All data was obtained atroom temperature.
(f) Cyclohexane was used as the reference compound with A∞= -270±40.
(g) The ultimate 13C DNP enhancement A∞ is an average value of four measurements atdifferent power levels. The estimated relative standard deviation for A∞ is about 15%.
CH3
ipso
para
ortho
meta

65
Table 4.13. LLIT 13C DNP Relaxation and Enhancement Data for 50/50 (v/v) % Toluene-d8/Cyclohexane with 0.1 M TEMPO
Carbon
Type
Peakb
Position
(ppm)
T10c
(Sec.)
T1c
(Sec.)
fd A∞a,e,f,g
Ipso 136.79 63.8 3.44 0.946 -487
Ortho 128.45 54.1 2.80 0.948 -218
Meta 127.58 41.1 3.17 0.923 -238
Para 124.78 56.6 2.70 0.952 -221
-CD3 20.46 26.8 2.43 0.909 -214
Note:
(a) Ratio method was used to calculate the DNP ultimate enhancements.
(b) 1H broad-band decoupling was employed to eliminate proton-carbon coupling.
(c) T1 and T10 are the spin-lattice relaxation times of the carbon nuclei with and without TEMPO in the sample solution, respectively.
(d) The leakage factor f was calculated based on T1 measurements at 4.7 T magnetic field.
(e) The 0.33 T 13C DNP enhancements were monitored at 4.7 T. All data was obtained at room temperature.
(f) Cyclohexane was used as the reference compound with A∞= -270±40.
(g) The ultimate 13C DNP enhancement A∞ is an average value of four measurements at different power levels. The estimated relative standard deviation for A∞ is about 15%.
CD3
D
D
D
D
Dipso
para
ortho
meta

66
Figure 4.17 LLIT 13C DNP Spectrum (50.1 MHz) for (a) 50/50/10 (v/v) %Bromobenzene/CCl4/Cyclohexane with 0.1 M TEMPO (420 scans); (b) 50/50/10 (v/v) %Bromobenzene-d5 /CCl4/Cyclohexane with 0.1 M TEMPO (1280 scans).

67
Table 4.14. LLIT 13C DNP Relaxation and Enhancement Data for 50/50/10 (v/v) %Bromobenzene/CCl4/Cyclohexane with 0.1 M TEMPO
Carbon
Type
Peakb
Position
(ppm)
T10c
(Sec.)
T1c
(Sec.)
fd A∞a,e,f,g
Ipso 122.52 13.5 2.13 0.841 -167
Ortho 131.49 20.0 1.40 0.930 147
Meta 129.82 17.7 1.40 0.921 50
Para 126.53 14.8 1.55 0.895 -9
Note:
(a) Ratio method was used to calculate the DNP ultimate enhancements.
(b) 1H broad-band decoupling was employed to eliminate proton-carbon coupling.
(c) T1 and T10 are the spin-lattice relaxation times of the carbon nuclei with and without TEMPO in the sample solution, respectively.
(d) The leakage factor f was calculated based on T1 measurements at 4.7 T magnetic field.
(e) The 0.33 T 13C DNP enhancements were monitored at 4.7 T. All data was obtained at room temperature.
(f) Cyclohexane was used as the reference compound with A∞= -270±40.
(g) The ultimate 13C DNP enhancement A∞ is an average value of four measurements at different power levels. The estimated relative standard deviation for A∞ is about 15%.
Bripso
para
ortho
meta

68
Table 4.15. LLIT 13C DNP Relaxation and Enhancement Data for 50/50/10 (v/v) %Bromobenzene-d5 /CCl4/Cyclohexane with 0.1 M TEMPO
Carbon
Type
Peakb
Position
(ppm)
T10c
(Sec.)
T1c
(Sec.)
fd A∞a,e,f,g
Ipso 122.30 15.0 1.56 0.896 -167
Ortho 131.06 35.2 1.47 0.958 102
Meta 129.23 35.9 1.65 0.954 9
Para 126.02 29.3 1.81 0.938 -49
Note:
(a) Ratio method was used to calculate the DNP ultimate enhancements.
(b) 1H broad-band decoupling was employed to eliminate proton-carbon coupling.
(c) T1 and T10 are the spin-lattice relaxation times of the carbon nuclei with and without TEMPO in the sample solution, respectively.
(d) The leakage factor f was calculated based on T1 measurements at 4.7 T magnetic field.
(e) The 0.33 T 13C DNP enhancements were monitored at 4.7 T. All data was obtained at room temperature.
(f) Cyclohexane was used as the reference compound with A∞= -270±40.
(g) The ultimate 13C DNP enhancement A∞ is an average value of four measurements at different power levels. The estimated relative standard deviation for A∞ is about 15%.
Br
D
D
D
D
Dipso
para
ortho
meta

69
CHAPTER 5. CONCLUSIONS
The 13C DNP studies of over ten monosubstituted aromatic compounds with electron
withdrawing and donating functional groups indicate that transient bonding is an important
way to transmit electron spin density from the free radical to the carbon nuclei of organic
molecules. The 13C DNP results for the aromatic molecules also show that the 13C DNP
technique is sensitive to the electronic environment of the substituted benzene ring. The 13C
DNP enhancements results also show that ortho, meta and para position exhibit large
scalar dominated enhancements for compounds with electron-withdrawing groups (F, Cl,
Br, I, CN, CHO, NO2). Whereas, the dipolar dominated enhancements are observed in
compounds with electron donating substituted groups (OCH3, CH3, NH2). The 13C DNP
results also show that larger magnitude scalar enhancements for most compounds follow
the order of ortho > meta > para. These results indicate that the 13C DNP enhancement
have a definitive relationship with substituent electronic effects. The results of correlation
studies of 13C DNP enhancements with the Hammett σ constants suggest that in the ground
state of these aromatic molecules the inductive effect is much more important that resonance
effect in terms of the electronic charge distribution on the benzene ring.
The large scalar dominate enhancement (478) obtained at ipso carbon of
iodobenzene indicates that the facile transfer of spin polarization to carbon via the highly
polarizable halogen atoms is possible and the dominate electron transfer mechanism for this
system.
The results for 13C DNP enhancements of bromobenzene, benzene, toluene and their
deuteron species exhibit no significant differences. This indicates that the polarization
transfer via mutual hydrogen spin flips via the abundant proton spins to the carbon of

70
interest is not important. . The 13C DNP results also show that the DNP enhancements, at all
positions, are slightly more negative in the deuteron case than in the protonated case. The
increasing dipolar dominated enhancements is probably due to the lack of three-spin effects
and a smaller scalar contribution in the deuteron case.

71
REFERENCE
1. E. M. Purcell, H. C. Torrey and R. V. Pound, Phys. Rev., 69, 37 (1946).
2. F. Bloch, W. W. Hansen and M. Packard, Phys. Rev., 69, 127 (1946).
3. D. Show, J. Phys. E: Sci. Instrum. 7, 689 (1974).
4. R. R. Ernst, G. Bodenhansen and A. Wokaun, Principles of Nuclear Magnetic
Resonance in One and Two Dimensions, Oxford University, Oxford, P.2 (1987).
5. J. A. Potenza and E. H. Poinderxter, J. Amer. Chem. Soc. 90, 6309 (1968).
6. E. H. Poindexter, J. A. Potenza, D. D. Thompson, N. Van Nghia and R. H. Webb,
Mol. Phys. 14, 385 (1968).
7. E. H. Poindexter, R. A. Dwek and J. A. Potenza, J. Chem. Phys. 51, 628 (1969).
8. R. A. Dwek, N. L. Paddock, J. A. Potenza and E. H. Poindexter, J. Amer. Chem. Soc.
91,5436 (1969).
9. K. H. Tsai, Ph.D. Thesis (1990), Virginia Polytechnic Institute and State University.
10. Z. Q. Sun, Ph. D. Thesis, (1996), Virginia Polytechnic Institute and State University.
11. C. D. Jeffries, Dynamic Nuclear Orientation, Interscience Publishers, New York
(1963).

72
12. R.A. Dwek, R. E. Richards and D. Taylor, Annu. Rev. NMR Spectrosc. 2, 293 (1969).
13. I. Solomon, Phys. Rev. 99, 559(1955).
14. T. R. Carver and C. P. Slichter, Phys. Rev., 92, 212, (1953).
15. K. H. Hausser and D. Stehlik, Adv. Magn. Reson., 3, 79 (1969).
16. P. S. Hubbard, Pro. Roy. Soc. A291, 537 (1966).
17. K. D. Kramer and W. Müller-Warmuth, Z. Naturforsch, A19, 375 (1964).
18. H. Pfeifer, Ann. Phys. 8, 1 (1961).
19. K. Meise, W. Müller-Warmuth and H. W. Nientiedt, Ber. Bunsenges. Phys. Chem. 80,
584 (1976).
20. J.Trommel, Ph. D. Thesis, U. of Delft, (1978).
21. E. H. Poindexter, J. R. Steward and P. J. Caplan, J. Chem. Phys. 47, 2862 (1967).
22. G. J. Kriiger, W. Müller-Warmuth and R. Van Steenwinkel, Z. Naturforsch. A21,
1224 (1966).
23. A. Abragam, The Principles of Nuclear Magnetism (Clarendon, Oxford, England,
1961).
24. I. Solomon and N. Bloembergen, J. Chem. Phys. 25, 261 (1956).
25. D. F. S. Natusch, R. E. Richards and D. Taylor, Mol. Phys., 11, 421 (1966).

73
26. K. H. Hansser, and D. Stehlik, Adv. Magn. Reson. 3, 79, (1968).
27. H. C. Dorn, T. E. Glass, R. Gitti and K. H. Tsai, Appl. Magn. Reson., 2, 9, (1991).
28. K. H. Tsai and H. C. Dorn, Appl. Magn. Reson., 1, 231, (1990).
29. R. Gitti, Ph. D. Thesis, (1991), Virginia Polytechnic and State Univ..
30. J. Gu, Ph. D. Thesis, (1992), Virginia Polytechnic and State Univ..
31. H. C. Dorn et al., J. Magn. Reson., 79, 404, (1988).
32. R. E. Richards and J. W. White, Proc. Roy. Soc., A269, 301 (1962).
33. K. H. Tsai, T. E. Glass and H. C. Dorn, J. Magn. Reson. 89, 362 (1990).
34. H. C. Dorn, J. Gu, D. S. Bethune, R. D. Johnson and C. S. Yannoni, Chem. Phys.
Letters, 203,549 (1993).
35. H.Friebolin, Basic One and Two Dimentional NMR Spectroscopy, Second, Enlarged
Edition (1993).
36. I. Morishima, T. Matsui, T. Yonezawa and K. Goto, J. Chem. Soc. Perkin Trans. 11,
633 (1972).
37. G. N. LaMar, W. D. Horrocks, R. H. Holm, Jr., “ NMR of Paramagnetic Molecules”,
Academic Press: New York, (1973).
38. J. G. Kirkwood and F. H. Westheimar, J. Chem. Phys., 6, 506 (1938).

74
39. R. D. Bates, Jr., E. H. Poindexter, and B. E. Wagner, J. Chem. Phys., 59, 3031 (1973).
40. J. A. Potenza, E. H. Poindexter, P. J. Caplan, and R. A. Dwek, J. Am. Chem. Soc., 91,
4356 (1969).
41. R. A. Dwek, N. L. Paddock, J. A. Potenza, and E. H. Poindexter J. Am. Chem. Soc.,
91, 5436 (1969).
42. W. Müller-Warmuth and R. Vilhjalmsson, Z. Phys. Chem., 93, 283 (1974).
43. R. D. Bates, Jr., B. E. Wagner and E. H. Poindexter, Chem.Phys. Lett., 17, 328 (1972).
44. W. Müller-Warmuth, R. Vilhjalmsson, P. A. M. Gerlof, J. Smidt, and J. Trommel,
Mol. Phys., 31, 1055 (1976).
45. R. D. Bates, Jr., B. E. Wagner and E. H. Poindexter, J. Phys. Chem., 80, 320 (1976).
46. R. D. Bates, Jr., J. Phys. Chem., 66, 1759 (1977).
47. W. Müller-Warmuth, E. Öztekin, R. Vilhjlamsson, and A. Yalciner,Z. Naturforsch.
A25,1696 (1970).
48. N. A. Sysoeva, A. Y. Karmilov, and A. L. Buchachenko, Chem. Phys. 7, 123 (1975).
49. K. Endo, B. Knuettel, I. Morishima, T. Inubushi, and T. Yonezawa, Chem. Phys.
Lett., 31, 387 (1975).
50. G. Franklin and R. D. Bates, Jr., J. Magn. Reson., 53, 503 (1983).

75
51. L. P. Hammett, Physical Organic Chemistry, McGraw-Hill Book Company, Inc., New
York, (1940).
52. H. H. Jaffé, Chem. Revs., 53, 191 (1953).
53. L. P. Hammett, Chem. Revs., 17,125 (1935).
54. O. Exner, In Correlation Analysis in Chemistry, Plenum Press, New York, (1973).
55. J. Hine, Physical Organic Chemistry, Mcgraw-Hill Book Company, Inc., (1962).
56. Isao Morishima, Toshiro Inubushi and Teijiro Yonezawa, J. of the Am. Chem. Soc.
98, 3808 (1976).
57. G. A. Morris, and R. Freeman, J. Am. Chem. Soc., 101, 760 (1979).
58. D. M. Doddrell and D. T. Pegg, J. Am. Chem. Soc., 102, 6388 (1980).
59. D. P. Burum and R. R. Ernst, J. Magn. Reson., 39, 163 (1980).
60. M. R. Bendall, D. M. Doddrell and D. T. Pegg, J. Am. Chem. Soc., 103, 4603 (1981)
61. D. M. Doddrell, D. T. Pegg and M. R. Bendall, J. Magn. Reson., 48, 323 (1982).
76
VITA
Li Song
Li Song was born on August 25, 1962 in Nanjing, China. He graduated with a B.S.
degree in Pharmacy from China Pharmaceutical University, Nanjing, China in July 1984.
He worked as a research chemist in the Nanjing Medicinal Company from 1984 to 1986. In
September 1986, he became a graduate student in Department of Pharmacy, China
Pharmaceutical University and graduated with M.S. degree in Pharmaceutical Analysis in
July 1989. Since then, he had been working in the area of pharmaceutical analysis for the
period 1989-1994. In the Fall of 1994, he enrolled in the Chemistry Department of Virginia
Polytechnic Institute and State University as a graduate student under the guidance of Dr. H.
C. Dorn and received his Master’s Degree in September, 1997.