İÇERİK Bank24 JET Platformu Bank24 JET Uygulamaları Bank24 JET İşleyişi

Proceedings of ASME Turbo Expo 2019GT2019
June 17–21, 2019, Phoenix, Arizona, USA
GT2019-91972
LIQUID JET IN CROSSFLOW : EFFECT OF MOMENTUM FLUX RATIO ON SPRAYAND VAPORIZATION CHARACTERISTICS
Manu Kamin, Prashant KhareDepartment of Aerospace Engineering and Engineering Mechanics
University of Cincinnati, Cincinnati, 45221-0070, USAEmail: [email protected], [email protected]
ABSTRACT
A comprehensive study is conducted to identify the effectsof momentum flux ratio on the spray and vaporization charac-teristics of liquid jet injected in air crossflow at elevated tem-peratures, a configuration relevant to high-speed propulsion sys-tems, such as ramjets and afterburners. The physical setup con-sists of a straight chamber with a triangular bluff body down-stream of the liquid injection location. The numerical simula-tions are based on an Eulerian - Lagrangian framework, wherethe gas phase flow behaviors such as recirculation zones, turbu-lence statistics, mixing of vaporized liquid and gas streams areresolved by solving the complete set of three-dimensional con-servation equations of mass, momentum, energy and species, andthe liquid phase is treated using the blob approach and tracked ina Lagrangian coordinate system. Turbulence closure is achievedusing Large Eddy Simulation (LES) technique. Primary breakupof the liquid jet is simulated using the K-H wave breakup model,and the Taylor Analogy Breakup (TAB) model is used for sec-ondary breakup. Two-way coupling between the liquid and gasphases is implemented in the LES framework to systematicallymodel the exchange of mass, momentum and energy between thetwo phases. The formulation is validated against experimen-tal measurements of liquid jet penetration and sauter mean di-ameter for a Weber number of 68 and momentum flux ratio of9 at two temperatures, 298K and 573K. Results show excellentagreement with measurements for both cases. Next, simulationsare conducted for a range of momentum flux ratios from 10-140to identify the detailed gas and spray fields for vaporizing flowcases. This study helps to estimate the penetration of the liquidjet, droplet distribution, and then, location of the core of evapo-
rated liquid in the gas-phase are quantitatively identified.
NOMENCLATUREU : velocityρ : densityσ : surface tensionµa : Air viscosity µaq : momentum flux ratio - ρ ju2
j/ρau2a
We : Weber number - ρau2relD/σ
ReD : Jet Reynolds number - ρauaD/µa
Subscripts:D : Droplet diametera : inflow airj : liquid jetd : droplet phase
INTRODUCTIONCombustion in liquid fueled propulsion devices such as gas
turbines, rockets and afterburners involve a series of complexphenomena, including primary and secondary atomization of theliquid fuel, vaporization, mixing, ignition, ensuing combustionand flame stabilization. Among all the physical processes,atomization and subsequent spray dynamics is especially im-portant because the system performance is conditioned by thefuel droplet size distribution, which is often the rate-controllingprocess. A commonly used atomization technique in afterburn-ers and ramjet engines consists of the liquid fuel being injected
1
perpendicular to an incoming air crossflow, with a v-gutterbluff body downstream of the fuel injector. While a numberof experiments and a few numerical simulations studies havebeen conducted in the past to study atomization characteristicsof liquid jets in such a configuration, a systematic study thatdetails the effect of momentum flux ratio on atomization andvaporization behaviors of jet fuels is yet to be conducted. This isthe focus of the current research effort.
Spray characteristics for a liquid jet injected into a cross-flow of air have been studied extensively through experiments.Based on such measurements, correlations have been developedto predict the atomization behavior as a function of non-dimensional quantities, such as momentum flux ratio, Webernumber and Reynolds number. For instance, Wu et al. [1]developed correlations to predict the height of liquid columnover a range of momentum flux ratios and injector diametersbased on experimentally obtained data. While such correlationsare useful as a first estimate of trajectories of liquid jets, moredetailed studies are necessary to be able to understand the spraycharacteristics better. Recently, Amighi et al. [2] performedexperiments where water was injected into crossflowing airover a wide range of momentum flux ratio that varied from 8to 298 at elevated temperature and pressure conditions. Globalmeasurements of droplet sizes were reported for each case,and trends of variation of droplet sizes with liquid injectionvelocity, inflow air velocity and inflow air pressure. wereidentified. Although a global estimate of droplet sizes can be avery useful statistic, measurements that show spatial variationof droplet sizes provide far greater insight into the details ofatomization process and droplet distribution. Many other studieshave also been conducted in the past, that report similar corre-lations and trends [3–5]. Experimental measurements have alsobeen conducted to measure concentration of vaporized liquidin the gas phase for cases at elevated inflow air temperature [6,7].
Apart from experiments, numerical simulations have alsobeen conducted, although with varying degree of accuracy.One of the earliest attempts was made by Liu et al. [8], wheremultiple models for prediction of droplet breakup were used, andpredicted jet penetration depth was compared with experiments.Gas phase equations were not solved. More sophisticatedsimulations were carried out by Madabhushi et al. [9]. Here,conservation equations were solved for the gas phase with mod-els incorporated to predict the jet breakup, droplet kinematicsand droplet sizes. However, interactions between the gas phaseand liquid phase were ignored, leading to poor predictions ofdroplet velocities. No results were reported for the gas phase.Recently, Yoo et al. [10] performed LES calculations for liquidjet in crossflow. Mutual interaction between the droplets andfreestream were considered. While the spray characteristicswere studied systematically over a large range of momentum flux
ratio and inflow air temperature, its influence on the flowfieldwas not investigated in detail.
The present study aims to address some of the shortcomingsdescribed above. A comprehensive, high fidelity analysis detail-ing the effects of momentum flux ratio on the spatio-temporalevolution of gaseous and spray fields, and associated statistics ofliquid jet in vitiated air crossflow is presented using a large eddysimulation (LES) based framework.
Rest of the paper is organized in 5 sections. Section 2 de-tails the theoritical framework and numerical methods. This isfollowed by section3, dedicated to model validation. Section4describes the effect of momentum flux ratio on the carrier anddiscrete phases in terms of recirculation zones, droplet size dis-tribution and the penetration of vaporized liquid mass fractions.
THEORITICAL FORMULATION AND NUMERICALMETHODOLOGY
The gaseous phase is formulated in the Eulerian frame,based on three-dimensional compressible form of conservationequations for mass, momentum, energy and species transport.Source terms appear in these equations due to phase transforma-tion (and chemical reactions), and interactions between the con-tinuous and and discrete phases. Turbulence closure is achievedby large eddy simulation technique. The conservation equationscan thus be written as follows :
∂ ρ
∂ t+
∂ (ρ u j)
∂x j= ms (1)
∂ (ρ ui)
∂ t+
∂
∂x j[ρ uiu j + pδi j− τi j + τ
sgs] = ˜Fs,i (2)
∂ (ρE)∂ t
+∂
∂x j[(ρE p)u j + q j− uiτi j−Hsgs
j +σsgsj ] = ˜Qs (3)
∂ (ρYk)
∂ t+
∂
∂x j[ρUiYk + Ji,k +Y sgs
i,k ] = ¯ωk +˜Ss (4)
The spatially filtered variables are denoted as f , and Favre-averaged variables as f = ρ f/ρ . The filtered viscous stress ten-sor and heat flux vector are τi j and qi respectively. Yk refers tothe mass fraction of the kth species. The species diffusion fluxis denoted as J. The unresolved sub-gris scale “sgs” terms in 2and 3, including the stress τi j, the energy flux H j, and the viscouswork σ j, are given as:
τsgsi j = (ρuiu j−ρ uiu j) (5)
Hsgsi = (ρEui−ρEui)+(pui− pui) (6)
σsgsi = (u jτi j− u j τi j) (7)
The algebraic version of the Smagorinsky model suggested byErlebacher et al. [10] is used to close the sgs shear stress τ
sgsi j .
Flow inhomogeneities near the wall are treated using the VanDriest damping function.
2
Multi-phase modellingThe dispersed-phase dynamics is modeled using a La-
grangian approach. Since tracking every droplet is a computa-tionally expensive process, multiple droplets of identical size,location, velocity and temperature are clustered together andtreated as parcels. The motion of a individual parcels are thendetermined by Newton’s second law of motion as follows:
dxd
dt= ud , md
dud
dt= Fd (8)
where xd is the instantaneous particle location, and md the mass.The subscript “d” is used for droplets. Only the force arisingfrom skin friction and form drag is taken into account, afterneglecting the contributions from virtual mass, buoyancy, Bassetforces, gravity, and lift..
Fd =18
CDρgπdp2|uR|uR (9)
dp and uR are the particle diameter and velocity relative to thesurrounding carrier fluid, respectively. The drag coefficient for asphere CD is determined based on the empirical correlation by
CD =
{24
Red(1+ Red
2/3
6 ) Red < 10000.424 Red ≥ 1000
where Red is the particle Reynolds number based on the relativevelocity. The droplet mass transfer is governed by the dropletcontinuity equation:
dmd
dt=−md = ms (10)
where md is the mass of the droplet given by 43 ρdπr3
d , and md(>0) is the net mass transfer rate (or vaporization rate) for a dropletin a convective flow field, expressed as
md
md,Red=0= 1+
0.278Red1/2Sc
1/3
1+ 1.232Red Sc4/3
(11)
where Red = 0 is the Reynolds number for particle at rest.
Droplet heat transfer is governed by the droplet energy equa-tion, which accounts for the convective heat transfer betweenthe droplet and the surrounding air, and the latent heat of va-porization of the droplet. Temperature is assumed to be uniformthroughout the droplet. The equation governing the internal tem-perature distribution now looks as:
mdCldTd
dt= ˙Qconv− mdLv = hdπd2
d(T −Tp)− mLv (12)
hd
hd ,Red = 0= 1+
0.278Red1/2Pr1/3
1+ 1.232Red Pr4/3
(13)
where ˙Qconv is the convective thermal energy transfer rate, Cl isliquid heat capacity, hd is the heat transfer coefficient, and Lv isthe latent heat of vaporization. Additional details of this model,including the heat transfer coefficient and the latent heat of va-porization, can be referred to elsewhere [11].
Spray closure modelsHydrodynamic stability analysis developed by Reitz [12] is
implemented to model liquid injection and primary atomization.The disintegration of liquid jet is modeled by injecting liquid inthe form of “blobs”, instead of an intact liquid jet at the noz-zle exit. Each blob has a characteristic size equal to the injectorexit diameter, do , that is, dint = do. The number of blobs in-jected per unit time is determined from the injector mass flowrate. Each blob is assigned an initial radial velocity componentVo = Uotan(θ/2), where Uo is the injection velocity, and thespray angle θ is assumed to be uniformly distributed between0 and φ , with
tan(θ/2) = A1Λω/Uo (14)
where A1 is 0.188 for a sharp entrance nozzle with a length todiameter ratio of 5. By invoking the effects of Kelvin-Helmholtz(K-H) instability in jets, the frequency of the fastest growing K-Hwave ω , and the corresponding wave length, λ , is determined us-ing a curve-fit solution of the linearized hydrodynamic equationsas follows:
Λ
a= 9.02
(1+0.45Z0.5)(1+0.4T 0.7)
(1+0.87Weg0.67)0.6
(15)
ωρla3
σ= 9.02
(0.34+0.38Weg1.5)
(1+Z)(1+1.4T 0.6)(16)
where Z =Wel0.5/Rel is the Ohnesorge number, Wel = ρlURa/σ
the liquid Weber number, Weg = ρgUrd/σ the gas Weber num-ber, and T = ZWe2
0.5 the Taylor number. The variable a is theblob/parent droplet radius. The subscripts l and g denote theliquid and gas phases, respectively.
Breakup of liquid droplets moving in a gaseous environmentis assumed to be caused by aerodynamic liquid-gas interactions,i.e., shear-flow and drag-deceleration induced instability waves.The droplets are modeled such that their size is proportional tothe wavelength of the fastest growing surface-instability wave,given as :
r = BoA(BoΛ < a) (17)
r = min[(3/πa2W/2ω)0.33(3a2λ/4)0.34](Boλ > a) (18)
where B0 is a constant and equals 0.61. Once the parent dropletbreaks up, the new droplets are now tracked, and the mass lostby the original droplet after the breakup is assigned to the childdroplets. The rate of change of drop radius in a parent parcel isassumed to obey the following equation:
dadτ
=−a− rτ
(19)
where τ = 3.726B1a/λω , with B1 being a breakup time con-stant, and is set to a value of 1.73 as recommended by Liu etal. [8]. The Taylor Analogy Breakup (TAB) model [13], is usedto model secondary atomization. More information may befound in Khare et al. [14].
Finally, the impingement of droplets on solid surfaces(walls)is treated as recommended by Mundo et. al [15]
3
Coupling between dispersed and carrier phaseCoupling between the dispersed phase and the gas phase are
provided by the inter-phase exchange terms or the source termsthat appear on the right-hand side of the governing equations.These are computed as follows :
ρsFsQs˙Si,s
=
∑m
ndmd
∑m
nd [mdud − 4π
3 ρdrd3 dud
dt ]
∑m
nd [mdhv,s−hdπdd2(T −Td)−udmd .
d(ud)dt + md(
12 ud .ud)]
∑m
ndmd
(20)
where the summation index m is over all of the droplet “com-putational parcels”, as defined earlier, crossing a computationalcell volume. It must be noted that the species source term ˙Si,sfor all species is zero, except for vaporizing fuel. Additionalsource terms due to combustion are computed separately, detailsof which can be referred to in [16]
The governing equations that are solved for the gaseousphase, as described in the previous section, are solved using afinite volume method employed on a structured grid. Spatialdiscretization is second-order accurate, and central-differencingscheme is used in generalized coordinates. A fourth-order matrixdissipation, with a total-variation-diminishing method is appliedto ensure computational stability and prevent numerical oscilla-tions in regions with steep gradients. Temporal discretizationis obtained using a four-step Runge-Kutta integration scheme.Multi-block domain decomposition is used to facilitate the im-plementation of paral-lel computation with message passing in-terfaces at the domain boundaries.
MODEL VALIDATIONFirst, the theoritical framework and numerical methods de-
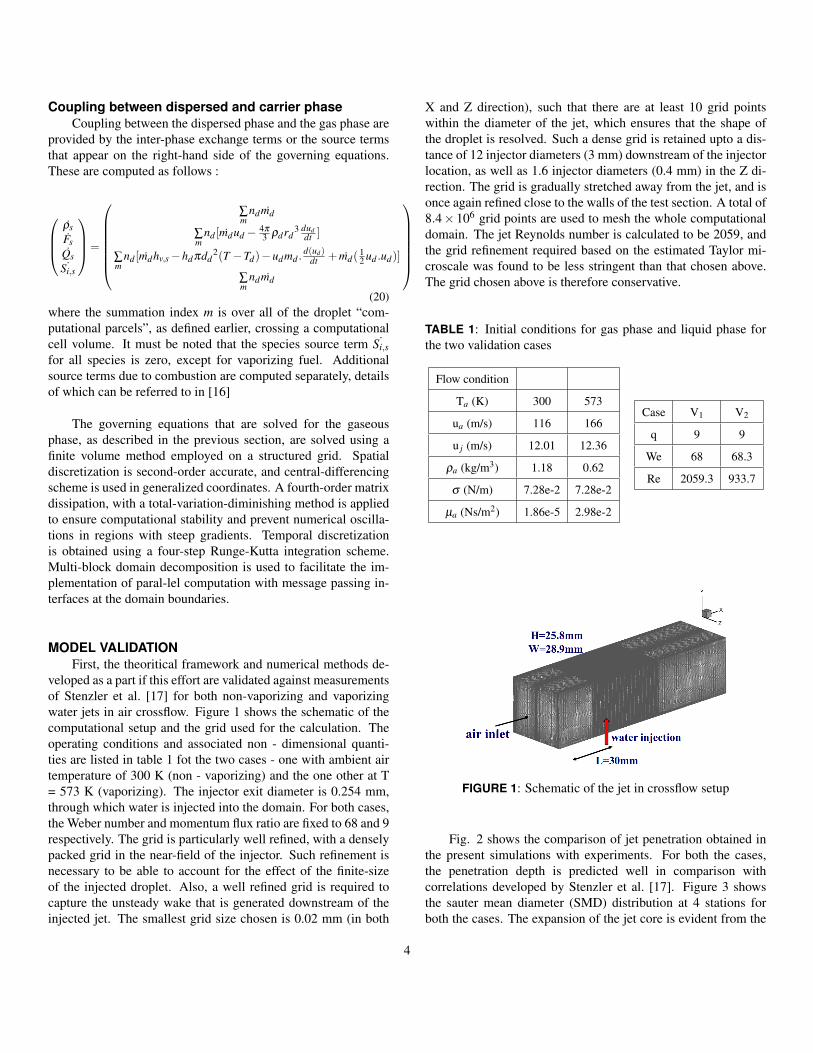
veloped as a part if this effort are validated against measurementsof Stenzler et al. [17] for both non-vaporizing and vaporizingwater jets in air crossflow. Figure 1 shows the schematic of thecomputational setup and the grid used for the calculation. Theoperating conditions and associated non - dimensional quanti-ties are listed in table 1 fot the two cases - one with ambient airtemperature of 300 K (non - vaporizing) and the one other at T= 573 K (vaporizing). The injector exit diameter is 0.254 mm,through which water is injected into the domain. For both cases,the Weber number and momentum flux ratio are fixed to 68 and 9respectively. The grid is particularly well refined, with a denselypacked grid in the near-field of the injector. Such refinement isnecessary to be able to account for the effect of the finite-sizeof the injected droplet. Also, a well refined grid is required tocapture the unsteady wake that is generated downstream of theinjected jet. The smallest grid size chosen is 0.02 mm (in both
X and Z direction), such that there are at least 10 grid pointswithin the diameter of the jet, which ensures that the shape ofthe droplet is resolved. Such a dense grid is retained upto a dis-tance of 12 injector diameters (3 mm) downstream of the injectorlocation, as well as 1.6 injector diameters (0.4 mm) in the Z di-rection. The grid is gradually stretched away from the jet, and isonce again refined close to the walls of the test section. A total of8.4× 106 grid points are used to mesh the whole computationaldomain. The jet Reynolds number is calculated to be 2059, andthe grid refinement required based on the estimated Taylor mi-croscale was found to be less stringent than that chosen above.The grid chosen above is therefore conservative.
TABLE 1: Initial conditions for gas phase and liquid phase forthe two validation cases
Flow condition
Ta (K) 300 573
ua (m/s) 116 166
u j (m/s) 12.01 12.36
ρa (kg/m3) 1.18 0.62
σ (N/m) 7.28e-2 7.28e-2
µa (Ns/m2) 1.86e-5 2.98e-2
Case V1 V2
q 9 9
We 68 68.3
Re 2059.3 933.7
FIGURE 1: Schematic of the jet in crossflow setup
Fig. 2 shows the comparison of jet penetration obtained inthe present simulations with experiments. For both the cases,the penetration depth is predicted well in comparison withcorrelations developed by Stenzler et al. [17]. Figure 3 showsthe sauter mean diameter (SMD) distribution at 4 stations forboth the cases. The expansion of the jet core is evident from the
4

0 0.01 0.02 0.03 0.04 0.05 0.06 0.07
x distance (m)
0
0.005
0.01
0.015
0.02
Pen
etra
tion d
epth
(m
)
Stenzler et. al.CFD
(a) Ta = 300K
0 0.01 0.02 0.03 0.04 0.05 0.06 0.07
x distance (m)
0
0.005
0.01
0.015
0.02
Pen
etra
tio
n d
epth
(m
)
Stenzler et. al.CFD
(b) Ta = 573K
FIGURE 2: Comparison of predicted jet penetration with experimental correlations
(a) x = 1 mm (b) x = 9 mm (c) x = 18 mm (d) x = 25.4 mm
FIGURE 3: SMD distribution on the y-z plane at progressive streamwise locations showing the development of the spray field at Ta =300 K.
FIGURE 4: An instantaneous contour of Y - vorticity showingthe presence of strong unseady wake vortices downstream of thejet
increasing area over which the droplets are distributed movingdownstream. The largest droplets (55 - 65 µm) appear to beconcentrated at the edges in the upper region of the jet, withmid-sized droplets distributed (35 - 55 µm) largely present at thecenter of the jet core. Relatively smaller droplets are distributedcloser at the bottom.
Fig 5 shows the comparison of the SMD distribution for
(a) experiment (b) present calculation
FIGURE 5: Comparison of SMD distribution for case V1, atx=25.4 mm from the inlet
this case at x = 25.4 mm with experimental observations madeby Stenzler et.al. [17]. The trends and the global droplet sizedistribution are in good agreement. One significant deviationseen in the present results, in comparison with experiments isthat while larger sized droplets are present in the center of the jetcore, the present simulation predicts these droplets to be presentmostly close to the upper edge of the jet core. While carryingout the simulations, it was noted that capturing the wake shedbehind the injected jet was critical for correctly estimating thespreading of the jet, and hence the droplet distribution. Fig 4shows an instantaneous vorticity contour, that clearly shows thecounter-rotating wake vortices shed downstream of the jet.
5
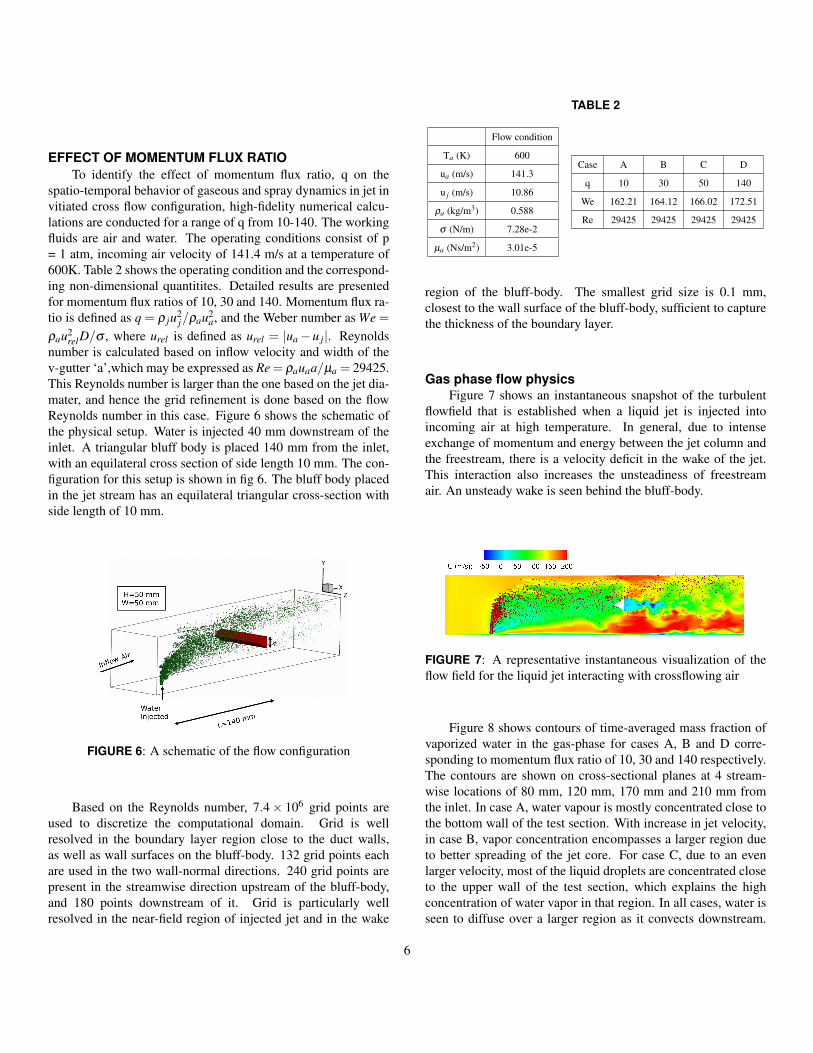
EFFECT OF MOMENTUM FLUX RATIOTo identify the effect of momentum flux ratio, q on the
spatio-temporal behavior of gaseous and spray dynamics in jet invitiated cross flow configuration, high-fidelity numerical calcu-lations are conducted for a range of q from 10-140. The workingfluids are air and water. The operating conditions consist of p= 1 atm, incoming air velocity of 141.4 m/s at a temperature of600K. Table 2 shows the operating condition and the correspond-ing non-dimensional quantitites. Detailed results are presentedfor momentum flux ratios of 10, 30 and 140. Momentum flux ra-tio is defined as q = ρ ju2
j/ρau2a, and the Weber number as We =
ρau2relD/σ , where urel is defined as urel = |ua−u j|. Reynolds
number is calculated based on inflow velocity and width of thev-gutter ‘a’,which may be expressed as Re = ρauaa/µa = 29425.This Reynolds number is larger than the one based on the jet dia-mater, and hence the grid refinement is done based on the flowReynolds number in this case. Figure 6 shows the schematic ofthe physical setup. Water is injected 40 mm downstream of theinlet. A triangular bluff body is placed 140 mm from the inlet,with an equilateral cross section of side length 10 mm. The con-figuration for this setup is shown in fig 6. The bluff body placedin the jet stream has an equilateral triangular cross-section withside length of 10 mm.
FIGURE 6: A schematic of the flow configuration
Based on the Reynolds number, 7.4× 10⁶ grid points areused to discretize the computational domain. Grid is wellresolved in the boundary layer region close to the duct walls,as well as wall surfaces on the bluff-body. 132 grid points eachare used in the two wall-normal directions. 240 grid points arepresent in the streamwise direction upstream of the bluff-body,and 180 points downstream of it. Grid is particularly wellresolved in the near-field region of injected jet and in the wake
TABLE 2
Flow condition
Ta (K) 600
ua (m/s) 141.3
u j (m/s) 10.86
ρa (kg/m3) 0.588
σ (N/m) 7.28e-2
µa (Ns/m2) 3.01e-5
Case A B C D
q 10 30 50 140
We 162.21 164.12 166.02 172.51
Re 29425 29425 29425 29425
region of the bluff-body. The smallest grid size is 0.1 mm,closest to the wall surface of the bluff-body, sufficient to capturethe thickness of the boundary layer.
Gas phase flow physicsFigure 7 shows an instantaneous snapshot of the turbulent
flowfield that is established when a liquid jet is injected intoincoming air at high temperature. In general, due to intenseexchange of momentum and energy between the jet column andthe freestream, there is a velocity deficit in the wake of the jet.This interaction also increases the unsteadiness of freestreamair. An unsteady wake is seen behind the bluff-body.
FIGURE 7: A representative instantaneous visualization of theflow field for the liquid jet interacting with crossflowing air
Figure 8 shows contours of time-averaged mass fraction ofvaporized water in the gas-phase for cases A, B and D corre-sponding to momentum flux ratio of 10, 30 and 140 respectively.The contours are shown on cross-sectional planes at 4 stream-wise locations of 80 mm, 120 mm, 170 mm and 210 mm fromthe inlet. In case A, water vapour is mostly concentrated close tothe bottom wall of the test section. With increase in jet velocity,in case B, vapor concentration encompasses a larger region dueto better spreading of the jet core. For case C, due to an evenlarger velocity, most of the liquid droplets are concentrated closeto the upper wall of the test section, which explains the highconcentration of water vapor in that region. In all cases, water isseen to diffuse over a larger region as it convects downstream.
6

0 0.005 0.01 0.015 0.02H
2O mass fraction
0
0.01
0.02
0.03
0.04
0.05
y (
mm
)
x = 80mmx = 120mmx = 170mmx= 210mm
(a) case A, q = 10
0 0.005 0.01 0.015 0.02H
2O mass fraction
0
0.01
0.02
0.03
0.04
0.05
y (
mm
)
x = 80mmx = 120mmx = 170mmx= 210mm
(b) case B, q = 30
0 0.005 0.01 0.015 0.02H
2O mass fraction
0
0.01
0.02
0.03
0.04
0.05
y (
mm
)
x = 80mmx = 120mmx = 170mmx= 210mm
(c) case D, q = 140
FIGURE 8: Contours of time - averaged mass fraction of vaporized H2O in the gas phase, and plots showing the trend in its variation forthe corresponding cases at streamwise locations x = 80 mm, x = 120 mm, x = 170 mm and x = 210 mm.
These trends are more apparent in figure 9 that shows profilesof water vapor mass fraction at the mid-plane (z = 25 mm) atdifferent streamwise locations.
Figure 9 shows contours of streamwise velocity for the threecases considered here. Once again, contours are shown at thesame streamwise locations as before, namely x = 80 mm, 120
mm, 170 mm and 210 mm. Contours at stations x = 80 mm andx = 120 mm clearly show momentum deficit for air in the wake ofthe liquid jet in all cases. Profiles of average streamwise veloc-ity at these stations confirm the observation. However, velocitycontour in the wake of the V-gutter (x = 170 mm) looks differentfor case B compared to other cases, and shows a larger velocitydeficit away from the mid - plane in z direction. To investigate
7

0 0.5 1 1.5 2U/U
o
0
0.01
0.02
0.03
0.04
0.05
y (
m)
x = 80 mmx = 120 mmx = 170 mmx= 210 mm
(a) case A, q = 10
0 0.5 1 1.5 2U/U
o
0
0.01
0.02
0.03
0.04
0.05
y (
m)
x = 80 mmx = 120 mmx = 170 mmx= 210 mm
(d) case B, q = 30
(b) case B, q = 30
0 0.5 1 1.5 2U/U
o
0
0.01
0.02
0.03
0.04
0.05
y (
m)
x = 80 mmx = 120 mmx = 170 mmx= 210 mm
(c) case D, q = 140
FIGURE 9: Contours of time - averaged streamwise velocity, and plots showing the trend in its variation for the corresponding cases atstreamwise locations x = 80 mm, x = 120 mm, x = 170 mm and x = 210 mm.
this aspect further, variation of streamwise velocity from the bot-tom to top wall at a section 10 mm from the side wall is shownin figure 10 (a) (z = 10 mm). A large velocity deficit at the center(y = 25 mm) for case B indicates the presence of a stronger wakebehind the bluff-body compared to other cases. Larger magni-
tude of normal velocity, as seen in figure 10 (b) also suggests thepresence of a highly unsteady wake for case B. Finally, figure10 (c), shows high vorticity content for case B, further providingevidence for the presence of a strong wake. A strong wake forcase B may be attributed to the influence of dispersed droplets.
8

0 0.5 1 1.5U/U
o
0
0.01
0.02
0.03
0.04
0.05
y (
m)
Case A : q = 10
Case B : q = 30
Case D : q = 140
0 0.05 0.1 0.15 0.2 0.25|V|/U
o
0
0.01
0.02
0.03
0.04
0.05
y (
m)
Case A : q = 10Case B : q = 30Case D : q = 140
0 10000 20000 30000|ω|(1/s)
0
0.01
0.02
0.03
0.04
0.05
y (
m)
Case A : q = 10Case B : q = 30Case D : q = 140
FIGURE 10: Plots of (a) streamwise velocity (b) magnitude of normal velocity and (c) vorticity magnitude at a location behind the bluffbody (x = 170 mm) and 10 mm away from the side wall (z = 10 mm) indicating presence of a stronger wake for case B as compared toother cases.
20 30 40 50 60 70SMD(µm)
0
0.01
0.02
0.03
0.04
0.05
y (
m)
x = 80 mmx = 100 mmx = 120 mm
(a) case A, q = 10
20 30 40 50 60 70SMD(µm)
0
0.01
0.02
0.03
0.04
0.05
y (
m)
x = 80 mmx = 100 mmx = 120 mm
(b) case B, q = 30
20 30 40 50 60 70SMD(µm)
0.01
0.02
0.03
0.04
0.05
y (
m)
x = 80 mmx = 100 mmx = 120 mm
(c) case D, q = 140
FIGURE 11: Plots of variation of sauter mean diamater for cases A, B and D at three sample streamwise locations.
0 20 40 60 80 100 120 140Momentum flux ratio (q)
40
45
50
55
60
SM
D (
µm
)
(a) Sauter Mean Diameter (SMD) vs q
0 20 40 60 80 100 120 140Momentum flux ratio (q)
7
8
9
10
11
12
ST
D (
µm
)
(b) Standard Deviation(STD) vs q
FIGURE 12: Plots of variation of global droplet sizes and standard deviation of the sizes with increasing momentum flux ratio show ageneral declining trend.
The core of the jet, which is mostly concentrated in themiddle of the test section, constricts the effective area availablefor passage of air, thus causing flow acceleration. The increasedair velocity leads to a stronger wake behind the bluff-body.While this effect may be expected for other cases as well, thecore of the jet is either concentrated closer to the bottom wall or
the top wall of the test section, far enough from the bluff-body,thus reducing its prominence.
9

Spray dynamics and droplet statisticsNext, droplet size distributions are compared for the cases
A, B and D. Variation of the sauter mean diameter (SMD) fromthe bottom to the top wall of the test section are presented atthree streamwise locations on the mid plane (z = 25 mm) namely,x = 80 mm, x = 100 mm and x = 120 mm from the inflow plane.In figure 11, for case A, droplet sizes seem to vary from 40µmto 70µm. From the bottom to top of the section, a significantnon-uniformity in droplet sizes is observed, with the largestdroplets present close to 20 mm from the bottom wall. In case B,the SMD increases monotonically, from bottom to the top. Forcase D, the SMD is distributed more uniformly. With increase injet velocity, the exposure of the jet to freestream air increases,leading to a more uniform atomization. This explains the trendof increasing uniformity in droplet sizes with an increase in jetvelocity.
Figure 12 (a) shows the global SMD (computed from 60mm to 100 mm downstream of the location of the injector)at each of the cases of momentum flux ratio. A generallydeclining trend is observed. Such a trend of declining dropletsize with increased jet velocity was also observed by Amighiet. al [2]. It was observed in the simulations that with in-creasing momentum flux ratio, a larger percentage of dropletsunderwent secondary atomization, thus causing the meandiameter to reduce. This can also be interpreted as an improveduniformity in atomization. A declining standard deviation ofdroplet size with increase in momentum flux ratio, as seen infigure 12 (b) is a statistical evidence to further support this claim.
CONCLUSIONHigh fidelity simulations were conducted to analyse the
effect of momentum flux ratio on the gaseous and spray dy-namics of water jet injection in hot crossflowing air, with av-gutter bluff-body placed downstream. For all the cases, theReynolds number was fixed at 29425, while the Weber numberand momentum flux ratio was varied from 162.2 - 172.5 and 10- 140 respectively.
Mean contours of vapor fraction of water, as well assreamwise velocity were shown at select streamwise stationsfor increasing momentum flux ratio. While a velocity deficitwas observed in the wake of the spray field in all cases, thewake behind the v-gutter was more enhanced for the case of q= 30. This was due to the presence of the jet core close to thebluff body, thus causing air to accelerate within the constrictedpassage, and leading to an enhanced wake.
With increasing momentum flux ratio, the droplet size dis-tribution was observed to vary more uniformly. Also, a grad-
ual drop in the mean droplet size was observed with increase inmomentum flux ratio. It was explained that with an increase inmomentum flux ratio, the liquid jet was exposed to freestreamair better, over a larger surface area, and thus promoting an en-hanced breakup and atomization of the jet column, leading touniform mixing as well as smaller droplet sizes.
REFERENCES[1] Wu, P.-K., Kirkendall, K. A., Fuller, R. P., and Nejad,
A. S., 1997. “Breakup Processes of Liquid Jets in SubsonicCrossflows”. Journal of Propulsion and Power, 13(1),pp. 64–73.
[2] Amighi, A., and Ashgriz, N., 2018. “Global Droplet Sizein Liquid Jet in a High Temperature and High PressureCross Flow”. In 2018 AIAA Aerospace Sciences Meeting,no. January, American Institute of Aeronautics and Astro-nautics, pp. 1–17.
[3] Tambe, S., Jeng, S.-M., Mongia, H., and Hsiao, G.,2005. “Liquid Jets in Subsonic Crossflow”. In 43rdAIAA Aerospace Sciences Meeting and Exhibit, no. Jan-uary, American Institute of Aeronautics and Astronautics,pp. 1–12.
[4] Kihm, J. D., Lyn, G. M., and Son, S. Y., 1995. “Atomiza-tion of cross-injecting sprays into convective air stream”.Atomization and Sprays, 5, pp. 417–433.
[5] Becker, J., and Hassa, C., 2002. “Breakup and atomizationof a kerosene jet in crossflow at elevated pressure”. Atom-ization and Sprays, 12, pp. 49–67.
[6] Oh, J., Lee, J. G., and Lee, W., 2013. “Vaporization of aliquid hexanes jet in cross flow”. International Journal ofMultiphase Flow, 57, dec, pp. 151–158.
[7] Brandt, M., Rachner, M., and Schmitz, G., 1998. “An Ex-perimental and Numerical Study of Kerosine Spray Evap-oration in a Premix Duct for Gas Turbine Combustorsat High Pressure”. Combustion Science and Technology,138(1-6), sep, pp. 313–348.
[8] Liu, A. B., Mather, D., and Reitz, R. D., 1993. Modelingthe effects of drop drag and breakup on fuel sprays. Saetechnical paper, Mar.
[9] Madabhushi, R. K., Leong, M. Y., and Hautman, D. J.,2004. “Simulation of the Break-Up of a Liquid Jet in Cross-flow at Atmospheric Conditions”. In Volume 1: TurboExpo 2004, ASME, pp. 697–704.
[10] Erlebacher, G; Hussaini, M. Y.; Speziale, C. G.; Zang,T. A., 1992. “Toward the Large-Eddy Simulation of Com-pressible Turbulent Flows”. Journal of Fluid Mechanics,238, pp. 155–185.
[11] Faeth, G. M., 1983. “Evaporation and combustion ofsprays”. Progress in Energy and Combustion Science, 9(1-2), pp. 1–76.
[12] Reitz, R. D., 1987. “Modeling atomization processes in
10

high-pressure vaporizing sprays”. Atomization and SprayTechnology, 3, pp. 309–337.
[13] O’Rourke, P., and Amsden, A., 1987. The tab method fornumerical calculation of spray droplet breakup. Sae techni-cal paper 872089, Nov.
[14] Khare, P., Wang, S., and Yang, V., 2015. “Modeling offinite-size droplets and particles in multiphase flows”. Chi-nese Journal of Aeronautics, 28(4), pp. 974–982.
[15] Mundo, C., Sommerfeld, M., and Tropea, C., 1995.“Droplet-wall collisions: Experimental studies of the de-formation and breakup process”. International Journal ofMultiphase Flow, 21(2), pp. 151–173.
[16] Kamin, M., and Khare, P. Combustion of kerosene jet in-jected into crossflowing air. under preparation.
[17] Stenzler, J. N., Lee, J. G., Santavicca, D. A., and Lee, W.,2006. “Penetration of Liquid Jets in a Cross-Flow”. Atom-ization and Sprays, 16(8), pp. 887–906.
11