Liquid chromatography-mass spectrometry/mass spectrometry ... · spectrometry/mass spectrometry...
30
1 Liquid chromatography-mass spectrometry/mass spectrometry method development for drug metabolism studies: examining lipid matrix ionization effects in plasma James L. Little, Michael F. Wempe, and Charles M. Buchanan Eastman Chemical Company, Building 150 Kingsport, TN 37662-5150, USA Correspondence: James Little, Tel: 423-229-8685 Fax: 423-229-4558
Transcript of Liquid chromatography-mass spectrometry/mass spectrometry ... · spectrometry/mass spectrometry...
1
Liquid chromatography-mass spectrometry/mass spectrometry method development for drug metabolism studies: examining lipid matrix ionization
effects in plasma
James L. Little, Michael F. Wempe, and Charles M. Buchanan
Eastman Chemical Company, Building 150 Kingsport, TN 37662-5150, USA
Correspondence: James Little, Tel: 423-229-8685 Fax: 423-229-4558
2
Abstract
Glycerophosphocholines (GPCho's) are known to cause liquid chromatography-mass spectrometry/mass spectrometry (LC-MS/MS) matrix ionization effects during the analysis of biological samples (i.e. blood, plasma). We have developed a convenient new method, which we refer to as "in-source multiple reaction monitoring" (IS-MRM), for detecting GPCho's during LC-MS/MS method development. The approach uses high energy in-source collisionally induced dissociation (CID) to yield trimethylammonium-ethyl phosphate ions (m/z 184), which are formed from mono- and disubstituted GPCho's. The resulting ion is selected by the first quadrupole (Q1), passed through the collision cell (Q2) in the presence of collision gas at low energy to minimize fragmentation, and m/z 184 selected by the third quadrupole. This approach can be combined with standard multiple reaction monitoring (MRM) transitions with little compromise in sensitivity during method development and sample analysis. Hence, this approach was used to probe ionization matrix effects in plasma samples. The resulting information was employed to develop LC-MS/MS analyses for drugs and their metabolites with cycle times less than 5 minutes.
3
Table of Contents 1. Introduction 2. Experimental 2.1. Standards and reagents 2.2. Analytical equipment and instrumentation 2.3. Preparation of plasma samples for LC-MS/MS analyses 2.4. Parameters for IS-MRM mass spectrometry experiment 2.5. Standard gradient method for the analysis of tamoxifen and its metabolites
2.6. Steady-state gradient method for the analysis of tamoxifen and its metabolites without elution of GPCho's 2.7. Steady-state isocratic method for the analysis of tamoxifen and its
metabolites without elution of GPCho's 2.8. Standard gradient method for the analysis of itraconazole and its metabolite 2.9. Steady-state isocratic method for the analysis of itraconazole without elution of GPCho's
3. Results and Discussion 3.1. Monitoring choline-containing phospholipids via IS-MRM
3.2. Detecting other phospholipids in plasma 3.3. Analyses of plasma from different species with IS-MRM 3.4. Standard gradient method development using IS-MRM experiment 3.5. Steady-state gradient method without elution of lipids 3.6. Isocratic steady-state method example without elution of lipids 3.7. Isocratic steady-state method using stable-isotope-labeled IS without elution of lipids
4. Conclusions 5. Acknowledgements 6. References
4
1. Introduction Offering very high selectivity and sensitivity, liquid chromatography-mass spectrometry/mass spectrometry (LC-MS/MS) is the preferred method for drug metabolism studies. However, matrix effects may lead to significant analytical errors [1]. The Guidance for Industry on Bioanalytical Method Validation [2] states that "In the case of LC-MS and LC-MS/MS based procedures, matrix effects should be investigated to ensure that precision, selectivity, and sensitivity will not be compromised." The specific methods to evaluate matrix effects are not specified; the approaches to expose matrix effects are left to the discretion of the investigator. In this regard, many researchers have described methods to probe and/or control matrix effects [1, 3-15].
Phospholipids are extremely abundant in biological membranes [16] and are formed from glycerol (phosphoglycerides) or sphingosine (sphingomyelins). Phosphoglycerides are composed of glycerol, one or two fatty acid ester chains, and a phosphorylated alcohol; whereas sphingomyelin is composed of sphingosine, an amide linked fatty acid, and a phosphatidyl choline. The glycerophosphocholines (GPCho's) constitute the major phospholipids in plasma [17-18] and are known to cause significant LC-MS/MS matrix ionization effects [1, 6-8] in the positive ion electrospray mode (+ ESI). The glycerine group in these GPCho's can be either 1-mono (2-lyso) or 1,2-disubstituted (diradyl). The 1,2-disubstituted GPCho (phosphatidylcholine) is commonly referred to as lecithin.
We have developed a new approach [19], which we refer to as "in-source
multiple reaction monitoring" (IS-MRM) for monitoring GPCho's. Our method simultaneously monitors all GPCho's using only one channel in an MRM LC-MS/MS experiment. A similar approach can be employed in selected ion recording mode utilizing a single quadrupole mass spectrometer. Thus, this approach is conveniently employed to develop LC-MS/MS or LC-MS methods for the analysis of drugs and/or drug metabolites in protein precipitated plasma samples that avoid deleterious matrix ionization effects from GPCho's. However, there are a variety of other exogenous and endogenous chemical species in plasma samples that yield matrix ionization effects and require additional strategies for evaluation [1]. 2. Experimental 2.1. Standards and reagents
Tamoxifen (>99%) and itraconazole (≥98%) standards were obtained from Apin Chemicals, Ltd (Abingdon, Oxon, UK). Diphenhydramine hydrochloride (≥98%) and 4-hydroxytamoxifen (98% Z-isomer, remainder primarily E-isomer) standards were acquired from Sigma-Aldrich (St. Louis, MO, USA). N-desmethyltamoxifen (>98%) was obtained from Toronto Research Chemicals, Inc (North York, Ontario, Canada). Itraconazole-d3 (97.8%) and hydroxyitraconazole (98.6%) were acquired from SynFine Research, Inc (Richmond Hill, Ontario, Canada). GPCho's, GPEtn's, and GPSer's standards were purchased from Avanti Polar Lipids, Inc (Alabaster, AL, USA). Xanax
5
(99%, Alprazolam) was obtained as a methanol (MeOH) solution from Cerilliant (Round Rock, TX, USA).
Pooled gender plasma samples – mouse (CD-1); rat (Sprague-Dawley, Fischer 344, and Hanover-Wistar); New Zealand rabbit; dog (beagle); cynomolgous monkey; and human – were obtained from Bioreclamation, Inc (Hicksville, NY, USA). Because the anticoagulant can affect analyte recoveries [20], anticoagulants in the plasma for the pharmacokinetic (PK) studies matched those employed in the rat studies. Tri-potassium and tri-sodium EDTA (ethylenediaminetetraacetic acid) were used for the tamoxifen and itraconazole studies, respectively.
HPLC grade solvents including isopropanol (IPA), MeOH, and acetonitrile (ACN) were obtained from Burdick and Jackson (B&J Brand, High Purity Solvent, Muskegon, MI, USA). Water was purified in-house using a Millipore water purification system. Formic acid (88%) was purchased from J. T. Baker (Phillipsburg, NJ, USA). Ammonium formate (99.995%+) was purchased from Sigma-Aldrich (St. Louis, MO). 2.2. Analytical equipment and instrumentation
A Waters LC-MS/MS system included a Quattro Micro triple quadrupole mass spectrometer and an Acquity UPLC (Ultra Performance LC) System (Milford, MA, USA). All method development and sample analyses were conducted using the Waters system. The Applied Biosystems instrumentation (Foster City, CA, USA) included a 4000 Q TRAP mass spectrometer and a PEAK Scientific gas generator (Bedford, MA, USA). A Heraeus Labofuge 400R centrifuge (VWR, West Chester, PA, USA) and an Eppendorf Thermomixer R vortexer (Hamburg, Germany) were used to prepare the rat PK plasma samples for LC-MS/MS analyses. 2.3. Preparation of plasma samples for LC-MS/MS analyses
The methods for preparing rat plasma calibration standards (calibrators) and study samples are briefly described within this paper. A very detailed method description may be found in the literature [21]. Shown to be optimal for protein precipitation [10], the method used 2.5:1 organic solvent:plasma. All solvent ratios are volume:volume.
Plasma samples from PK studies (100 µL) were mixed with 2:1 ACN:water (25
µL) in a 96-well plate and vortexed at 800 rpm (4 min). Proteins were precipitated by adding ACN (250 µL) containing internal standard (IS), diphenhydramine hydrochloride (20 ng/mL) and vortexed at 800 rpm (4 min). Samples were centrifuged at 1509 x g for 10 min. The calibrators were prepared in a similar manner, addition of 25 µL working standard solutions in 2:1 ACN:water to blank plasma (100 µL) purchased from Bioreclamation, Inc. The resulting solutions were handled in the same manner as the study samples. All operations were performed at room temperature. The plasma supernatants were directly analyzed using an autosampler syringe collecting above the protein pellet.
6
The itraconazole sample preparation was very similar to that employed for the
tamoxifen study. Itraconazole is more soluble in a 50:50 mixture of ACN:MeOH. Therefore, a 25 µL mixture of 1:1:1 of ACN:MeOH:water was used in the first step for preparation of samples and calibrators. Then a 250 µL mixture of 50:50 ACN:MeOH containing 100 ng/mL of IS (itraconazole-d3) was used for protein precipitation. A different response was noted for hydroxyitraconazole in the Bioreclamation plasma versus the blank rat plasma from the PK study. This matrix effect was mitigated by the dilution [1] of the study samples (25 µL) with Bioreclamation plasma (75 µL). 2.4. Parameters for IS-MRM mass spectrometry experiment
The IS-MRM parameters were optimized using GPCho standards from Avanti Polar Lipids, Inc. However, comparable results are obtained employing supernatants from a protein precipitated plasma sample. The GPCho responses at 100% organic eluent (0.4 mL/min) were significantly enhanced by the post-column addition of buffered aqueous eluent (10 µL/min).
The primary method for simultaneously detecting all GPCho's on the Quattro
Micro triple quadrupole mass spectrometer employed a cone voltage of 90 volts and collision energy of 7 volts. The mass transition of m/z 184 184 was monitored in the positive ion electrospray mode with dwell and interscan delay times of 0.05 and 0.03 sec, respectively. Similar voltages were employed for monitoring the 2-lyso-GPCho's using the m/z 104 104 transition. The collision gas (argon) was set at 3 x 10⁻³ torr.
The primary method for simultaneously detecting all GPCho's on the Applied Biosystems 4000 Q TRAP employed a declustering potential, entrance potential, collision energy, and collision cell exit potential of 165, 10, 7, and 5 volts, respectively. The mass transition of m/z 184 184 was monitored in the positive ion electrospray mode. Similar parameters were employed for monitoring 2-lyso GPCho's via the m/z 104 104 transition. The collision gas (nitrogen) pressure was set to medium. 2.5. Standard gradient method for the analysis of tamoxifen and its metabolites
The samples were analyzed on the Waters Quattro Micro system using positive ion electrospray ionization in the MRM mode. The argon collision gas was set at 3 x 10⁻³ torr. The following MRM transitions were monitored: m/z 256 167, m/z 388 72, m/z 372 72 and m/z 358 58 for diphenhydramine hydrochloride (IS), 4-hydroxytamoxifen, tamoxifen, and desmethyltamoxifen, respectively. The calibration data was fit to a 1/x2 weighted linear regression with ten standard concentrations from 0.5 to 1000 ng/mL. All quantitative data processing was performed with Waters QuanLynx software.
The LC separations were performed with a precolumn (Varian, MetaGuard) coupled to an analytical column (Varian, MonoChrom C18, 3 micron, 50 x 2.0 mm). The same analytical column was employed for all sample analyses, but the precolumn was excluded in many methods due to problems with product consistency. The MonoChrom
7
column was found to yield good retention of basic drugs and excellent peak shape [22]. A stainless steel frit (0.5 micron) was placed before the precolumn in a stainless steel holder and changed after ca. 100-200 injections when the column backpressure increased ca. 100 psi. Solvent A was a mixture of aqueous ammonium formate (1000 mL; 10 mM, pH adjusted to ca. 4.5 with ca. 10 µL of formic acid) and MeOH (30 mL). The pH adjustment was critical for the separation of tamoxifen from desmethyltamoxifen. Solvent B was MeOH. The column temperature was 40 °C, the sample temperature was 4 °C, and the injection volume was 5 µL.
The following linear gradient was used for the separation: 80% A for 0.2 min, 0.4 mL/min; 50% A at 0.3 min, 0.4 mL/min; 0% A at 1.3 min, 0.4 mL/min; 0% A at 1.9 min, 1.2 mL/min; 0% A at 3.51 min, 1.2 mL/min; 80% A at 3.52 min, 0.8 mL/min; 80% A at 4.0 min, 0.8 mL/min; and 80% A at 4.01 min, 0.4 mL/min. The elution times for diphenhydramine, tamoxifen, 4-hydroxytamoxifen, and desmethyltamoxifen were 1.19, 1.73, 1.47, and 1.63 min, respectively. The solvent flow was diverted from the mass spectrometer before 1.0 min and after 1.9 min. The strong autosampler solvent [23] wash (0.5 mL) was a 1:1:1:1 mixture of ACN:MeOH:IPA:water containing 1% formic acid. The weak solvent (0.5 mL) was a mixture of 75:12.5:12.5 water:MeOH:ACN. Columns were cleaned after 300-500 protein precipitated plasma supernatant injections by backflushing with 10 column volumes of 1% formic acid in water and 10 column volumes of 1% formic acid in MeOH. The columns were then washed in the normal direction of flow with 10 column volumes of MeOH. 2.6. Steady-state gradient method for the analysis of tamoxifen and its metabolites without elution of GPCho's
Many conditions employed were the same as those in Section 2.5. An additional IS-MRM transition was added to the MRM sequence for m/z 184 184 and the gradient HPLC method was modified. The following linear gradient was used for the separation: 80% A for 0.2 min, 0.4 mL/min; 50% A at 0.3 min, 0.4 mL/min; 0% A at 1.3 min, 0.4 mL/min; 0% A at 1.8 min, 0.4 mL/min; 80%A at 1.81 min, 0.8 mL/min; 80% A at 2.25 min, 0.8 mL/min; and 80% A at 2.26 min, 0.4 mL/min. Analyte elution times were the same as those noted in Section 2.5. 2.7. Steady-state isocratic method for the analysis of tamoxifen and its metabolites without elution of GPCho's
Many conditions used were the same as those in Section 2.5. An additional IS-MRM transition was added to the MRM sequence for m/z 184 184 and the HPLC method was modified. The isocratic method used 25% solvent A with a total acquisition time of 1.5 min. The elution times for IS, tamoxifen, 4-hydroxytamoxifen, and desmethyltamoxifen were 0.58, 1.60, 0.85, and 1.24 min, respectively. 2.8. Standard gradient method for the analysis of itraconazole and its metabolite
8
Many conditions used were the same as those in Section 2.5. The following MRM transitions were monitored: m/z 705 392, m/z 708 395, and m/z 721 408 for itraconazole, itraconazole-d3 (IS), and hydroxyitraconazole. Because itraconazole-d3 response varied with the itraconazole response [24], the hydroxyitraconazole concentrations were determined by external standard. The calibration data was fit to a 1/x2 quadratic regression with ten standard concentrations from 2.5 to 1500 ng/mL.
Solvent A was a mixture of aqueous ammonium formate (1000 mL; 10 mM, pH adjusted to ca. 3.5 with ca. 0.6 mL of formic acid) and 50:50 MeOH:ACN (30 mL). Solvent B was a mixture of 50:50 MeOH:ACN. The column temperature was 50 °C, the sample temperature was 4 °C, and the injection volume was 5 µL.
The following linear gradient was employed for the separation: 70% A for 0.2 min, 0.4 mL/min; 25% A at 0.3 min, 0.4 mL/min; 17% A at 1.7 min, 0.4 mL/min; 17% A at 2.1 min, 0.4 mL/min; 0% A at 2.2 min, 1.6 mL/min; 0% A at 3.0 min, 1.6 mL/min; 70% A at 3.01 min, 0.4 mL/min; and 70% A at 4.0 min, 0.4 mL/min. The elution times for itraconazole, itraconazole-d3, and hydroxyitraconazole were 1.45, 1.45, and 1.16 min, respectively. The solvent flow was diverted from the mass spectrometer before 1.0 min and after 1.7 min. 2.9. Steady-state isocratic method for the analysis of itraconazole without elution of GPCho's
Many of the conditions employed were the same as those in Section 2.8. An additional IS-MRM transition was added to the MRM sequence for m/z 184 184. The m/z transition for hydroxyitraconazole was removed, and the gradient HPLC method was modified. The isocratic method used 25% solvent A with a total acquisition time of 1.5 min. The elution times for the itraconazole and itraconazole-d3 were 1.17 min and these components were separated from hydroxyitraconazole. 3. Results and Discussion 3.1. Monitoring choline-containing phospholipids via IS-MRM
As summarized below, there is a wide variety of GPCho's found in plasma (mouse, rat, rabbit, dog, monkey, and human). The lipid alkyl, acyl, and 1-alkenyl ester group chain lengths may vary from 16-22 carbons and contain from 0-6 sites of unsaturation [17, 25]. Consequently, monitoring all ion transitions for these individual components in an MRM experiment is not practical. The large number of required transitions would decrease the method's sensitivity.
9
OP
O-
O
N+
CH3CH3
CH3
O
R
R'
O
O
OP
O-
O
N+
CH3CH3
CH3
O
R
H
O
Om/z 184, +2H
2-lyso GPChoGPChoR = acyl, alkyl, or 1-alkenylR' = acyl
m/z 184, +2H
m/z 104, +H
R = acyl, alkyl, or 1-alkenyl
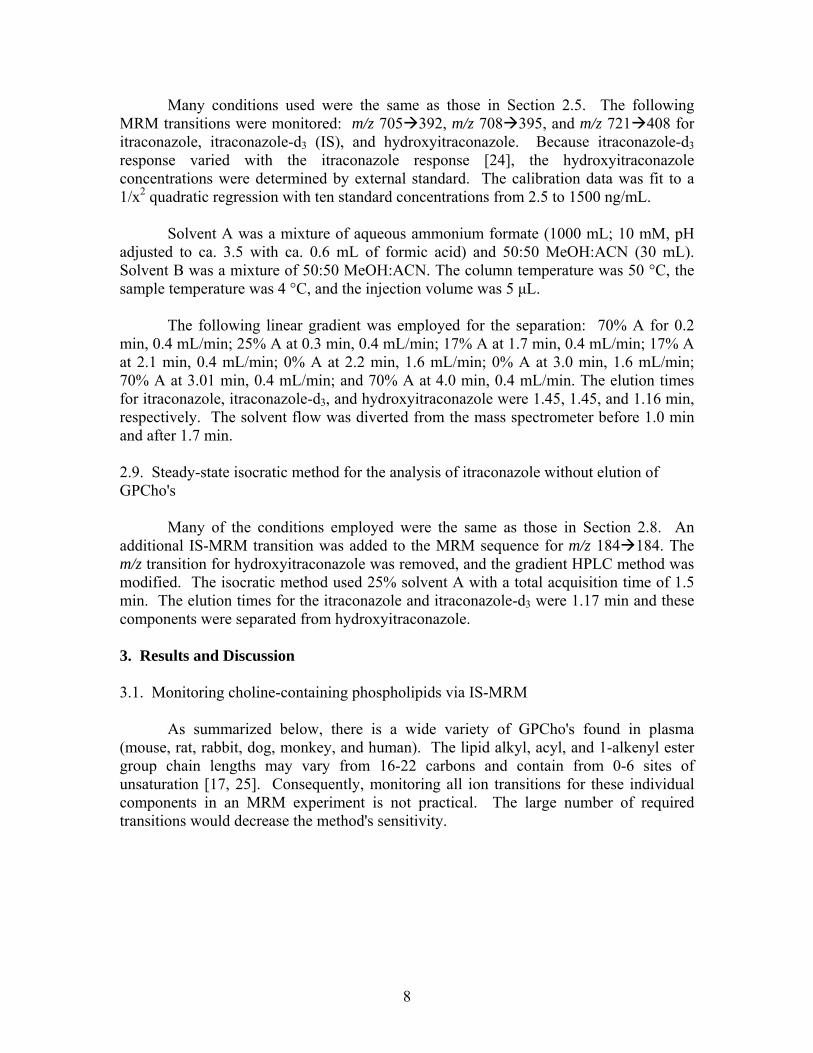
We have developed a method [19] that we call IS-MRM. This MRM approach allows all GPCho's to be monitored by just one transition in an MRM experiment. Our approach utilizes in-source collisionally induced dissociation (CID) to yield a common GPCho fragment ion (trimethylammonium-ethyl phosphate ion; m/z 184). The resulting ion is then selected by quadrupole 1 (Q1), passed at low energy through collision cell (Q2) gas to avoid further fragmentation, and finally selected by quadrupole 3 (Q3). Since only voltage changes are employed, this IS-MRM experiment may be utilized as part of a traditional MRM experiment to monitor drugs and metabolites with insignificant sensitivity loss.
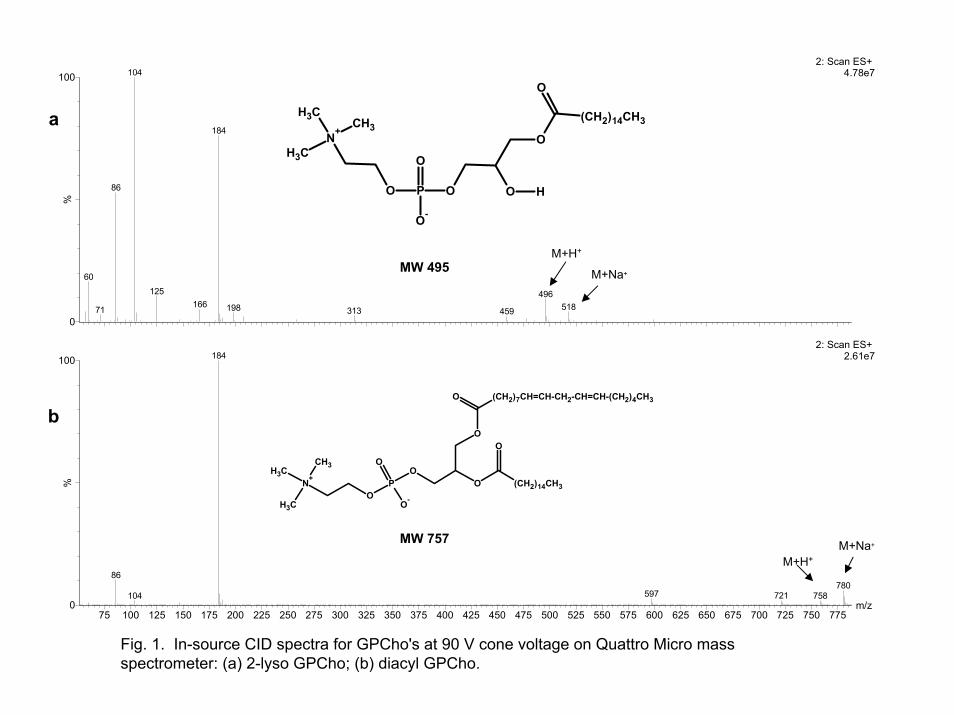
In-source CID [13, 26] is used to obtain fragmentation information in either a single or triple quadrupole mass spectrometer. The fragmentation is accomplished by significantly increasing the voltage in the high pressure region between the sample cone and skimmer in an atmospheric pressure ionization source. The observed fragments are often very similar to those noted in a tandem spectrum obtained in the collision cell, Q2, of a triple quadrupole mass spectrometer. Examples of in-source CID spectra for both a 2-lyso and a diacyl GPCho are shown in Figures 1a and 1b, respectively. In our analyses, the fragment ions observed in the in-source CID spectra for these GPCho's were very similar to those noted in tandem spectra obtained in the triple quadrupole collision cell [25, 27]. As shown in Figures 1a and 1b, the ion at m/z 184 is formed for both species while the ion at m/z 104 was much greater for 2-lyso GPCho's.
This IS-MRM approach was demonstrated using both Waters Quattro Micro and Applied Biosystems 4000 Q TRAP mass spectrometers. Detailed parameters for both instruments are listed in the experimental section. For convenience, only the experimental parameters for the Quattro Micro are discussed in detail in the following paragraphs.
Routinely, using the Quattro Micro electrospray interface in positive ion mode, ion adducts characteristic of the component's molecular weight (MH+) are obtained with a cone (skimmer) voltage between 15-25 volts. A cone voltage of 90 volts is found to yield optimal results for in-source CID fragment ions (m/z 184 and 104). An MRM transition
10
is setup with a cone voltage at 90 volts, Q1 and Q3 were both set to transmit m/z 184, and the collision cell, Q2, was set at 7 volts. The voltage in Q2 is set at a very low voltage to optimize the transmittance of m/z 184 and thus avoid further fragmentation. This voltage is much lower than the 25-60 volts typically used for generating fragment ions in Q2. The argon gas in the collision cell is kept at the same pressure (3 x 10⁻³ torr) used in a standard MRM experiment. The MRM transition for m/z 184 184 is added to MRM's being employed for drug(s) and metabolite(s) during LC-MS/MS method development. Because only one MRM transition is required to monitor all lipids of interest, there is little compromise in method sensitivity. If desired, an additional transition for m/z 104 104 can be monitored to define the elution profile of 2-lyso-GPCho's.
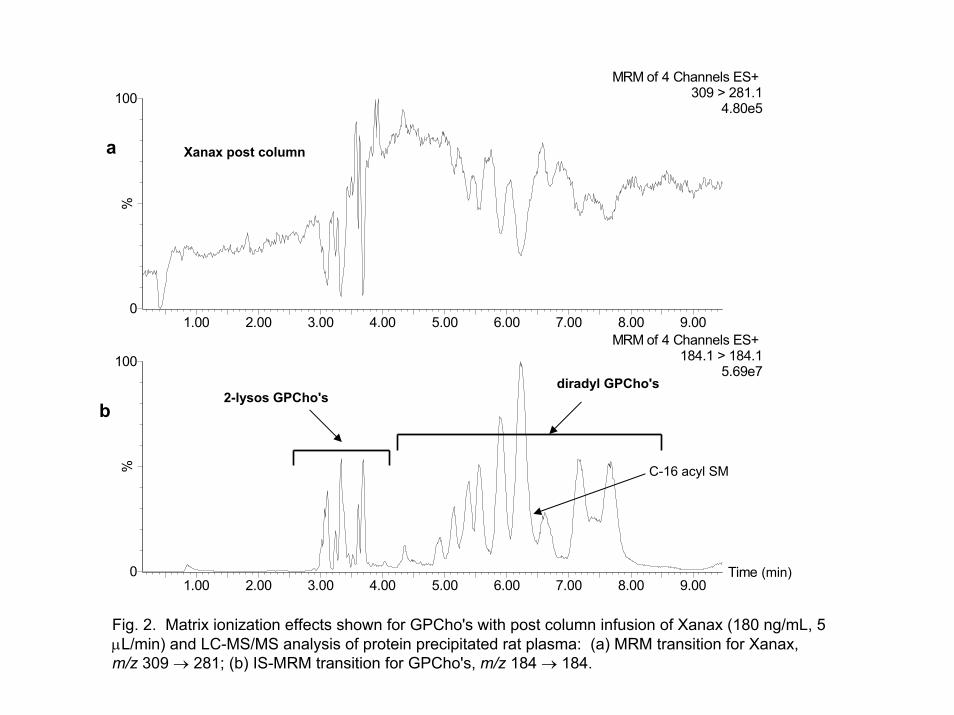
The results from the combination of our IS-MRM approach with the widely
accepted post-column approach [4] for probing matrix effects is shown in Figures 2a and 2b. Figure 2a shows the response as xanax was infused post-column employing an MRM transition of m/z 309 281. Simultaneously, the supernatant from protein-precipitated plasma was injected and analyzed by LC-MS/MS. Figure 2b shows the trace of the MRM transition for our IS-MRM experiment; m/z 184 184. The majority of the ion suppression noted for xanax in Figure 2a correlates with the elution of the GPCho's monitored in Figure 2b. The only other significant ion suppression observed at the beginning of the analysis is due to the presence of salts and various other non-retained components.
The IS-MRM approach may be modified slightly to increase its specificity. The
GPCho's and 2-lysos GPCho's can be monitored with either m/z 184 125 or m/z 184 86 transitions using a Q2 collision energy of 20 volts on the Quattro Micro. Likewise, the 2-lyso GPCho's can be monitored with a transition of m/z 104 60 at a Q2 collision energy of 17 volts. This approach is not applicable to method development employing selected ion recording experiments with a single quadrupole LC-MS.
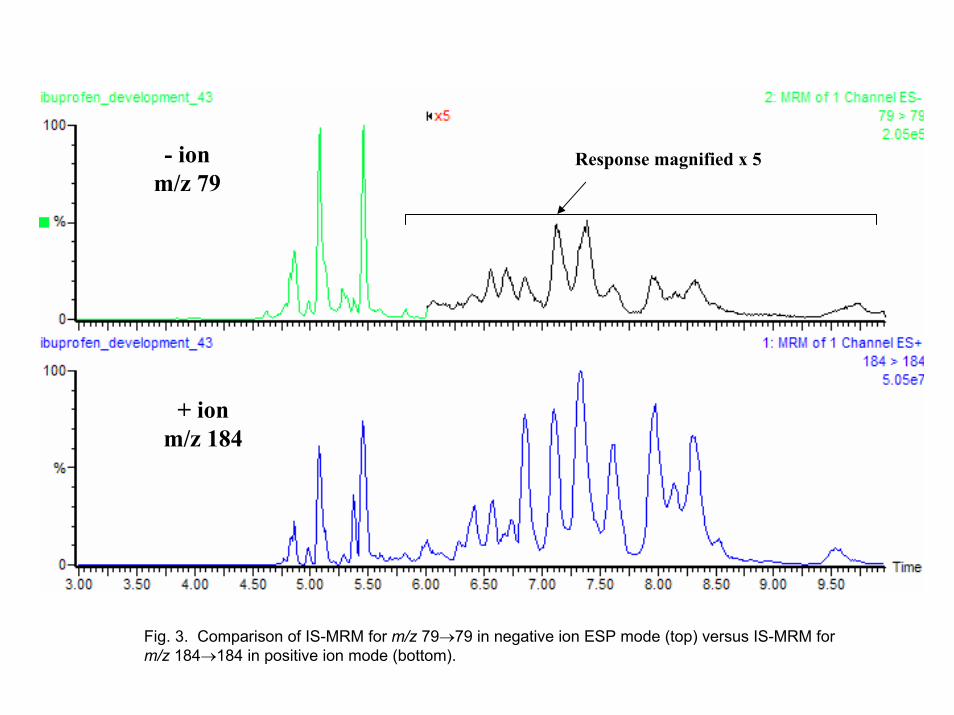
The IS-MRM approach can also be used in the negative ion mode at m/z 79 for
PO3- employing a cone voltage of 100 volts on the Quattro Micro. The response for IS-
MRM of m/z 184 in the positive ion mode is compared to that of m/z 79 in the negative ion mode in Figure 3. The positive ion mode is better than the negative ion mode since more GPCho's are noted in the former mode. Thus, it is best to use the postivie ion mode even when monitoring analytes in the negative ion mode by switching polarities during the experiment. However, the negative ion mode is acceptable if sampling time is an issue. 3.2. Detecting other phospholipids in plasma
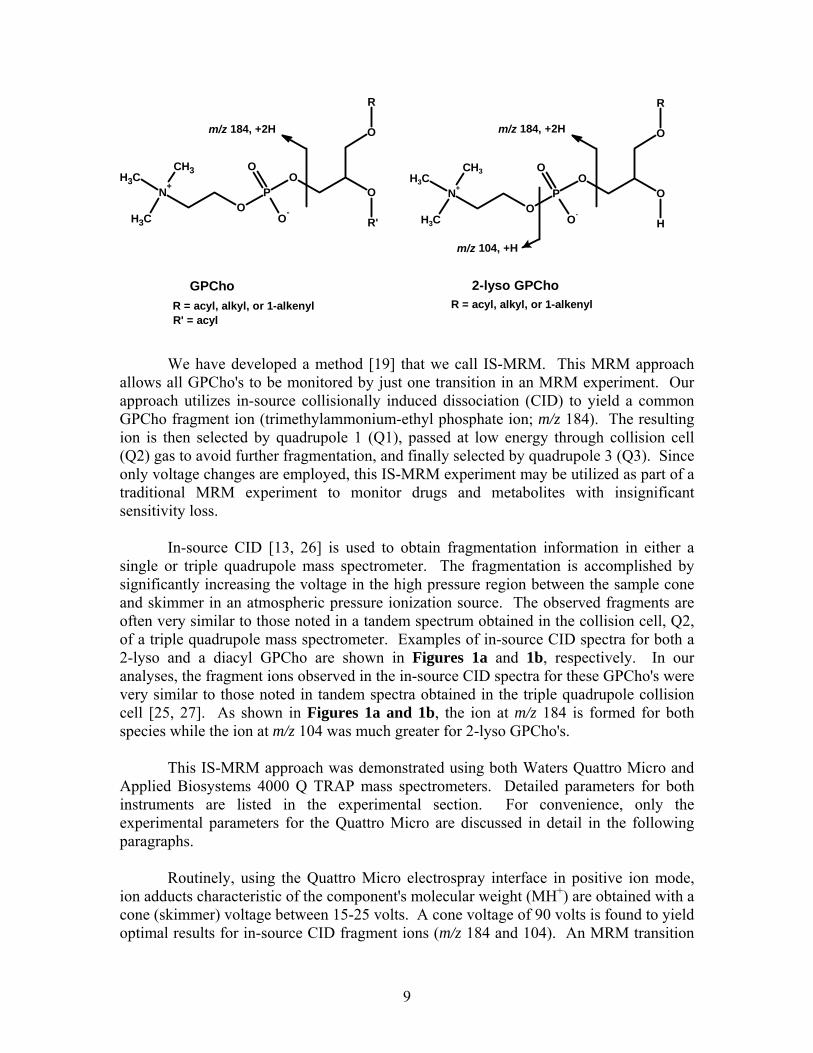
Relative to GPCho's, other phospholipids such as sphingomyelins (SM's), glycerophosphoethanolamines (GPEtn's), and glycerophosphoserines (GPSer's) are present at lower levels in plasma [18]. We also evaluated the IS-MRM approach in detecting these species. As illustrated below, SM's are easily detected by this approach since they too form the m/z 184 ion via in-source CID; the major fragmentation mechanism noted in SM tandem spectra [25, 27]. Hence, the SM's present in plasma are
11
also detected in the same IS-MRM transition used to monitor GPCho's. Only a small response was noted for the SM's. The most significant SM was the hexadecanoyl substituted species (M+H+ and M+Na+; m/z 703 and 725, respectively) which coeluted with a diradyl-GPCho (see Figure 2b).
m/z 184, +2H
RO
P
O-
O
N+
CH3CH3
CH3
ONH
OH(CH2)12CH3
SMR = acyl
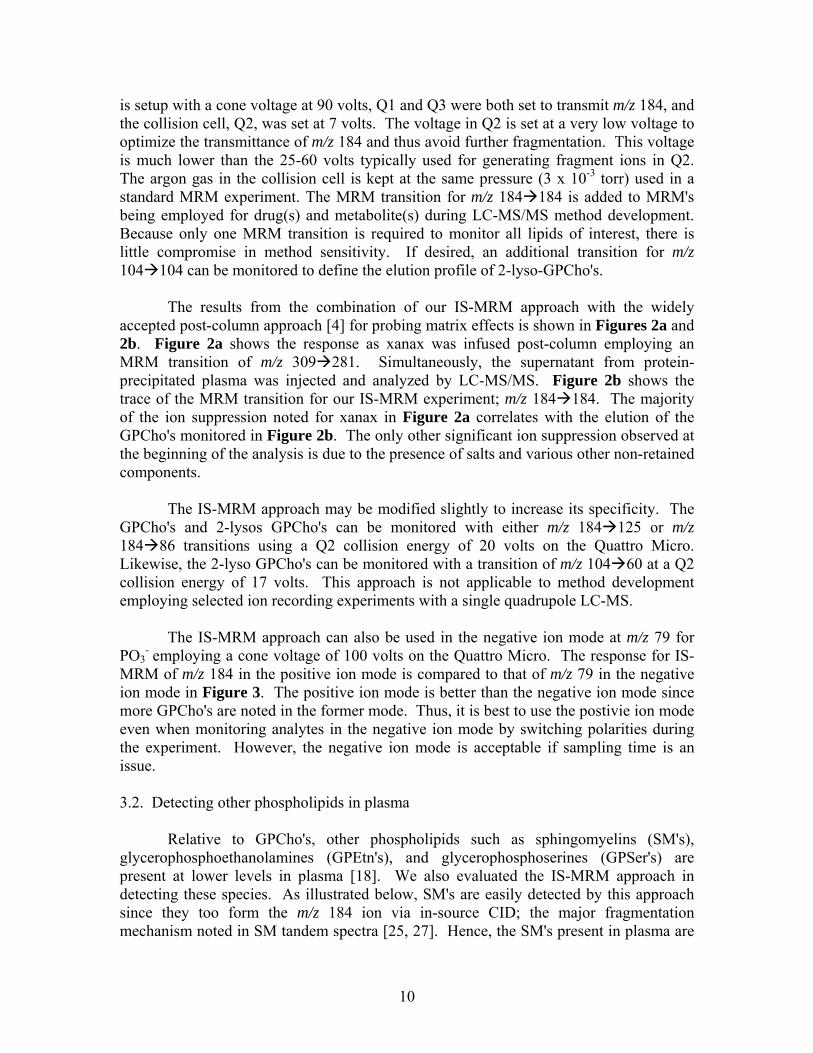
On the other hand, GPEtn's and GPSer's could not be detected using an IS-MRM experiment. As presented below, these phospholipids lose their polar head groups as neutral loss (NL) fragments via in-source CID. They can be detected as classes of compounds employing tandem NL neutral loss experiments of 141 and 185 amu's for GPEtn's and GPSer's, respectively [25]. This neutral loss approach is not as convenient or as sensitive as the IS-MRM method; the neutral loss tandem experiment cannot be performed as an integral part of an MRM sequence.
OP
O-
O
NH2
O
R
R'
O
O
OP
O-
OO
R
O
O
O
OH
NH2
R'
NL 141 amu, +2H
GPSer'sR = acyl
R' = acyl, HR = acyl, alkyl, or 1-alkenyl
GPEtn's
NL 185 amu, +2H
R' = acyl, H
3.3. Analyses of plasma from different species with IS-MRM
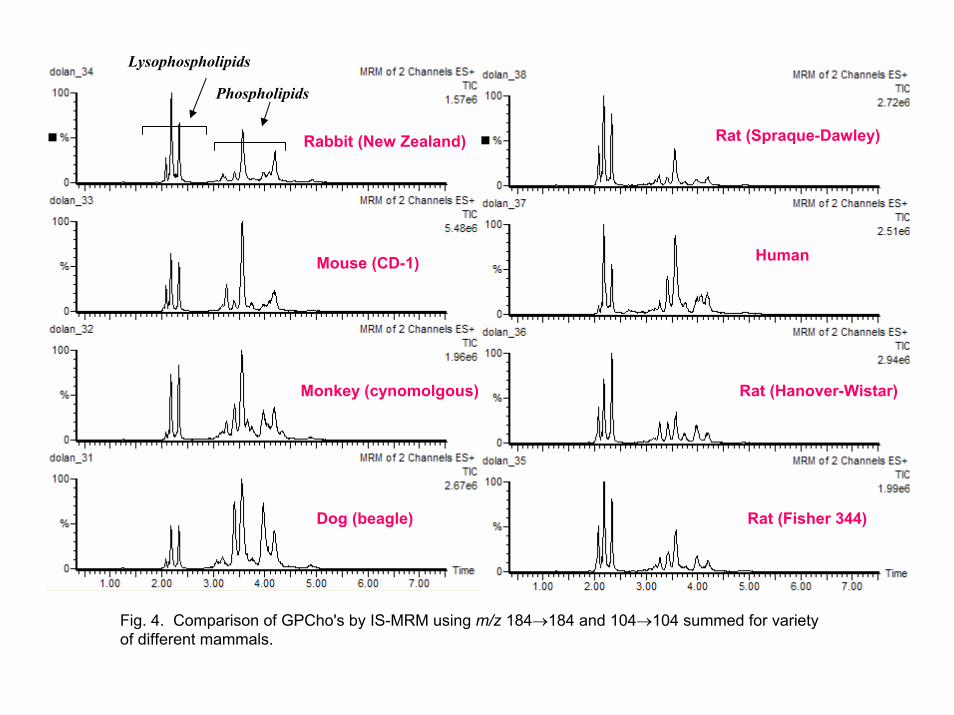
Protein precipitated supernatants from a variety of different mammals – mouse, rat (three different strains; Sprague-Dawley, Fischer, and Hanover-Wistar), rabbit, dog, monkey, and human – were examined by the m/z 184 184 IS-MRM method. The
12
concentrations and diversity of GPCho's in these plasma samples varied significantly, but the retention time windows were very similar (see Figure 4). 3.4. Standard gradient method development using IS-MRM experiment
The utility of an IS-MRM approach during chromatographic method development is demonstrated in the quantitation of tamoxifen and two of its metabolites, 4-hydroxytamoxifen and desmethyltamoxifen. Protein precipitation of rat plasma matrix employing ACN was used for sample preparation and diphenhydramine hydrochloride was used as the IS. Our goal was to develop a chromatographic separation with a total cycle time of less than 5 min; one that eluted GPCho's from the column yet chromatographically resolved them from the analytes and IS.
GPCho's are very hydrophobic species and require a significant amount of time to
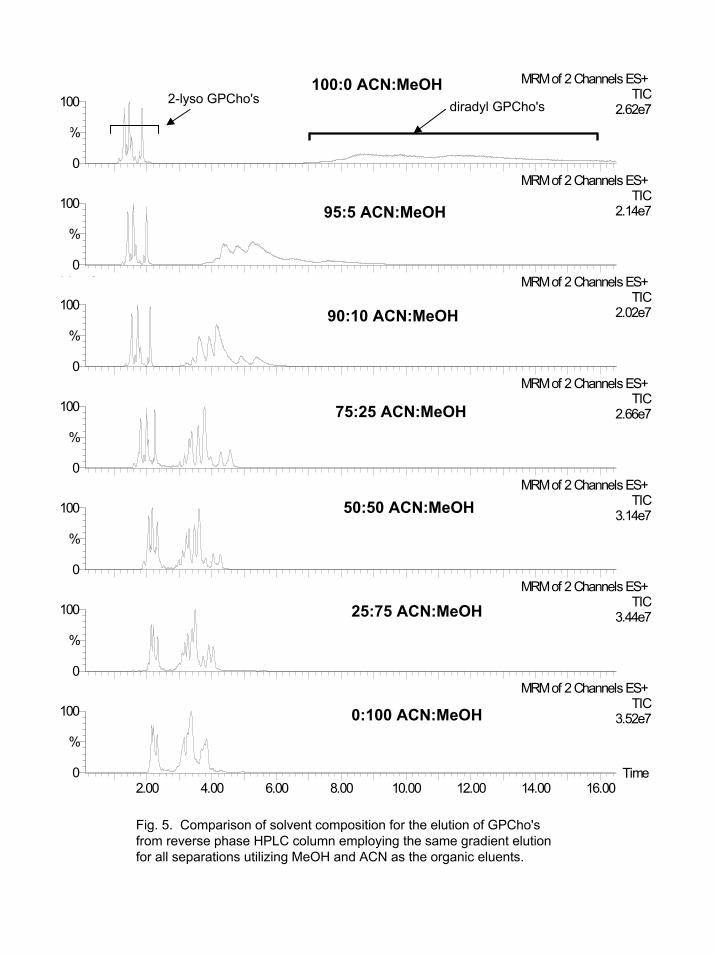
completely elute from a reversed-phase HPLC column. We first studied the factors that decreased these lipids' elution times. The major factors that decreased their elution time were choice of organic solvent, temperature, and flow rate. As presented in Figure 5, solvent selection will effect GPCho's elution from the reversed-phase column. It is somewhat surprising that pure MeOH was the most effective for eluting GPCho's, since ACN is normally considered a stronger reversed-phase solvent than MeOH [29]. Depending upon the specificity of the organic solvent required for the analytes of interest, either pure MeOH or MeOH/ACN mixtures containing ≥25% MeOH were used in all our methods. A problem with pure MeOH, at higher flow rates, is the high column back-pressures generated by mixtures of MeOH and water [28, 30].
Flow rate can also significantly decrease the elution time of GPCho's. The initial part of the solvent program in most our separations employs a flow rate of 0.4 mL/min for optimal separation. The flow rates are then increased to >1.2 mL/min towards the end of our separations to significantly decrease the elution times of the GPCho's. In order to keep the column backpressure in an acceptable range, we found that the flow rate must be decreased during the return of the column to its initial solvent composition. This was necessary due to the high column backpressure which maximizes at a MeOH:water composition of ~50:50 [28, 30]. To minimize contamination of the electrospray source, the flow was diverted from the mass spectrometer after the elution of the analytes and during the first minute when salts and other species eluted. Some care needs to be taken when increasing the flow rate during the time that the analytes of interest are being eluted since flow rate affects the gradient retention factor (k*) and the selectivity, (α) of the separation [29].
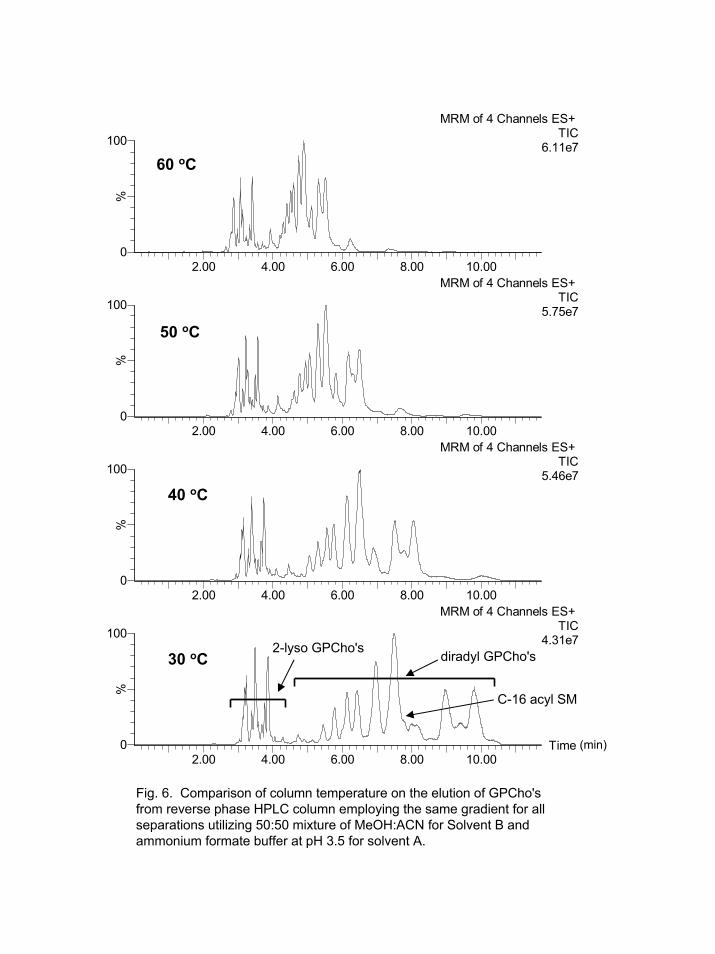
The other major factor that decreased lipid elution time was temperature. Figure
6 shows the effects that column temperature had on lipid elution. The upper temperature limit for this column was 60 oC. Higher temperatures would decrease the lipid elution time, but will severely shorten the lifetime of the column.
A pH range (3.5 – 7.0) had little effect on the retention times of GPCho's, but was
critical in the separation of desmethyltamoxifen and tamoxifen. At pH 3.5, the
13
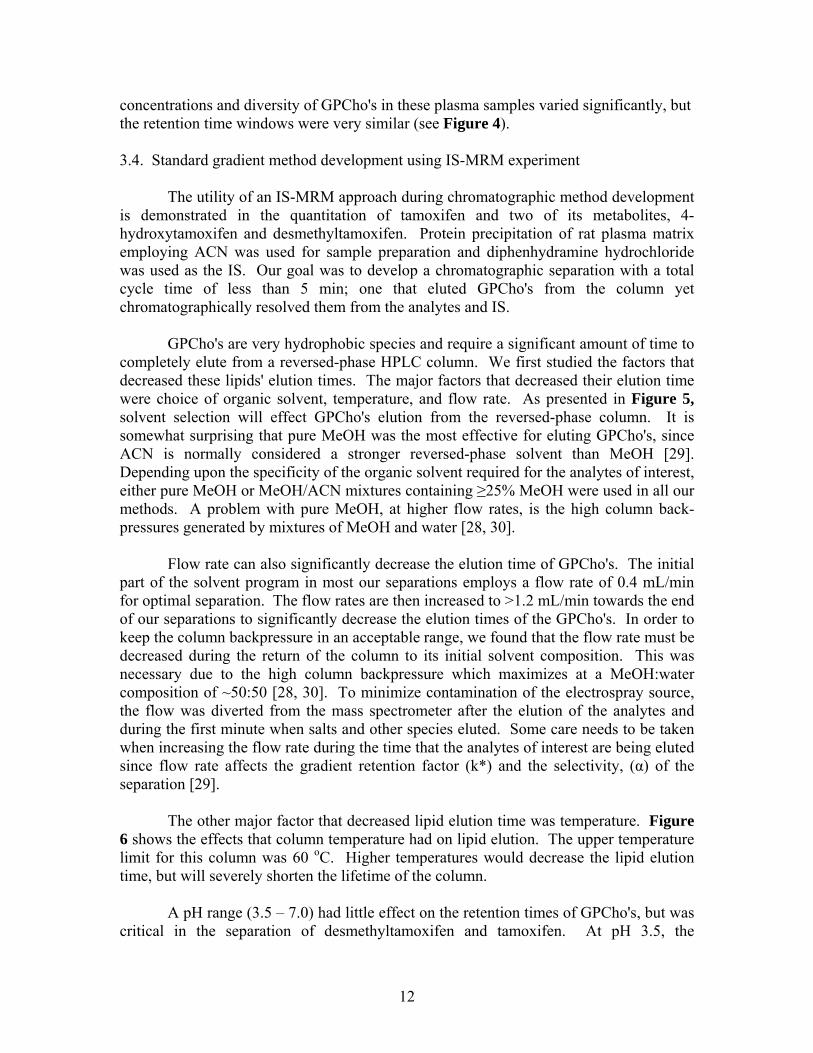
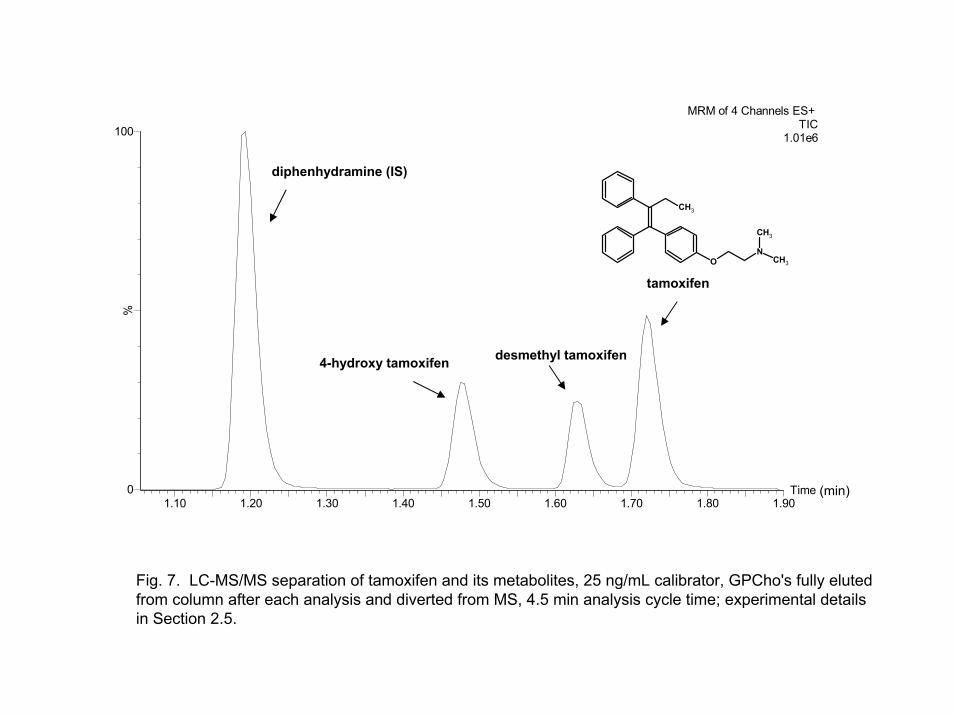
desmethyltamoxifen and tamoxifen coeluted, but were baseline resolved at pH ~4.5. Figure 7 shows the final separation of tamoxifen and its metabolites. The method had a cycle time of 4.5 min which included 30 sec for the autosampler injection sequence. The method was used for a PK study of over 1000 rat plasma samples and conformed to the standards outlined in the FDA guidelines [2] for calibrator and quality control samples. The details of the method are listed within the experimental section.
Many other variables could be evaluated to shorten the cycle time for the analysis including other stationary phases, supports other than silica, other organic solvents or solvent mixtures, column switching, etc. However, the variation of MeOH or MeOH/ACN mixtures, temperature, and flow rate with a C-18 reversed-phase column satisfied our current cycle time requirements. 3.5. Steady-state gradient method without elution of lipids
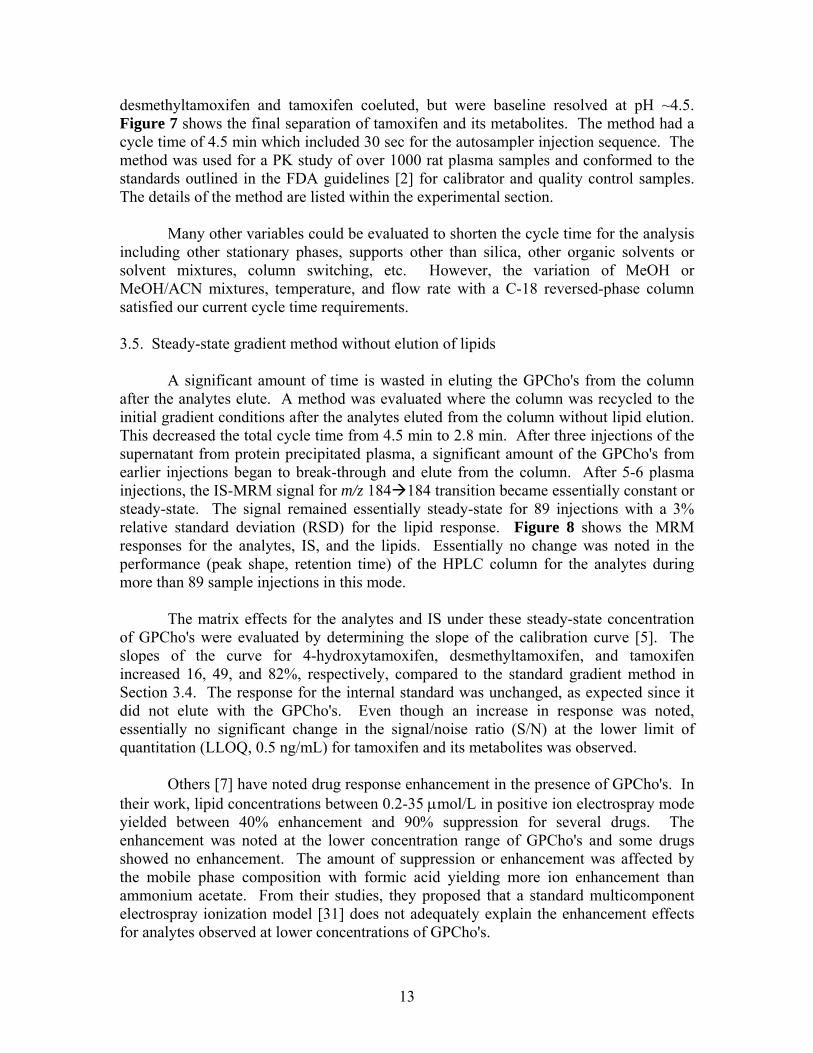
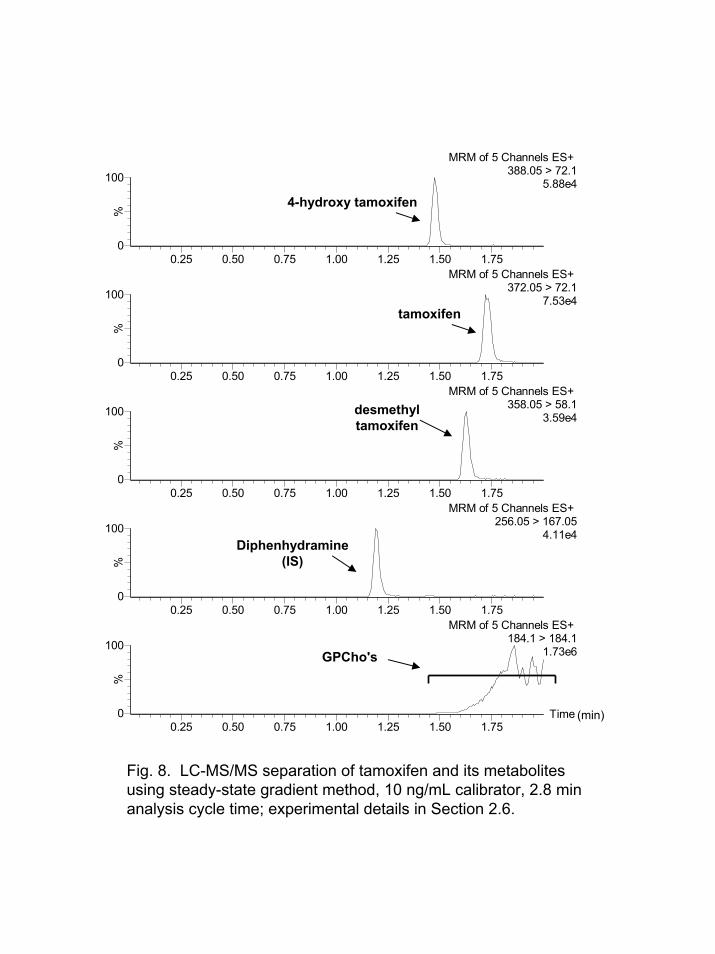
A significant amount of time is wasted in eluting the GPCho's from the column after the analytes elute. A method was evaluated where the column was recycled to the initial gradient conditions after the analytes eluted from the column without lipid elution. This decreased the total cycle time from 4.5 min to 2.8 min. After three injections of the supernatant from protein precipitated plasma, a significant amount of the GPCho's from earlier injections began to break-through and elute from the column. After 5-6 plasma injections, the IS-MRM signal for m/z 184 184 transition became essentially constant or steady-state. The signal remained essentially steady-state for 89 injections with a 3% relative standard deviation (RSD) for the lipid response. Figure 8 shows the MRM responses for the analytes, IS, and the lipids. Essentially no change was noted in the performance (peak shape, retention time) of the HPLC column for the analytes during more than 89 sample injections in this mode.
The matrix effects for the analytes and IS under these steady-state concentration of GPCho's were evaluated by determining the slope of the calibration curve [5]. The slopes of the curve for 4-hydroxytamoxifen, desmethyltamoxifen, and tamoxifen increased 16, 49, and 82%, respectively, compared to the standard gradient method in Section 3.4. The response for the internal standard was unchanged, as expected since it did not elute with the GPCho's. Even though an increase in response was noted, essentially no significant change in the signal/noise ratio (S/N) at the lower limit of quantitation (LLOQ, 0.5 ng/mL) for tamoxifen and its metabolites was observed.
Others [7] have noted drug response enhancement in the presence of GPCho's. In their work, lipid concentrations between 0.2-35 µmol/L in positive ion electrospray mode yielded between 40% enhancement and 90% suppression for several drugs. The enhancement was noted at the lower concentration range of GPCho's and some drugs showed no enhancement. The amount of suppression or enhancement was affected by the mobile phase composition with formic acid yielding more ion enhancement than ammonium acetate. From their studies, they proposed that a standard multicomponent electrospray ionization model [31] does not adequately explain the enhancement effects for analytes observed at lower concentrations of GPCho's.
14
The lipid concentrations in plasma could vary in different rats or in the same rat
as a function of time within a PK study, and thus affect the steady-state lipid concentration and the associated analyte response. Therefore, it was essential to perform a PK study (10 rats x 7 time points) for tamoxifen and its metabolites. The IS-MRM response for m/z 184 184 was monitored during the analyses to insure that the GPCho response remained steady-state during all analyses.
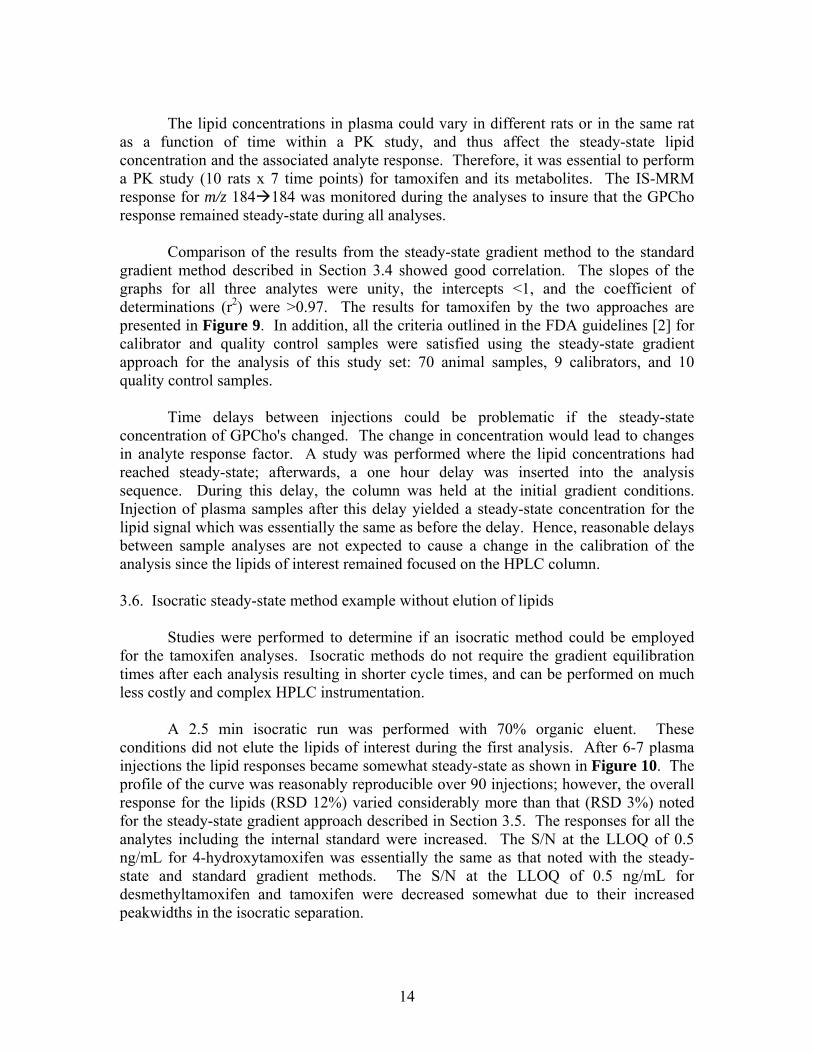
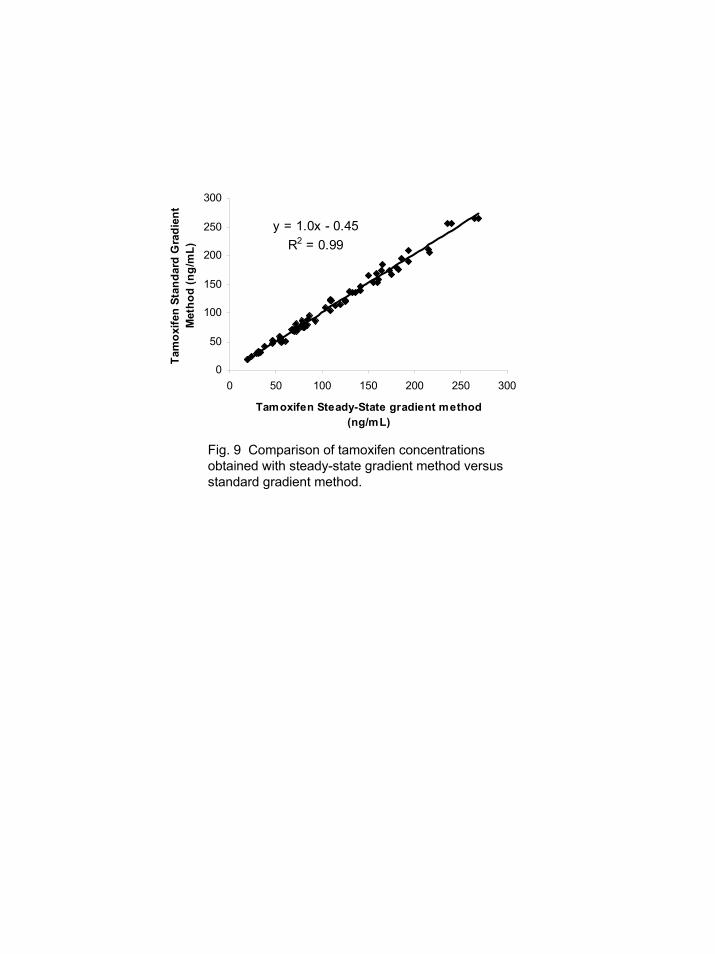
Comparison of the results from the steady-state gradient method to the standard gradient method described in Section 3.4 showed good correlation. The slopes of the graphs for all three analytes were unity, the intercepts <1, and the coefficient of determinations (r2) were >0.97. The results for tamoxifen by the two approaches are presented in Figure 9. In addition, all the criteria outlined in the FDA guidelines [2] for calibrator and quality control samples were satisfied using the steady-state gradient approach for the analysis of this study set: 70 animal samples, 9 calibrators, and 10 quality control samples. Time delays between injections could be problematic if the steady-state concentration of GPCho's changed. The change in concentration would lead to changes in analyte response factor. A study was performed where the lipid concentrations had reached steady-state; afterwards, a one hour delay was inserted into the analysis sequence. During this delay, the column was held at the initial gradient conditions. Injection of plasma samples after this delay yielded a steady-state concentration for the lipid signal which was essentially the same as before the delay. Hence, reasonable delays between sample analyses are not expected to cause a change in the calibration of the analysis since the lipids of interest remained focused on the HPLC column. 3.6. Isocratic steady-state method example without elution of lipids
Studies were performed to determine if an isocratic method could be employed for the tamoxifen analyses. Isocratic methods do not require the gradient equilibration times after each analysis resulting in shorter cycle times, and can be performed on much less costly and complex HPLC instrumentation.
A 2.5 min isocratic run was performed with 70% organic eluent. These
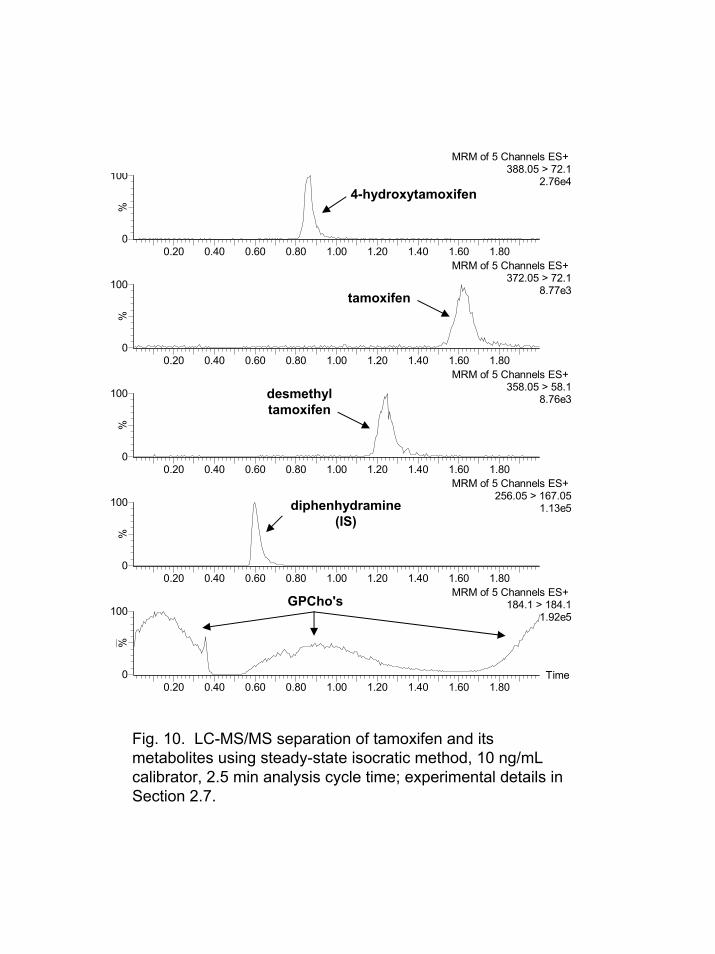
conditions did not elute the lipids of interest during the first analysis. After 6-7 plasma injections the lipid responses became somewhat steady-state as shown in Figure 10. The profile of the curve was reasonably reproducible over 90 injections; however, the overall response for the lipids (RSD 12%) varied considerably more than that (RSD 3%) noted for the steady-state gradient approach described in Section 3.5. The responses for all the analytes including the internal standard were increased. The S/N at the LLOQ of 0.5 ng/mL for 4-hydroxytamoxifen was essentially the same as that noted with the steady-state and standard gradient methods. The S/N at the LLOQ of 0.5 ng/mL for desmethyltamoxifen and tamoxifen were decreased somewhat due to their increased peakwidths in the isocratic separation.
15
The tamoxifen study samples were analyzed by the isocratic approach and the resulting values compared to those obtained from the standard gradient method in Section 3.4. The values for tamoxifen were similar in both methods but the values were about 25% greater for both desmethyltamoxifen and 4-hydroxytamoxifen in the standard gradient method compared to this isocratic method. Furthermore, the criteria outlined in the FDA guidelines [2] for calibrator and quality control samples were not satisfied for this isocratic steady-state method. Thus, an isocratic method was not found to be acceptable for this particular analysis due to significant biases, quality control errors, and calibration problems.
The problems noted in this approach are probably related to the fact that GPCho's
are continually being flushed from the HPLC column under steady-state isocratic conditions. This is in contrast to the focusing of GPCho's noted in the steady-state gradient method discussed in Section 3.5. Indeed, the lipids concentrated on the column in 6-7 injections will be flushed from the column in approximately 30-40 min. 3.7. Isocratic steady-state method using stable-isotope-labeled IS without elution of lipids
The utilization of stable-isotope-labeled internal standards is a very good approach for overcoming matrix ionization effects [1]. Theoretically, the labeled IS will experience the same amount of matrix suppression or enhancement as that for the unlabeled analyte. It was hoped that the problems noted in the steady-state isocratic method for tamoxifen in Section 3.6 with unlabeled IS could be overcome with this approach. Nevertheless, the analyte and isotope-labeled IS can suppress each others response in electrospray ionization. Thus, the amount of isotope-labeled IS must be properly chosen to keep the response factor constant over the desired quantitation range [24].
We developed two methods for the analysis of itraconazole employing
itraconazole-d3 as an internal standard. One method was a standard gradient method that completely eluted the GPCho's after every analysis (4.5 min cycle time). The second method was a steady-state isocratic method which did not elute the GPCho's after every analysis (2 min cycle time).
The two approaches were employed to analyze itraconazole in rat plasma (8 rats x
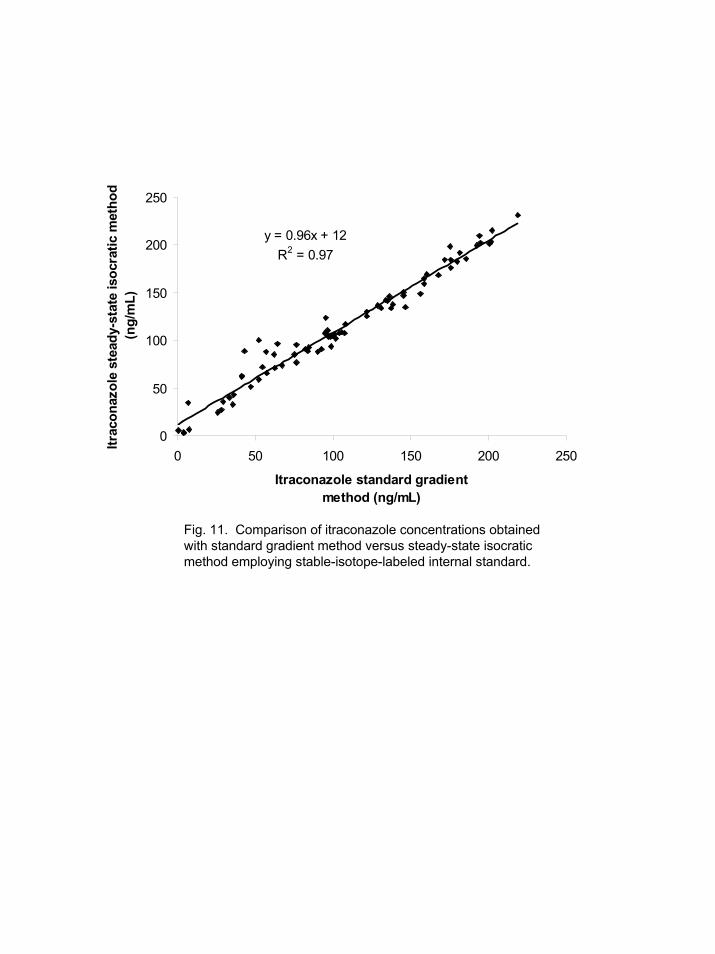
10 time points). The results from both methods satisfied all the criteria outlined in the FDA guidelines [2] for calibrator and quality control samples; analysis of 80 samples, 10 calibrators, and 12 quality control samples. A comparison of the results showed a very good correlation (slope 0.96, r2 0.96) between the two methods. However a large offset (see Figure 11) (intercept ~12 ng/mL, range of values 0.5-250 ng/ml) in the values for the isocratic versus the gradient method indicates some type of interference for either itraconazole or itraconazole-d3. Thus, the use of stable-isotope-labeled IS does appear to be a viable approach, but more studies need to determine the source of the bias. 4. Conclusions
16
A wide variety of strategies are needed to evaluate LC-MS/MS matrix ionization
effects resulting from endogenous and exogenous chemical species in plasma [1]. We found our IS-MRM approach to be a useful new tool for probing the matrix ionization effects of endogenous GPCho's. Depending on the positive ion electrospray and chromatographic conditions, these GPCho's can either suppress or enhance ionization. Our approach was utilized to develop reliable LC-MS/MS methods for the analysis of several drugs and their metabolites in PK studies employing protein precipitated plasma. Cycle times of <5 min were obtained which separated the GPCho's from the analytes; the very hydrophobic lipids were completely eluted from the column after each analysis.
The complete elution of the GPCho's after each analysis appears to be the safest
approach. This standard gradient method is currently employed in our laboratories since the cycle times of <5 min meet our current sample load demands. However, other approaches in which the GPCho's are not eluted from the column after each analysis could significantly decrease cycle times. For example, the steady-state gradient approach was shown to be a viable method for the analysis of tamoxifen and its metabolites and decreased the analysis cycle time by ~40% with essentially no bias in results when compared to the standard gradient method. Attempts to develop a steady-state isocratic method for tamoxifen and its metabolites employing an unlabeled IS were unsuccessful. However, a similar method for itraconazole employing a stable-isotope-labeled IS showed promise if biases in the results can be resolved. 5. Acknowledgements
We gratefully acknowledge John W. Dolan for valuable discussions, William W. Christie for literature references on lipids, and Stephen K. Haynes for sample preparation.
17
6. References 1. H. Mei in: W. Korfmacher (Ed.), Using Mass Spectrometry for Drug Metabolism Studies, CRC Press, Boca Raton, FL, 2005, p. 103 (Chapter 4). 2. Guidance for Industry, Bioanalytical Methods Validation, U.S. Department of Health and Human Services, Food and Drug Administration, Center for Drug Evaluation and Research (CDER), 2001, available at http://www.fda.gov/cder/guidance/4252fnl.htm. 3. S. Zhou, Q. Song, Y Tang, W. Naidong in: "Critical Review of Development, Validation, and Transfer for High Throughput Bioanalytical LC-MS/MS Methods," Curr. Pharm. Anal. I (2005) 3-14. 4. R. Bonfiglio, R. C. King, T. V. Olah, K. Merkle in: "The Effects of Sample Preparation Methods on the Variability of the Electrospray Ionization Response for Model Drug Compounds," Rapid Commun. Mass Spectrom. 13 (1999) 1175-1185. 5. B. K. Matuszewski, M. L. Constanzer, C. M. Chavez-Eng in: "Strategies for the Assessment of Matrix Effect in Quantitative Bioanalytical Methods Based on HPLC-MS/MS," Anal. Chem. 75 (2003) 3019-3030. 6. J. X. Shen, R. J. Motyka, J. P. Roach, R. N. Hayes in: "Minimization of Ion Suppression in LC-MS/MS Analysis through the Application of Strong Cation Exchange Solid-Phase Extraction (SCX-SPE)," J. Pharm. Biomed. Anal. 37 (2005) 359-367. 7. M. Ahnoff, H. Hagelin in: "Matrix Effects in Electrospray Ionization: Characterization of Plasma Phospholipids as Suppressors/Enhancers of Ionization Efficiency," poster session handout at the 52nd American Society for Mass Spectrometry (ASMS) Conference on Mass Spectrometry and Allied Topics, Nashville, TN, May 2004. 8. P. K. Bennett, K. C. Van Horne in: "Identification of the Major Endogenous and Persistent Compounds in Plasma, Serum and Tissue That Cause Matrix Effects with Electrospray LC/MS Techniques," poster handout at the American Association of Pharmaceutical Scientists (ASPS) Conference, Salt Lake City, UT, USA, Oct 2003, available at http://www.tandemlabs.com/capabilities_publications.html. 9. S. Hua, N. Weng in: "Narrowing the Gap between Validation of Bioanalytical LC-MS-MS and the Analysis of Incurred Samples," Pharm. Technol. May (2003) 74-86. 10. C. Polson, P. Sarkar, B. Incledon, V. Raguvaran, R. Grant in: "Optimization of Protein Precipitation Based Upon Effectiveness of Protein Removal and Ionization Effect in Liquid Chromatography-tandem mass spectrometry," J. Chromatogr. B 785 (2003) 263-275. 11. Jean-Philippe Antigna, K. de Wasch, F. Monteau, H. De Brabander, F. Andre, B. Le Bizec in: "Ion suppression phenomenon in liquid chromatography-mass spectrometry and its consequences in the field of residue analysis," Anal. Chim. Acta 529 (2005) 129-136. 12. R. Dams, M. A. Huestis, W. E. Lambert, C. M. Murphy in: "Matrix effect in bio-analysis of illicit drugs with LC-MS/MS: influence of ionization type, sample preparation, and biofluid," J. Am. Soc. Mass Spectrom. 14 (2003) 1290-1294. 13. C. Müller, P. Schäfer, M. Störtzel, S. Vogt, W. Weinmann in: "Ion suppression effects in liquid chromatography-electrospray-ionisation transport-region collision induced dissociation mass spectrometry with different serum extraction methods for systematic toxicological analysis with mass spectral libraries," J. Chromatogr. B 773 (2002) 47-52.
18
14. B. K. Matuszewski, M. L. Constanzer, C. M. Chavez-Eng in: "Matrix effect in quantitative LC/MS/MS analyses of biological fluids: a method for determination of Finasteride in human plasma at pictogram per milliliter concentrations," Anal. Chem. 70 (1998) 882-889. 15. H. Mei, Y. Hsieh, C. Nardo, X. Xu, S. Wang, K. Ng, W. A. Korfmacher in: "Investigation of matrix effects in bioanalytical high-performance liquid chromatography/tandem mass spectrometric assays: application to drug discovery," Rapid Commun. Mass Spectrom. 17 (2003) 97-103. 16. B. Alberts, A. Johnson, J. Lewis, M. Raff, K. Roberts, P. Walter in: Molecular Biology of the Cell, Garland Science, New York, NY, 2002, p. 583 (Chapter 10). 17. J. J. Myher, A. Kukis, S. Pind in: "Molecular Species of Glycerophospholipids and Sphingomyelins of Human Plasma: Comparison to Red Blood Cells," Lipids 24 (1989) 408-418. 18. G. B. Phillips, J. T. Dodge in: "Composition of Phospholipids and of Phospholipid Fatty Acids of Human Plasma," J. Lipid Res. 8 (1967) 676-681. 19. J. L. Little in: "Simple method to monitor lysophospholipids and phospholipids during LC-MS development via in-source CID," Proceedings of the 53rd American Society for Mass Spectrometry (ASMS) Conference on Mass Spectrometry and Allied Topics, San Antonio, TX, June 2005. 20. J. Ke, M. Yancey, S. Zhang, S. Lowes, J. D. Henion in: "Quantitative liquid chromatographic-tandem mass spectrometric determination of reserpine in FVB/N mouse plasma using a "chelating" agent (disodium EDTA) for releasing protein-bound analytes during 96-well liquid-liquid extraction," J. Chromatogr. B 742 (2000) 369-380. 21. L. Yang, N. Wu, R. P. Clement, P. J. Rudewicz in: "Validation and Application of a Liquid Chromatography-Tandem Mass Spectrometric Method for the Determination of SCH 211803 in Rat and Monkey Plasma Using Automated 96-well Protein Precipitation," J. Chromatogr. B 799 (2004) 271-280. 22. D. Humphries, K. Ruterbories, C. Chan, R. Narayanan in: . "Development and validation of a liquid chromatography-tandem mass spectrometric method for the determination of alpha-methylstyrosine in human plasma," J. Chromatogr., B 810 (2004) 229-234. 23. N. Ellor, Personal Communication, Waters Corp., August, 2005. 24. H. R. Liang, R. L. Foltz, M. Meng, P. Bennett in: "Ionization enhancement in atmospheric pressure chemical ionization and suppression in electrospray ionization between target drugs and stable-isotope-labeled internal standards in quantitative liquid chromatography/tandem mass spectrometry," Rapid Commun. Mass Spectrom. 17 (2003) 2815-2821. 25. R. C. Murphy in: Mass Spectrometry of Phospholipids: Tables of Molecular and Product Ions, Illuminati Press, Denver, CO, 2002. 26. C. Buré, C. Lange in: “Comparison of dissociation of ions in an electrospray source, or a collision cell in tandem mass spectrometry,” Curr. Org. Chem. 7 (2003) 1613-1624. 27. J. L. Kerwin, A. R. Tuininga, L. H. Ericsson in: "Identification of Molecular Species of Glycerophospholipids and Sphingomyelin Using Electrospray Mass Spectrometry," J. Lipid. Res, 35 (1994) 1102-1114.
19
28. J. M. Miller in: Chromatograhy: Concepts and Contrasts, Wiley-Interscience Publications, John Wiley & Sons, New York, NY, 1988, p. 198, 211. 29. L. R. Snyder, J. J. Kirkland, and J. L. Glajch in: "Practical HPLC Method Development, Second Edition, John Wiley & Sons, Inc., New York, NY, 1997, p. 239, 350. 30. S. Van der Wal in: "Low viscosity organic modifiers in reversed-phase HPLC," Chromatographia 20 (1985) 274-278. 31. L. Tand and P. Kebarle in: "Dependence of ion intensity in electrospray mass spectrometry on the concentration of the analytes in the electrosprayed solution," Anal. Chem. 65 (1993) 3654.
m/z75 100 125 150 175 200 225 250 275 300 325 350 375 400 425 450 475 500 525 550 575 600 625 650 675 700 725 750 775
%
0
100
%
0
100asms_187 82 (3.293) Cm (80:85-(55:67+108:124)) 2: Scan ES+
4.78e7104
86
60
71
184
125166
496198 313 459 518
asms_187 155 (6.242) Cm (145:159-(125:139+164:169)) 2: Scan ES+ 2.61e7184
86
104780
597 721 758
N+
O P
O
O-
CH3CH3
CH3
O
O
O H
O
(CH2)14CH3a
b
MW 757
N+
OP
O
O-
CH3CH3
CH3
O
O
O
O
(CH2)14CH3
O (CH2)7CH=CH-CH2-CH=CH-(CH2)4CH3
MW 495
M+Na+
M+H+
M+Na+
M+H+
Fig. 1. In-source CID spectra for GPCho's at 90 V cone voltage on Quattro Micro mass spectrometer: (a) 2-lyso GPCho; (b) diacyl GPCho.
Time1.00 2.00 3.00 4.00 5.00 6.00 7.00 8.00 9.00
%
0
100
1.00 2.00 3.00 4.00 5.00 6.00 7.00 8.00 9.00
%
0
100asms_209 Sm (SG, 1x2) MRM of 4 Channels ES+
309 > 281.14.80e5
asms_209 MRM of 4 Channels ES+ 184.1 > 184.1
5.69e7
a
b
Xanax post column
2-lysos GPCho'sdiradyl GPCho's
(min)
C-16 acyl SM
Fig. 2. Matrix ionization effects shown for GPCho's with post column infusion of Xanax (180 ng/mL, 5 µL/min) and LC-MS/MS analysis of protein precipitated rat plasma: (a) MRM transition for Xanax,m/z 309 → 281; (b) IS-MRM transition for GPCho's, m/z 184 → 184.
+ ionm/z 184
- ionm/z 79
Response magnified x 5
Fig. 3. Comparison of IS-MRM for m/z 79→79 in negative ion ESP mode (top) versus IS-MRM for m/z 184→184 in positive ion mode (bottom).
Dog (beagle)
Monkey (cynomolgous)
Mouse (CD-1)
Rabbit (New Zealand)
Rat (Fisher 344)
Rat (Hanover-Wistar)
Human
Rat (Spraque-Dawley)
Lysophospholipids
Phospholipids
Fig. 4. Comparison of GPCho's by IS-MRM using m/z 184→184 and 104→104 summed for variety of different mammals.
100 acn
2.00 4.00 6.00 8.00 10.00 12.00 14.00 16.00Time0
100
%
0
100
%
0
100
%
0
100
%
0
100
%
0
100
%
0
100
%
dolan_8 MRM of 2 Channels ES+ TIC
2.62e7
dolan_4 MRM of 2 Channels ES+ TIC
2.14e7
dolan_3 MRM of 2 Channels ES+ TIC
2.02e7
dolan_2 MRM of 2 Channels ES+ TIC
2.66e7
dolan_14 MRM of 2 Channels ES+ TIC
3.14e7
dolan_7 MRM of 2 Channels ES+ TIC
3.44e7
dolan_6 MRM of 2 Channels ES+ TIC
3.52e70:100 ACN:MeOH
25:75 ACN:MeOH
50:50 ACN:MeOH
75:25 ACN:MeOH
90:10 ACN:MeOH
95:5 ACN:MeOH
100:0 ACN:MeOH2-lyso GPCho's diradyl GPCho's
Fig. 5. Comparison of solvent composition for the elution of GPCho'sfrom reverse phase HPLC column employing the same gradient elution for all separations utilizing MeOH and ACN as the organic eluents.
Time2.00 4.00 6.00 8.00 10.00
%
0
100
2.00 4.00 6.00 8.00 10.00
%
0
100
2.00 4.00 6.00 8.00 10.00
%
0
100
2.00 4.00 6.00 8.00 10.00
%
0
100
asms_194 MRM of 4 Channels ES+ TIC
6.11e7
asms_193 MRM of 4 Channels ES+ TIC
5.75e7
asms_192 MRM of 4 Channels ES+ TIC
5.46e7
asms_191 MRM of 4 Channels ES+ TIC
4.31e730 oC
40 oC
50 oC
60 oC
2-lyso GPCho's diradyl GPCho's
(min)
C-16 acyl SM
Fig. 6. Comparison of column temperature on the elution of GPCho'sfrom reverse phase HPLC column employing the same gradient for all separations utilizing 50:50 mixture of MeOH:ACN for Solvent B and ammonium formate buffer at pH 3.5 for solvent A.
Time1.10 1.20 1.30 1.40 1.50 1.60 1.70 1.80 1.90
%
0
100
rat_study_050 MRM of 4 Channels ES+ TIC
1.01e6
(min)
diphenhydramine (IS)
tamoxifen
desmethyl tamoxifen4-hydroxy tamoxifen
CH3
ON
CH3
CH3
Fig. 7. LC-MS/MS separation of tamoxifen and its metabolites, 25 ng/mL calibrator, GPCho's fully eluted from column after each analysis and diverted from MS, 4.5 min analysis cycle time; experimental details in Section 2.5.
Time0.25 0.50 0.75 1.00 1.25 1.50 1.75
%
0
100
0.25 0.50 0.75 1.00 1.25 1.50 1.75
%
0
100
0.25 0.50 0.75 1.00 1.25 1.50 1.75
%
0
100
0.25 0.50 0.75 1.00 1.25 1.50 1.75
%
0
100
0.25 0.50 0.75 1.00 1.25 1.50 1.75
%
0
100
tamoxifen_b_1284 MRM of 5 Channels ES+ 388.05 > 72.1
5.88e4
tamoxifen_b_1284 MRM of 5 Channels ES+ 372.05 > 72.1
7.53e4
tamoxifen_b_1284 MRM of 5 Channels ES+ 358.05 > 58.1
3.59e4
tamoxifen_b_1284 MRM of 5 Channels ES+ 256.05 > 167.05
4.11e4
tamoxifen_b_1284 MRM of 5 Channels ES+ 184.1 > 184.1
1.73e6
(min)
GPCho's
Diphenhydramine(IS)
desmethyltamoxifen
4-hydroxy tamoxifen
tamoxifen
Fig. 8. LC-MS/MS separation of tamoxifen and its metabolites using steady-state gradient method, 10 ng/mL calibrator, 2.8 min analysis cycle time; experimental details in Section 2.6.
y = 1.0x - 0.45R2 = 0.99
0
50
100
150
200
250
300
0 50 100 150 200 250 300
Tamoxifen Steady-State gradient method (ng/mL)
Tam
oxife
n St
anda
rd G
radi
ent
Met
hod
(ng/
mL)
Fig. 9 Comparison of tamoxifen concentrations obtained with steady-state gradient method versus standard gradient method.
Time0.20 0.40 0.60 0.80 1.00 1.20 1.40 1.60 1.80
%
0
100
0.20 0.40 0.60 0.80 1.00 1.20 1.40 1.60 1.80
%
0
100
0.20 0.40 0.60 0.80 1.00 1.20 1.40 1.60 1.80
%
0
100
0.20 0.40 0.60 0.80 1.00 1.20 1.40 1.60 1.80
%
0
100
0.20 0.40 0.60 0.80 1.00 1.20 1.40 1.60 1.80
%
0
100
tamoxifen_b_863 MRM of 5 Channels ES+ 388.05 > 72.1
2.76e4
tamoxifen_b_863 MRM of 5 Channels ES+ 372.05 > 72.1
8.77e3
tamoxifen_b_863 MRM of 5 Channels ES+ 358.05 > 58.1
8.76e3
tamoxifen_b_863 MRM of 5 Channels ES+ 256.05 > 167.05
1.13e5
tamoxifen_b_863 MRM of 5 Channels ES+ 184.1 > 184.1
1.92e5GPCho's
diphenhydramine(IS)
desmethyltamoxifen
4-hydroxytamoxifen
tamoxifen
Fig. 10. LC-MS/MS separation of tamoxifen and its metabolites using steady-state isocratic method, 10 ng/mLcalibrator, 2.5 min analysis cycle time; experimental details inSection 2.7.
y = 0.96x + 12R2 = 0.97
0
50
100
150
200
250
0 50 100 150 200 250
Itraconazole standard gradientmethod (ng/mL)
Itrac
onaz
ole
stea
dy-s
tate
isoc
ratic
met
hod
(ng/
mL)
Fig. 11. Comparison of itraconazole concentrations obtained with standard gradient method versus steady-state isocratic method employing stable-isotope-labeled internal standard.


![The Mass Spectrometry Primerhuffman/lectures/figures/... · [ Beginners Guide to Liquid Chromatography ] Who Uses Mass Spectrometry? Before considering mass spectrometry (MS), you](https://static.fdocuments.net/doc/165x107/5f1ffcbf46fafb32e122dc33/the-mass-spectrometry-primer-huffmanlecturesfigures-beginners-guide-to.jpg)