Linking Travel Demand Modeling with Micro … · Linking Travel Demand Modeling With Traffic...
50
ta Linking Travel Demand Modeling with Micro-Simulation (Phase II) Prepared for: Regional Transportation Commission of Southern Nevada Prepared by: Dongmei Lin, Ph.D. Zong Tian, Ph.D., P.E. (PI) Center for Advanced Transportation Education and Research (CATER) University of Nevada, Reno Reno, NV 89557 Email: [email protected] Tel: (775)784-1232 April 15, 2015 Center for Advanced Transportation Education and Research (CATER) University of Nevada, Reno University of Nevada, Reno
Transcript of Linking Travel Demand Modeling with Micro … · Linking Travel Demand Modeling With Traffic...

ta Linking Travel Demand Modeling with
Micro-Simulation (Phase II)
Prepared for:
Regional Transportation Commission of Southern Nevada
Prepared by:
Dongmei Lin, Ph.D.
Zong Tian, Ph.D., P.E. (PI)
Center for Advanced Transportation Education and Research
(CATER)
University of Nevada, Reno
Reno, NV 89557
Email: [email protected]
Tel: (775)784-1232
April 15, 2015
Center for Advanced Transportation Education and Research (CATER)
University of Nevada, Reno
University of Nevada, Reno
Center for Advanced Transportation Education and Research
(CATER)Center for Advanced Transportation Education and

CATER-UNR i
The preparation of this report has been financed in part through grant[s] from the
Federal Highway Administration and Federal Transit Administration, U.S.
Department of Transportation, under the Metropolitan Planning Program, Section
104(f) of Title 23, U.S. Code. The contents of this report do not necessarily reflect
the official views or policy of the U.S. Department of Transportation.

CATER-UNR ii
Table of Contents
Abstract .......................................................................................................................................... 1
Executive Summary ...................................................................................................................... 2
1. Introduction .............................................................................................................................. 5
1.1 Problem Statement ............................................................................................................ 5 1.2 Background ....................................................................................................................... 6
1.3 Project Objective ............................................................................................................... 8
2. Modeling Methodologies ......................................................................................................... 9
2.1 Cross-Resolution Simulation Method ............................................................................... 9 2.2 Conversion Process ......................................................................................................... 11
2.2.1 DTA Model Development ................................................................................... 11 2.2.2 Subarea Extraction and Conversion ..................................................................... 12
2.2.3 Exporting Subarea into Synchro/SimTraffic ....................................................... 14
3. Data Structure ........................................................................................................................ 15
3.1 Input Data........................................................................................................................ 15 3.1.1 Network input files .............................................................................................. 15 3.1.2 Demand input files ............................................................................................... 17
3.1.3 Optional files ........................................................................................................ 19 3.1.4 Scenario input files .............................................................................................. 19
3.2 Output Data ..................................................................................................................... 20 3.2.1 DTALite output files ............................................................................................ 21 3.2.2 NEXTA output files ............................................................................................. 22
3.3 Settings Files ................................................................................................................... 23
4. Case Study ............................................................................................................................. 24
4.1 Reno-Sparks network ...................................................................................................... 24 4.2 Las Vegas Network ......................................................................................................... 25
5. User’s Manual ........................................................................................................................ 26
Step 1: DTA Model Development ........................................................................................ 26 1-1. Export Network and Demand from TransCAD ................................................ 26
1-2. Import Network into NeXTA............................................................................ 30 1-3. Read Network and Demand Data into NeXTA ................................................ 33 1-4. Run Assignment with DTALite to Equilibrium................................................ 33
Step 2: Subarea extraction and Conversion .......................................................................... 34
2-1. Cut a Subarea within the Larger Network ........................................................ 34 2-2. Generate physical Zone Centroids on Road Network....................................... 35 2-3. Modify Node properties .................................................................................... 36
2-4. Re-run DTALite for the Subarea ...................................................................... 37 2-5. Subarea Calibration (Optional step) .................................................................. 37
Step 3: Export Subarea to Synchro ....................................................................................... 37 3-1. Use QEM to Estimate Initial Signals ................................................................ 37 3-2. Export to Universal Traffic Data Format (UTDF) files .................................... 38

CATER-UNR iii
3-3. Import UTDF files into Synchro ....................................................................... 39 3-4. Additional Adjustments in Synchro .................................................................. 40
6. Summary and Conclusion ...................................................................................................... 41
7. References .............................................................................................................................. 43

CATER-UNR iv
List of Figures
Figure 2-1 Cross-Resolution Simulation Framework ................................................................... 10
Figure 3-1 Relationship among different demand files ................................................................ 18
Figure 4-1 Subarea Conversion for Reno-Sparks Network .......................................................... 24
Figure 4-2 Subarea Conversion for Las Vegas Network .............................................................. 25
Figure 5-1 Las Vegas Network Loaded in TransCAD ................................................................. 26
Figure 5-2 Export Layer Dialogue ................................................................................................ 27
Figure 5-3 Establishing Relationship between Nodes and Links ................................................. 28
Figure 5-4 Export Demand Matrices from TransCAD ................................................................. 29
Figure 5-5 Beginning Section of input_GIS_settings.csv............................................................. 31
Figure 5-6 NeXTA File Loading Status Window ......................................................................... 32
Figure 5-7 Illustration of Imported Network in NeXTA .............................................................. 32
Figure 5-8 Model Selection for Running Traffic Assignment ...................................................... 34
Figure 5-9 Illustration of Subarea Boundary for the Sample Network ......................................... 35
Figure 5-10 Perform Subarea Cut in NeXTA ............................................................................... 35
Figure 5-11 Modify Node Properties in NeXTA .......................................................................... 36
Figure 5-12 Run Quick Estimation Method (QEM) to Generate Initial Signals .......................... 38
Figure 5-13 Export Subarea to UTDF Format .............................................................................. 38
Figure 5-14 Import the Subarea into Synchro ............................................................................... 39
Figure 5-15 Illustration of imported network in Synchro ............................................................. 39

CATER-UNR v
List of Tables
Table 2-1 Node Control Types in NeXTA ................................................................................... 12
Table 3-1 Essential Network Input Files ...................................................................................... 15
Table 3-2 Input Demand Files ...................................................................................................... 17
Table 3-3 Optional Input Files ...................................................................................................... 19
Table 3-4 Input Files of Scenario.................................................................................................. 20
Table 3-5 DTALite Output Files................................................................................................... 21
Table 3-6 NEXTA Output Files .................................................................................................... 22
Table 5-1 Configurations for Link Type ....................................................................................... 30
Table 5-2 Configurations for input_node_control_type.csv ......................................................... 31

CATER-UNR 1
Abstract
This research aims to develop a conversion method to extract a portion of a travel demand network
in TransCAD for constructing a consistent subarea of interest, and then convert it into a
microscopic simulation in Synchro/SimTraffic.
TransCAD in nature is a macroscopic travel demand modeling tool. Synchro/SimTraffic provides
detailed microscopic traffic analysis. Dynamic Traffic Assignment models serve as a mesoscopic
tool for traffic analysis, which lie between TransCAD and Synchro. To convert a TransCAD model
into Synchro for micro-simulation, the conversion method we propose is to use NeXTA/DTALite
software package as an intermediate tool to generate a dynamic trip assignment (DTA) model,
which will produce a network profile consistent with TransCAD as well as detailed traffic flows
ready for Synchro to import from.
Using this method, a DTA model is developed based on the network in TransCAD model. A
subarea of interest is then defined in NeXTA. Three functions in NeXTA should be utilized before
a subarea extraction: node properties modification, virtual centroids treatment, and vehicle path
regeneration. Then the subarea can be extracted and exported as Synchro-compatible data sets
including node, link, volumes and signal information. Synchro/SimTraffic simulation is created
by importing these data sets and making necessary modifications.
The conversion method was tested for its functionality using the TransCAD model maintained by
the Regional Transportation Commission of Southern Nevada (RTCSN). Major conclusions and
some outstanding issues from the project are documented in this report. The report also includes a
User’s Manual for the conversion process.

CATER-UNR 2
Linking Travel Demand Modeling With Traffic Simulation Analysis (Phase II)
Executive Summary
The research project Linking Travel Demand Modeling with Micro- Simulation (Phase II) was
conducted over a nine-month period from August 2014 to April 2015. The project covered the
conversion from a TransCAD model to a subarea simulation in Synchro/SimTraffic for the Las
Vegas metropolitan area.
Travel demand forecasting and traffic simulation are two important components of transportation
studies. Travel demand forecasting models have typically been used for planning purposes for
future transportation systems at a macroscopic level. Traffic simulation tools are often used to
account for the movements of individual vehicles at a microscopic level. Traditionally, there has
been a disconnection between the macroscopic and microscopic levels. Transportation planners
who perform travel demand forecasts rarely get involved in the operational level, while traffic
engineers who conduct operational analysis using forecasted traffic demands often do not know
the underlying principles and constraints of travel demand models.
The desire to link travel demand models and traffic simulation models has been recognized by
transportation agencies and professionals. With the advent of computing technologies,
transportation agencies are increasingly adopting microscopic traffic simulation models for large-
scale design projects to obtain more detailed operational analyses. One critical issue that
transportation agencies often encounter is that constructing a microscopic simulation model from
scratch still consumes a significant amount of resources. Phase II of this research, following Phase
I of linking TransCAD models to VISSIM simulation, provides a conversion method to link
TransCAD models to Synchro/SimTraffic simulation. This conversion method uses the Dynamic
Traffic Assignment (DTA) tool to link the macroscopic and microscopic levels. NeXTA/DTALite
is a DTA software package that can import network profiles and travel demand data from
TransCAD, generate vehicle paths that are consistent with travel demand, extract subarea and
converts it to Synchro to initiate the simulation.
Typically three sets of data are required for micro-simulation, including roadway network, traffic
demand and traffic control information. TransCAD contains a majority of the network and demand
data needed for constructing a Synchro/SimTraffic model, except for the detailed lane
configurations at intersections. NeXTA/DTALite can automatically transfer network profile,
traffic volumes, and basic traffic control data from TransCAD to Synchro. The conversion initiates
a subarea model in Synchro. Additional data needed for Synchro/SimTraffic simulation to reflect
realistic traffic operation can be coded or generated in Synchro.
Methodology
A cross-resolution simulation method using NeXTA/DTALite as an intermediate tool was

CATER-UNR 3
Linking Travel Demand Modeling With Traffic Simulation Analysis (Phase II)
adopted. This method develops a DTA model that ensures consistency between TransCAD traffic
demand and Synchro vehicle flow, and allows users to easily define a subarea in the DTA model
and convert it to Synchro.
The conversions are carried out in three steps:
(1) Develop a DTA model by importing network data and OD matrices that were exported from
TransCAD, and then performing dynamic traffic assignment for the entire network.
(2) Extract a subarea, and convert the subarea to Synchro-compatible data formats. The key
features in the conversion are node properties modification, virtual centroids treatment, and vehicle
path regeneration.
(3) Export the data into Synchro to initiate a simulation network.
Findings and Conclusions
The test application demonstrated the integration of TransCAD, DTA, and Synchro as well as the
successful application of converting a TransCAD network to DTA, and a subarea from DTA to
Synchro. Results from the case study show significant time savings by using the proposed method
compared to traditional manual methods.
The positive features during this conversion process include the following:
Efficient conversion from a TransCAD model to a DTA model
NeXTA only requires a few configuration files and automatically converts the entire
network and assigns vehicle trips based on OD matrices from TransCAD. Future subarea
analysis and conversion can start from the DTA model, which saves the effort of converting
the TransCAD model again.
Easy creation and visualization of a subarea
The boundary of a subarea can be easily defined by drawing a boundary polygon. NeXTA
automatically extracts data within the subarea and creates all the necessary files for the
subarea to function as an independent network.
Automatic calibration with ODME
NeXTA/DTALite integrates a built-in ODME tool to match field link volumes to simulated
volumes, providing more accurate vehicle paths for both the entire network and subarea.
Initial signal estimation function by QEM
NeXTA provides an effort-saving tool using HCM’s Quick Estimation Method to
automatically estimate initial signal phasing and timing for a signalized intersection.

CATER-UNR 4
Linking Travel Demand Modeling With Traffic Simulation Analysis (Phase II)
Exporting a network from NeXTA to Synchro
NeXTA can successfully convert a network to a Synchro-compatible data format. This link
is beneficial to agencies as an effective conversion tool.
Exporting a network from Synchro to VISSIM
Synchro features a tool to convert its model to VISSIM simulation, which is a beneficial
linkage for traffic agencies if need for using VISSIM simulation arises.
Issues and special considerations during the test application of the project are documented as
follows:
Due to the different level of details in macroscopic and microscopic simulation, certain
details of road geometry are not available from TransCAD or DTA models. When lane-
related details (such as lane merging, lane widening and turning lanes) are desired to be
modeled in micro-simulation, manual efforts are still needed.
NeXTA/DTALite software package is in ongoing progress of feature developing and
improving, which may cause changes to software functions influencing the conversion
process or software stability.
Once the network is converted in Synchro, manual check and adjustment is desired to make
sure the simulation can be correctly run in SimTraffic. Adjustments may include node-link
connection, turning volumes balancing, and signal optimization.

CATER-UNR 5
Linking Travel Demand Modeling With Traffic Simulation Analysis (Phase II) Introduction
1. Introduction
1.1 Problem Statement
Travel demand forecasting models such as TransCAD have been used by MPOs and state DOTs
for planning future transportation systems. Most travel demand models only provide macroscopic
level analysis that is generally not sufficient to capture the operational details needed for
microscopic level analysis. For example, no travel demand model can so far provide accurate
operational analysis for signalized intersections by taking detailed signal timing and turn-lane
pockets into consideration. In these models, freeway operations are generally assessed based on
static empirical equations consisting of variables such as number of lanes, free-flow speed, and
vehicle composition.
Over the past two decades, computing technology has significantly advanced. Using microscopic
traffic simulation models is a common practice when large scale design projects are involved.
Microscopic simulation tools, such as Synchro/SimTraffic, account for the movements of
individual vehicles dynamically and stochastically in the network on a second-by-second basis and
provide more detailed information for microscopic level analysis. However, constructing a
microscopic simulation model from scratch still consumes a significant amount of resources. The
reason for adopting the macroscopic level analysis in travel demand models is mainly due to
constraints imposed by modeling large-scale transportation networks. For traffic operations
analysis and design, travel demand models do not satisfy the needed details.
In practice, there has been a disconnection between planners and traffic engineers. Transportation
planners who perform travel demand forecasts rarely get into the operational level. Similarly,
traffic engineers who conduct operational analysis using forecasted traffic demands often do not
know the underlying principles and constraints of travel demand models. Although planning
agencies always desire detailed traffic operational analyses, the significant effort involved in
constructing a traffic simulation model often prohibits such detailed simulation modeling.
State and local agencies often conduct corridor studies where detailed traffic operational analyses
are desired. Due to major efforts involved in constructing a traffic simulation model, corridor
studies are generally kept at the Highway Capacity Manual procedure level. Travel demand models
contain most of the data needed for constructing traffic simulation models. Additional data can be
added to most travel demand models using their data management tools. Expanding travel demand
models to microscopic simulation is anticipated to be a major trend in future transportation studies.
This research is specifically designed to address this need. A successful completion of the project
will significantly benefit RTC and other transportation agencies in saving effort to construct
microscopic simulation models.

CATER-UNR 6
Linking Travel Demand Modeling With Traffic Simulation Analysis (Phase II) Introduction
1.2 Background
The importance of linking the different levels of traffic model has long been recognized by
transportation agencies and professionals. A pioneer research was led by Dr. Van Aerde at Queens
University in Canada by developing the INTEGRATION software [1]. INTEGRATION is a
microscopic simulation model that uses similar information from travel demand models, such as
node and link information and an origin-destination matrix. INTEGRATION was developed under
the DOS operating system. Being innovative in linking travel demand modeling and micro-
simulation, this model once received well recognition from the transportation community.
Unfortunately, INTEGRATION stopped further development after Dr. Van Aerde passed away in
1998. Horowitz developed a meso/micro scale traffic simulator, which allows a region of micro
simulation to be defined within a larger, mesoscopic simulated Automated Highway Systems (AHS)
[2]. A layered organization of data was adopted for cross-resolution representation, which has a
network layer, link layer, coordination layer, regulation layer, and physical layer. The layered
organization greatly increases computational efficiency when conducting analysis from the vehicle
level to the traffic flow level. Burghout et al. developed hybrid traffic simulation models
integrating Mezzo, an event based mesoscopic model, and two microscope simulation models,
MITSIMLab and VISSIM respectively[3] [4]. In these hybrid simulation models, Mezzo is used to
simulate regional network and the subarea of specific interest is studied by micro simulators.
Consistency is given high priority in the integration of route choice, network representation, and
traffic dynamics, etc. Though a component based technique was applied in the integration of micro
simulators, some of the functionality had to be implemented in different way. Casas et al.
developed a hybrid simulation system which can provide both mesoscopic and microscopic
simulation runs [5]. A Meta-Event-Oriented Simulator was designed to synchronize both models.
It was reported that this hybrid approach can take advantage of the microscopic simulator’s
accuracy without sacrificing the computational benefits offered by the mesoscopic model. Li et al.
constructed a GIS-based multi resolution complex network, providing platform for the study of
the dynamic evolution of urban traffic network failures [6].
Over the past two decades, several commercial software packages have been developed to link
travel demand forecasting with traffic simulations. Caliper Corporation developed a software
package consisting of TransCAD and TransModeler. TransCAD is a GIS-based travel demand
model, and TransModeler is a micro simulation model. Both models use a similar user interface,
making the transition between the two models much easier. Another similar software package is
VISUM (travel demand) and VISSIM (simulation), both developed by PTV Inc. A VISUM
network can be directly converted into VISSIM using its export function. While these software
packages are considered a significant advancement in linking travel demand modeling with traffic
operations, the conversion is only possible between the models produced by the same developer.

CATER-UNR 7
Linking Travel Demand Modeling With Traffic Simulation Analysis (Phase II) Introduction
It does not address the common problem facing many transportation agencies, where the problem
is that the commonly used travel demand models and traffic simulation models used are normally
not from the same developer. For example, in Nevada, TransCAD is the primary travel demand
model, while VISSIM, CORSIM, and Synchro/SimTraffic are widely used traffic simulation
models. Each software package has its own strengths and weaknesses that made it suitable for
certain applications, depending on the type of transportation improvement or planning analysis
being considered. SimTraffic was found to be an easy-to-use model even for inexperienced model
users and its graphical interface resulted in coding times significantly shorter. Its ability to export
to CORSIM and VISSIM format also makes it an ideal starting point when creating more complex
networks. Transportation planners may wish to use Synchro/SimTraffic to conduct signal and
corridor studies[7].
To address the need for linking the transportation planning process and traffic operations analysis,
the FHWA developed a series of guides [8] [9]. One of the critical issues identified in the guides is
that the demands produced by travel demand models are not as capacity constrained as they need
to be in the simulation models. As a result, simulation models may produce unrealistic
performance measures when demand-higher-than-capacity conditions exist for the calibration year
or a future year. In this case, a travel demand model must be adjusted to more realistic levels to
reflect the physical limitations of the network. Adjustments can be accomplished by two
approaches: (1) outside of a travel demand model; and (2) within a travel demand model. The first
approach is traditional, and the second one requires an interface to allow additional user inputs
within the travel demand model.
Linking travel demand modeling and traffic simulation has been attempted in several large scale
transportation projects. However, very few published literature can be found to document these
projects. The New York City Department of Transportation developed a platform that links travel
demand forecasting, mescoscopic simulation, and microscopic simulation processes [9]. Their
experience with such an approach was quite rewarding, but also challenging. A significant effort
involved calibrating the simulation models using the forecasted traffic demands. A project in
California demonstrated an integrated planning-operation process on a managed lane facility (SR-
52) in San Diego, CA [11]. In this project, future demand was estimated from the regional travel
demand model, and the operational assessment was performed using a traffic simulation model.
To ensure that the traffic patterns in the two models were compatible, a customized static origin-
destination (OD) matrix was developed. An iterative process was used to balance the demand
between the elements of the facility, especially when traffic moved between the managed lanes
and the general purpose lanes. The final OD matrix provided an accurate estimate of future traffic,
allowing for the analysis of operational strategies on the managed lanes.
Another project found in the literature focused on evaluating work zone traffic control strategies

CATER-UNR 8
Linking Travel Demand Modeling With Traffic Simulation Analysis (Phase II) Introduction
using both a macroscopic planning level model and microscopic traffic simulation model [12]. The
study recommended the use of microscopic traffic simulation models for analyzing complex work
zone locations and detailed traffic control strategies. These studies all demonstrated the
significance and feasibility of combining travel demand modeling and traffic simulation, but they
also pointed out the many challenges associated with such a practice.
It is evident that the objectives of large scale transportation projects can be better met by combining
travel demand models and traffic simulation. However, there are both technical and theoretical
challenges when initiating such an integrated process. The lack of a linkage between travel demand
modeling and traffic simulation often presents a barrier between planners and engineers. Software
tools are needed to directly convert travel demand models to simulation models from different
developers.
1.3 Project Objective
Though many tools have been developed in this field, they are usually dedicated to a single type
of resolution which cannot satisfy the various modeling needs. Therefore, cross-resolution
conversion has become a hot topic in linking traffic planning models and traffic simulation models.
Though each of the resolution tools has its own advantages and applicable areas, it seems that none
of them alone is capable of conducting subarea studies. Therefore it is of high importance to
develop a multi-resolution simulation tool which can fulfill the need to conduct subarea studies.
However, it is reasonable to take advantage of the single resolution tools rather than building one
from scratch.
The primary objective of this research is to develop methodologies and software tools for linking
travel demand modeling and traffic simulations. Following Phase I of this research which
developed a tool converting TransCAD to VISSIM, Phase II of this study focuses on converting
TransCAD to Synchro/SimTraffic.

CATER-UNR 9
Linking Travel Demand Modeling With Traffic Simulation Analysis (Phase II) Modeling Methodologies
2. Modeling Methodologies
2.1 Cross-Resolution Simulation Method
Typically three sets of data are required for micro-simulation, including roadway network, traffic
demand, and traffic control information.
Network in TransCAD is represented by nodes and links, while in micro-simulation models
network usually consists of nodes, links and lanes. TransCAD contains a majority of the network
profiles needed for constructing a Synchro/SimTraffic model, except for the detailed lane
configurations. Although TransCAD may store number of lanes for each link, it lacks the required
level of detail to reflect lane merging, lane widening and more detailed turning lane configurations
at intersections. Thus a link-based network should be expanded to a lane-based network to achieve
the required level of detail in Synchro/SimTraffic. NeXTA/DTALite can automatically transfer
node and link profile from TransCAD to Synchro, however some more details require additional
adjustments in Synchro interface.
Traffic demand in Synchro/SimTraffic is represented by turning volumes at each node, unlike
VISSIM or CORSIM which requires OD matrices and routes. TransCAD models have assigned
trips in the entire network, and they need to be extracted as turning volumes within a subarea
consistent with the original network. NeXTA/DTALite can import OD matrices from TransCAD,
perform dynamic trip assignment that matches the trips in TransCAD, and export the trips in a
subarea.
As a macroscopic tool, TransCAD does not analyze detailed traffic control information either at
nodes or along the links. Some TransCAD models may contain traffic control type as an attribute
of nodes but are usually limited to certain general types (eg. stop control, no control, signalized,
etc). Micro-simulation tools, on the contrary, look into traffic control information reflecting real
practice as closely as possible. The level of detail requires additional data that TransCAD does not
provide. HCM 2010 Quick Estimation Method can be utilized in this research to generate
intersection signal data for simulation. Synchro is also capable of initiating signal data needed for
SimTraffic simulation.
Based on the data sets requirement for Synchro/Simtraffic and data availability in TransCAD, three
critical issues in TransCAD-to-Synchro conversion are addressed in the research. First, a link-
based TransCAD network needs to be expanded to a lane-based network. Second, traffic volumes
need to be regenerated within subarea to reflect vehicles’ specific routes. Third, signal control data
need to be generated or coded for simulation. The conversion process includes the following
functions:

CATER-UNR 10
Linking Travel Demand Modeling With Traffic Simulation Analysis (Phase II) Modeling Methodologies
1. Define and extract a subarea network.
2. Check node properties and make modifications if needed.
3. Reconstruct virtual centroids in the subarea.
4. Regenerate and extract vehicle paths in the subarea consistent with original traffic volumes.
The consistency of network topology and vehicle dynamics should be maintained at all times
when converting from the macro to the micro level. Figure 2-1 shows the main conversion process
and the mapping between objects of different resolutions.
Nodes
Links
Centroids
Network
TransCAD
ModelSynchro Model
Network
Conversion
Vehicle Path
Assignment
Vehicles
OD Matrix
Nodes
Lanes
Turn Pockets
Centroid
Reconstruction
Network
Sources/Sinks
Side Streets
Extraction &
Conversion
Vehicles
Turning Volume
Signal timing
Figure 2-1 Cross-Resolution Simulation Framework
A universal macro-level planning model consists of a network and aggregated vehicle behaviors,
as shown in the left column of Figure 2-1. There are both physical nodes/links and virtual centroids
in the network. Data needed by a typical micro-simulation tool can also be categorized into
network data, vehicle data and signal timing data, as shown in the right column of Figure 2-1, with
different resolution requirements. For example, the micro-level network should be lane-based;
each individual vehicle should have its own behavior. The center column in Figure 2-1 shows the
framework of the conversion process from macro-level to the micro-level model. The network
conversion module expands physical nodes into intersections, and links into roads. Virtual
centroids are reconstructed into vehicle sources and sinks. Turning volumes are needed for
generating appropriate signal timing.

CATER-UNR 11
Linking Travel Demand Modeling With Traffic Simulation Analysis (Phase II) Modeling Methodologies
A mesoscopic traffic assignment is conducted to obtain the path flows. In an extracted subarea,
although link volumes are the same as the original network, they cannot be used directly in Synchro.
Therefore, the light-weight traffic assignment tool DTALite is used to generate path flows and
convert them into turning volumes.
2.2 Conversion Process
The conversion process is carried out in three steps.
1. Develop a DTA model by importing network data and OD matrices that were exported
from TransCAD, and then performing dynamic traffic assignment for the entire network.
2. Extract a subarea, and convert the subarea to Synchro-compatible data formats. The key
features in the conversion are node properties modification, virtual centroids treatment, and
vehicle path regeneration.
3. Import the data in Synchro to initiate a simulation network.
The first step is the development of DTA model for the entire TransCAD network. In this step, the
network data from TransCAD is exported in the format of shape files, and the OD matrice are
saved as plain text files. Field names in shape files may be different from those used in NEXTA.
Therefore, the configuration file is proposed, which could be edited to map the field data between
TransCAD and NeXTA. And then the shape files can be directly imported into NEXTA. Together
with the plain text format OD matrix, all necessary data for the traffic assignment process is ready
to produce vehicle paths needed for microsimulation.
The next and essential step of the conversion is to define a subarea, convert the network and vehicle
data of the subarea to Synchro. Link volumes in TransCAD are not enough to run microsimulation.
Instead, specific vehicle paths or turning volumes at intersections need to be provided. In the case
of Synchro/SimTraffic simulation, turning volumes are required. This step is accomplished by
utilizing many features in NeXTA/DTALite package. Control type can be modified for modes in
the subarea. Virtual centroids will be converted into physical nodes. A dynamic assignment
algorithm will produce the vehicle paths based on the original OD matrix. Finally a well-prepared
subarea can be exported in the format compatible to Synchro.
The last step of the conversion is to import the data sets in Synchro to initiate a simulation subarea
network. It’s expected for users to make adjustments in Synchro to reflect realistic situation before
running SimTraffic simulation. Adjustments may be needed for turning pockets configuration,
signal timing and network connection check.
2.2.1 DTA Model Development

CATER-UNR 12
Linking Travel Demand Modeling With Traffic Simulation Analysis (Phase II) Modeling Methodologies
A dynamic traffic assignment (DTA) model can be developed given the network and traffic
demand from TransCAD. The DTA tool used in this project is NeXTA/DTALite package.
NeXTA reads Origin-Destination (O-D) demand data and associated network with Traffic
Analysis Zone (TAZ) profiles. Then the DTALite assigns vehicles to different paths based upon
varied link travel time across a section of time. Such assignment achieves equilibrium according
to time-dependent shortest path algorithm or other assignment rules, constrained to a set of speed-
density relationship and capacity of links and to the traffic signal timing (if any) at each node.
Model calibration is optional for the purpose of the conversion, but is preferred if data availability
allows.
2.2.2 Subarea Extraction and Conversion
Microscopic simulation models are typically employed to represent finer resolution of traffic
dynamics by simulating the movement of individual vehicles [14]. They are usually applied to
analyze traffic operations in a local area, often limited to corridor level evaluations. Synchro is not
designed for analyzing large-scale network nor is it practical to convert the entire TransCAD
network into Synchro. Therefore, the conversion only applies to a subarea network (either a
corridor or smaller area). Users can define a subarea in NeXTA by drawing the boundaries and
performing subarea cut. Once the subarea of interest is defined, the following functions should be
included in order to generate data needed for Synchro/SimTraffic simulation.
Node Properties Modification
As mentioned in earlier sections, some TransCAD models may contain traffic control type as an
attribute of nodes. It is necessary to check the node data provided in TransCAD and make
modifications accordingly. NeXTA categorizes node control types into eight types. Table 2-1 lists
the node control types available in NeXTA.
Table 2-1 Node Control Types in NeXTA
Control Type Code Control Type Name
0 Unknown
1 No Control
2 Yield Sign
3 Two Way Stop Control
4 Four Way Stop Control
5 Pretimed Signal
6 Actuated Signal
7 Roundabout
Depending on the original node data in TransCAD, users need to check the node properties in
NeXTA, verify if the coded control types are consistent with actual traffic operation, or manually

CATER-UNR 13
Linking Travel Demand Modeling With Traffic Simulation Analysis (Phase II) Modeling Methodologies
code in node control types if such data was absent in the TransCAD model. For example, if
TransCAD only categorizes node types as signalized and unsignalized, users need to specify which
control type listed in Table 2-1 a node falls into.
This step is necessary to produce more accurate trip assignment results and later to estimate signal
timing.
Virtual Centroids Treatment
Regional travel demand models (TDMs), such as TransCAD models, are typically applied for
regional or large-area transportation planning. Local roads and streets are generally not modeled
in these planning models. Local roads and connectors are usually aggregated into TAZs. Centroids
and connectors of a Traffic Analyzing Zones (TAZs) are virtual objects carrying trip production,
attraction and transferring between the real traffic networks.
How virtual objects should be treated is essential in the conversion process. If virtual centroids and
connectors are left untreated in conversion from TransCAD to microsimulation, centroids and points
where connectors are joined into the physical network will become intersections, therefore some
unrealistic vehicle paths may occur. For example, some paths may be routed through a zone centroid
which should be avoided in micro-simulation.
The common methods used in the conversion are introduced in the final report of Linking Travel
Demand Modeling with Micro-Simulation (Phase I). This report will not repeat the methods but only
introduce the method that is applied in this project. NeXTA integrates a tool “Generate Physical Zone
Centroids on Road Network”. This tool converts the zonal connectors to side streets within the subarea,
and replaces zone centroids with additional nodes so that no paths can be routed through a zone centroid.
Executing this tool ensures the resulting subarea is compatible with Synchro and consistent with the
original network.
Vehicle Path Regeneration
Once the subarea is cut, it’s recommended to perform dynamic traffic assignment by executing
DTALite to regenerate vehicle paths for the subarea. The vehicle path regeneration process can, if data
availability allows, include ODME (Origin Destination Matrix Estimation) calibration to match link
counts to simulated volumes.
Since a typical TransCAD model does not contain signal information, NeXTA can approximate signal
phasing and timing using the HCM’s QEM. This step is optional in the conversion process because
Synchro can also generate signal timing once the network and travel demand data is provided.
CATER-UNR 14
Linking Travel Demand Modeling With Traffic Simulation Analysis (Phase II) Modeling Methodologies
2.2.3 Exporting Subarea into Synchro/SimTraffic
After the subarea is defined and the above mentioned process is done, the subarea can be exported to
Synchro and PTV Vissim for further analysis.
NeXTA is capable of writing its network data in the UTDF CSV format that is compatible with
Synchro. Some manual adjustments and data verification may still be needed in Synchro.

CATER-UNR 15
Linking Travel Demand Modeling With Traffic Simulation Analysis (Phase II) Data Structure
3. Data Structure
This chapter describes the data structure used in NeXTA and DTALite. Input data files are the
required data for developing a DTA model. Output data are the DTA model results associated
with both the entire network and subarea.
3.1 Input Data
Input files used in NEXTA and DTALite can be categorized into network input files, demand input
files, optional input files, and scenario input files.
3.1.1 Network input files
The necessary components for the traffic model are zones, links, and nodes. Each of these elements
needs to be defined with certain attributes which must have assigned values. In DTALite and
NEXTA, the network input files define the basic node-link structure, along with attributes for each
link and node. Additionally, nodes are related to zones and activity locations, which can be used
to disaggregate trips from zones to nodes and activity locations.
Table 3-1 lists the essential input files describing the network.
Table 3-1 Essential Network Input Files
Essential Files Description Required Attributes Corresponding
Information Layer
input_node.csv Defines all nodes in the network node_id, x, y Node Layer
input_node_
control_type.csv
Definition for the control type of
the nodes
input_node_type,
input_node_type_name
Node Layer
input_link.csv Defines all links in the network link_id, from_node_id,
to_node_id, length,
speed_limit,
number_of_lanes,
lane_capacity
Link Layer
input_zone.csv Definition for the link types in the
network
zone_id Zone Layer, that can
be created by users

CATER-UNR 16
Linking Travel Demand Modeling With Traffic Simulation Analysis (Phase II) Data Structure
input_activity_
location.csv
Defines zones in the network
Used to visualize zones in KML
and Google Fusion Tables
zone_id, activity
location
Activity Location
Layer
input_link_type.
csv
Defines how nodes are connected
to zones
Input_link_type Link Type
Definition: default
file is available
1. Node Layer (input_node.csv and input_node_control_type.csv)
The input_node.csv file is an essential input data, which can be exported from TransCAD. The
input_node_control_type.csv file is pre-defined to describe the control type of the node. In these
files the nodes in the network are defined by the terms of names, ID numbers, control type,
location/position, and geometry.
Each node has a unique node ID. The node ID value must match the values used in the “From
Node” and “To Node” terms in the link attribute table.
The control type is to designate what kind of control device is used in an intersection. And each
control type is also identified with a unique value. Eight control types are provided in CCT as
default: unknown control, no control, yield sign, 2-way stop sign, 4-way stop sign, pre-timed signal,
actuated signal, and roundabout.
2. Link Layer (input_Link.csv and input_link_type.csv)
The input_link.csv file defines all links in the network, along with corresponding characteristics
and traffic flow model input data. And it can also be exported from TransCAD. Several options
are included in modeling microscopic simulations. The input_link_type.csv file is defined for the
link types of the links in the network. Both files include essential input data. In these files the links
in the network are defined by link ID, from node, to node, direction, length in miles, number of
lanes, speed limit, lane capacity, link type, jam density, and wave speed.
The link ID is expressed as an integer, and each link is identified by a unique number. The
“from_node_id” and “to_node_id” item separately correspond to the node ID of the beginning
node to the ending node of the link. And the numbers must match the values assigned to that node
in the node attribute table. The direction attribute defines the direction of the link, in which 0 is
stands for a two-way link, and 1 stands for a stand for one-way link. The length in miles is a double
type of data, describing the length of the link between end nodes. The number of lanes defines the
number of lanes on the link in each direction. The speed limit attribute is an integer defining the
free-flow speed (miles per hour) on the link. In default conditions, the link will be automatically
assigned a speed of 5 m/h. The lane capacity defines the capacity of a link in vehicles per hour per

CATER-UNR 17
Linking Travel Demand Modeling With Traffic Simulation Analysis (Phase II) Data Structure
lane.
The link type is an assigned integer to describe the type of link. It should be categorized based on
the street type. In general, there are 12 kinds of link types defined by default in the table: freeway,
highway, principal arterial, major arterial, minor arterial, collector, local, frontage roads, ramps,
zonal connector, transit link, and walking link. Users are allowed to define their own specific link
types as long as the flag variables are correctly used to identify how the different links are
connected or related. Furthermore, the link type is also used to determine how the links are
visualized in the windows of NEXTA.
3. Zone Layer (input_zone.csv and input_activity_location.csv)
The input_zone.csv file defines zones in the network. It is also used to visualize zones in KML
and Google Fusion Tables. Another file named input_activity_location.csv is used to map the
nodes to a zone, where multiple nodes may be associated with a zone.
The network files should be exported separately with each character, and all of them need to be
saved in the same folder. The folder is from which the simulation will run, and to which all input
and output files will be written.
3.1.2 Demand input files
Demand files are needed by DTALite as traffic assignment input files, to describe the number of
trips between two given zones in a network. Table 3-2 lists the input demand files. The minimum
required demand file is input_demand_meta_data.csv which provides demand table definition,
and the associated demand files that are defined in input_demand_meta_data.csv.
Table 3-2 Input Demand Files
File Name Description
input_demand_meta_data.csv Defines the characteristics of demand data to be loaded by
DTALite
input_demand_type.csv Defines the characteristics for different demand types for the trips
in the demand files
input_vehicle_type.csv Defines different vehicle types for emissions analysis
input_vehicle_emission_rate.csv Defines a lookup-table used for emissions analysis
input_VOT.csv Defines different VOT distributions for different demand types
1. Demand (input_demand_meta_data.csv, input_demand_type.csv, and associated demand tables)
In NeXTA, The input_demand_meta_data.csv file is the hub for providing demand to zone
directly. It defines which file(s) should be used for demand information, and how the files are
formatted. It presents the time-dependent Origin -Destination (OD) Demand Matrix, which is used

CATER-UNR 18
Linking Travel Demand Modeling With Traffic Simulation Analysis (Phase II) Data Structure
by DTALite for a traffic assignment. Users can add the multiple demand files in the
demand_meta_data.csv file to specify time-dependent demand profiles. In the file, the start_time
and end_time defines the demand files working in the corresponding time interval.
The input_demand_type.csv file gives the information about number of demand types and
demand type number for input_demand_meta_data.csv. It defines different demand type
characteristics for the trips in the input_demand.csv file. Three different demand types are set by
default. For 1 = SOV, 2 = HOV, 3 = Trucks, and additional types can be defined by the user.
Figure 3-1 shows the relationship among different relevant files.
Figure 3-1 Relationship among different demand files
2. Vehicle Parameters (input_vehicle_type.csv and input_vehicle_emission_rate.csv)
The input_vehicle_type.csv file defines the vehicle types used in the traffic model. Five vehicle
types are defined by default: 1 = passenger car, 2 = passenger truck, 3 = light commercial truck, 4
= single unit long-haul truck, and 5 = combination long-haul truck.
The input_vehicle_emission_rate.csv file defines a lookup-table used for emissions analysis. In
the table, the relationship is mapped between emission rates and energy, under vehicle types and
operating modes. The CCT provides default values based on empirical data and other research,
however, the users is allowed to modify the energy consumption levels and emission rates of
different vehicle types. By this form, NEXTA can create the quantity of CO2, CO, NOX, and HC
emissions.
3. Driver Parameter (input_VOT.csv)
The input_VOT.csv file is used to define different values of time distributions for different
demand types. Refer to the sample Excel import tables in the Sample_Excel_Import_Files folder
CATER-UNR 19
Linking Travel Demand Modeling With Traffic Simulation Analysis (Phase II) Data Structure
for some practical formulations in calculating VOT based on trip purposes. Like other files
assigned a default value, this file also allows the user to define the value of time distributions
across different demand types.
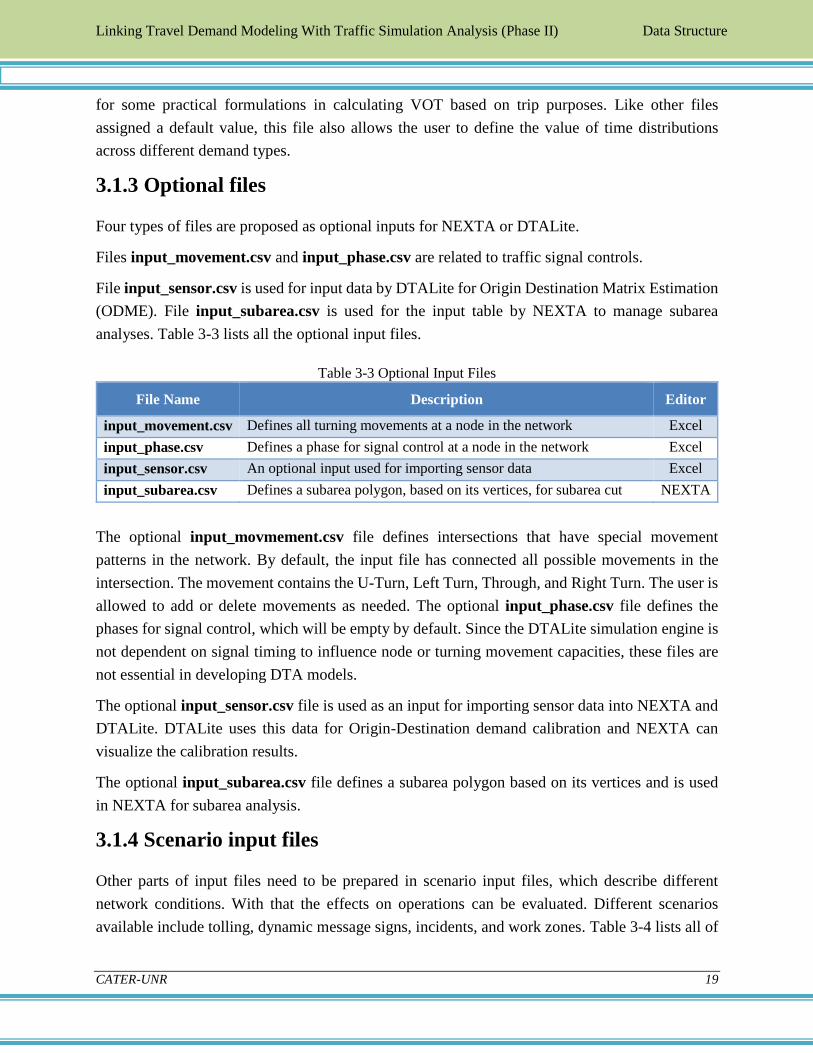
3.1.3 Optional files
Four types of files are proposed as optional inputs for NEXTA or DTALite.
Files input_movement.csv and input_phase.csv are related to traffic signal controls.
File input_sensor.csv is used for input data by DTALite for Origin Destination Matrix Estimation
(ODME). File input_subarea.csv is used for the input table by NEXTA to manage subarea
analyses. Table 3-3 lists all the optional input files.
Table 3-3 Optional Input Files
File Name Description Editor
input_movement.csv Defines all turning movements at a node in the network Excel
input_phase.csv Defines a phase for signal control at a node in the network Excel
input_sensor.csv An optional input used for importing sensor data Excel
input_subarea.csv Defines a subarea polygon, based on its vertices, for subarea cut NEXTA
The optional input_movmement.csv file defines intersections that have special movement
patterns in the network. By default, the input file has connected all possible movements in the
intersection. The movement contains the U-Turn, Left Turn, Through, and Right Turn. The user is
allowed to add or delete movements as needed. The optional input_phase.csv file defines the
phases for signal control, which will be empty by default. Since the DTALite simulation engine is
not dependent on signal timing to influence node or turning movement capacities, these files are
not essential in developing DTA models.
The optional input_sensor.csv file is used as an input for importing sensor data into NEXTA and
DTALite. DTALite uses this data for Origin-Destination demand calibration and NEXTA can
visualize the calibration results.
The optional input_subarea.csv file defines a subarea polygon based on its vertices and is used
in NEXTA for subarea analysis.
3.1.4 Scenario input files
Other parts of input files need to be prepared in scenario input files, which describe different
network conditions. With that the effects on operations can be evaluated. Different scenarios
available include tolling, dynamic message signs, incidents, and work zones. Table 3-4 lists all of

CATER-UNR 20
Linking Travel Demand Modeling With Traffic Simulation Analysis (Phase II) Data Structure
the scenario input files.
Table 3-4 Input Files of Scenario
File Name Description
scenario_link_based_toll.csv Defines the location and characteristics of tolls in the
simulation
scenario_dynamic_message_sign.csv Defines the location and characteristics of variable message
signs in the simulation
scenario_incident.csv Defines the location and characteristics of incidents in the
simulation
scenario_work_zone.csv Defines the location and characteristics of work zones in the
simulation
The scenario_link_based_toll.csv file is used to define different scenario tolling conditions on a
road segment in the simulation. Currently, three classes of vehicles (Single Occupancy Vehicles,
High Occupancy Vehicles, and Trucks) are defined for different toll pricing, and each of vehicles
is assigned the charge to travel across the link.
The scenario_dynamic_message_sign.csv file defines the location and characteristics of the
message signs in the simulation, which will influence driver’s route choice. The response
percentage is provided in a table to describe the real time information displayed on the sign.
The scenario_incident.csv file is used to define the location and characteristics of incidents in the
simulation. They may include any conditions which will reduce the capacity, and also can be
applied for general incidents.
The scenario_work_zone.csv file is used to define the location and characteristics of work zones
in the simulation, which is described in terms of capacity reduction (%), project duration and speed
reduction.
3.2 Output Data
After the dynamic assignment is executed, the results are recorded in forms of output files. A series
of .csv files are created in the project folder. Every output file contains detailed information on
certain aspects in the simulation. There are two parts of output data from DTALite output and
NEXTA export, which include information such as measures of effectiveness (MOEs), travel time,
speed, traffic volume, and queuing. Furthermore the output data offer several spatial resolutions
(link, path, OD, and network) in time-dependent and static forms. Additional non-MOE
information, such as traffic assignment log data and the results of post-processing functions for
evaluating emissions, safety, and travel time reliability, is also available through the output files.

CATER-UNR 21
Linking Travel Demand Modeling With Traffic Simulation Analysis (Phase II) Data Structure
3.2.1 DTALite output files
Table 3-5 lists all of the DTALite output files.
Table 3-5 DTALite Output Files
File Name Type Description
output_summary.csv Scenario Contains detailed information about traffic
assignment iteration results
output_multi_scenario_results.csv Scenario Contains the simulation results for multi-
scenario results
output_agent.csv Vehicle
/agent
Shows the specific information of each agent in
the simulation network
agent.bin Vehicle
/agent
A binary version of output_agent.csv file
output_ODMOE.csv OD Contains ODMOE simulation results
output_pathMOE.csv Path Contains the specific information of path MOE
output_linkMOE.csv Network Contains detailed results from the simulation
aggregated at each link
output_linkTDMOE.csv Network Contains less detailed results from the
simulation, aggregated at each link
output_linkTDMOE.bin Network A binary version of output_linkTDMOE.csv
output_MovementMOE.csv Network Describes the MOE information of movement
output_NetworkTDMOE.csv
Network Contains time-dependent, network-level
information about assignment iteration results
over the modeling horizon
output_vehicle_emission_MOE_
summary.csv
Network Describes all results from emissions post-
processing
The output_summary.csv and output_multi_scenario_results.csv files are related to the
scenario analysis. The former one contains detailed information about traffic assignment results,
primarily related to travel time and origin-destination estimation; the latter one contains the
simulation results for multi-scenario results.
The output_agent.csv file is provided to show specific information of each individual vehicle in
the simulation network. The data is saved as a .csv file for better data processing. The agent.bin
file is a binary version of the output_agent.csv file. The binary file is helpful in saving space, and
can be renamed as input_agent.bin file as vehicle/path input into DTALite.
The output_ODMOE.csv file contains information about the demand and assignment results,
which is aggregated over the modeling horizon for each origin-destination pair, disaggregated by

CATER-UNR 22
Linking Travel Demand Modeling With Traffic Simulation Analysis (Phase II) Data Structure
departure time.
The output_pathMOE.csv file contains specific information for path MOE. The output data
describes each individual vehicle and its characteristics, its path in the network, and some of its
path characteristics, such as its traveling distance.
The output_linkMOE.csv and output_linkTDMOE.csv files record the results from the
simulation aggregated at each link, including safety and emissions data. More over the second file
contains time dependent link MOE information about assignments in the network. The
output_linkTDMOE.bin file is a binary version of the output_linkTDMOE.csv file to save the
storage space. NEXTA will use this file to load DTALite simulation results for visualization. The
output_MovementMOE.csv file is used to describe the MOE information of vehicle movement
for all nodes in the network. The output_NetworkTDMOE.csv file contains time-dependent,
network-level information about assignment iteration results over the modeling horizon, primarily
related to cumulative flow into and out of the simulation. The output vehicle_
emission_MOE_summary.csv file describes all results from emissions post-processing,
disaggregated to emission estimates for each individual vehicle in the simulation.
3.2.2 NEXTA output files
The output files in NEXTA are listed in Table 3-6.
Table 3-6 NEXTA Output Files
File Name Type Description
AMS_OD_table.csv Subarea cut Outputs the OD time span volume
AMS_path_flow.csv Subarea cut Outputs the path flow
AMS_movement.csv Subarea cut Outputs the number of vehicles making movements in the
intersections
AMS_link.kml Exporting For Google Earth visualization
AMS_link shape files Network For GIS visualization
UTDF files Exporting Files generated during Synchro exports
VISSIM ANM files Exporting Files generated during VISSIM exports
The AMS_OD_table.csv file describes the OD time span volume. The AMS_path_flow.csv file
describes the path flow. The AMS_movement.csv file describes the movement information of
vehicles between different nodes in the simulation. The movement is recorded as a three-node key,
which describe when the movement starts at the first node, passes through the middle node, then
arrives at the third node. The AMS_link.kml and several AMS_link shape files (dbf, shp, shx) are
used to visualize different software, such as Google Earth and GIS. The UTDF and VISSIM ANM
files are respectively used to export the result to Synchro and VISSIM. With the help of these files,

CATER-UNR 23
Linking Travel Demand Modeling With Traffic Simulation Analysis (Phase II) Data Structure
the CCT can ensure consistency between the TransCAD traffic assignment and simulated flow in
VISSIM.
3.3 Settings Files
There are some files that users can define for NeXTA/DTALite settings. Default settings files are
provided, but users can change the values if needed.
1. Scenario settings file (input_scenario_settings.csv)
The input_scenario_settings.csv file is the essential input data for NEXTA. The scenario contains
several attributes, such as number of assignment days, demand multiplier, traffic flow model, and
traffic assignment method. The user is allowed to alter the attributes of the scenarios, as well as
create various traffic scenarios that can be run simultaneously. Furthermore, the user is allowed to
alter 12 different attributes for each scenario.
2. MOE settings file (input_MOE_settings.csv)
The input_MOE_settings.csv file is the essential input data for NEXTA. This file is used to set
the measure of effectiveness (MOE). It allows the user to evaluate the effectiveness of the entire
network or smaller sections of a network and to identify the threshold value of user-defined links,
paths, and origin-destination pairs.
3. DTA settings file (DTASettings.txt)
The DTASettings.txt file is used to modify the configuration settings for running DTALite. There
are several sections in this file, such as GUI, background image, assignment, simulation, emission,
output, traveler information, input check, and safety planning configuration.
4. ODME settings file (ODME_Settings.txt)
The ODME_Settings.txt file is used to define the setting for the Origin-Destination Matrix
Estimation (ODME) used by DTALite. This file allows the user to alter some of the ODME
characteristic. Some of the default options are provided to the user. They can be changed by the
user for a practical situation; however, the default options should be sufficient for majority of users.

CATER-UNR 24
Linking Travel Demand Modeling With Traffic Simulation Analysis (Phase II) Case Study
4. Case Study
To test the functionality and assist the users throughout the conversion process, the TransCAD
model of Renp-Sparks area is used as a case study for the conversion process. Later the TransCAD
model of Las Vegas metropolitan area is used. The user’s manual will be provided based on the
Las Vegas network.
4.1 Reno-Sparks Network
Reno-Sparks DTA model was created based on a TransCAD model. The DTA Model was
calibrated against field link volumes data on primary arterials and freeways using the built-in
ODME tool.
Following the conversion steps (the details can be found in the next chapter – User’s Manual), a
selected subarea network near University of Nevada, Reno was converted into VISSIM as shown
in Figure 4-1.
Figure 4-1 Subarea Conversion for Reno-Sparks Network
Figure 4-1 shows a general extraction and conversion process. The subarea was extracted from the
NeXTA (Up), then it was converted into a Synchro model (Middle), and a selected intersection
was zoomed in to display its details (Bottom). While additional effort is needed to modify
intersection geometry, the conversion is able to initiate a basic Synchro model and to reduce the
effort of building a model from scratch.

CATER-UNR 25
Linking Travel Demand Modeling With Traffic Simulation Analysis (Phase II) Case Study
4.2 Las Vegas Network
Similar to Reno-Sparks network, the Las Vegas TransCAD DTA model was created based on the
network and demand data from its TransCAD model.
Because the detailed data provided in the two TransCAD models are different, the conversion
process requires more steps for Las Vegas network. For example, since node control type is not
provided in Las Vegas TransCAD model, users need to specify node control type for each node in
the subarea before vehicle path regeneration. Generally the more detail available in TransCAD,
the less effort will be needed in the conversion process.
Figure 4-2 shows a corridor converted from NeXTA to Synchro.
Figure 4-2 Subarea Conversion for Las Vegas Network

CATER-UNR 26
Linking Travel Demand Modeling With Traffic Simulation Analysis (Phase II) User’s Manual
5. User’s Manual
This User’s Manual provides detailed steps from a TransCAD model to a subarea simulation in
Synchro. The sample network used in the manual is Las Vegas network. In this chapter, the terms
“Las Vegas network” and “the sample network” are interchangeable.
The software needed in this process include Caliper’s TransCAD, NeXTA/DTALite package, and
TranfficWare’s Synchro. Users should install these software before attempting to convert any
network.
Step 1: DTA Model Development
1-1. Export Network and Demand from TransCAD
1) Load the network in TransCAD
The Las Vegas network was coded in TransCAD and must be exported as a set of shape files. The
network should be loaded in TransCAD by opening file TransCAD data\1225assign.wrk under
the project folder. The Las Vegas network is shown in Figure 5-1.
Figure 5-1 Las Vegas Network Loaded in TransCAD

CATER-UNR 27
Linking Travel Demand Modeling With Traffic Simulation Analysis (Phase II) User’s Manual
Figure 5-2 Export Layer Dialogue
By using the export tool in TransCAD to export the network GIS shape files, the network is split
into multiple component layers and saved as separate shape files. When exporting, the user should
first select the layer name from the drop-down list highlighted in Figure 5-1, then use
Tools→Export to export the selected layer as a GIS shape file. The output files should be named
and saved in a new folder for future use.
2) Export node layer
To export the node layer, the user should select the node layer named “RTP13_35_2010_nodes”
in the highlighted area shown in Figure 5-1, in the next pop-up dialogue (Figure 5-2) choose
Tools→Export, and for the output type choose “ESRI Shape”, then click the OK button. The
output file can be named as “node.shp”.
3) Export link layer
To export the link layer, the user should first select the link layer named “RTP13_35_2010” in the
highlighted area shown in Figure 5-1, and then click the New Dataview icon , to show the
records of the link. The records indicate that the Las Vegas TransCAD model does not contain the
relationship between nodes and links in the properties, therefore a connection between nodes and
links that needs to be established.

CATER-UNR 28
Linking Travel Demand Modeling With Traffic Simulation Analysis (Phase II) User’s Manual
(a) Formula Field (b) Node Formula Fields
(c) Relationship between nodes and links
Figure 5-3 Establishing Relationship between Nodes and Links
Left click the Formula Field icon in the Dataview window to show the Formula (Figure 5-
3a). Click the Node Fields Button, the properties dialog is displayed (Figure 5-3b). Choose the ID
item, and the “Both” option, and then click OK. The relationship between nodes and links has
been created in the form shown in the red rectangle in Figure 5-3c.
Choose Tools→Export, and choose “ESRI Shape”, then click the OK button. Save the file in the
same folder as the node layer and name it. The file can be named as “link.shp”.
4) Export OD matrix
NeXTA can read demand data in column format, matrix format, full matrix format, Dynasmart
format. In the case of Las Vegas network, this manual introduces the steps to export demand data
as matrix format.
The TransCAD demand data are located under folder \TransCAD data with .mtx as file extensions.
Open a matrix file in TransCAD, go to Matrix→Export tool (Figure 5-4a). In the next window,
select "Export to a table with one record for each cell, with a field for each matrix" option and

CATER-UNR 29
Linking Travel Demand Modeling With Traffic Simulation Analysis (Phase II) User’s Manual
select the matrices to be exported in the Matrices to Include in the list box, choose OK (Figure
5-4b). When saving the exported file, choose “Comma-delimited Text (*.txt; *.csv)” from the
Files of type drop down list (Figure 5-4c). Repeat the steps for each OD matrix that should be
included in the DTA model.
(a) Exporting Matrix in TransCAD
(b) Matrix Export Option in TransCAD (c) Save Matrix
Figure 5-4 Export Demand Matrices from TransCAD
5) Save exported files in a convenient location
As a result of the exporting steps, all the shape files and demand matrices are created. It’s
recommended to save all the files in a folder that’s convenient for future use. For the sample
network, the exported files are all located under folder \Las_Vegas_Shapefiles and the demand
files are saved in \Las_Vegas_Shapefiles\demand_data folder.

CATER-UNR 30
Linking Travel Demand Modeling With Traffic Simulation Analysis (Phase II) User’s Manual
1-2. Import Network into NeXTA
The next step to develop the DTA model is to use NeXTA’s network import tool to convert the
network shape files. In order for NeXTA to interpret the shape files for conversion, a configuration
initialization (INI) file needs to be prepared to map field names between the shape files and the
NeXTA format (which includes a series of CSV files).
1) Prepare configuration files for NeXTA
The required configuration files include (1) input_node_control_type.csv, (2)
input_link_type.csv, (3) input_demand_meta_data.csv (and related demand files), and (4)
import_GIS_settings.csv. To ensure that NeXTA imports a correct network profile, in this step
the user needs to update the configurations of link types, node control types and GIS settings.
Link types to be imported into NeXTA should be consistent with the types used in original
TransCAD network. If the TransCAD network has a different list of link types than the default
values given in the NeXTA configuration files, input_link_type.csv file needs to be updated to
reflect the current types. For the sample network, the updated link type is shown in Table 5-1.
Table 5-1 Configurations for Link Type
link_type link_type_name type_code default_lane_capacity
0 external links c 99999
1 system to system ramp r 1000
2 minor arterial a 1000
3 major arterial a 1000
4 ramp r 1000
5 interstate f 1000
6 freeway f 1000
7 expressway/beltway a 1000
8 collector a 1000
9 centroid connector c 1000
10 local a 1000
11 HOV lanes a 1000
14 transit link t 1000
15 transit access link t 1000
The input_node_control_type.csv file should also be updated with the current control type,
especially for signalized intersections. Codes for control types must be consistent with the settings
in network profile exported from TransCAD. For the sample network, since TransCAD does not
contain control type data for nodes, it is not necessary to update the file according to TransCAD
model. However the file is still needed for later use. Table 5-2 shows the configuration used for

CATER-UNR 31
Linking Travel Demand Modeling With Traffic Simulation Analysis (Phase II) User’s Manual
the sample network.
Table 5-2 Configurations for input_node_control_type.csv
control_ type_name
unknown_ control
no_ control
yield_ sign
2way_ stop_sign
4way_ stop_sign
pretimed_ signal
actuated_ signal
roundabout
control_ type
0 1 2 3 4 5 6 7
The import_GIS_settings.csv file is to identify and connect the fields in the input shape file to
the AMS data hub schema data format, allowing NeXTA to read the network geometry from
shapefiles and create an AMS data hub compatible transportation network project (.tnp) file (which
is readable by both DTALite and NeXTA). Figure 5-5 shows a screenshot of the beginning section
of the GIS setting file.
All the prepared configuration files for the Las Vegas sample network are located in the
\Las_Vegas_Shapefiles folder.
Figure 5-5 Beginning Section of input_GIS_settings.csv
2) Use NeXTA’s import network tool to convert the network
Starting with a new empty network project in NeXTA, the import was initiated by using
NeXTA’s Import GIS Planning Data Set tool under Menu→File→Import→GIS Planning
Data Set.
After the successful conversion process, NeXTA displays a "File Loading Status" window as
shown in Figure 5-6.

CATER-UNR 32
Linking Travel Demand Modeling With Traffic Simulation Analysis (Phase II) User’s Manual
Figure 5-6 NeXTA File Loading Status Window
The final imported Las Vegas network is shown in Figure 5-7.
Figure 5-7 Illustration of Imported Network in NeXTA

CATER-UNR 33
Linking Travel Demand Modeling With Traffic Simulation Analysis (Phase II) User’s Manual
3) Save the new network as a new project file
The last step is to create a new destination folder and to save the network as a new network project
(File→Save Project As) in the created folder, and the new network can now be manipulated
through NeXTA. It should be noted that if there are multiple OD tables (see next section), the user
needs to manually add multiple OD demand files to the new project folder.
For the sample network, the new project folder is named \Las_Vegas_DTAmodel.
1-3. Read Network and Demand Data into NeXTA
Similar to the INI file, the input_demand_meta_data.csv file is used by NeXTA to find and read
the O-D tables exported from TransCAD models. This metadata file requires several entries, but
the relevant entries include the following:
• File name: specifies the demand file name to be read (e.g. demand_data\da0-7.csv is the
first demand file of the sample network).
• Format: specifies the data format of the demand file (e.g. matrix is the format of all demanf
files of the sample network).
• Number of lines to be skipped: specifies the number of lines in the demand file to be skipped by
DTALite (e.g. 0 for the sample network demand files).
• Start and end times: the loading start time and end time for the demand file. (e.g. minutes
420 or 7am).
The prepared input_demand_meta_data.csv file for the sample network is located in
\Las_Vegas_DTAmodel folder. The OD matrices files are located in \Las_Vegas_DTAmodel
\demand_data folder.
1-4. Run Assignment with DTALite to Equilibrium
The dynamic traffic assignment simulation is performed by DTALite which is directly accessed
by pressing the Run Simulation button located in the toolbar menu. Simulation settings
should be edited in the input_scenario_settings.csv file prior to initiating the assignment engine.
The popup window that appears shows the defined settings, and allows a selection of the traffic
flow model, traffic assignment method, the number of iterations, and the demand loading
multiplier, as shown in Figure 5-8. When the selections are made, pressing “Run Simulation”

CATER-UNR 34
Linking Travel Demand Modeling With Traffic Simulation Analysis (Phase II) User’s Manual
button will start the DTA simulation.
DTALite is an efficient simulation engine. For the sample network with 20 simulation runs for
about 310,000 vehicles, DTALite took 9 hours 23 minutes of computational time on an Intel®
Core i7-3630QM T7500 (2.4 GHz) with 32 GB RAM. It’s recommended to run DTA simulation
in more powerful work stations within much shorter time.
Figure 5-8 Model Selection for Running Traffic Assignment
Step 2: Subarea Extraction and Conversion
Before converting the DTA model to Synchro, the user needs to define a subarea or corridor that
fits Synchro’s simulation ability. The original Las Vegas network is too large for Synchro to handle,
neither practical for microscopic simulation analysis. NeXTA simplifies the subarea creation
process by automatically handling extraction of necessary nodes, links, zones, and O-D tables.
2-1. Cut a Subarea within the Larger Network
Using Edit→Create Subarea tool in NeXTA, a subarea boundary can be drawn around the
subarea of interest. The boundary must be a closed polygon. Figure 5-9 shows the defined subarea
in the test process. The links and nodes within the boundary are highlighted, which allows a visual
assessment of the boundary so that adjustments can be made if needed.

CATER-UNR 35
Linking Travel Demand Modeling With Traffic Simulation Analysis (Phase II) User’s Manual
Figure 5-9 Illustration of Subarea Boundary for the Sample Network
Right click in the main display frame, then select Perform Subarea Cut (Figure 5-10a), the tool
will automatically removed all of the network objects (nodes and links) outside of the subarea
boundary and extracted links, nodes, zones, O-D pairs, and subarea path records. A message
window will pop out when subarea cut is finished (Figure 5-10b).
(a) The”Perform Subarea Cut” Button (b) Subarea Cut Result Window
Figure 5-10 Perform Subarea Cut in NeXTA
The subarea needs to be saved as a new project in a separate folder. The sample subarea was saved
in the \subarea folder.
2-2. Generate Physical Zone Centroids on Road Network
The Generate Physical Zone Centroids on Road Network Tool under Tools→Network Tools
in NeXTA converts the zonal connectors to side streets within the network. This tool replaces zone
centroids with additional nodes so that no paths can be routed through a zone centroid. While
DTALite cannot use paths through zone centroids, other AMS software tools such as Synchro and
PTV VISSIM do not make such distinctions. Executing this command ensures that the resulting
network is compatible with Synchro.

CATER-UNR 36
Linking Travel Demand Modeling With Traffic Simulation Analysis (Phase II) User’s Manual
2-3. Modify Node properties
Depending on the level of details in TransCAD model, there may be need to modify node
properties such as node control type and cycle length. The sample network does not contain node
control type, therefore in the test conversion process, the user needs to specify node control type
for all the nodes within the subarea.
To check and modify node properties, the user needs to turn on Node layer (by checking the box)
the layer manager frame and make it active (by clicking on Node), as shown in Figure 5-11a.
Check node attributes by left clicking on any node. The attributes will display in the lower left
frame (Figure 5-11b). To change the attributes of a node, right click on the node, then select View
Node Properties for Selected Node in the menu (Figure 5-11c). In the Node Properties windows,
users can change Control Type to reflect field practice (Figure 5-11d).
(a) Set Node Layer as Active (b) Quick Review of Node Properties
(c) Right-click Menu for a Node (d) Node Properties Window
Figure 5-11 Modify Node Properties in NeXTA

CATER-UNR 37
Linking Travel Demand Modeling With Traffic Simulation Analysis (Phase II) User’s Manual
2-4. Re-run DTALite for the Subarea
To ensure a consistent vehicle path assignment within the subarea, dynamic traffic assignment
should be run again on the subarea network. This can be done by clicking the Run Simulation
button . Simulation settings can be reviewed and users can choose preferred models. After
clicking the button, DTALite will run and perform dynamic traffic assignment for the subarea.
2-5. Subarea Calibration (Optional step)
If field data availability (e.g. link volumes) allows, it’s recommended to perform model calibration
for the subarea. NeXTA/DTALite features a built-in demand adjustment tool named ODME for
model calibration. The objectives of ODME is to better match simulated link volumes to observed
field data.
For the Las Vegas network, due to the lack of field data for this project, model calibration was not
performed.
Step 3: Export Subarea to Synchro
After dynamic traffic assignment (and ODME process) is done for the subarea, the subarea is ready
to be exported to Synchro for further analysis. Since a typical TransCAD model does not contain
signal information, NeXTA can approximate signal phasing and timing using HCM’s QEM. This
approach was used in this test before exporting the network to Synchro®. The procedure for
exporting a subarea network for microscopic analysis is as follows.
3-1. Use QEM to Estimate Initial Signals
An automated QEM spreadsheet is used to generate initial signal phasing and timing for the
subarea network. NeXTA writes the geometry and volume information to the spreadsheet, the
spreadsheet calculates appropriate phasing and timing data, and then NeXTA reads that phasing
and timing data back into its files.
QEM application consists of two files, QEM_Signal_Hub_ver2.xlsm and QEM_v2.xls. They
should be both placed in the subarea project folder.
In order to estimate initial signals for the subarea, the user should open file
QEM_Signal_Hub_ver2.xlsm, and click on the button as shown in Figure 5-12 to run.

CATER-UNR 38
Linking Travel Demand Modeling With Traffic Simulation Analysis (Phase II) User’s Manual
Figure 5-12 Run Quick Estimation Method (QEM) to Generate Initial Signals
All the result files QEM generates are located in the same project folder of the subarea.
3-2. Export to Universal Traffic Data Format (UTDF) files
NeXTA is capable of writing its network data in UTDF that is compatible with Synchro. When
QEM analysis finishes, re-open the subarea file in NeXTA.
Go to menu File – Export – Microscopic Network and Traffic Control Data, and choose “Generate
Synchro Universal Traffic Data Format files” (Figure 5-13a), in the next pop-up dialog (Figure 5-
13b), click “No” to generate sequential node numbers.
(a)
(b)
Figure 5-13 Export Subarea to UTDF Format

CATER-UNR 39
Linking Travel Demand Modeling With Traffic Simulation Analysis (Phase II) User’s Manual
Conversion files will be stored in a folder named Exporting_Synchro_UTDF under the subarea
project folder.
3-3. Import UTDF files into Synchro
The import should be carried out using the import tool under Synchro menu Transfer — Data
Access — Version 6 data Access (Figure 5-14).
Figure 5-14 Import the Subarea into Synchro
The imported network in Synchro is shown in Figure 5-15.
Figure 5-15 Illustration of imported network in Synchro

CATER-UNR 40
Linking Travel Demand Modeling With Traffic Simulation Analysis (Phase II) User’s Manual
3-4. Additional Adjustments in Synchro
There would be possible manual adjustments needed in Synchro before running simulation in
SimTraffic. These adjustments, depending on the specific network, may include but not limited to:
1) Geometry modification, e.g. node-link connection, lane configuration, turning pockets
configuration, and side street modification;
2) Turning volumes balancing, and
3) Signal optimization.
These adjustments help the network reflect real traffic conditions as closely as possible, so the
resulting simulation would best present traffic performance.

CATER-UNR 41
Linking Travel Demand Modeling With Traffic Simulation Analysis (Phase II) Summary and Conclusion
6. Summary and Conclusion
This project proposed a cross-resolution method to convert a macroscopic TransCAD model to a
microscopic subarea simulation model in Synchro. The test application demonstrated the
integration of TransCAD, DTA, and Synchro as well as the successful application of converting a
TransCAD network to DTA, and a subarea from DTA to Synchro.
The positive features during this conversion process include the following:
Efficient conversion from a TransCAD model to a DTA model: During the conversion,
NeXTA automatically converts the entire network and assigns vehicle trips on the network
based on the OD matrices from TransCAD. This function was a significant time saver since
the conversion only requires a few configuration files prepared with the templates available.
Once the DTA model is developed, future subarea analysis and conversion can start from
this DTA model to Synchro, which also saves effort from converting TransCAD model
again.
Easy creation and visualization of a subarea: The boundary of a subarea can be defined in
NeXTA by drawing boundary polygon in the network display window. Once the boundary
is defined, NeXTA automatically extracts the data within the subarea and creates all the
necessary files for the subarea to function as an independent network.
Automatic calibration with ODME: NeXTA/DTALite integrates a built-in ODME tool to
match field link volumes to simulated volumes. This tool is capable of providing more
accurate vehicle paths for both the entire network and subarea.
Initial signal estimation function by QEM: NeXTA provides a tool using HCM’s Quick
Estimation Method to automatically estimate initial signal phasing and timing for a
signalized intersection. It is effort-saving for traffic analysts to start the Synchro simulation.
Exporting a network from NeXTA to Synchro: NeXTA can successfully convert a network
to a Synchro-compatible data format. This link is beneficial to agencies as an effective
conversion tool.
Exporting a network from Synchro to VISSIM: Synchro features a tool to convert its model
to VISSIM simulation, which is a beneficial linkage for traffic agencies if need for using
VISSIM simulation arises.
Issues and special considerations during the test application of the project are documented as
follows:
Due to the different level of details in macroscopic and microscopic simulation, certain
details of road geometry are not available from TransCAD or DTA models. When lane-

CATER-UNR 42
Linking Travel Demand Modeling With Traffic Simulation Analysis (Phase II) Summary and Conclusion
related details (such as lane merging, lane widening and turning lanes) are desired to be
modeled in micro-simulation, manual efforts are still needed.
NeXTA/DTALite software package is in ongoing progress of feature developing and
improving, which may cause changes to software functions influencing the conversion
process or software stability.
Once the network is converted in Synchro, manual check and adjustment is desired to make
sure the simulation can be correctly run in SimTraffic. Adjustments may include node-link
connection, turning volumes balancing, and signal optimization.

CATER-UNR 43
Linking Travel Demand Modeling With Traffic Simulation Analysis (Phase II) References
7. References
1. Aerde, M. V. (1992). “INTEGRATION: A Dynamic Traffic Simulation/assignment Model.”
Paper presented at the IVHS Dynamic Traffic Assignment and Simulation Workshop,
Federal Highway Administration.
2. Horowitz R. (2004). Development of Integrated Meso/Microscale Traffic Simulation
Software for Testing Fault Detection and Handling in AHS. California PATH Research
Report, UCB-ITS-PRR-2004-19.
3. Burghout, W., Koutsopoulos, H., and Andréasson, I. (2005). Hybrid Mesoscopic-
Microscopic Traffic Simulation. Transportation Research Record.
4. Burghout, W. and Wahlstedt, J. (2007). Hybrid Traffic Simulation with Adaptive Signal
Control. Transportation Research Record.
5. Vilar J. C., Torday A., and Gerodimos A (2010). Combining Mesoscopic and Microscopic
Simulation in an Integrated Environment as a Hybrid Solution. IEEE Intelligent
Transportation Systems Magazine.
6. Li Y. S., Liu G., Zhang S. Y. (2012). Multi-granularity Complex Network Model Based on
GIS. Journal of Southwest Jiaotong University.
7. Sullivan, Andrew J., et al. (2004). Traffic simulation software comparison study. Vol. 2217.
University Transportation Center for Alabama..
8. Dowling, R., Huang, A. Sterner, K., and Jeannotte, K. (2009). “Applying Analysis Tools in
Planning for Operations: Case Study#4- Application of Microsimulation in Combination
with Travel Demand Models.” Federal Highway Administration, U.S. Department of
Transportation, FHWA-HOP-10-005.
9. Jeannotte, K., Sallman, D., Margiotta, R., and Howard, M. (2009). “Applying Analysis Tools
in Planning for Operations.” Federal Highway Administration, FHWA-HOP-10-001.
10. Papayannoulis, V. and Marsico,M. (2011). “An Integrated Travel Demand, Mesoscopic, and
Microscopic Modeling Platform to Assess Traffic Operations for Manhattan, New York.”
The 13th Transportation Applications Conference, Transportation Research Board.
11. El Khoury, J. and Bloomberg, L. (2009). “Integrated Demand Estimation and Traffic
Operations Analysis Approach for Managed Lane Facilities.” Compendium of the 88th
Annual Meeting of the Transportation Research Board, Washington, D.C.

CATER-UNR 44
Linking Travel Demand Modeling With Traffic Simulation Analysis (Phase II) References
12. Smadi, A. and Baker, J. (2008). “Integrating Planning and Operations Models to Predict
Work Zone Traffic.” Advanced Traffic Analysis Center, Upper Great Plains Transportation
Institute, North Dakota State University, Fargo.
13. Zhen (Sean) Qian, and Michael Zhang (2012). On centroid connectors in static traffic
assignment: their effects on flow patterns and how to optimize their selections [J].
Transportation Research Part B.
14. Sbayti, H. and Roden, D. (2010).Best Practices in the Use of Micro Simulation Models.
NCHRP 8-36 Task 90.