Linking Synoptic Climatology to Hydrologic Responses in Upstate New York and Western New England
37
Linking Synoptic Climatology to Hydrologic Responses in Upstate New York and Western New England • Created by: • David Thomas, University at Albany, SUNY A COMET project between the University at Albany, SUNY and National Weather Service Forecast Office, Albany N.Y. February 2003
description
Linking Synoptic Climatology to Hydrologic Responses in Upstate New York and Western New England. A COMET project between the University at Albany, SUNY and National Weather Service Forecast Office, Albany N.Y. Created by: David Thomas, University at Albany, SUNY. February 2003. - PowerPoint PPT Presentation
Transcript of Linking Synoptic Climatology to Hydrologic Responses in Upstate New York and Western New England
Linking Synoptic Climatology to Hydrologic Responses in Upstate New York and Western New England
• Created by:
• David Thomas, University at Albany, SUNY
A COMET project between the University at Albany, SUNY and National Weather Service Forecast Office, Albany N.Y.
February 2003
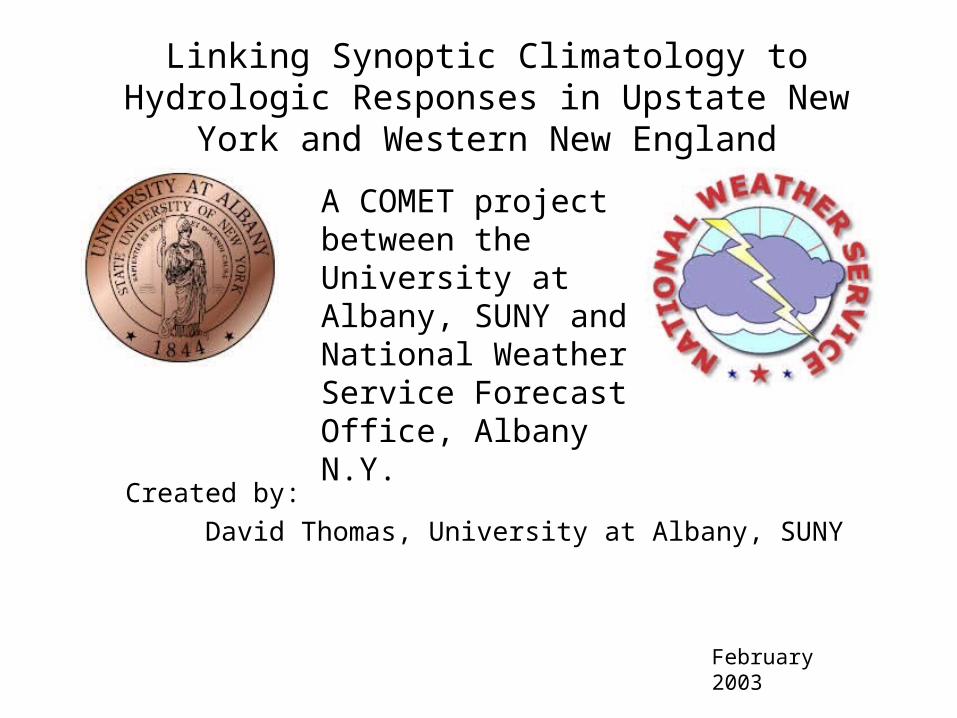
Location of Stations
625 COOP stations from New York State and adjoining counties were used.
Time Frame:
1951 – 2000 November through April
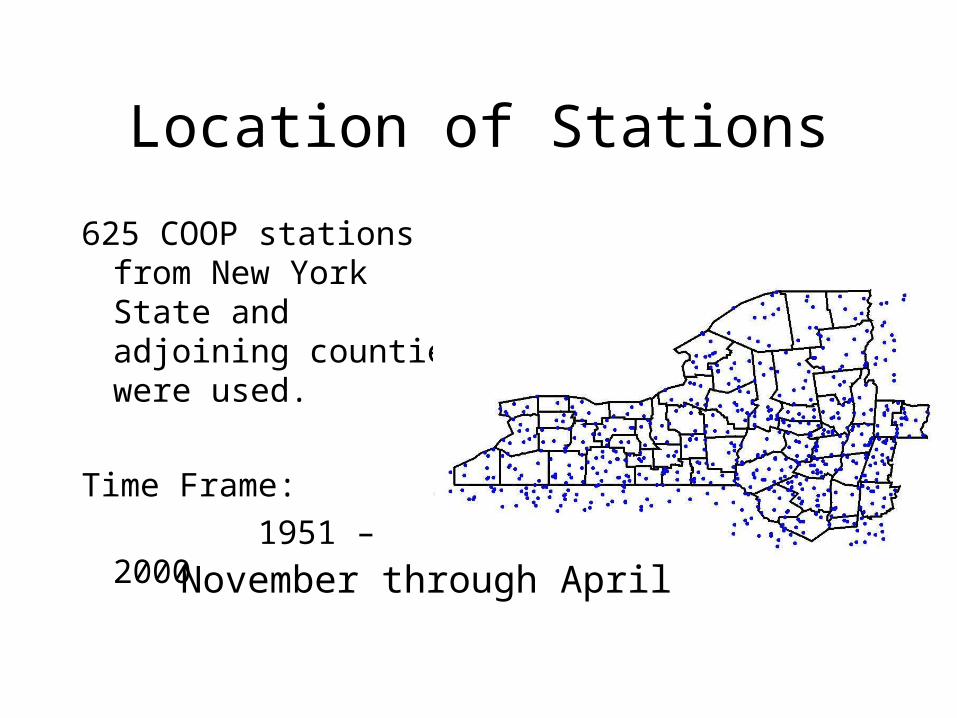
Elevation of Region
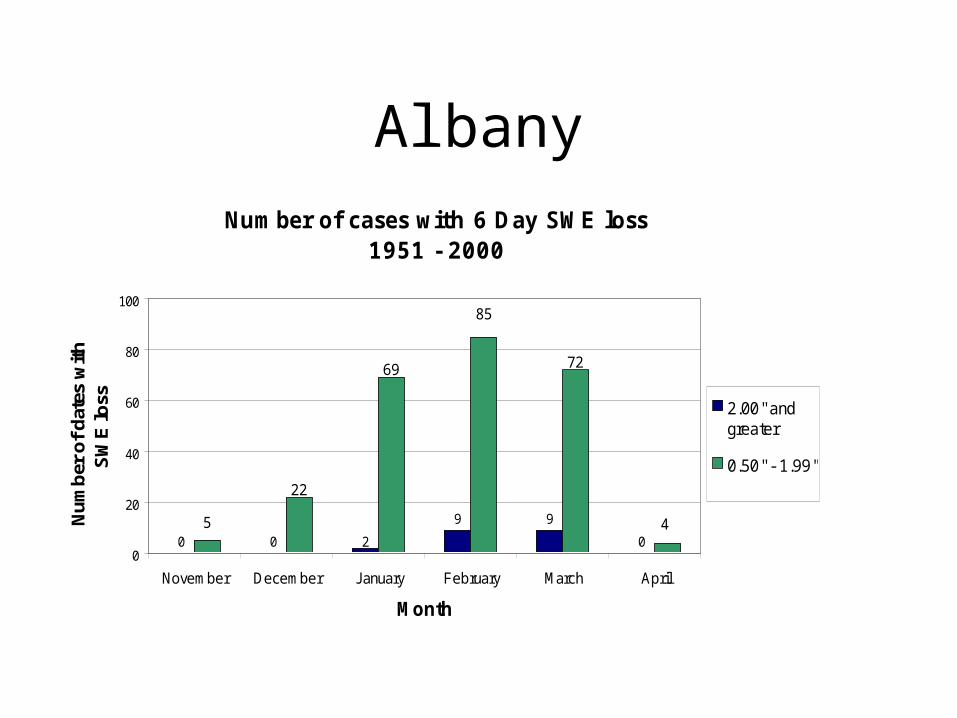
AlbanyNumber of cases with 6 Day SWE loss
1951 - 2000
0 0
9 9
02
7269
5 4
22
85
0
20
40
60
80
100
November December January February March April
Month
Nu
mb
er o
f d
ates
wit
h S
WE
loss 2.00'' and
greater
0.50'' - 1.99''
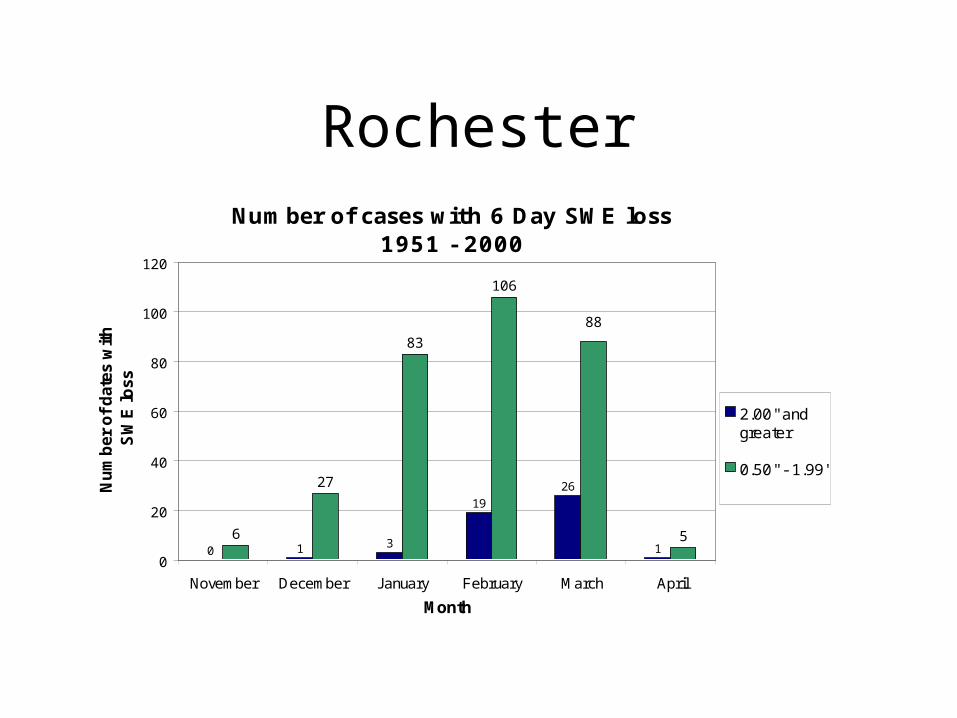
RochesterNumber of cases with 6 Day SWE loss
1951 - 2000
0 1 3
19
26
16
27
83
106
5
88
0
20
40
60
80
100
120
November December January February March April
Month
Nu
mb
er o
f d
ates
wit
h S
WE
loss
2.00'' andgreater
0.50'' - 1.99''
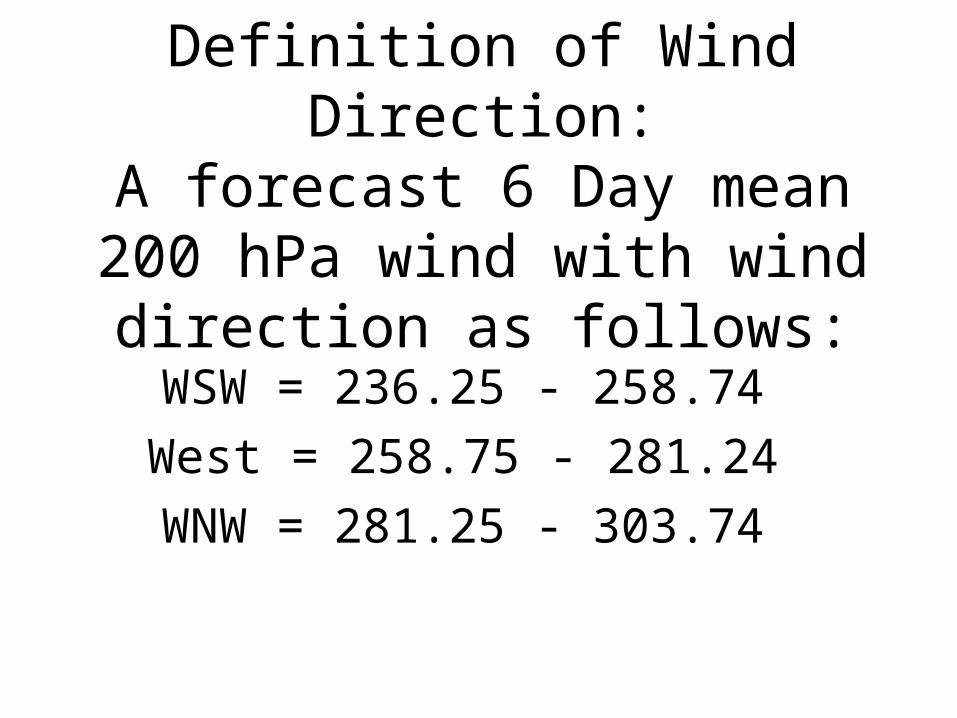
Definition of Wind Direction:A forecast 6 Day mean 200 hPa
wind with wind direction as follows:
WSW = 236.25 - 258.74
West = 258.75 - 281.24
WNW = 281.25 - 303.74
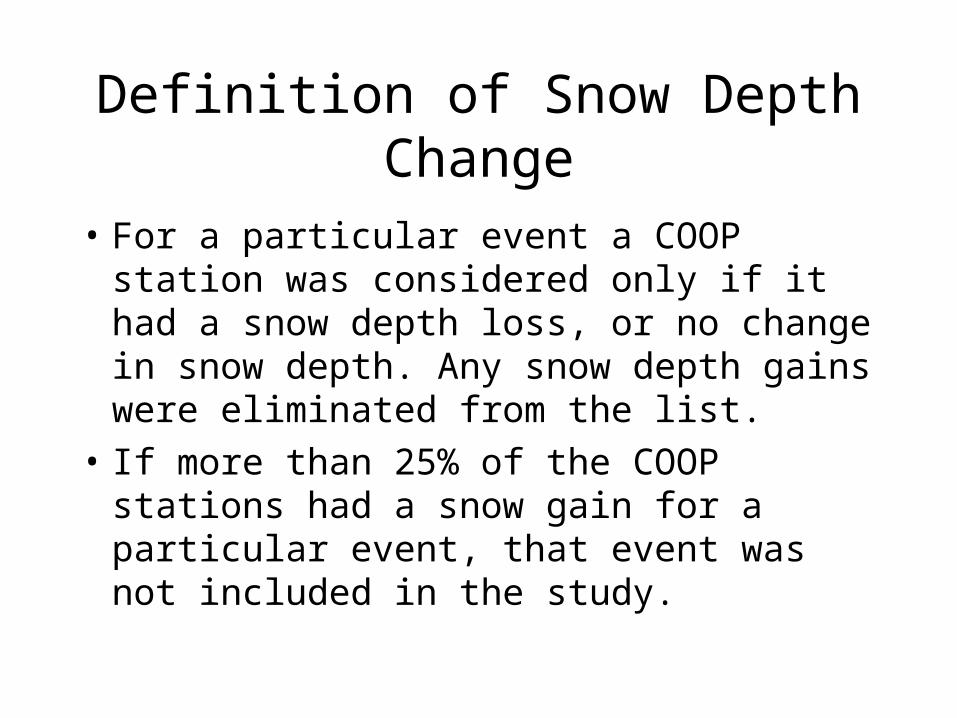
Definition of Snow Depth Change
• For a particular event a COOP station was considered only if it had a snow depth loss, or no change in snow depth. Any snow depth gains were eliminated from the list.
• If more than 25% of the COOP stations had a snow gain for a particular event, that event was not included in the study.
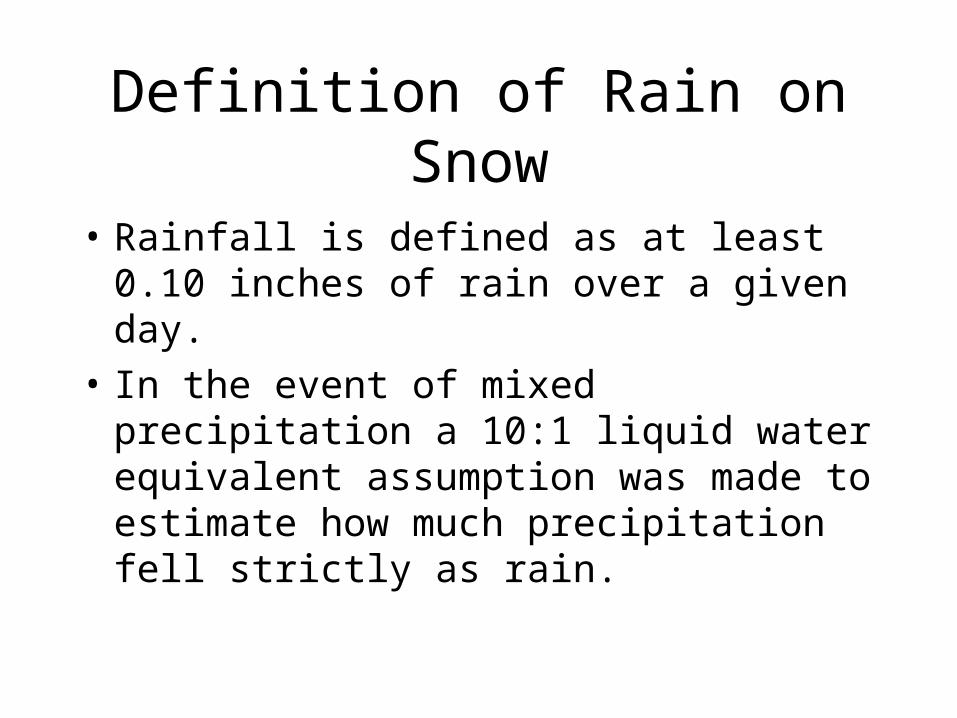
Definition of Rain on Snow
• Rainfall is defined as at least 0.10 inches of rain over a given day.
• In the event of mixed precipitation a 10:1 liquid water equivalent assumption was made to estimate how much precipitation fell strictly as rain.
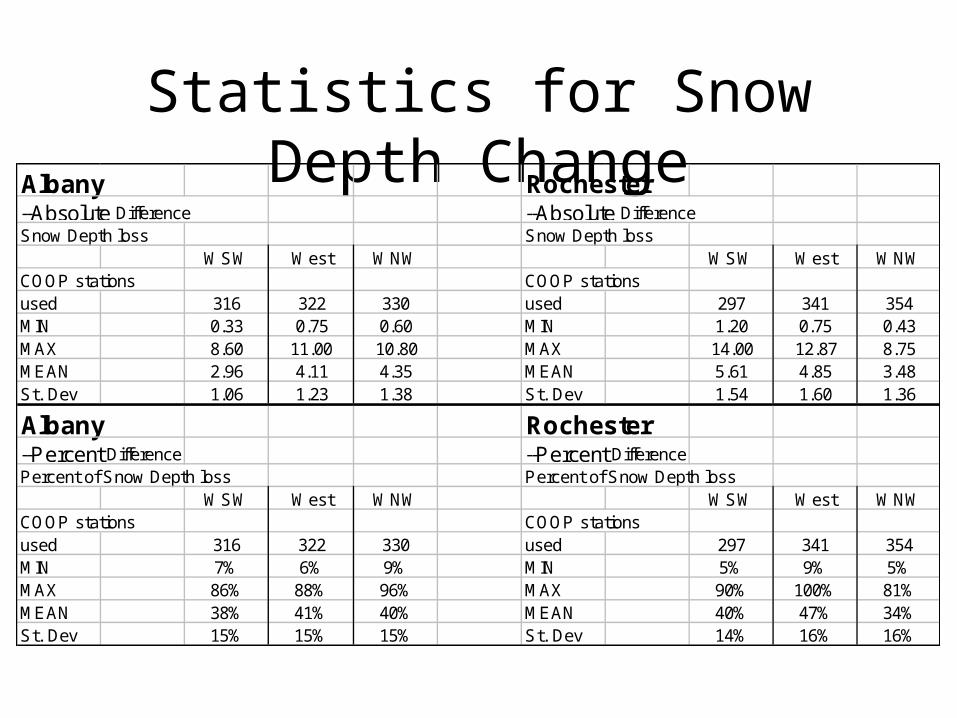
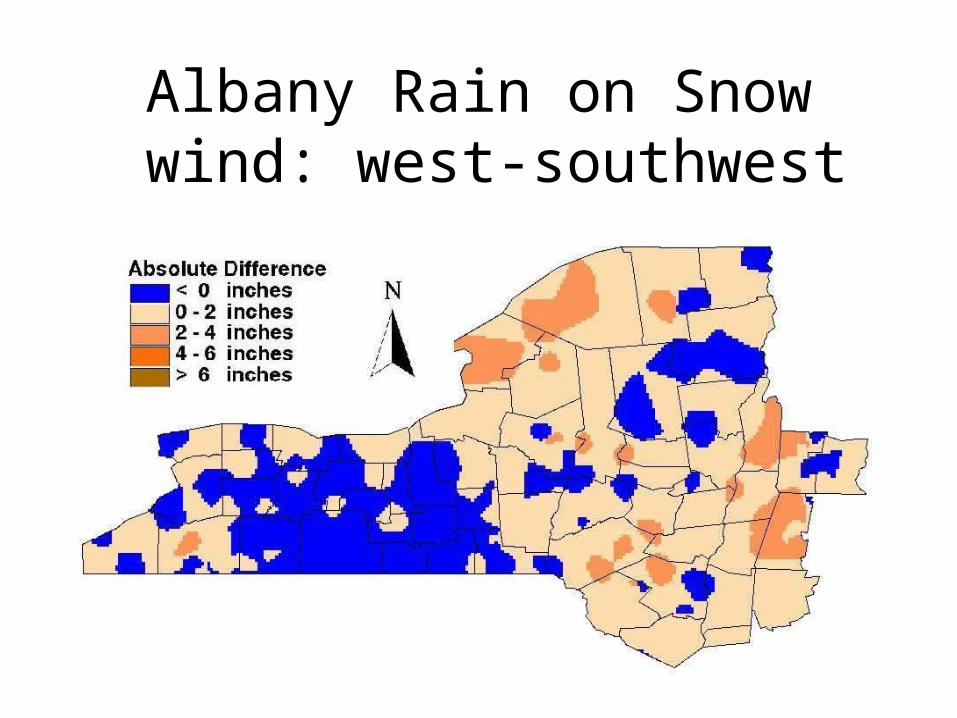
Statistics for Snow Depth ChangeAlbany Rochester--Absolute Difference --Absolute DifferenceSnow Depth loss Snow Depth loss
WSW West WNW WSW West WNWCOOP stations COOP stationsused 316 322 330 used 297 341 354MIN 0.33 0.75 0.60 MIN 1.20 0.75 0.43MAX 8.60 11.00 10.80 MAX 14.00 12.87 8.75MEAN 2.96 4.11 4.35 MEAN 5.61 4.85 3.48St. Dev 1.06 1.23 1.38 St. Dev 1.54 1.60 1.36
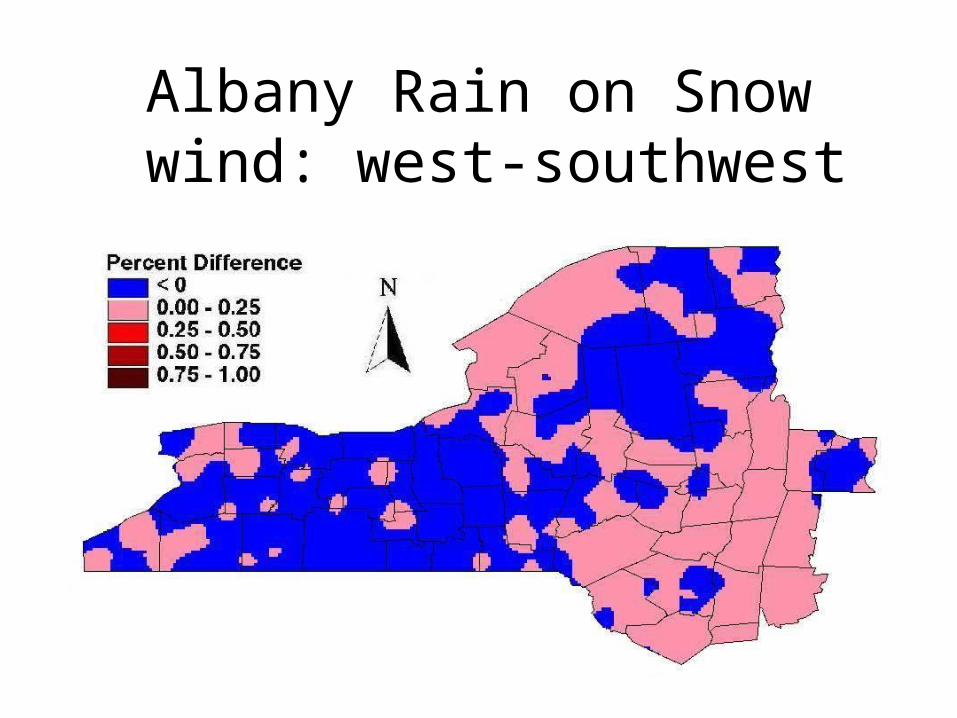
Albany Rochester--Percent Difference --Percent DifferencePercent of Snow Depth loss Percent of Snow Depth loss
WSW West WNW WSW West WNWCOOP stations COOP stationsused 316 322 330 used 297 341 354MIN 7% 6% 9% MIN 5% 9% 5%MAX 86% 88% 96% MAX 90% 100% 81%MEAN 38% 41% 40% MEAN 40% 47% 34%St. Dev 15% 15% 15% St. Dev 14% 16% 16%
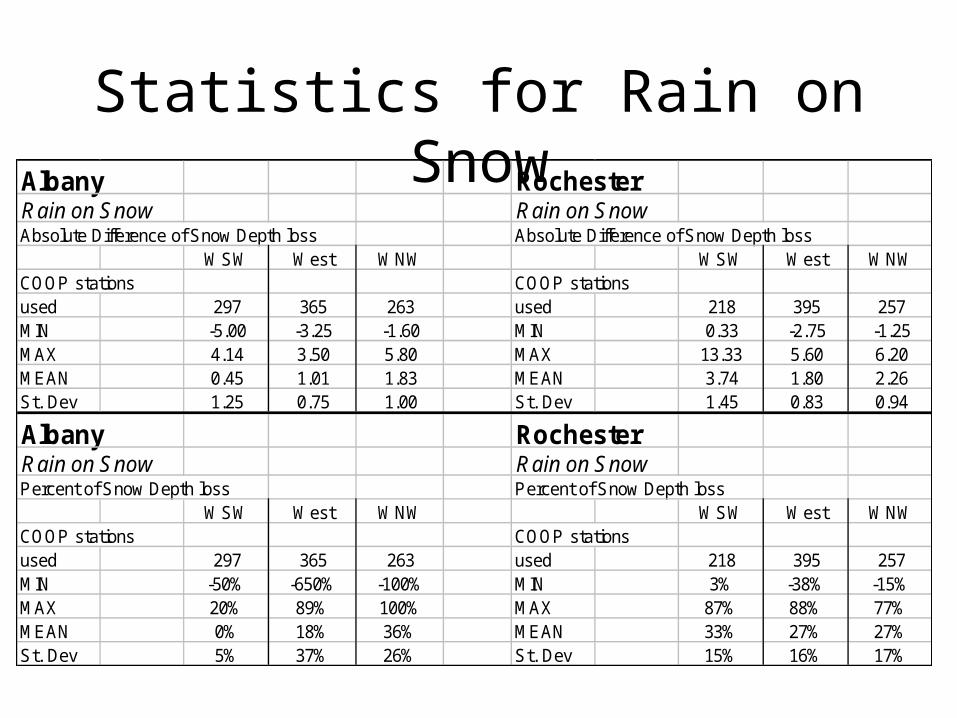
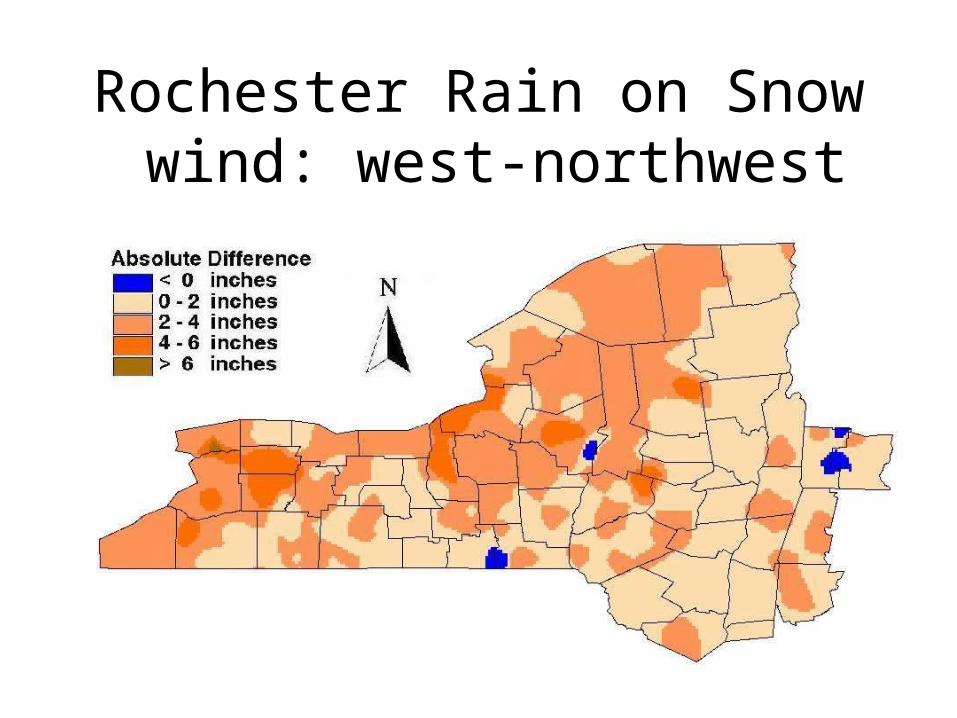
Statistics for Rain on SnowAlbany RochesterRain on Snow Rain on SnowAbsolute Difference of Snow Depth loss Absolute Difference of Snow Depth loss
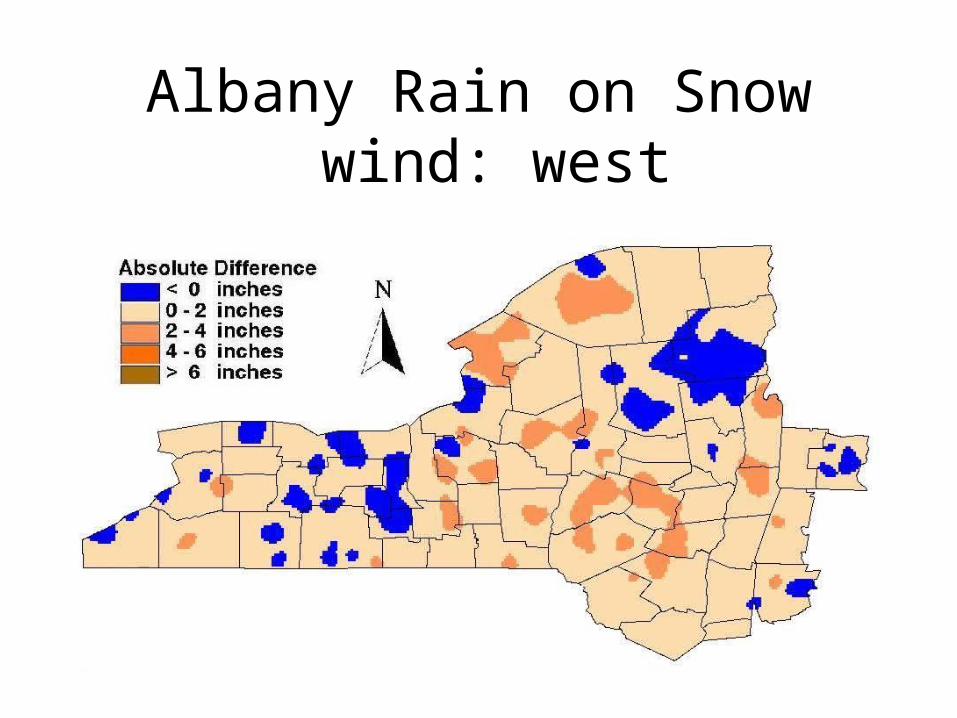
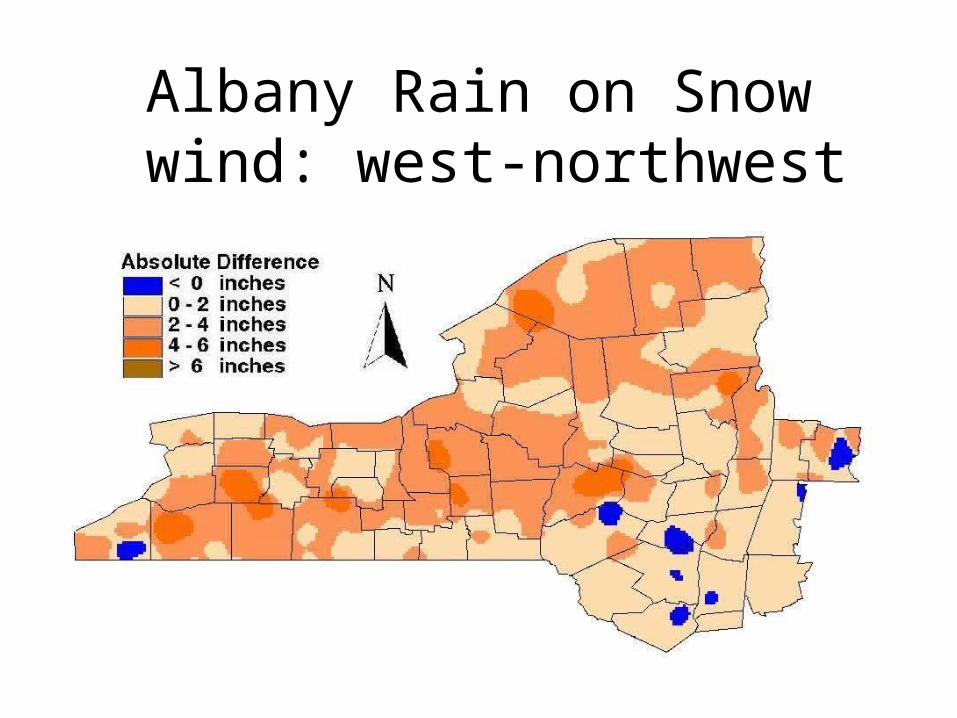
WSW West WNW WSW West WNWCOOP stations COOP stationsused 297 365 263 used 218 395 257MIN -5.00 -3.25 -1.60 MIN 0.33 -2.75 -1.25MAX 4.14 3.50 5.80 MAX 13.33 5.60 6.20MEAN 0.45 1.01 1.83 MEAN 3.74 1.80 2.26St. Dev 1.25 0.75 1.00 St. Dev 1.45 0.83 0.94
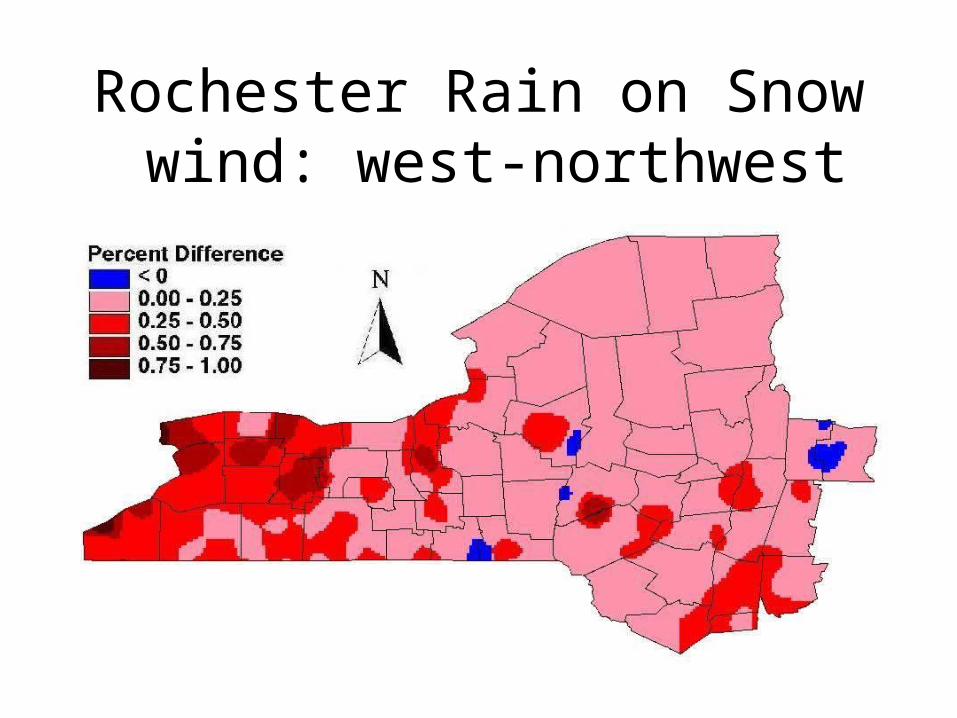
Albany RochesterRain on Snow Rain on SnowPercent of Snow Depth loss Percent of Snow Depth loss
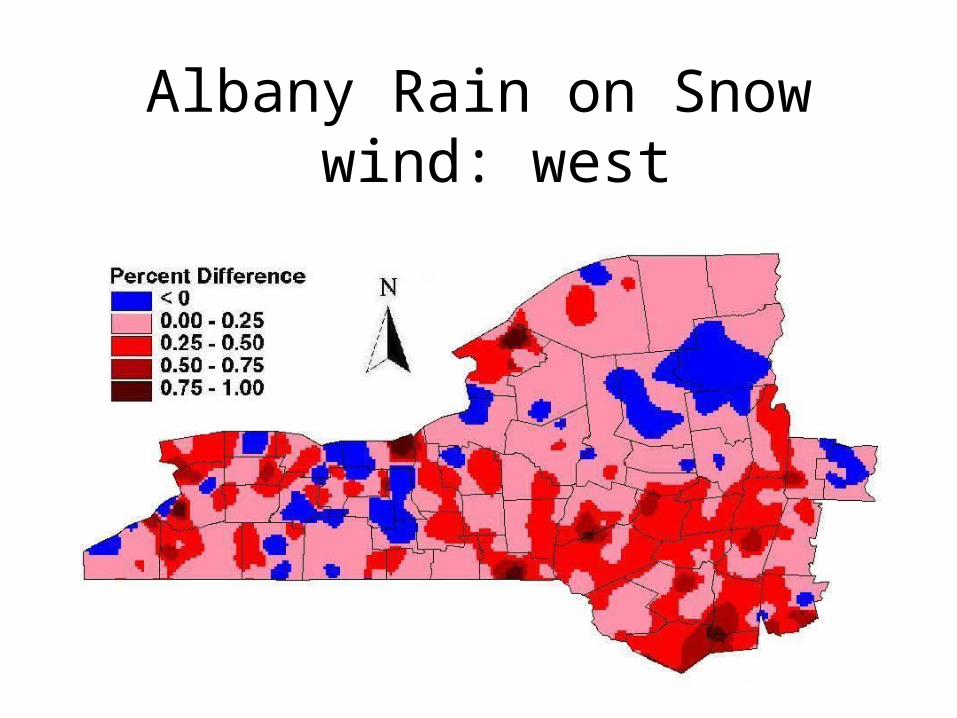
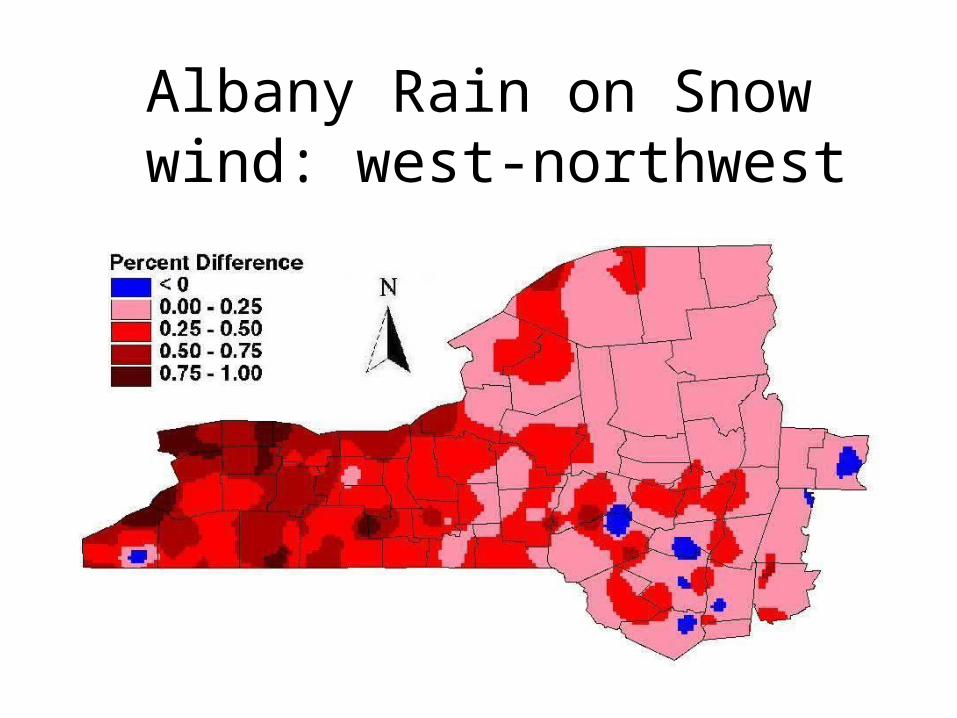
WSW West WNW WSW West WNWCOOP stations COOP stationsused 297 365 263 used 218 395 257MIN -50% -650% -100% MIN 3% -38% -15%MAX 20% 89% 100% MAX 87% 88% 77%MEAN 0% 18% 36% MEAN 33% 27% 27%St. Dev 5% 37% 26% St. Dev 15% 16% 17%
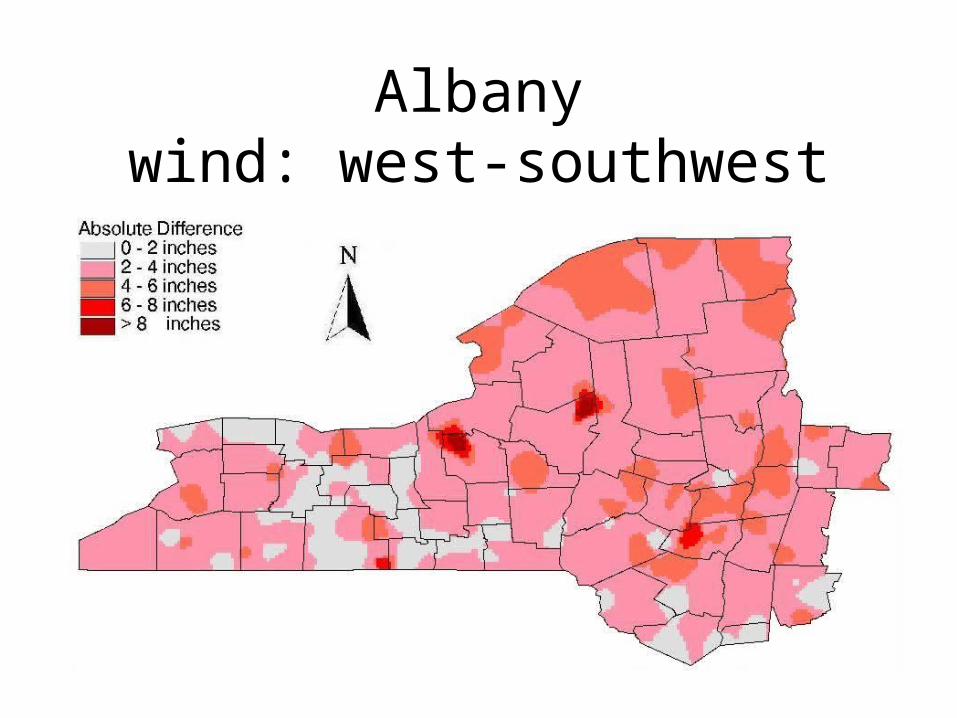
Albanywind: west-southwest
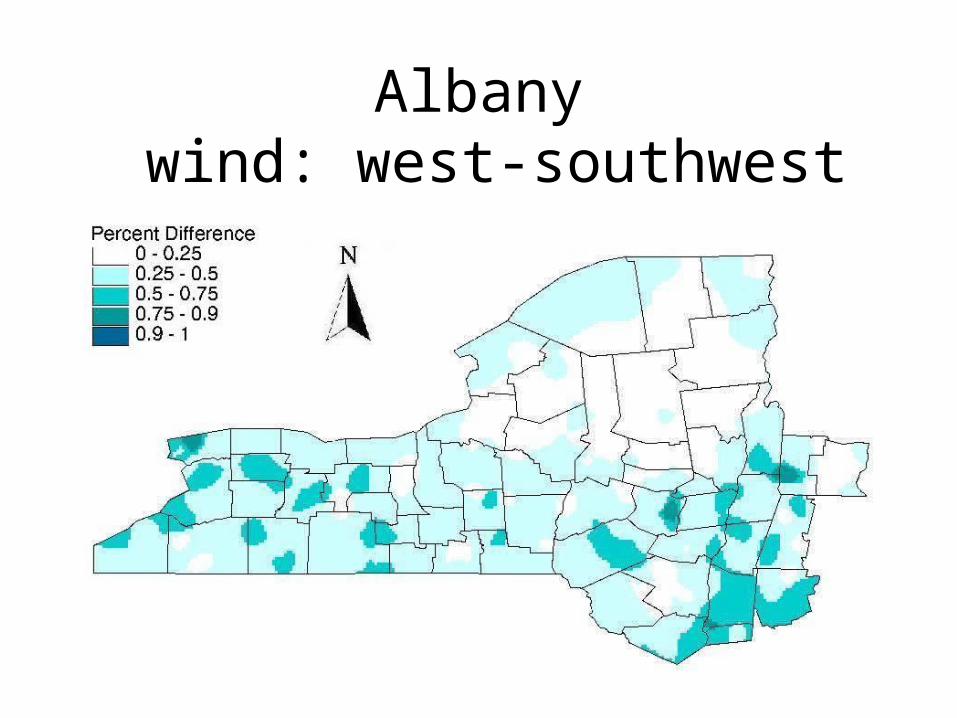
Albany wind: west-southwest
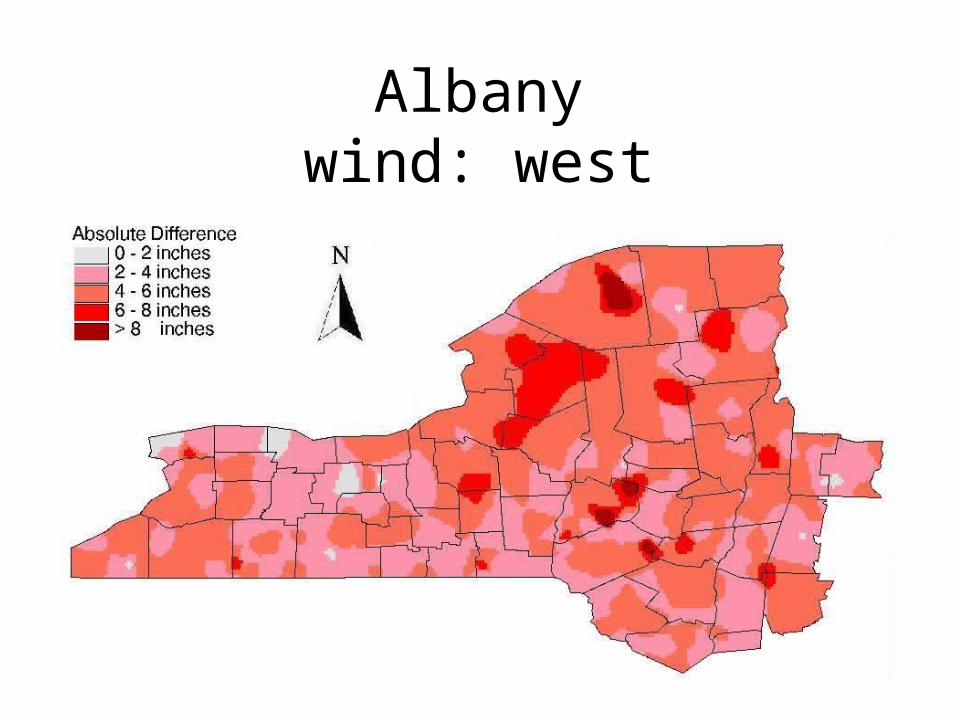
Albanywind: west
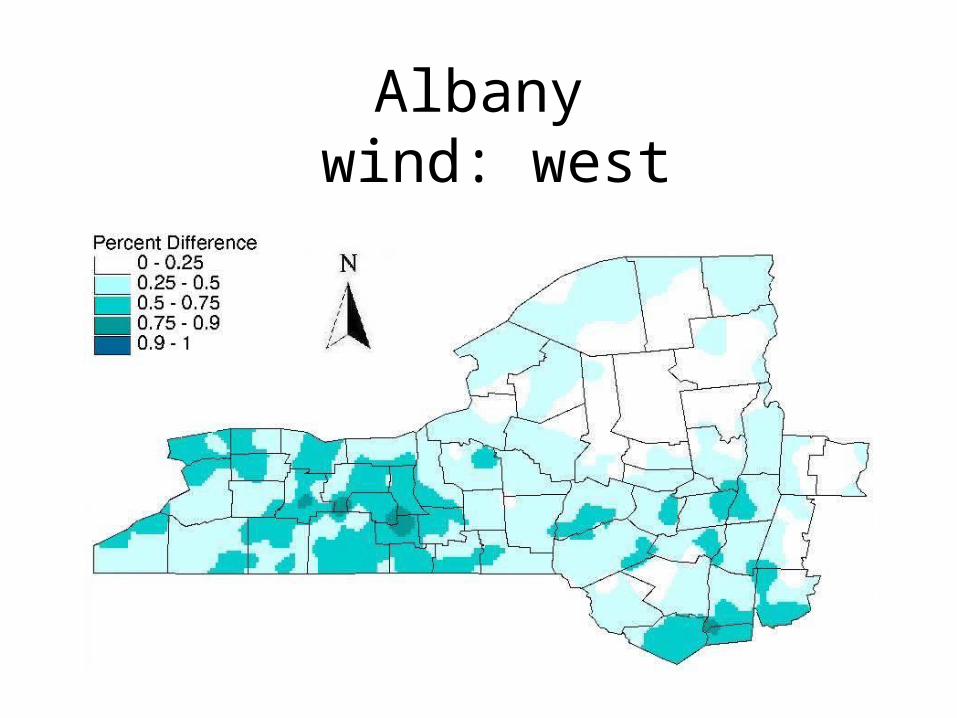
Albany wind: west
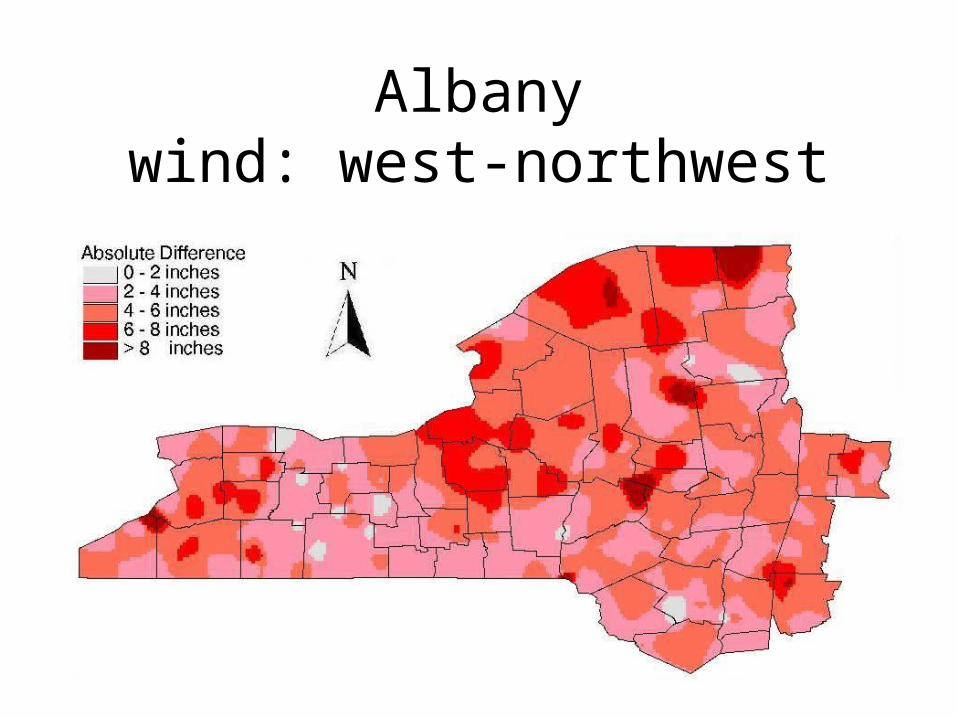
Albanywind: west-northwest
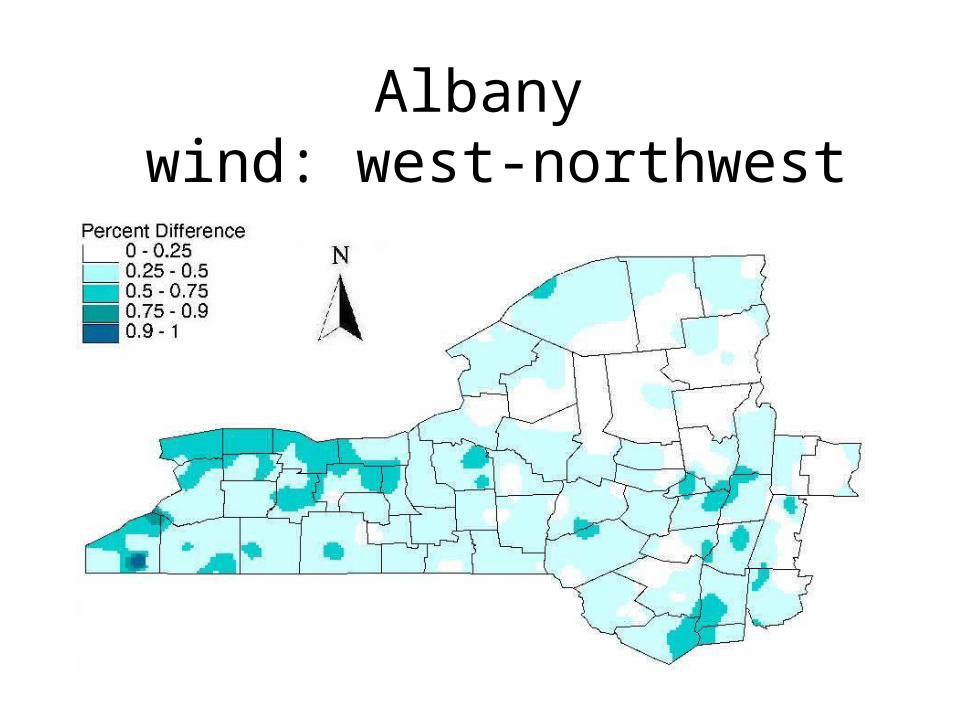
Albany wind: west-northwest
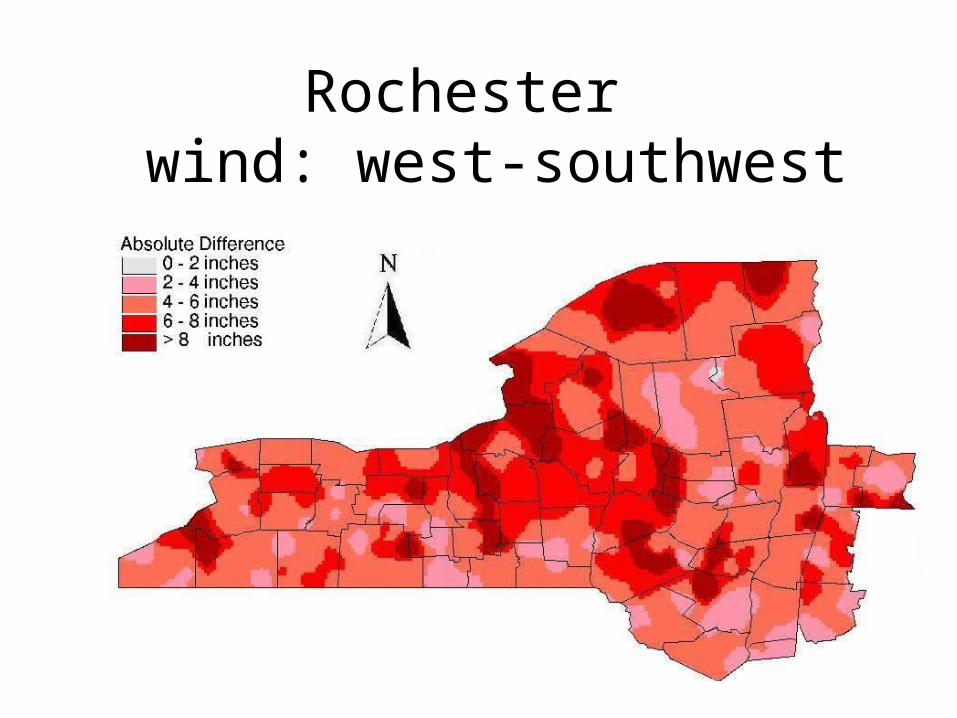
Rochester wind: west-southwest
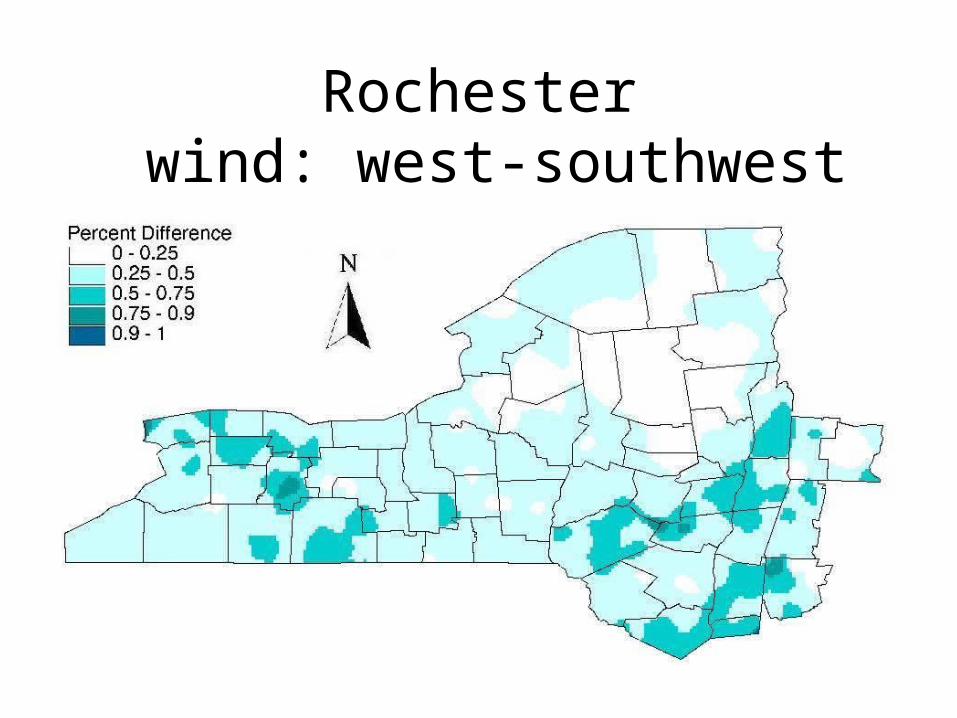
Rochester wind: west-southwest
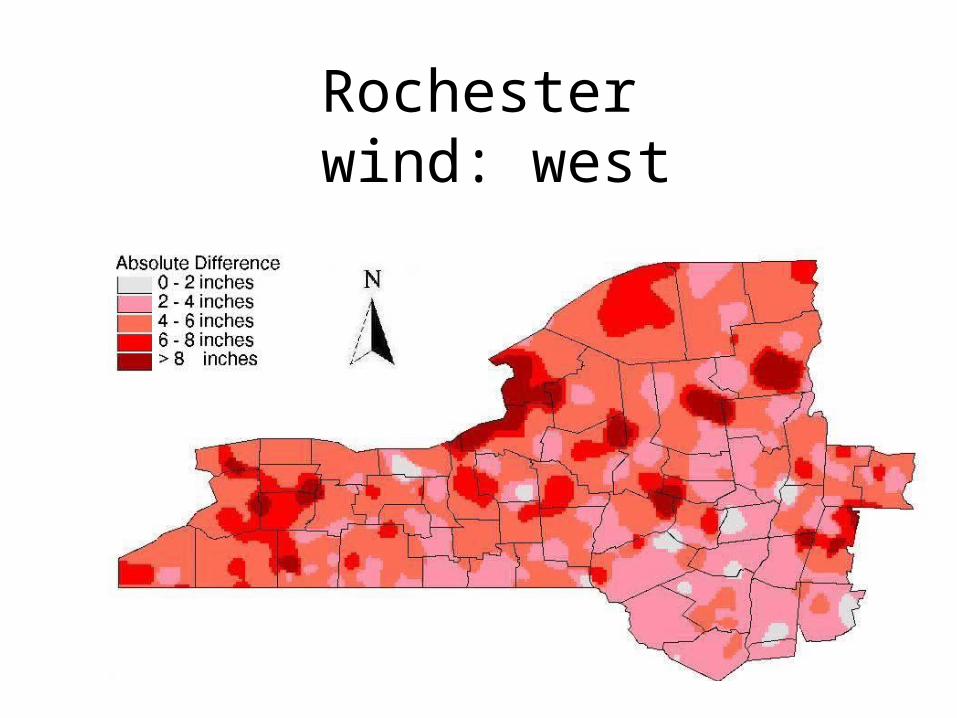
Rochester wind: west
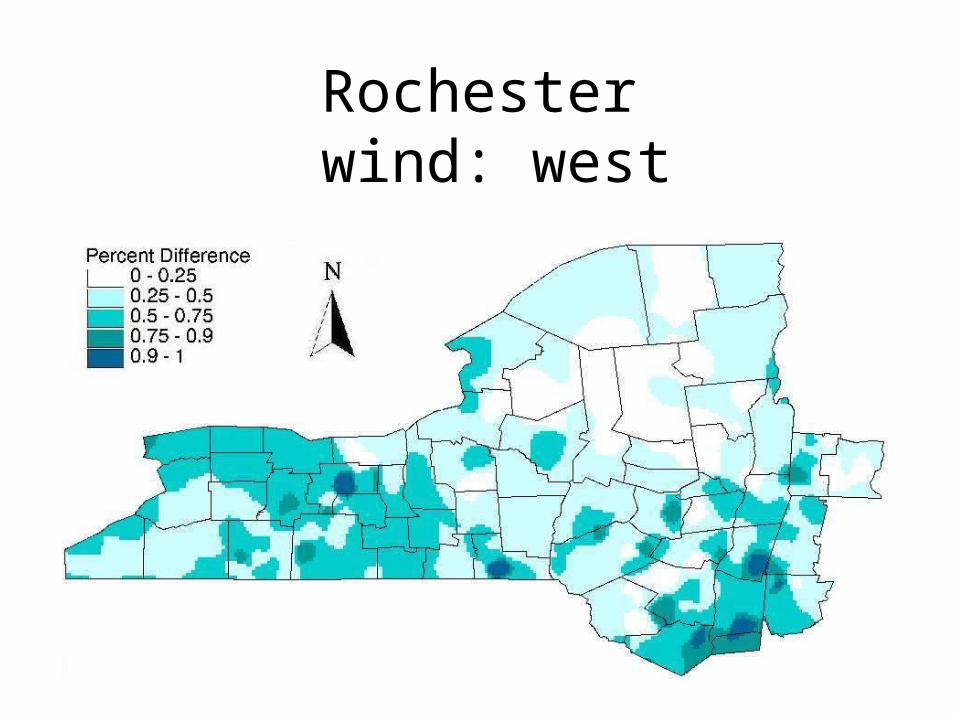
Rochester wind: west
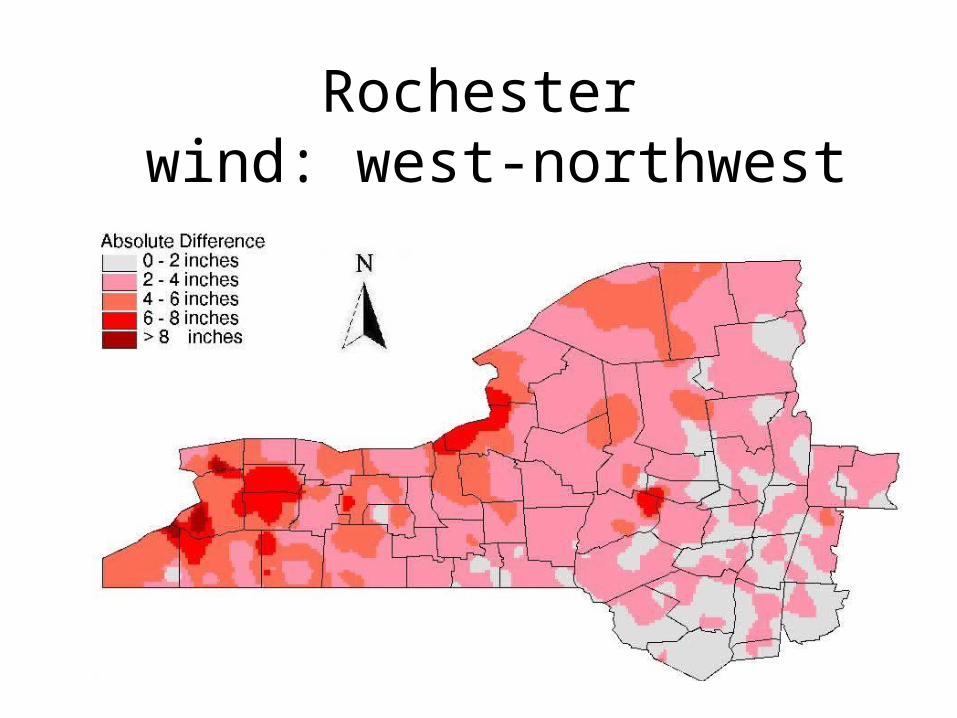
Rochester wind: west-northwest
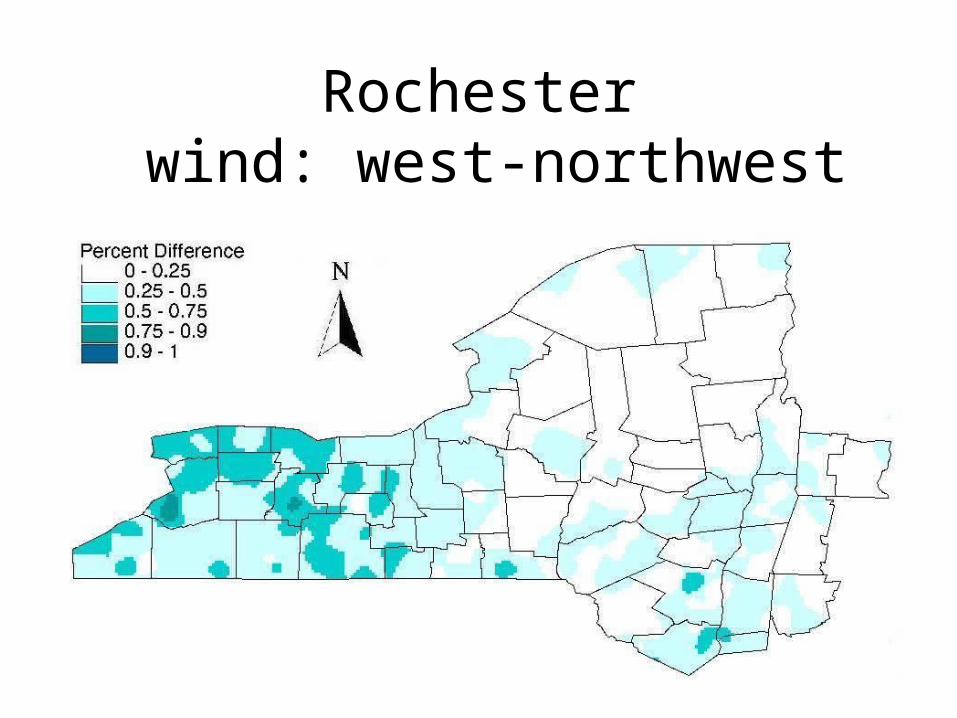
Rochester wind: west-northwest
Cumulative Frequency Charts
• Based on the 277 events for Albany, New York and 365 events for Rochester, New York, that had 0.50 inches or more of 6 day SWE loss.
• Based on WSW,West, and WNW wind direction.• Not all events had a 2 day rainfall.
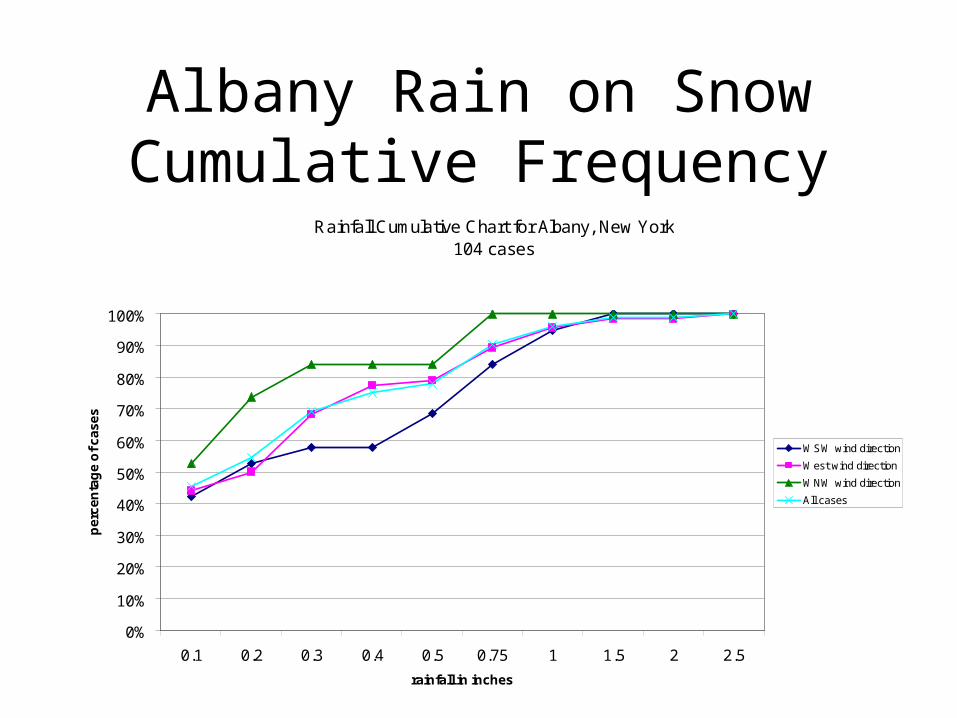
Albany Rain on SnowCumulative Frequency
Rainfall Cumulative Chart for Albany, New York104 cases
0%
10%
20%
30%
40%
50%
60%
70%
80%
90%
100%
0.1 0.2 0.3 0.4 0.5 0.75 1 1.5 2 2.5
rainfall in inches
pe
rce
nta
ge
of
ca
se
s
WSW wind direction
West wind direction
WNW wind direction
All cases
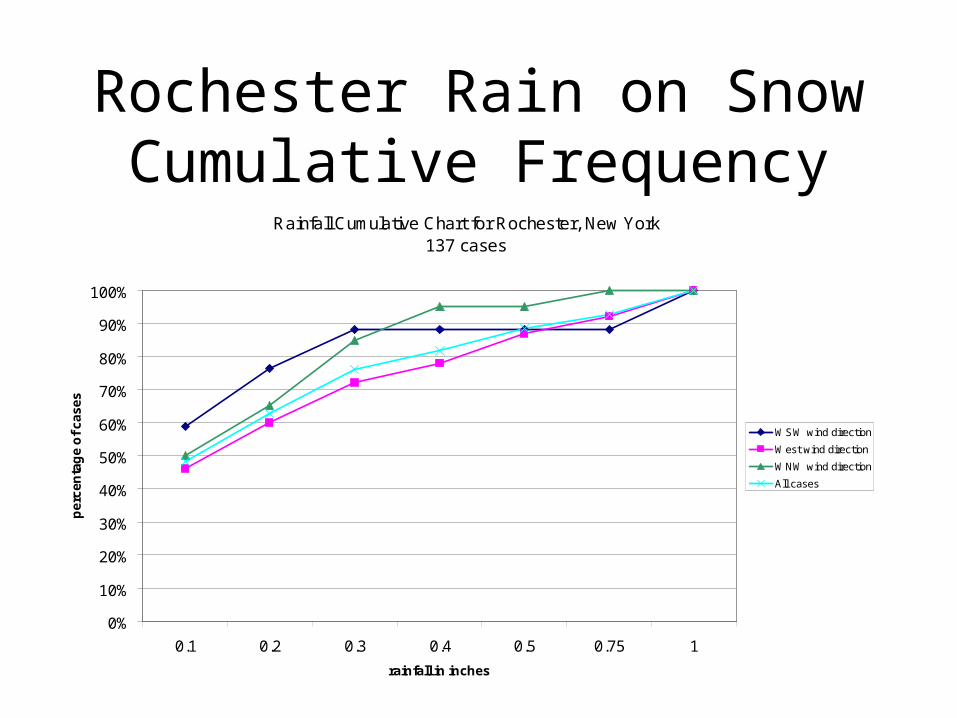
Rochester Rain on SnowCumulative Frequency
Rainfall Cumulative Chart for Rochester, New York137 cases
0%
10%
20%
30%
40%
50%
60%
70%
80%
90%
100%
0.1 0.2 0.3 0.4 0.5 0.75 1
rainfall in inches
pe
rce
nta
ge
of
ca
se
s
WSW wind direction
West wind direction
WNW wind direction
All cases
Albany Rain on Snow wind: west-southwest
Albany Rain on Snow wind: west-southwest
Albany Rain on Snow wind: west
Albany Rain on Snow wind: west
Albany Rain on Snow wind: west-northwest
Albany Rain on Snow wind: west-northwest
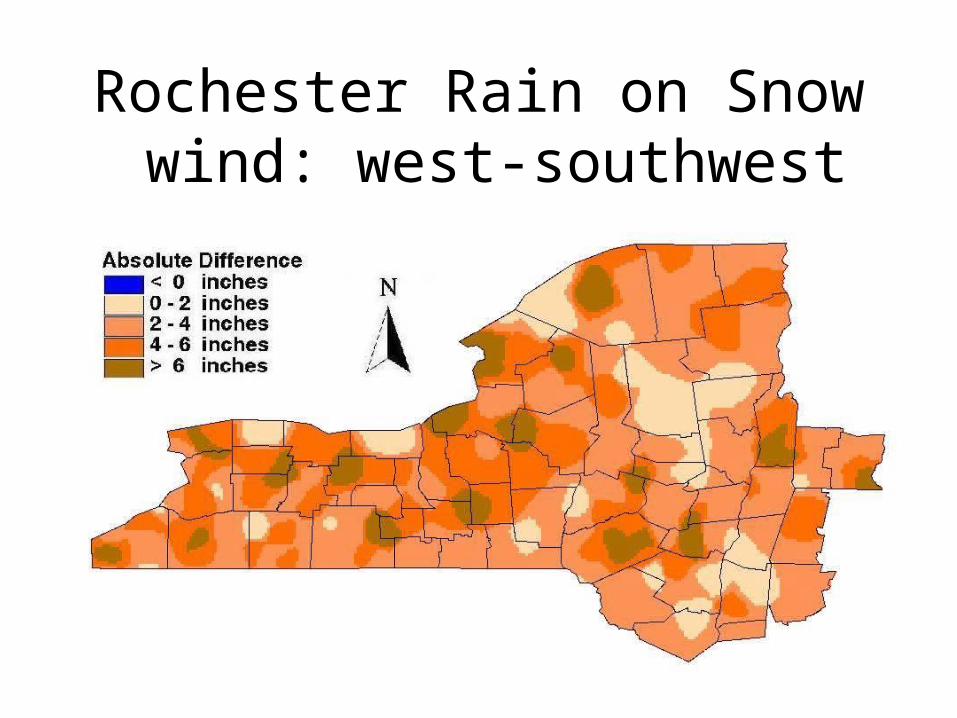
Rochester Rain on Snow wind: west-southwest
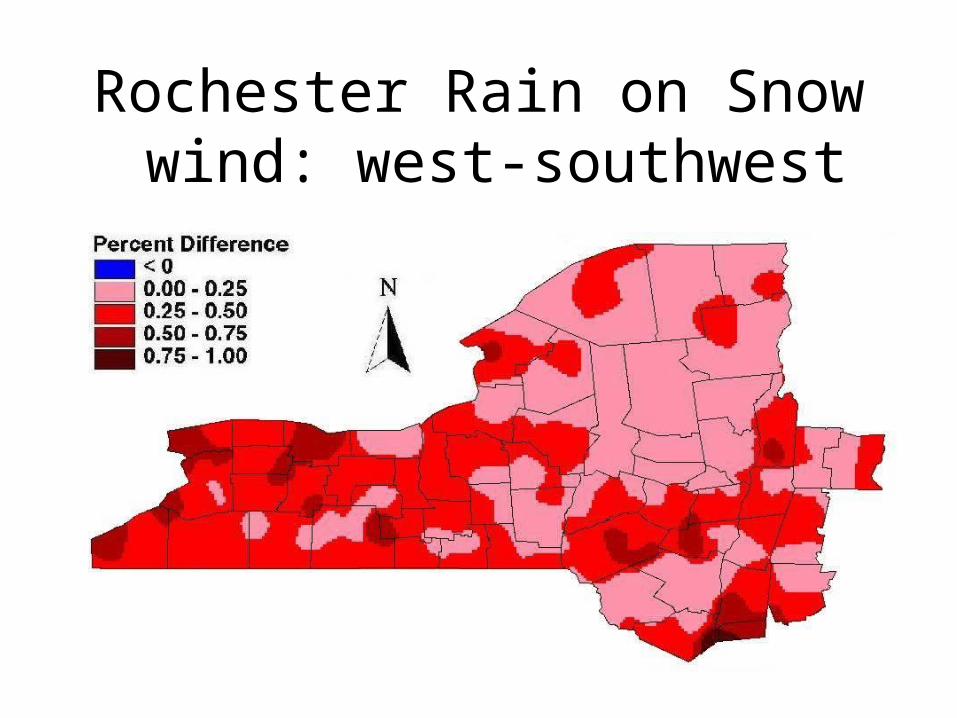
Rochester Rain on Snow wind: west-southwest
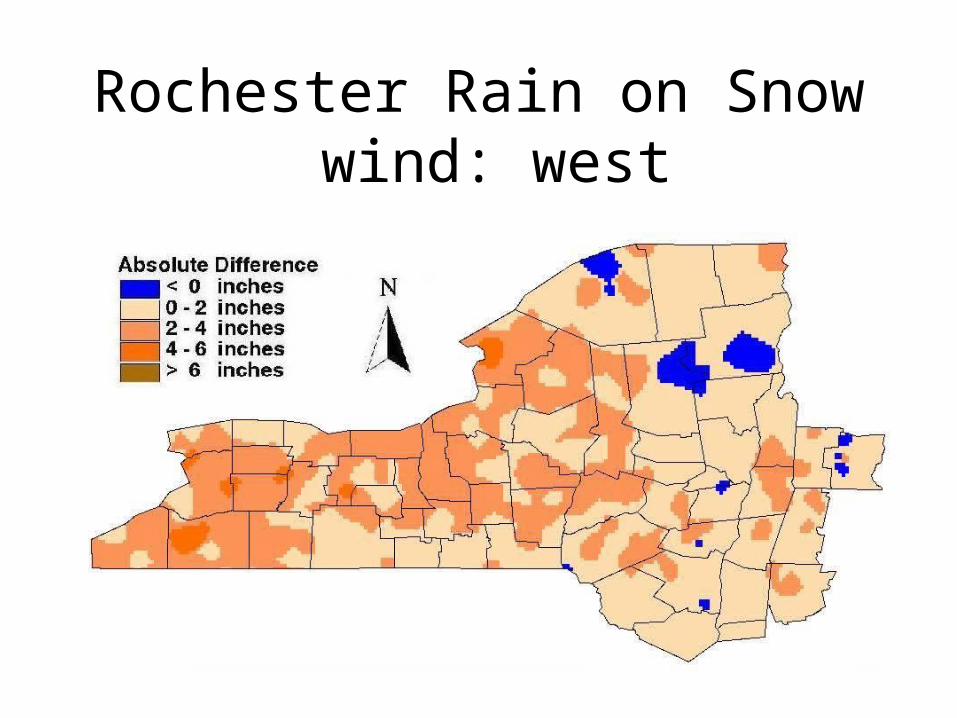
Rochester Rain on Snow wind: west
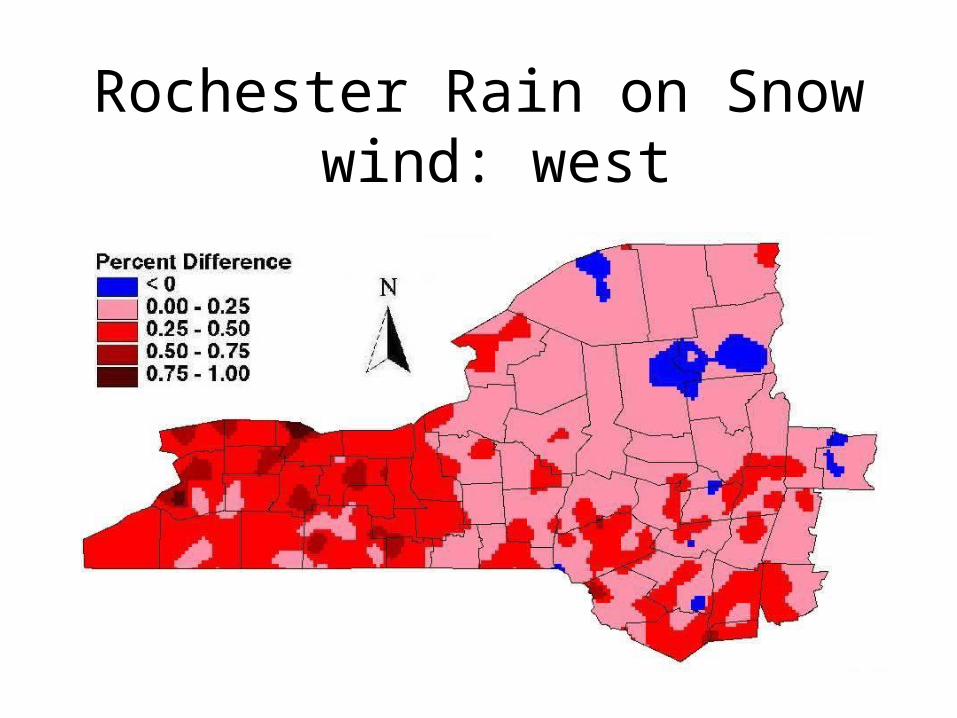
Rochester Rain on Snow wind: west
Rochester Rain on Snow wind: west-northwest
Rochester Rain on Snow wind: west-northwest