Linking Smallholders to the New Agricultural Economy: … · Romina Cavatassi, Mario Gonzalez, Paul...
41
Linking Smallholders to the New Agricultural Economy: An Evaluation of the Plataformas Program in Ecuador Romina Cavatassi, Mario Gonzalez, Paul Winters, Jorge Andrade-Piedra, Patricio Espinosa and Graham Thiele ESA Working Paper No. 09-06 April 2009 Agricultural Development Economics Division The Food and Agriculture Organization of the United Nations www.fao.org/es/esa
-
Upload
duongduong -
Category
Documents
-
view
213 -
download
0
Transcript of Linking Smallholders to the New Agricultural Economy: … · Romina Cavatassi, Mario Gonzalez, Paul...
Linking Smallholders to the New Agricultural Economy:
An Evaluation of the Plataformas Program in Ecuador
Romina Cavatassi, Mario Gonzalez, Paul Winters, Jorge Andrade-Piedra, Patricio Espinosa and
Graham Thiele
ESA Working Paper No. 09-06
April 2009
Agricultural Development Economics Division
The Food and Agriculture Organization of the United Nations
www.fao.org/es/esa
ESA Working Paper No. 09-06 www.fao.org/es/esa
Linking Smallholders to the New Agricultural Economy: An Evaluation of the Plataformas Program in Ecuador
April 2009
Romina Cavatassi Agricultural Development Economics Division
Food and Agriculture Organization Rome, Italy
e-mail: [email protected]
Mario González Inter-American Development Bank
Washington, DC e-mail: [email protected]
Paul Winters American University
Washington, DC e-mail: [email protected]
Jorge Andrade-Piedra International Potato Center
Quito, Ecuador e-mail: [email protected]
Graham Thiele International Potato Center
Lima, Peru e-mail: [email protected]
Patricio Espinosa International Potato Centre
Quito, Ecuador e-mail: [email protected]
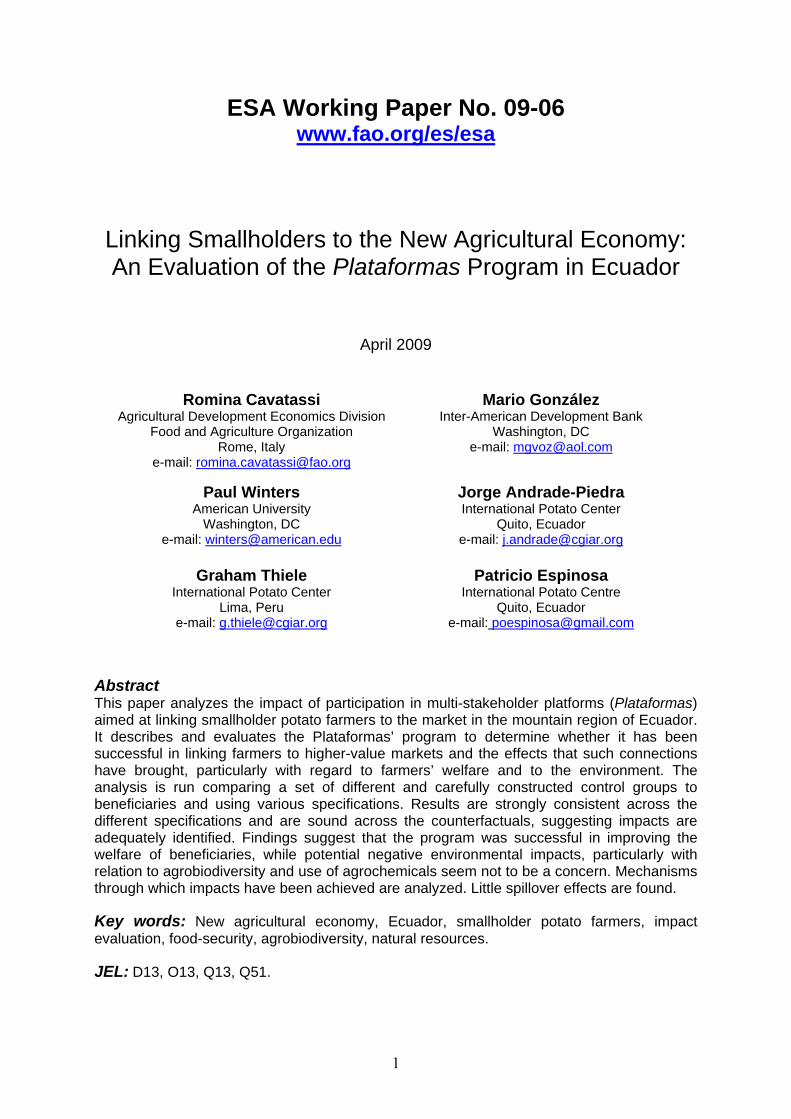
Abstract This paper analyzes the impact of participation in multi-stakeholder platforms (Plataformas) aimed at linking smallholder potato farmers to the market in the mountain region of Ecuador. It describes and evaluates the Plataformas’ program to determine whether it has been successful in linking farmers to higher-value markets and the effects that such connections have brought, particularly with regard to farmers’ welfare and to the environment. The analysis is run comparing a set of different and carefully constructed control groups to beneficiaries and using various specifications. Results are strongly consistent across the different specifications and are sound across the counterfactuals, suggesting impacts are adequately identified. Findings suggest that the program was successful in improving the welfare of beneficiaries, while potential negative environmental impacts, particularly with relation to agrobiodiversity and use of agrochemicals seem not to be a concern. Mechanisms through which impacts have been achieved are analyzed. Little spillover effects are found. Key words: New agricultural economy, Ecuador, smallholder potato farmers, impact evaluation, food-security, agrobiodiversity, natural resources. JEL: D13, O13, Q13, Q51.
1
Acknowledgements: This study was funded by FAO-Netherlands Partnership Program (FNPP) and FAO Norway Partnership Program (FNOP). We want to thank farmers and leaders of CONPAPA (Consorcio de la Papa): Francisco Jarrín, and Hernán Pico; CIP: International Potato Center and its Papa Andina Partnership Program; FAO-Ecuador: Iván Angulo Chacón; the Instituto Nacional Autónomo de Investigaciones Agropecuarias (INIAP) and the Programa Nacional de Raíces y Tubérculos rubro Papa (PNRT-Papa): Iván Reinoso, Fabián Montesdeoca, Manuel Pumisacho, Cecilia Monteros, José Unda, Xavier Cuesta, Jorge Rivadeneira, and Ricardo Delgado; the Swiss Agency for Development and Cooperation (SDC) and its FORTIPAPA (Fortalecimiento de la Investigación y Producción de Semilla de Papa) Project; the Central Ecuatoriana de Servicios Agropecuarios (CESA); M.A.R.CO. (Minga para la Acción Rural y la Cooperación): Carlos Falconí and Paúl Solís; the Instituto de Ecología y Desarrollo de las Comunidades Andinas (IEDECA): Alberto Oleas and Fabián Muñoz (Visor Análisis Estadístico Cia. Ltda.) André Devaux and Ivonne Antezana from CIP/Papa Andina and Karfakis Panagiotis from FAO for their comments, Arturo Taipe and Darío Barona for their help calculating the EIQ field use rating and for suggesting references.
ESA Working Papers represent work in progress and are circulated for discussion and comment. Views and opinions expressed here are those of the authors, and do not represent official positions of the Food and Agriculture Organization of the United Nations (FAO) or of the International Potato Center that collaborated in this effort. The designations employed and the presentation of material in this information product do not imply the expression of any opinion whatsoever of the part of the Food and Agriculture Organization of the United Nations concerning the legal status of any country, territory, city or area or of its authorities, or concerning the delimitation of its frontiers or boundaries.
2
Linking Smallholders to the New Agricultural Economy: An Evaluation of the Plataformas Program in Ecuador
1. Smallholders and the new agricultural economy
The last two decades has witnessed profound changes in farming systems and the way in which agricultural production is organized in many developing countries. While changes affect the whole chain from production to consumption, they are most clearly manifested in the manner in which food is being retailed. Agricultural producers now supply long and complex value chains that are marketing high-value fresh and processed products to mainly urban consumers. On the input side, farmers increasingly rely on commercialized transactions in market venues to obtain seeds, fertilizers and agricultural chemicals as the demand for product quality increases. These changes, referred to as the new agricultural economy, have led to new organizational and institutional arrangements within the food marketing chain such as new forms of contracts (pre-established contracts versus spot markets) as well as the imposition of private grades and standards for food quality and safety (Dolan and Humphrey, 2004; Reardon and Berdegué, 2002).
This increased orientation towards expanding agricultural markets can certainly offer farmers potential benefits such as increased choices of input suppliers and product outlets, increased accessibility to credit and a better management capacity (Winters et al, 2005; Eaton and Shepherd, 2001). However, access to markets has proven difficult for many smallholder farmers, who often remain on the periphery of this new agricultural economy. In fact, the process may even exacerbate poverty levels through marginalization of small farmers and the rural poor who are disadvantaged as compared to the larger and better endowed commercial farmers (Johnson and Berdegué, 2004; Berdegué et al., 2003; Reardon et al., 2003; Little and Watts, 1994).
In recent years, the importance of governing markets to improve efficiency and smallholder accessibility has been widely recognized. Both researchers and development practitioners have started looking at the issue of overcoming input and output market inefficiencies and inequalities in the value chain in order to achieve increased smallholder participation (De Haen et al., 2003; Reardon et al., 2002; Barrett et al. 2001; Pingali, 2001). All these efforts have recognized that production-oriented interventions alone do not resolve the problems smallholders are facing, if they are not accompanied by policies and programs targeted to other parts of the production-distribution-retail chain. However, actual interventions, wherever implemented, have been found difficult to scale up. The challenge is to stimulate policy change to overcome the barriers that smallholder farmers face in accessing markets.
The net effect of the new agricultural economy both on the welfare of poor people and on the environment is controversial as it can be both positive and negative. On the one hand, increased commercialization shifts farm households away from traditional self-sufficiency goals towards profit and income-oriented decision making. On the other hand, benefits to smallholders are by no means guaranteed and indeed the process may even exacerbate poverty levels through marginalization of the rural poor if they are unable to directly take advantage of new market opportunities or benefit from increased labor demand. Furthermore, the agricultural intensification that often accompanies market-oriented agriculture may lead to a focus on a few commercially-oriented varieties, to increased chemical use and to intensified land use, and thus to potentially negative environmental and health consequences.
3
One approach that has been used in the Andean region to enhance the benefits to smallholders of linking with the new agricultural economy has been the multistakeholder platforms, Plataformas de concertación or simply Plataformas in its Spanish version (Devaux et al., 2009). The Plataformas program in Ecuador has been implemented by the Instituto Nacional Autónomo de Investigaciones Agropecuarias (INIAP) through the FORTIPAPA (Fortalecimiento de la Investigación y Producción de Semilla de Papa) project and supported by the International Potato Center (CIP) through its Papa Andina Partnership Program. The Plataformas program brought together potato farmers and a range of suppliers of research and development services, with the final purpose of linking farmers to higher-value markets for their produce. High-value market purchasers included local fast food restaurants supermarket chains and the multinational food processor Frito-Lay. By establishing direct linkages of farmer organizations to these purchasers, Plataformas have displaced traditional intermediaries, potentially providing the smallholders with greater opportunities to obtain benefits from the changes in agricultural marketing systems.
The objective of this paper is to describe and evaluate the Plataformas program in order to determine whether it has been successful in linking farmers to higher-value markets and the effects, particularly with regard to farmers’ welfare and to the environment that such connections have brought. This case study is then used to provide insights into the challenges of linking smallholders to higher-value markets and to assess the possibility of meeting these challenges.
The rest of the paper is structured as follows. Section 2 presents the broad objectives of the Plataformas describing the motivation and the expected benefits. In section 3, detailed descriptions of the case study, of the Plataformas’ program and intervention that it consisted of are provided. Key to evaluating an intervention is to establish a proper counterfactual and section 4 describes how this was done and the data used in the analysis. Section 5 then explains how this data is used to identify impact, while results are discussed in section 6. Section 7 provides a general discussion of the lessons learned from the analysis with respect to linking smallholders to the new agricultural economy and the policy implications.
2. Linking farmers to markets: The logic of the Plataformas approach
While there are multiple structures for organizing production, the new institutional economics literature posits that the one that emerges is the one that minimizes overall costs including transaction costs (Williamson, 1985). Such costs include standard production costs but also the ex ante costs of drafting, negotiating and safeguarding agreements as well as ex post costs of maladaption, set-up and running of governance systems and bonding costs of securing commitments (Diedtric, 1994). For agricultural industries that require agricultural commodities for sale in higher-value markets or for processing, timely delivery and quality standards are often crucial to the decision of how to organize production. Using the open market for obtaining these commodities, may involve high transaction costs and have limited appeal (Winters et al., 2005). Agribusiness may then seek alternative structures for organizing production, such as through vertical integration or contract farming if they view creating such a relationship as the least cost alternative to other options.
Contract farming is most likely with non-traditional or speciality crops where prices are volatile since markets are thin, yield is uncertain, timing essential, quality critical and knowledge of production by local producers potentially limiting. For staple commodities like potatoes in the Ecuadorian Andes, yield is uncertain and quality is important for sale in
4

higher-value markets and processing into chips and fries. Yet, the potato market is by no means thin, production is available at most times of the year and knowledge regarding production is widespread. The challenge for agribusiness in the Ecuadorian potato market is primarily in obtaining potato varieties that meet their processing or market requirements and in ensuring that those key varieties can be found at the right time and of appropriate quality. Organizing production to minimize costs under such circumstances can take different forms and is likely to evolve as the new agricultural economy continues to expand. One option is to contract farmers for particular varieties under the condition that they meet quality standards and deliver in a timely fashion. This is a challenging factor for small-farmers that might be achieved if requirements are not too severe. For example the objective of supplying Frito-Lay with the variety INIAP-Fripapa has not been met yet by Plataforma’s producers because of difficulties in meeting volume and quality constraints, which became even more demanding when Frito-Lay decided to switch exclusively to purchasing the Colombian developed Diacol-Capiro processing variety which is very susceptible to late blight (Phytophthora infestans) and less suitable for production by small farmers in the Plataformas1. Another alternative, because of the large and diverse potato market, is to buy in the open market and assume that intermediaries will be able to purchase the necessary varieties in a timely manner and of a sufficient quality. The least costly option then depends on the extent of the market for the key variety.
In such a context, neither option is likely to provide direct benefits to smallholders. In contract farming, smallholders’ primary advantage is in their supply of cheap labor for labor-intensive crops. In such cases, it may be worthwhile for an agribusiness to deal with numerous smallholders since overall costs include a large share of labor costs and this may overcome the additional transaction costs of working with large number of smallholders. If the crop is not labor intensive and it is possible to deal with a smaller number of largeholders thereby minimizing transactions costs, this is a more likely outcome. If, alternatively, the agribusiness chooses to purchase the commodity in the open market, intermediaries are likely to play the role of obtaining the necessary product and while they may purchase the crop from smallholders, it will be at going market rates and provide no benefit to smallholders unless they are large enough purchasers that they influence overall price.
When smallholders have no apparent advantage in production, the challenge is to reduce the transaction costs associated with purchasing from large numbers of farmers producing small quantities to make them relatively competitive or to devise a way to directly link smallholders to high-value purchasers. This requires organizing smallholders to overcome the costs of transactions as well as providing them with the necessary information to meet market requirements. The Plataformas program does just this. The specific intervention undertaken, as part of a more general program which addressed the various linkages of the potato chain, is described more fully below, but the approach used is to provide support for smallholders from a range of institutions, through building a strong social capital2. This latter functions as a connector between groups and among individuals facilitating co-operation and mutually supportive relations and thus, as in this case, as an effective means to reduce transaction costs
1 Both Diacol-Capiro and INIAP-Fripapa have high dry matter and low sugar content. Neither are commonly traded in the large fresh potato market while small-farmers in Plataformas have not been able to consistently supply Frito-Lay because of difficulties in meeting volume and quality constraints. Thus Frito-Lay has been consolidating a group of its own suppliers to secure production. 2 Social capital is defined as a variety of different entities with two common elements: they all consist of some aspect of social structure and they facilitate actions of actors within that structure (Coleman, 1988). The entities have mutually beneficial goals and are usually characterized by trust, cooperation, involvement in the community, and sharing (Putnam, 1995).
5
and link associate farmers directly to high-value purchasers. The connection is reached in a manner that ensures that those buyers receive quality potatoes, of the variety they require, and in a timely fashion. The intervention operates, on the basis of a well designed program, through the whole potato supply chain in such a manner to reduce inefficiencies, overcome barriers and reduce costs in each link of the chain.
The logic of the program is to reduce transaction costs so smallholders can be a low cost option for high-value purchasers and take advantage of the benefits of the new agricultural economy. The ultimate expected benefit of the intervention is to increase the income obtained from potato production not only through increasing productivity but also through higher output prices and through lower transaction costs. While these latter are difficult to quantify, they are related to negotiation, monitoring and enforcement costs associated with transactions. When transactions are taken care of by the Plataforma, single transactions requiring that each smallholder deals directly with final clients are avoided and thus associated costs and burdens are dramatically reduced.
Of course, to achieve such broad outcomes, the expectation is that a number of changes will occur at the household level among those participating in the intervention. To meet the quality standards of the purchasers, which include sizes, levels of dry matter and sugar content as well as minimum levels of tuber damage, changes are expected in varietal use, inputs applied and labor employed, in addition to changes in the organizational and marketing structure of the farm. This type of intensification may lead to increased use of pesticides which can be viewed as potentially problematic given the evidence of their negative health and environmental effects (Crissman, Antle and Capalbo, 1998). On the other hand the training on integrated crop management carried out through Farmer Field Schools (FFS) by the Plataforma included the use of pesticides, covering hazards, types, doses, timing, and necessary precautions for their application which could compensate for the effect of intensification. The intervention implied recommending the use of less toxic insecticides and promoted the use of traps for Andean weevil (Premonotrypes vorax) which limits the use of insecticide to specific points in the field reducing applicator exposure. Hence the training provided by the Plataforma might mitigate the pressure from intensification but the net effect of the intervention on chemical use would need to be empirically determined.
In addition the quality requirements of agroprocessors for high dry matter and low sugar content, for good frying quality, for specific tuber shapes and post harvest storage, limit the focus to only one or two varieties thus excluding local and traditional varieties. This raises biodiversity concerns about the genetic erosion and the loss of local varieties.
Along with shifts in production practices, the training involved in meeting market demands aimed also at increasing the knowledge of recipients, with regard to farming and marketing practices. Therefore, in addition to considering the overall welfare impact of the intervention (primary benefits), intermediate or secondary effects are considered. Not only might these effects influence overall welfare but in their evaluation it is possible to also examine and understand the mechanisms by which recipients achieved the primary benefits. That is how they improved their welfare (or why they did not if no overall impact is found), as well as to evaluate the impacts on the environment and the consequent actions that can be taken to avoid these, if negative.
6

3. Setting the scene
In order to conduct a proper impact evaluation it is crucial to have a clear picture of the intervention under scrutiny, of its overall program and of the context in which it operates. To this end, and prior to the beginning of this evaluation, a qualitative study was conducted to inform and guide the research. This first phase was based on interviews with key informants, focus group discussions in the regions of interest, and a value chain analysis of the Ecuadorian potato market. This section draws on this qualitative work, as well as on secondary documentation to set the scene for the study by first describing the Ecuadorian potato market, and then by providing a description of key elements of the Plataformas.
Ecuadorian Potato Market
Potato is the primary staple and one of the most lucrative market crops cultivated in the Sierra (mountain) region of Ecuador. Farmers can be differentiated by the use of technology, chemical inputs, production efficiency, types of varieties farmed, and the degree of market integration (An, 2004). Cultivation is largely undertaken by small-scale farmers. 32.2% of farmers in the country grow potatoes in areas smaller than 1 ha (OFIAGRO, 2009), and about half of all potato farmers grow potatoes in less than 2 hectares of land but own only 19% of total land dedicated to potatoes (INEC, 2007; Mancero, 2007). The majority of this land, thus, is owned by large and medium farmers (Mancero, 2007). Almost all potato production is for domestic consumption, with per capita consumption of around 32 kg per year (OFIAGRO, 2009). Potato planting and harvesting is possible year round due to the country’s location on the equator.
Despite the fact that Ecuador could potentially produce enough potatoes to satisfy domestic demand, input costs, high-level standards required, and a growing commercially oriented production, have led to increasing imports for market-based potato products. Nonetheless, the domestic demand is still almost totally satisfied through internal production (Mancero, 2007). Over the past decade, total production has fallen from more than 450,000 metric tons to less than 320,000, while the cultivated area has shrunk from 65,000 ha to less than 50,000 (FAOSTAT, 2007). Average yields (6.8 t/ha) (INEC, 2007) are still far below the international average not only when compared to Europe (17.27 t/ha) and North America (36.79 t/ha), but also when compared to nearby countries: 12.6 t/ha in Peru, 17.3 t/ha in Colombia, and 18.6 t/ha in Venezuela (FAOSTAT, 2007). From 2002 to 2006, imports of potato-based products mainly frozen French fries, have increased from 2423 t in 2002 to 7119 t in 2006 (OFIAGRO, 2009) in response to growth in demand from fast food restaurants mainly. Although this still represents less than 2% of total consumption, it shows an interesting trend taking place in the country.
According to the III National Agricultural Census3 there are 82,759 production units growing potato (INEC, 2000). The majority of producers are located in the provinces of Carchi, Chimborazo, Cotopaxi, Tungurahua and Pichincha, which account for 76% of the land dedicated to potato production and 81% of the production volume. As Table 1 shows the provinces of Chimborazo and Tungurahua, focus of the present study, represent respectively the first and the fourth most important provinces in terms of area harvested, and the second and third in terms of production volume, accounting for about 33% of total production although with some differences in yields (Mancero, 2007; INEC, 2007). Carchi is the most
3 The III Agricultural Census was undertaken between October 1, 1999 and September 30, 2000. It gathered information from a sample of 162,818 production units selected from among all of the country’s provinces.
7
productive potato province in Ecuador, while Chimborazo and Tungurahua have historically had the greatest number of potato farmers and among the top four in terms of total area harvested. Farmers in Chimborazo and Tungurahua tend to be smallholders and poverty is widespread.
Description of the Plataformas
Historically, smallholders have worked on the basis of a traditional and individualist model in which producers work independently on their own potato plots. This remains the primary production method in the country despite high transaction costs associated with the long intermediary chain, the management of market information, the difficulty in accessing certified seeds, and the lack of technical know-how. In contrast, the Plataformas provide an alternative to this traditional and individualist model. The Plataformas are multi-stakeholder platforms, or alliances, which bring farmers together with a range of agricultural support service providers, including INIAP, local NGOs, researchers, universities, and local governments. The Plataforma is part of a comprehensive program which involves practical intervention that pays special attention to improving the participation of low-income farmers in high-value producer chains by providing them with new technologies, by promoting their organization and social capital accumulation, and by involving them in a “value chain vision” of production and commercialization that directly links them with the market. In this regard, and as noted by Devaux, et al. (2009), “this facilitates knowledge sharing, social learning and capacity building, leading to improvements in small farmer productivity and the quality of potatoes supplied to market.”
The Plataformas were implemented by INIAP’s FORTIPAPA project and were run in collaboration with the International Potato Center (CIP) and its Papa Andina Partnership Program (Devaux et al., 2007; 2009). The primary objective of the Plataformas was to “reduce poverty and increase food security, through increasing yields and profits of potato-producing smallholders” (Pico, 2006). The Plataformas’ program was undertaken in four provinces of the Sierra Central, two of which are the focus of the present study, Tungurahua and Chimborazo. These are also the two regions where the intervention first started in 2003.
Five main steps were undertaken in the creation of the Plataformas (Reinoso et al., 2007; Devaux et al., 2007; Pico, 2006):
i. Identification of areas and motivation of actors: Areas for intervention were selected around a clear market opportunity. Potential producer organizations, local service providers and institutions were identified. Productive capacity, agro-ecological characteristics and an inclination to forming alliances— internally (associations within the villages) and externally (external organizations operating within the villages)—were taken into account in the selection process.
ii. Formalization of the Plataformas in a “value chain vision”. Potato value chain analyses were conducted where market barriers, unnecessary intermediations and related costs were identified, while connections with larger markets and agro-industry were initiated. Once all actors agreed on the common “value chain vision” the alliance was formalized under the structure of the multi-stakeholders’ Plataforma.
iii. Develop market and prepare funded action plan (proyecto compartido). Practical actions necessary to achieve the objectives of the Plataforma were defined and
8
agreed upon, and the legal, organizational and functional structures were defined. A very important part in this process was the selection of a local service provider, such as an NGO or a local government to coordinate the established Plataforma. Agricultural technicians responsible for coordinating the provision of agricultural extension, seed supply, developing quotas and managing harvest dates to meet clients’ demands were appointed.
iv. Business development. The value chain vision was implemented. Linkages were created with clients, principally restaurants and fast food chicken restaurants (pollerías), and quotas for delivery were established. Production and harvesting plans were defined, a strategy for input supply was determined and procurement plans were set up.
v. Strengthening the entrepreneurial capacity of potato producers. The final objective was to achieve a functioning Plataforma with farmers as managers. To accomplish this, the Plataforma was legally constituted as the Consorcio de la Papa (CONPAPA, Potato Consortium), which is formed by pre-existing farmers’ associations (Pico, 2006; Devaux et al., 2007). As CONPAPA was strengthened the role of the local service providers in coordinating the Plataforma was reduced. At the moment, most of the roles of the Plataforma are assumed by CONPAPA.
More specifically related to the services provided by the Plataformas, it is important to note that farmers benefited, and learned from, the expertise and services of different stakeholders and facilitators thanks to the multi-level approach undertaken. For instance, the local NGOs selected to be service providers played a significant role by being the direct link with farmers and by providing an array of support, guidance, and training. In some cases they facilitated monthly meetings to discuss plans with farmer groups to meet quotas, to review needs for seed provision and to disseminate important information. They also helped with the selection and quality control of produce, and in many cases, they were in charge of training at the FFSs.
An integral component of the Plataformas was the training provided at the FFS in order to build the knowledge and capacity of farmers. FFS made special emphasis on production technologies and Integrated Pest Management (IPM) techniques aimed to improve quality and quantity of production while protecting the environment and farmers’ health. Farmers were taught techniques to efficiently manage soil, seed, insects, diseases and pesticides using training materials adapted to resource-poor farmers (e.g., Cáceres et al., 2007). With regard to soil management special emphasis was given to techniques to reduce soil erosion as most of the farmers are located in steeped areas. Farmers were taught the importance of renewing seed of good quality and techniques to select their own stocks, considering size, shape and health status of the tubers. Use of synthetic and organic fertilizers was also taught, including sources, methods and periods of application, and dosages. To efficiently manage potato Andean weevil and tuber moths (Phthorimaea operculella, Symmestrischema tangolias and Tecia solanivora), farmers learned the life cycle of the insects and different techniques to reduce the population and damage of the pests. Traps using low-toxicity insecticides are widely used to catch and kill Andean weevil adults. To manage late blight, farmers learned to recognize the symptoms of the disease, the life cycle of the pathogen, the use of resistant potato varieties, and the use of fungicides. Lastly, farmers were taught how to recognize the toxicity level of pesticides (by the color of the label), the main symptoms of intoxication, and how to protect the environment and themselves from risks associated with using pesticides. Hence, the training provided in the FFS with respect to the importance of preserving the environment and of protecting human health, might diminish the over usage of agrochemicals. However,
9

pressure to reach market-required standards might operate in the opposite direction and the net effect on chemical use would need to be empirically determined.
Through the Plataforma, INIAP trained a group of small farmer seed multipliers who receive registered seed to produce good quality seed for Plataforma participants. Seed is graded through an internal quality control system (Narvaez, 2005; Montesdeoca and Narvaez, 2005) and farmers are taught simple techniques to maintain their own seed, and thus, reduce their dependency on registered seeds, which are expensive and not always available. In so doing, the Plataformas have designed and implemented a seed system that combines formal and informal elements (Thiele, 1999).
Of particular importance among varieties used is CIP clone 388790.25 (CIP, 2009) released by INIAP in 1995 as INIAP-Fripapa (Fripapa), and which is specifically suitable for processing and frying (Pumisacho and Sherwood, 2002; INIAP, 2000). INIAP produces, supplies and certifies high quality Fripapa seeds, and has promoted its use in the Plataformas as it is demanded and preferred by fast food restaurants. Fripapa is particularly suitable for resource scarce small producers because it has a good degree of resistance to potato late blight and its use, therefore, reduces the need for frequent fungicide applications. Additionally, it is also a highly demanded variety because it matures earlier than other competitor varieties, such as Diacol-Capiro.
During harvest and commercialization, the Platforms carry out some quality control to ensure marketed potatoes meet clients needs4, They also identify potential clients who can make a commitment to make purchases as long as the produce meet their required standards. In this regard, the sales are done through pre-established verbal agreements. If the quality standards are not met, the Plataformas look for second-best alternatives.
By bringing together all the different stakeholders into a single platform, interactions between potato producers, local authorities, NGOs, extension agents, service providers, researchers, and buyers are facilitated. In this context each stakeholder brings his/her particular expertise to the table and each of his/her contributions supports the overall implementation of the value chain vision. Ultimately, this collective action is meant to improve the prospects of small farmers in agricultural markets.
When the Platformas began its intervention in 2003, farmers participating in the Plataformas marketed 420 MT of potato produced on 10 has of land. In 2007 (when this study was conducted) 1,483 MT of potato from 260 has were marketed (CONPAPA 2008). Through the Plataformas selected fresh potatoes have been marketed to 29 restaurants, fast food outlets and processors in Ambato and Riobamba. According to Devaux et al., (2007; 2009) the price received by members has been estimated to be approximately 30% above the price received by non-Plataforma-members during the same period. This suggests the Plataformas represent a good approach to linking smallholders to the market. To verify that this has been the case empirically and to examine the mechanisms by which this has occurred (if it has), we turn to the next step in this impact evaluation, but before doing that, the sample selection and the data used for this evaluation is described in the following section.
4 In the FFS, farmers are taught how to select the tubers according to size and health status. These tubers are sold to the pollerias in 45 kg bags with the logo of CONPAPA.
10
4. Creating a counterfactual: sample selection, data collection and data description
Sample Selection The challenge of evaluating the impact of a program, project or intervention is that it is not possible to observe what would have happened to participants in its absence. The key to identifying and measuring the impact is, thus, to have a proper counterfactual—that is, a comparison (control) group that is similar to the intervention (treatment) group with the exception that it did not receive the intervention. While econometric techniques are available to identify impact when an imperfect control group is available, this process is simplified by the careful construction of a counterfactual during the process of data collection. In the case of this study, the challenge in creating a counterfactual was complicated by the ex post nature of the evaluation which required creating a counterfactual after the program intervention had been implemented. This entailed ensuring that the communities selected as controls had characteristics similar to the treatment communities at the initiation of the program.
In selecting such communities, a series of steps were taken. First, using the 2001 Ecuador census data, potential control communities that had basic characteristics similar to treatment communities were identified prior to data collection. The characteristics used for identifying the potential control communities included measures of welfare, as well as similarities in geographic and demographic traits. With these characteristics a propensity score matching (PSM) procedure5 similar to the one described below was used to score treated and “potential” control communities to be matched. Once a potential set of communities was identified, these were discussed with key local organizations that had worked closely with the Plataformas with the purpose of determining if they were indeed comparable to the treatment communities. This was done taking into account agricultural production, agro-ecological traits and levels of community and farmer organization in addition to characteristics described above. In this manner, the potential selection resulting from the application of the PSM method was corroborated by local agronomists and organizations that know the area very well. Through this process, the list of possible treatment and control communities were created.
An additional filtering was applied in order to account for other important factors such as the length of time in the Plataformas, whether communities had received other similar interventions, or whether it was feasible to conduct interviews in the selected communities. These considerations aimed to prevent any skewing of the results, while also gauging the feasibility of interviewing in the communities. To this end, some treatment communities were not included in the sample; likewise treatment communities were excluded from the analysis when a reasonable counterfactual could not be identified, because of additional intervention received, or because they were not willing to participate in the surveys. The final community list, located in the regions of Chimborazo and Tungurahua, contained 35 communities (18 treatment and 17 controls), which represents 43% of all treatment communities in the two regions.
Within each treated community, there are community members who participate in the program and others that do not. There are two concerns about including non-participants in the treatment communities as part of the counterfactual. First, they may have chosen not to participate and therefore may be fundamentally different from the participants. Secondly, 5 For further reference see for example: Heckman et al., (1998); Imbens, (2004) ; Ravallion, M., (2005), Ryan and Meng, (2004) etc.
11
since they live in close proximity to beneficiaries they may obtain indirect benefits from the program and in fact many technology adoption programs hope to have these types of spillover effects. Thus, solely using these households as a control group is likely to be problematic, but that depends on what actually happened during the intervention of the program. Yet, since this is a potentially useful group because their observable characteristics are the most similar to the participants they were included in the sample. The final sample then includes three sets of households: i) beneficiaries of the program, ii) non-beneficiaries in the treatment communities (referred to as non-participants), and iii) non-beneficiary households in the control communities (referred to as non-eligible). Lists of households from each of these categories were provided by Plataforma coordinators and community leaders. Households from the lists were randomly selected to be included in the survey. More specifically related to Plataforma participants, in the case of Tungurahua, 157 out of 227 participants were randomly selected to be interviewed, while for Chimborazo 167 out of 232 participants were also randomly selected to be interviewed. This represents 70% and 71% of participants interviewed, respectively. The final sample includes a total of 1007 households of which 683 reside in beneficiary communities (324 participants and 359 non-participants) and 325 in control communities (non-eligible).
The sampling strategy allows for different possible comparison groups, each offering interesting insights. The ideal comparison group partly depends on whether there are indirect, or spillover effects on the non-participants. If there are such effects, including non-participants in the counterfactual would lead to an underestimation of program impact. If indirect effects are substantial it may be desirable to include non-participants as treated households to get the total effect (direct and indirect effect) of the program and use only non-eligible households as a counterfactual. Much depends on what is shown in the data and is thus considered below.
Data Collection and Description The data was collected from June to August of 2007 through a detailed household questionnaire, which was specifically designed to conduct an impact evaluation and which included a number of questions on participation in the Plataforma. The questions were developed based on qualitative information collected through an earlier value chain analysis and focus group discussions. Several revisions of the questionnaire were done during the pilot phase and through conversations with key informants to make it better targeted to potato producers from these two regions. Along with information on program participation the final version of the questionnaire contains sections on: i) land tenure and characteristics; ii) agricultural production with particular attention to potato production and varietal use; iii) use of pesticides and other agro-chemicals; iv) transaction costs in market interactions; v) socio-economic characteristics of the household; and vi) social capital, among others. Additionally, for each selected community (participant and control) a community questionnaire was administered, which included questions on general community characteristics, agricultural production, access to services, and infrastructure. This data is also used in the analysis.
Table 2 presents data on the household characteristics of the overall sample as well as for the three categories of households—beneficiaries, non-participants and non-eligible. The table reports a t-test of means for the different categories to provide initial evidence of significant differences among the groups. The tests of difference for the equality of mean values represents an initial assessment of which group may represent a better counterfactual. The first set of results show that the sample is composed of smallholders that own, on average, 2.56 hectares of land, have about 3 different plots for cultivation, and are located at about
12
3,450 meters above the sea level. Of this land, less than half is dedicated to potato cultivation (1.18 ha on average with no significant differences among the three groups). Farmers have a good percentage of black soil (about 80% of their land) but their land is usually steep (less than 40% is flat or slightly steep), while a good percentage of it is irrigated (slightly more than 50%). The differences in means for this set of land variables show that the three groups are quite similar except for in land holdings and soil type. Beneficiaries and non-eligible households both have larger landholdings (2.64 ha and 3.15 vs. 1.94 ha) and number of plots (on average, about ½ of a plot more) than non-participants. Further the share of black soil for non-eligible households is significantly higher compared to beneficiaries (83% for the former vs. 77% for the latter), although this difference seems minor in absolute terms and is unlikely to have strong effects on production choices. Although there does appear to be some differences, the magnitudes are small, the amount of land cultivated with potato is similar and these differences can easily be controlled for in the analysis.
Moving to the socio-demographic indicators, the results show that the average family size is about 4.7 members with no significant differences among the groups. The average years of education in the family, on the other hand, shows statistically significant differences for all groups – beneficiary households, on average, have almost one more year of education than non-participants and about a half a year more than the non-eligible group. All the other socio-demographic variables are not significantly different between groups, with exceptions found only for the non-eligible group for the age of the head of household (41.3 versus 43.8) and the percentage of indigenous headed households (59% versus 65%). These results indicate that the non-participant group has more similar socio-demographic characteristics to the beneficiary group except for having slightly less education, while the non-eligible group has slightly less education as well but have, on average, older heads of household and a greater percentage of indigenous headed households. Again, however, magnitudes of differences are not dramatically different.
The welfare indicators show that the non-participants are also relatively similar to the beneficiaries in this area. Of the 12 welfare indicators there are only three in which these two groups differ in a statistically significant way: non-participants, on average, own less bulls and oxen, while a greater percentage of them live in homes made of brick or cement. The non-eligible group, on the other hand, has 8 out of 12 indicators in which they differ from the beneficiaries in a statistically significant way: on average, a greater percentage of non-eligible households own an audio system and a refrigerator, own more cows and a greater percentage of them live in a brick or cement home and have access to a water system. Conversely, a lesser percentage of them, on average, own valuable agricultural equipment, or own oxen, and a greater percentage of them have no access to credit or is credit constrained. For these set of indicators, it can be seen that non-participants are more similar to the beneficiary group, except for having fewer bulls and oxen and having better homes. For the last variable, the results show that the average distance to the closest city is only significantly different for the non-eligible households who live in non-participating communities.
For the set of social capital variables the results show that participation in non-agricultural community associations is quite high across groups, with 81% of households in the sample being members to any non-agricultural association. The differences in terms of participation and the maximum number of years as members are not statistically significant. However, the variable for membership to an agricultural organization from within the community does show some significant differences: 44% of beneficiaries belong to an agricultural organization, compared to 13% of non-participants, and 14% for non-eligible and the differences being statistically significant at the 1% level. At first glance, these results would
13
indicate that there is something fundamentally different about the group of beneficiaries, which lead them to participate in an agricultural organization at much higher rates than the possible control groups. However, a good understanding of the procedures necessary for qualification into the Plataformas can easily explain these differences.
The Plataformas encouraged all individuals and associations to participate in the program, however, they gave preference to those that belonged to an existing association (which did not have to be necessarily related to agriculture), but they also allowed individuals to join existing associations, or for new associations and farmer groups, for example, of Farmer Field School graduates. Thus, prior to joining the Plataformas, farmers may have taken part to existing associations, or new groups may have been created specifically to qualify for entrance into the program and it is likely that these took the form of agricultural associations. These local farmer groups were the basis for organizing the provision of seed, extension support and the production plan to ensure that monthly quotas were met. This may explain the differences in the percentages of those that belong to an agricultural association across the three groups compared in Table 2. Another way to see this effect is by looking at the percentage of those that belong to an agricultural association in the non-participant and non-eligible groups, which, as reported in Table 2, is 13% and 14%, respectively, and to think that if the Plataformas had not being introduced, the percentage of those that are now beneficiaries belonging to an agricultural association would have been around the same range.
A way to corroborate this hypothesis is to look at the number of years that farmers have belonged to an agricultural association reported in Table 2. If beneficiaries joined, or formed an agricultural association to qualify for the Plataformas, it would be expected that the maximum number of years belonging to such association would be less than 5 years prior to the implementation of the surveys, which is when the Plataformas were introduced in Tungurahua and then in Chimborazo. Additionally, and to be sure that the levels of social capital are very similar across groups it is important to look deeper into the participation of farmers in non-agricultural and agricultural associations within the community by looking at the rate of participation, the number of years of membership, and the frequency of meetings. Lastly, it is important to look at possible participation with organizations from outside the community that may or may not work in agricultural activities.
To this end, Table 3 presents tests in the difference in means across groups specifically for social capital variables. As previously defined, social capital involves a variety of different elements with the common characteristics of building social tissue and faciliating actions and mutually supportive activities within the constructed tissue. In addition, two kind of social capital can be distinguished: bridging social and bonding social capital. Bridging social capital consists of vertical ties between distinct social and economic classes such as between poorer households and those with influence in formal organizations including government agencies, thus involving intercommunity links. On the contrary, bonding social capital is represented by strong horizontal ties connecting family members, neighbors and business associates at an intra-community level6 (Winters et al., 2006). To analyze in detail the influence of social capital in the analysis undertaken both kind of social capital are taken into account in Table 3.
6 Some theorists argue that the process of economic development involves individuals moving from forms of bonding to linking social capital as they transition from “getting by” to “getting ahead” (Foster, Meinhard and Berger 2003).
14
The results show that for the first set of variables (participation in a non-agricultural association within the community, maximum number of years of membership, and frequency of meetings per year) there are no statistically significant differences across groups. For the second set of variables, still related to association within the community but of agricultural type, there are some significant differences in terms of a higher percentage of beneficiaries belonging to an agricultural association. However, when looking at the maximum number of years of membership in agricultural association within the community, the results show that, on average, the group of beneficiaries is relatively new to these organizations. Beneficiaries only participated to agricultural association for 4.01 years on average, as opposed to 10.07 for non-participants, and 9.78 for non-eligible. This seems to confirm that, on average, the group of beneficiaries joined an agricultural association or took part to creating one specifically to qualify for entering the Plataformas.
Another way to corroborate that the levels of social capital were equal or very similar prior to the initiation of the Plataformas is by looking at the rate of participation for those that have been part of an agricultural association for more than 5 years. The next set of variables confirm this as it can be seen that 7% of beneficiaries have belonged to an agricultural association for more than 5 years vs. 8% for non-participants, and 7% for non-eligible, while all these differences are not statistically significant. Looking at the maximum number of years of membership and the frequency of meetings for this sub-group, the results show that there are no differences across groups. Lastly, the final set of variables show that there are no statistically significant differences between beneficiaries and possible control groups in the bridging social capital, which is the rate of participation with outside organizations that do agricultural and non-agricultural work. These results give a clear indication that in terms of social capital the possible control groups were very similar to the group of beneficiaries prior to the initiation of the Plataformas, while the differences that exist today are clearly due to the Plataforma, are observable and therefore easy to control for.
Table 2 has shown that, at first glance, the more similar possible control group would be the group of non-participants, since they have fewer differences with beneficiaries across all the variables; however, they do seem to be, on average, less endowed with land (size and number of plots), farm animals (oxen and cows), and education. On the other hand, the non-eligible group seems to be equally endowed as the beneficiaries in terms of land, and on average, be fairly better off in terms of having entertainment equipment such as hi-fi and dvd players, home structure and access to water systems, while they slightly lag behind in terms of education, with a greater percentage of indigenous heads of household, less ownership of agricultural equipment and oxen, and more families with credit constraints. This first set of results show that there may be a good number of farmers in the non-participant group and in the non-eligible group potentially more similar to the group of beneficiaries.
Description of indicators and impacts In determining the success of the Plataforma program, we want to first find out whether the intervention it supported reached its primary objective of improving the welfare of participating farmers. To do this we look at the relevant primary indicators. If the answer is positive, that is the intervention increased participants’ welfare, the next step is to consider the mechanisms through which this primary objective was reached; or alternatively why the intervention may have failed to meet its objectives. Lastly, secondary or intermediary indicators arising from Plataforma participation, particularly with regard to knowledge of precautionary measures in agrochemical applications and environmental impacts, are considered. These three sets of variables – primary indicators, mechanisms and secondary
15
indicators- which measure the impacts we are interested on analyzing, are presented in Table 4 for the entire sample as well as for the three distinct groups of households we are comparing. Following the same approach used for Table 2, tests of difference for the equality of mean values are reported for participants versus non-participants, participants versus non-eligible, and participants versus all non-beneficiaries. The test provides an initial assessment of differences in impacts, through comparing the mean values of each indicator, between beneficiaries and all possible control groups.
One of the main objectives of the Plataformas is to improve the welfare of smallholder potato-producers via increasing their yields and gross margins. Gross margins are returns to fixed factors of production which give a good indication of profitability. It is calculated as the total value of the harvest minus the total variable costs incurred for their production. The first set of indicators in Table 4 show that the group of beneficiaries, on average, obtained a greater amount of yields per hectare than the three possible counterfactual groups. The mean values for these indicators between beneficiaries and counterfactual groups are all statistically significant except for the non-eligible group. The range in yields goes from 6.3 metric tons (MT) per hectare for non-participants to 8.4 MT for beneficiaries. Although the average yield for beneficiaries is substantially below the average harvest in Latin America (16 MT), it is consistent with the average for Ecuador (6.80 MT) (INEC; 2007; IYP, 2008;) and about 2 MT above the average of the focus region7 (6 MT per ha on average in the area) (INEC; 2007). Another primary indicator of the success of the Plataformas is the output-seed ratio which is a measurement of productivity and is calculated as the quantity of seeds harvested divided by the quantity of seeds planted per hectare. According to potato experts, a ratio of 1 to 3 is very poor, 4 to 6 is poor, 7 to 9 regular, 10 to 15 good and greater than 15 excellent (Godtland et al., 2003). The ratio for beneficiaries is in the upper bound of the regular range and it happens to be greater than the non-eligible and the group for all non-beneficiaries, although only statistically significant for the non-eligible which is 6.86 and thus fall in between the range of poor (4 to 6) and regular (7 to 9). As for gross margins, the difference in means between beneficiaries and across groups is quite large and these are statistically significant for all, with the lowest margins for the non-eligible at $18.37/ha and the highest for beneficiaries at $259/ha. This initial assessment suggest that beneficiaries had higher yields and returns to potato production.
The mechanisms through which the platform achieves these outcomes is primarily through shortening and improving the efficiency of the potato value chain to decrease transaction costs and capture a higher share of final price for producers, as well as through the application of better agricultural techniques. Transaction costs are specific to each seller thus each household faces a different set of costs, which are often subdivided into ex-ante and ex-post. The first include search or information costs (for obtaining information on the product, its traits and price as well as about trading partners), and negotiation costs (for price negotiation and actual transactions). The latter include monitoring or enforcement costs (for ensuring that terms of sale agreed upon ex-ante are kept) (Hobbs, 1997). Two transaction cost indicators are considered here - time per transaction, and price of sale - in addition to transport cost which is closely related to the transaction. The former is expected to be lower for Plataforma participants as opposed to the control groups and the same applies to transport costs. The price of sale, on the other hand, is expected to be higher. Households on average sell almost half of their potato harvest (45%) at a price of about $0.11 per kg. The transport cost is about $0.01 per kg and the time spent in each transaction is around 1.29 hours. Plataforma 7 Several of the study areas were affected by ash due to the continuous eruption of the Tungurahua volcano which may have lowered yields but would have equally affected both Plataforma farmers and non participants.
16
beneficiaries appear to sell more, receive more value for them and get a higher price per kg than non-beneficairies.
The Plataforma also worked on the input side of the supply chain, thus introducing and supplying the most market-demanded varieties of which Fripapa represents the main variety. The importance of renewing seeds of good quality was emphasized in FFS sessions. In addition, different and new farming techniques were introduced which, in most cases, implied additional input use and consequently additional costs. The mechanisms of increasing yields, thus, should likely include a mix of more effective farming techniques combined with higher and more appropriate use of inputs, thus higher costs. The average total cost for all households is about US $650 per hectare, of which $97 are paid labour costs, $49 purchased seeds or a total of $181 if we include the value of own seeds. The values of seeds planted as well as paid labor appear higher for beneficiaries. So while they receive greater returns to production they are paying more for inputs to get those returns.
The secondary indicators analyze the side impacts of participation in the Plataforma. The first, which considers both health and environmental impacts, is the use of agrochemicals. The FFS introduced an integrated pest management (IPM) approach which combines good management practices, including the use of traps, with the use of low-toxicity pesticides. Nevertheless, in order to comply with standards required, farmers might be inclined to use more pesticides to make sure harvested output is of a required physical quality. Overall, the expected impacts with regard to the use of chemicals, is uncertain. In addition to pesticides, the effects of participation on the use of fertilizers is considered with the expectation that participants would use more fertilizers. Initial assessment suggests that beneficiaries apply significantly more curative fungicides and insecticides than non-participants but not when compared to non-eligible farmers. This highlights the need to carefully consider the proper counterfactual when assessing chemical use. The traps, which have been introduced by FFS for Andean weevil, are clearly more used by beneficiaries compared to all others.
To assess the environmental impact caused by pesticides a methodology -the Environmental Impact Quotient (EIQ)- to account for the toxicity level of the active ingredients contained in each pesticide and for their quantities has been used as described by Kovach et al. (1992). EIQs for each active ingredient were gathered or estimated from literature and aggregated according to the rate and concentration of active ingredient. The calculation provided the EIQ field use rating for insecticides and fungicides (curative and preventive) for each plot, allowing making comparisons of environmental impact between pesticides and different pest management programs (Kovach et al., 1992). The comparison of EIQ measures for fungicides (curative and preventative), insecticides and total EIQ for the three household categories show no significant differences (Table 4). This indicates that even if beneficiaries use more chemicals in terms of quantities and number of applications, their environmental impact is not different than the pesticides used by other household groups, indicating that the type of pesticides beneficiaries use are less toxic.
Another environment-related indicator is the level of agrobiodiversity maintained at the household level—that is, how the composition and share of potato varieties changes due to market participation. The Plataforma program directs its attention towards commercial varieties. In particular the Fripapa variety was introduced and supplied through the intervention of the Plataforma because of its market acceptance and resistance to late blight. If farmers are more specialized, the number of varieties cultivated may be reduced as farmers shift to the market variety. To measure this, four different indexes of diversity, adapted from the ecological literature, are used: the Count, the Margalef, the Shannon and the Berger-
17
Parker index (Magurran, 1988; Winters et al., 2006). Each of these indexes gives a different measure of diversity. The Count or Richness index is a count of the total number of potato varieties that the household reports planting over the season of interest. Richness, or the number of species or varieties encountered, is also measured by Margalef index. The Shannon index calculates proportional abundance or evenness, accounting for the share of land allotted to each variety as well as the number of varieties. The index, thus, combines the concept of evenness and richness. The proportion of land area planted to a variety is used as a proxy for the number of individual plants encountered in a physical unit of area (Winters et al., 2006; Baumgärtner, 2002; Magurran, 1988). Lastly, the Berger-Parker index of inverse dominance expresses the relative abundance of the most common species (Baumgärtner, 2002; Magurran, 1988), or, the most widely grown on each plot by each household. The Shannon and Berger-Parker diversity are based on area planted and are therefore left censored when the household only produces one variety. In the case of the Shannon index by definition it is censored at 0 and in the case of the Berger-Parker index it is censored at 1. The count is also censored at 1 by definition. On average they show that there is not a great diversity in the sample both in terms of evenness (Margalef as well as count that is expressed by the variable Number of Varieties Planted) and in terms of dominance (Berger) as well as for a combination of the two (Shannon). Total potato planted per hectare is about 1000 kilograms, or slightly more, with a large share represented by Fripapa (29%) and by INIAP-Gabriela (30%). While there appears to be no difference in agrobiodiversity among beneficiaries and non-beneficiaries, it does seem that beneficiaries have shifted toward Fripapa and away from Gabriela.
In connection to the use of pesticides and to their toxicity level, some health related measures are considered. The FFS teach the different risks associated with toxicity and how to recognize the toxic level of a product depending on the color of the label whereby the red is the most toxic followed by yellow, blue and finally green which is the less toxic. As a natural consequence of the toxic risks, FFS also teach the use of precautions in applying pesticides and agrochemicals in general. The expectation is that participant farmers are more able to recognize toxicity level and take more precautions in applying agro-chemicals. The percentage of households that use protective measures is in general very low: 19% uses gloves, 13% uses ponchos and 6% use masks (Table 4). Slightly higher is the percentage of farmers that use plastic protection for the shoulders (38%) and those that use boots (89%).The results show that on average 34% of farmers know that the red label indicates high toxicity level and 25% know that the green label indicate less toxic products. The results suggest that participating to the plataforma did lead to more beneficiaries using precautions and having better knowledge about the toxicity of products.
5. The empirical approach
Overview The empirical problem faced in this analysis is the typical one of missing data to fill in the counterfactual; that is, we do not know what the outcomes for participants would have been had they not participated. In experimental evaluations, households are randomly assigned to treatment and control and, assuming a sufficiently large sample size, it is reasonable to assume that the treatment and control are alike in all ways except in receiving the intervention. In most cases, however, experiments are difficult to set up for a number of reasons, including costs and practical issues. Assume, then, that the outcome variable (Yi) depends on treatment di, (where di=1 if households participate, 0 otherwise) and on a set of exogenous variables Xi. The evaluation problem is thus expressed as:
18
Yi=βXi+αdi+εi (1)
Where α, measures the impact of the treatment for individual i, β defines the relationship between Xi and Yi while εi is the error term. This formulation, though, assumes that the outcomes are linear in parameters and that the error term is uncorrelated with the exogenous variables Xi and with treatment. Often times, however, the independent variable di may be correlated with the error term εi leading to a biased estimate of the treatment effect α. The reason estimates are potentially biased stems from the fact that non-random assignment to control and treatment may make treated households fundamentally different from control households thus α may capture not just the impact of the program but these differences. If the source of the problem is program placement bias—that is, differences are due to characteristics of the household the program deemed desirable—the differences should be observable. If self-selection bias is the issue—that is, certain types of households chose to enter into the program—the differences may be unobservable.
Propensity score matching (PSM) offers a potential solution to these problems if differences between the treatment and control are observable. It avoids the linearity function assumption and addresses the common support problem explicitly whilst eliminating the bias through the balancing of covariates between control and treatment group. The basic idea of PSM is to construct a control group who has similar characteristics (Xi) as the treated group, through a predicted probability of group membership calculated via a logit or probit regression, and then compare the outcomes. Rosenbaum and Rubin (1983) introduced the ignorability of treatment assignment or unconfoundness assumption8 showing that treatment can still be conditionally random. If we call YTi, the value of the outcome for the treated household and YCi, is the value of the outcome for the control, these are independent on the treatment (di) but conditional on a set of observable characteristics Xi.
(YTi, YCi,┴ di)|Xi (2)
Rosenbaum and Rubin (1983) also demonstrated that matching on Xi is the same as matching on P(Xi.), where P(Xi.)= Pr(di=1| Xi.). Thus all dimensions of Xi. can be summarized into a predicted probability of being treated. Households in the untreated group that have the same probability of participating would be used as control for their treated counterparts. So if YTi, is the value of the outcome for the treated household and YCi, is the value of the outcome for the counterfactual, the impact of the treatment on the treated can be defined as:
α=E (YTi - YCi| P(X), d=1) (3)
Conditioning on the propensity score, thus, results in the balancing of covariates across the treatment and control group. To achieve a higher balance of covariates among the two groups Dehejia and Wahba (1999, 2002) suggest a balancing test that consists in adding interaction and higher-order terms to the base logit or probit model until tests for mean differences in covariates between control and comparison units become statistically insignificant. In our case, we did not need to apply this test as almost all the differences that were statistically significant in the original sample becomes insignificant once the PSM is applied and matched observations are stratified into blocks. Heckman, Ichimura, and Todd (1997, 1998) and Heckman et al. (1996) as well as Dehejia and Wahba (1999, 2002) show that PSM does well in replicating the experimental results provided researchers have access to a rich set of
8 Also called assumption of selection on observables (Heckman and Robb, 1985).
19
covariates or control variables and use the same survey instruments. In the PSM approach, a common method of determining statistical significance of results is to use bootstrapped standard errors since it provides reliable standard errors for all of the matching estimators and also accounts for the fact that the balancing score is estimated (Diaz and Handa, 2006).
An alternative to using PSM, particularly when control and treatment although not randomly assigned are reasonably comparable, is a weighted least squares procedure that uses weights calculated by the inverse of the propensity score (Sacerdote, 2004; Todd et al, 2008). Weighting by the inverse of the estimated propensity score is demonstrated to achieve covariate balance and, in contrast to matching and stratification/blocking, uses all of the observations in the sample (Sacerdote, 2004). To calculate E[YTi] and E[YCi] weights are used as follows (Hirano and Imbens, 2001):
E[YTi]= E ⎥⎦
⎤⎢⎣
⎡)( i
ii
XpdY (4)
and
E[YCi]= E ⎥⎦
⎤⎢⎣
⎡−
−)(1)1(
i
ii
XpdY (5)
Using equations (5) and (6), the weighting estimator, τw, provides a consistent estimate of the average treatment effect thus representing an alternative to matching or stratifying on the propensity score (Hirano et al., 2000; Sacerdote, 2004; Todd et al., 2008):
[ ] [ ] ∑=
⎥⎦
⎤⎢⎣
⎡−−
−=−=N
i i
ii
i
iiCTw Xp
YdXpYd
NYEYE
1 )(1)1(
)(1τ (6)
This estimator is consistent, although it can be less efficient than full covariate matching (Hahn, 1998; Heckman et al., 1998; Hirano et al., 2000). The biggest advantage of this estimator is that it can be used in regression in which Xi is included as a set of covariates so standard tests of significance can be used (Robins and Rotnitzky, 1995; Hirano and Imbens, 2001). Furthermore, it retains the full information from all households. Using weights ensure no correlation between treatment and covariates leading to a consistent estimate of the average treatment effect (Imbens, 2004; Todd et al., 2008).
Approach taken
In the data collected for this analysis, there are different options for creating a counterfactual. The best approach to take is complicated by the fact that there may be indirect effects of the program on non-participants in the treatment communities. It is further complicated by the self-selection into the program of beneficiaries. Such self-selection may make participants fundamentally different from non-participants. Below are the options for creating a counterfactual.
i) Beneficiaries versus non-beneficiaries. This assumes that there are no indirect effects or these are small. If there are indirect effects, this underestimates impact. It also assumes that differences between beneficiaries and non-participants due to self-selection into the program can be controlled for.
20
ii) Beneficiaries versus non-participants. This also assumes no indirect effects and we can control for program self selection. The advantage of comparing households within the treatment communities is that the counterfactual avoids any location specific effect—that is, differences in control and treatment communities.
iii) Beneficiaries versus non-eligible households. This avoids the self-selection issue and assumes a counterfactual can be found among the non-eligible households. It ignores any indirect effects of the program.
iv) Treatment communities (beneficiaries and non-participants) versus control communities (non-eligible households). The benefit of this approach is that it captures both direct and indirect effects and, assuming the control communities are a reasonable counterfactual, avoids the self-selection issues and is an estimate of the intent-to-treat.
In considering the approach to take it is important to recall one key element in the selection of communities and individuals for the program was participation in associations and organizations already operating in the area. As noted in the discussion of the survey design, the level of social capital was carefully factored in to selecting control communities. In control villages, people had no choice to participate as the program was not active in their communities thus there should be households in the non-eligible communities that are similar to treated households. This suggests that using social capital variables should help in identifying households that would represent a reasonable counterfactual. As seen in Tables 2 and 3 which compared the different categories of households, prior to recent times the levels of social capital is similar across the communities and the different categories of households. The only difference is in the recent, the last few years, trend in joining agricultural organizations within the communities by beneficiary households. Social capital variable, which are observable, seem key to identifying impact.
The second issue to consider is the possibility of indirect effects of the program on non-participants in the treatment communities. Even if there are indirect effects, they are likely to be small since non-participants would not have obtained the benefits of market access, which appear substantial, and instead are only likely to receive indirect benefits from improved access to seed and transmission of new production technologies. However, Table 4 provided little evidence of any indirect effects on non-participants indicating that if these are ignored they are unlikely to create any bias and if they do would lead to an underestimate of program impact. If an impact is found and indirect effects ignored it suggest that if any the impact is higher.
Overall, these insights suggest a strategy forward. The primary specification would take all non-beneficiaries as the potential counterfactual. There are differences in exogenous variables between these households, but the magnitude is small, and as shall be seen below, the range of characteristics are similar (that is, there is common support). The key then is to control for observable differences to ensure an unbiased estimate of impact. Key among these control variables are variables of social capital. Among other social capital variables, we use whether the household recently participated in agriculture organization. Since we know this is closely related to participation in the platform, controlling for this variable in regressions or using it in matching ensures we control for those unobservables that may have driven certain households to participate. Our assumption is then that this control is correlated with any unobservables that drive households to join the program and thus any bias associated with
21
self-selection is eliminated. Given our intimate knowledge with how the Plataforma works this is a reasonable assumption.
To proceed, we estimate the impact of the program using three approaches, i) a standard OLS with multiple controls, ii) propensity score matching using a kernel weighting scheme and bootstrapped standard errors, and iii) an intermediate approach of weighted least squares with weights determined as previously discussed from the propensity scores. Additionally, we also reconsider the use of all non-beneficiaries as the best counterfactual and check the robustness of results using the four alternative counterfactuals noted above.
Before proceeding to the impact estimates found from the above approaches, we first consider the probit on participation. Table 5 reports the results from the probit on Plataforma participation with marginal effects, calculated at the sample mean, reported instead of coefficients for ease of interpretation. The model is capable of correctly predicting 73.40% of beneficiaries vs. non-beneficiaries and shows the importance of a number of variables. The differences are as expected and reflect those found in the descriptive statistics (Table 4). Note that the key variable is membership in an agricultural organization within the community.
Using the probit results, propensity scores are calculated for beneficiary and non-beneficiary households. Figure 1 shows the kernel density estimates of the distribution of estimated propensity scores for each group. As can be seen in the figure, the scores obtained are almost totally in the area of common support suggesting that non-beneficiaries represent a reasonable counterfactual to the beneficiary population. Furthermore, using the results of a propensity score matching procedure, a punctual test of means is run and the results examined in Table 6. This results in a drastic reduction of significant differences across the two groups thereby demonstrating the capability of the method to balance the baseline covariates and to make the two groups highly comparable.. Nevertheless, the difference in mean propensity score across the treatment and control groups (mean of 0.37 in the treatment group versus 0.29 in the control group, p < 0.000) implies that simply conditioning on X through an OLS specification might not have yielded the correct average treatment effect (ATT) if this effect is in fact heterogeneous. Given these results, both a propensity score matching and weighted matching approach should be used being about unbiased estimates of impact.
6. Impact analysis and results
Table 7 reports the results of the analysis of the least squares regression, propensity score matching and weighted least squares comparing Plataforma beneficiaries to non-beneficiaries. Table 8 then reports the results of the analysis using the weighted least squares using the alternative counterfactual groups. This analysis is done to demonstrate consistency and robustness of results. As shown in the tables, the results are remarkably consistent across specification and make sense for the different types of counterfactual indicating that the impact is well identified. The results are discussed first for the main indicators of primary impact followed by a discussion of the mechanism through which these have been achieved and of secondary indicators.
The results in Table 7 show that all three primary indicators of impact are positively and significantly influenced by participation in the program with the estimated differences very similar across specification. The results suggest that yields are 33.3% percent higher as a result of the platform intervention, input output ratios are about 20% higher and gross margins per hectare were four fold higher. The results in Table 8 using alternative counterfactual suggest results are similar even when using alternative combinations of counterfactuals. The
22
similar results when using the non-participants suggests there were little or no indirect effects and suggests that participating to the Plataformas program implied a successful welfare improvement for beneficiary farmers.
Given the overall benefits of the program, it is important to get a sense of the reason for obtaining these benefits. The mechanisms working to achieve these results show that beneficiaries sell more of their harvest as compared to non-beneficiaries both in terms of percentage sold as well as quantity per hectare harvested. The amount sold also provided a greater value for the beneficiary sellers and appears to be achieved both due to the higher yield and a significantly higher price. Prices obtained were about 30% higher than those who were not in the program. Input costs appear to be higher for the beneficiaries, which is largely driven by significantly higher costs of seed planted and higher labor costs. Overall, it appears that while beneficiary farmers paid more for some key inputs, they received the benefits of this investment through higher yields and higher prices and thus higher returns to potato production.
Moving into the secondary indicators of impact, as noted earlier, there is some concern that linking smallholders to market may lead to higher returns but at a cost of greater environmental and health problems. The increased use of inputs suggests this might be a problem. The evidence is somewhat mixed, but does not seem to imply a widespread problem. Beneficiaries do not use significantly more fungicides, but do use significantly more insecticides and chemical fertilizers. The evidence does not suggest, however, that they are using more toxic mixes of chemicals and in fact suggests that they can identify toxic products better than before joining the Plataforma most likely due to the training they received. Additionally, traps for Andean weevil are more likely to be used by beneficiaries than non-beneficiaries. The increased use of insecticides and chemical fertilizers may be due to quality requirement for tubers to be a certain size and free from any damage (including insect damage). The health costs of increasing production and insecticide use are likely to be minimal if there are any and there may even be some gains in health status. Program participants are generally more likely to use protective gear as evidenced by a greater use of a plastic poncho and mask.
A final secondary concern relates to the influence of linking farmers to market on agricultural biodiversity. Market pressure may lead farmers to abandon traditional varieties and produce those demanded by high-value markets. The evidence does not support this hypothesis as indicated by the insignificant impact on any of the measures of agricultural biodiversity. In fact, what appears to have happened is that farmers replaced one modern variety Gabriela with another variety Fripapa, which is demanded for its frying qualities. Thus, this group of farmers is maintaining the same diversity level although changing the primary market variety grown. Anecdotal evidence shows, indeed, that although Ecuador is center of origin for a large range of potato species, the genetic diversity of the native cultivars has been diminishing in the recent past as growers prefer higher yielding, market type and more resistant varieties (Vásquez-Castillo and Poole, 2006). In addition, the El Niño high rainfall event which occurred in 1984 and caused very extensive crop loss may also have contributed to biodiversity reduction of potato varieties (Wismantal, 1988).
7. Conclusions
In this paper, the challenges of linking smallholder potato farmers to higher-value markets is examined by looking at the experience of the multistakeholder Plataformas program in the
23
provinces of Chimborazo and Tungurahua in Ecuador. The hope of such a program is to reduce poverty and increase food security, by means of higher yields and profits of potato-producing smallholders. As such the primary indicators to consider in analyzing the impact of the program is to look at yields and profit margins. Of course, in assessing the program it is critical to consider the mechanisms through which primary objectives were achieved in order to understand why the program was successful and draw policy implications. Additionally, key elements to successfully implement the project, and thus crucial to take into account, were the existence of social capital and how this was strengthened through the program intervention as well as the capacity of the farmers organization to manage market linkages. Lastly, secondary indicators arising from Plataforma participation, particularly with regard to health related measures and environmental impacts have been analyzed to ensure the intervention of program created no negative externalities and to capture any indirect effects.
To ensure identification of program impact, the data set was constructed in order to ensure a reasonable counterfactual for comparing beneficiaries; in addition the econometric approach was carefully considered. Three approaches have been used to conduct the econometric analysis, including: i) a standard OLS with multiple controls; ii) propensity score matching using a kernel weighting scheme and bootstrapped standard errors; and iii) an intermediate approach of weighted least squares with weights determined as the inverse of the propensity score. All the methods applied provide consistent and robust results. Additionally, the use of all non-beneficiaries as the best counterfactual was also reconsidered through contrasting beneficiaries to the four alternative counterfactuals noted above in order to check the robustness of results. While these different comparisons allow the identification of indirect effects of the program on non-participants, our analysis has provided little evidence of any of such indirect effects. In addition, the potential self-selection into the program of beneficiaries that may make participants fundamentally different from non-participants had to be taken into account. One key element has dramatically helped to control for potential self-selection bias that is social capital. In selecting communities and individuals for program participation it was essential, indeed, the existence of associations and organizations in the area. While, the level of social capital has been carefully factored in selecting control communities, this suggested that using social capital variables should help identifying households that represent a reasonable counterfactual. The analysis conducted has corroborated this hypothesis, and has showed that controlling for social capital variables, in addition to a series of other covariates, ensure an unbiased estimate of impact.
The results are strongly consistent across the different specifications and the different types of counterfactuals suggesting that the impact is well identified. Our findings suggest that the Plataforma’s program successfully improved the welfare of beneficiary farmers. All impacts related to the primary objectives of the Plataforma that are: yields, gross margins and input-output ratio, are positive and significantly influenced by participation in the program with the estimated differences very similar across specification. Since similar results are obtained when using the non-participants as a control group very little or no indirect effects of the program is implied. The mechanisms through which the Platforma achieves this success is through shortening and improving the efficiency of the potato value chain as well as through the application of better agricultural techniques, thus decreasing transaction costs with the former, and improving yields with the latter. Results show that not only beneficiaries sell more of their harvest as compared to non-beneficiaries both in terms of percentage as well as quantity per hectare harvested, but they also sell at a price that is about 30% higher than those who were not in the program. To achieve these results, though, participant farmers have higher input costs, particularly for seeds (of which a higher percentage and quantity per
24
hectare is bought) as well as for hired labour and fertilizers. Nevertheless, participants receive the benefits of this investment through higher yields and higher prices and thus higher returns to potato production. The existence of social capital has proved to be fundamental in implementing the program which, through its intervention, has strengthened the social tissue and has built or improved the capacity of farmers to link successfully to the market.
Last, but not least interesting, are the secondary impacts mainly related to environment and health for which, as noted earlier, there is some concern about increased use of inputs. While the results are somewhat mixed with respect to the use of agrochemicals, they do not seem to suggest a substantial problem. Our findings show that participants use significantly more insecticides and chemical fertilizers, however, they are likely using less toxic products as the environmental impact is not significantly different than non-beneficiaries. These results might also be reinforced through the FFS and IPM approach used by the program as it appears that through a better knowledge of risks and hazards associated to the use of agro-chemicals participant farmers tend to use more protective gears, although overall the percentages are remarkably small. Likewise the concern related to potential impacts on agricultural biodiversity is unfounded as seen by the insignificant effect on any of the four indexes of agricultural biodiversity considered. Results suggest that, although farmers are maintaining their diversity, genetic erosion, if any, happened in the past because of a combination of natural causes (El Niño), agro-industrialization and farmers’ preferences in response to changing market opportuntiies, since most of the varieties cultivated are modern varieties. Thus, any policy or program aimed at reinforcing, reintroducting or maintaining local varieties needs to consider the importance of creating a market and a demand for local varieties.
Overall, participation in the Plataforma suggests a successful way of linking smallholder potato farmers to the global market. While primary benefits are undoubtedly obtained, concerns related to potential costs supported by the natural resource base with respect to varieties cultivated and agrochemical impact seem to be unfounded. The success of the Plataforma can be first explained by its patient and efficient intervention along the value chain, eliminating unnecessary transaction costs and intervening also on the input side, not only introducing and supplying market-demanded varieties but also, and above all, providing good quality seeds and teaching the importance of renewing seeds often. Secondly, the importance of the social capital in determining participation to the Plataforma can explain its successful results, while suggesting the most effective way of overcoming entrance barriers. In this regard a more detailed analysis of social capital elements and effects as well as of the diverse set of transaction costs is worth exploring. It is important to note, finally, that while the program proved very successful, it only applies to a small proportion of Ecuadorian potato producers. Thus, if any significant effects are aimed at national level, successful programs and interventions such as this need to be scaled up taking into account context specific situations and using appropriately those elements that have proven successful.
25
References An, H. 2004. Microeconomic effects of macroeconomic policy changes in Ecuador: Potato
production after dollarization, The Faculty of Graduate Studies. Ontario, University of Guelph. Master of Science.
Barrett, C.B., E.B. Barbier, T. Reardon. 2001. Agroindustrialization, globalization, and international development: the environmental implications, Environment and Development Economics 6 (2001): 419–433
Baumgärtner, S. 2002. Measuring the diversity of what? And for what purpose? A conceptual comparison of ecological and economic measures of biodiversity, Paper presented at Healthy Ecosystems, Healthy People – Linkages between Biodiversity, Ecosystem Health and Human Health, Washington, D.C. (USA), 6-11 June. http://www.eco.uni-heidelberg.de/ng-oeoe/research/papers/DivMeas.pdf
Berdegué, J., F. Balsevich, L., Flores, T., Reardon. 2003. Supermarkets and Private Standards for produce quality and safety in central America: development implications, Report to USAID under the RAISE/SPS project , Michigan State University and RIMISP, july
Bryson, A., Dorsett, R., and Purdon, S. 2002. The Use of Propensity Score Matching in the Evaluation of Active Labour Market Policies, Working Paper Number 4, Department for Work and Pension, London, UK
Cáceres, P.A., Pumisacho, M., Forbes, G.A., y Andrade-Piedra, J.L. 2007. Guía para facilitar el aprendizaje sobre control de tizón tardío de la papa. Centro Internacional de la Papa (CIP), Instituto Nacional Autónomo de Investigaciones Agropecuarias del Ecuador (INIAP), Secretaría Nacional de Ciencia y Tecnología del Ecuador (SENACYT). Quito, Ecuador. 142 p.
CIP. Centro Internacional de la papa. 2009. CIP Potato Varieties. International Potato Center. Lima, Peru. Available at:………………………………………………………………….. http://research.cip.cgiar.org/potato/GR/table.php?grp=allPV&tmpl=potato&frmt=html
Coleman, J. 1988. Social Capital in the Creation of Human Capital. American Journal of Sociology, Supp, S95-S120.
CONPAPA, Consorcio de la Papa. 2008. Proyecto FORTICONPAPA Informe 2007. CONPAPA, Agencia Suiza para el Desarrollo y la Cooperación. Ambato, Ecuador. 34 p.
Crissman, Charles C; Antle, John M; Capalbo, Susan M (eds). 1998. Economic, environmental, and health tradeoffs in agriculture: Pesticides and the sustainability of Andean potato production. Natural Resource Management and Policy Series. Dordrecht; Boston and London: Kluwer Academic in cooperation with the International Potato Center
De Haen, H., K. Stamoulis, P. Shetty, and P. Pingali. 2003. The World Food Economy in the Twenty-first Century: Challenges for International Co-operation, Development Policy Review 21 (5–6): 683.
Dehejia, R., and Wahba, S. 1999. Causal Effects in Non Experimental Studies; Reevaluating the Evaluation of Training Programs, Joumal of the American Statistical Association 94(448):1053-62.
26
Dehejia, R.H., and Wahba, S. 2002. Propensity score-matching methods for nonexperimental causal studiesl, Review of Economics and Statistics 84(1): 151.61.
Devaux, A. Horton, D. Velasco, C. Thiele, G. López, G. Bernet, T. Reinoso, I. Ordinola, M. 2009. Collective Action for Market Chain Innovation in the Andes. Food Policy, 34:31-38.
Devaux, A., Velasco, C., López, G., Bernet, T., Ordinola, M., Pico, H., Thiele, G., and Horton, D. 2007. Collective Action for Innovation and Small Farmer Market Access: The Papa Andina Experience. CAPRi Working Paper 68. Washington, DC: IFPRI. http://www.capri.cgiar.org/pdf/capriwp68.pdf
Diaz, J.J; and Handa, S. 2006. An Assessment of Propensity Score Matching as a Nonexperimental Impact Estimator, Evidence from Mexico’s PROGRESA Program, The Journal of Human Resources, XLI, 2, pp. 319- 346
Dietrich, M. 1994. Transaction Cost Economics and Beyond, Routledge, London
Dolan, C. and Humphrey, J. 2004. Changing governance patterns in the trade in fresh vegetables between Africa and the United Kingdom', Environment and Planning A, 36(3): 491-509
Eaton, C. and A.W. Shepherd. 2001. Contract Farming: Partnerships for Growth, FAO Agricultural Services Bulletin 145, Rome: Food and Agricultural Organisation.
FAOSTAT. 2007. http://faostat.fao.org/site/567/default.aspx#ancor
Foster, M.K., Meinhard, A.G., and Berger, I. 2003. The role of social capital: Bridging, bonding or both, Paper presented at the Annual ARNOVA Conference, Denver , Colorado, 20-22 November.
Godtland, E., Sadoulet, E., deJanvry, A., Murgai, R., and Ortiz, O. 2003. The Impact of Farmer-Field-School on Knowledge and Productivity: A Study of Potato Farmers in the Peruvian Andes, CUDARE working papers, Paper n. 963, Department of Agricultural and Resource Economics, University of California Berkeley.
Hahn, J. 1998. On the Role of the Propensity Score in Efficient Semiparametric Estimation of Average Treatment Effects. Econometrica, 66(2), pp. 315–331.
Heckman, J., and Robb, R. 1985. Alternative Methods of Evaluating the Impact of Interventions: An Overview, Journal of Econometrics, 30: 239-67.
Heckman, J.J., Ichimura, H. and Todd, P. 1998. Matching as an Econometric Evaluation Estimator. Review of Economic Studies, 65(2), pp. 261 – 294.
Heckman, J.J., Ichimura, H. and Todd, P.E. 1997. Matching As An Econometric Evaluation Estimator: Evidence from Evaluating a Job Training Programme. Review of Economic Studies, 64, 605-654.
Heckman, J.J., Ichimura, H., Smith, J., and Todd, P.E. 1996. Sources of selection bias in evaluation social programs: An interpretation of conventional measures and evidence on the effectiveness of matching as a program evaluation method. Proceedings of the National Academy of Sciences of the USA 93:13416.20.
Herrera, M., Carpio, H., and Chávez, G. 1998. Estudio Sobre el Subsector de la Papa en el Ecuador, INIAP, Quito.
27
Hirano, K. and Imbens, G.W. 2001. Estimation of Causal Effects using Propensity Score Weighting: An Application to Data on Right Heart Catheterization. Health Services and Outcomes Research Methodology, 2(3-4), pp. 259 –278.
Hirano, K., Imbens, G.W. and Ridder, G. 2000. Efficient Estimation of Average Treatment Effects Using the Estimated Propensity Score, Technical Working Paper 251, National Bureau of Economic Research, Cambridge, Massachusetts.
Hobbs, J.E. 1997. Measuring the Importance of Transaction Costs in Cattle Marketing, American Journal of Agricultural Economics 79 (November): 1083–95.
Imbens, G.W. 2004. Nonparametric Estimation of Average Treatment Effects Under Exogeneity: A Review. The Review of Economics and Statistics, 86(1), pp. 4–29.
INEC, Instituto Nacional de Estadísticas y Censos del Ecuador. 2000. III Censo Nacional Agropecuario, Quito, Ecuador. Available at:………………………………………….. http://www.inec.gov.ec/web/guest/ecu_est/est_agr/cen_agr?doAsUserId=W9NEZWtSVLU%253D
INEC, Instituto Nacional de Estadísticas y Censos del Ecuador. 2007. Encuesta de superficie y producción agropecuaria continua ESPAC, Quito, Ecuador. Available at:…………… http://www.inec.gov.ec/web/guest/ecu_est/est_agr/espac?doAsUserId=W9NEZWtSVLU%253D
INIAP, Instituto Nacional Autónomo de Investigaciones Agropecuarias. 2000. Fripapa – Variedad de papa resistente a tizón tardío o lancha (Phytophthora infestans) con aptitud para consumo en fresco y procesamiento (hojuelas y bastones), INIAP, Programa Nacional de Raíces y Tubérculos rubro Papa (PNRT-Papa). Quito, Ecuador.
IYP, FAO, International Year of the Potato. 2008. Available at:…………………………… http://www.potato2008.org/en/index.html
Johnson, N., and Berdegué, J. 2004. Collective Action and Property Rights For Sustainable Development: Property Rights, Collective Action, and Agribusiness, IFPRI Policy Brief, Focus: A 2020 Vision for Food, Agriculture, and the Environment, n. 13, IFPRI: Washington D.C.
Kovach, K., Petzoldt, C., Degnil, J., and Tette, J. 1992. A method to measure the environmental impact of pesticides. New York’s Food and Life Sciences Bulletin, number 39.
Little, P.D. and M.J. Watts (eds.). 1994. Living under Contract: Contract Farming and Agrarian Transformation in Sub-Saharan Africa, Madison: University of Wisconsin Press.
Magurran, A. 1988. Ecological diversity and its measurement. Princeton, NJ: Princeton University Press.
Mancero, L. 2007. Potato Chain Study, with contributions from producers participating in 3 experiences in the Central Ecuadorian Sierra Region, Report, CIP-FAO, available at: ftp://ftp.fao.org/es/esa/lisfame/PotatoValueChainEcuador.pdf
Meng, X., and Ryan, J. 2004. Using Evaluation Methodology to Determine The Effects of the FFE Program on Schooling Outcomes, Does Food for Education Affect Schooling Outcomes? The Bangladesh Case, Appendix n. 5 in Impact Assessment Discussion Paper
28
n. 22: The Contribution of IFPRI Research and the Impact of Food for Education Program in Bangladesh on Schooling Outcomes and Earnings.
Montesdeoca F., Narváez, G., Mora, E. y Benítez, J. 2005. Manual de Control Interno de Calidad (CIC) en tubérculo - semilla de papa. FORTIPAPA, INIAP. Quito, Ecuador.
Narváez, G. 2005. Ajuste de los parámetros del protocolo de control interno de calidad (CIC) propuesto por FORTIPAPA para la producción de semilla de papa registrada y certificada en base a situaciones reales de campo en cuatro localidades. Tesis B.Sc. Universidad Central del Ecuador. Quito, Ecuador.
OFIAGRO, Oficina de Estudios para el Agro. 2009. Diagnóstico de la Situación Actual de la Cadena Agroalimentaria de la Papa en Ecuador, CIP, Centro Internacional de la Papa, proyecto Papa Andina. Quito, Ecuador (in press).
Pico, H. A. 2006. La cadena agroalimentaria de la papa a través de la metodología de plataformas de concertación y proyectos compartidos, paper presented at the 1st national Ecuadorian potato congress, 17-19 May 2006, INIAP, Estación Experimental Santa Catalina Quito – Ecuador. Available at:………………………………………………………………. http://www.quito.cipotato.org/presentambato/TEMATICAS%20DEL%20CONGRESO/COMERCIALIZACION/HPICO.doc
Pingali, P. 2001. Environmental consequences of agricultural commercialization in Asia, Environment and Development Economics 6: 483–502
Pumisacho, M. and Sherwood, S., Eds. 2002. El cultivo de la papa en Ecuador. Quito, Ecuador., Instituto Nacional Autónomo de Investigaciones Agropecuarias (INIAP) y Centro Internacional de la Papa (CIP). Quito, Ecuador.
Putnam, R.D. 1995. Bowling alone: America’s declining social capital. Journal of Democracy, 6, 65-78.
Ravallion, M. 2005. Evaluating Anti-Poverty Programs, World Bank Policy Research Working Paper 3625, June 2005
Reardon, T. and J. Berdegué. 2002. ‘The Rapid Rise of Supermarkets in Latin America: Challenges and Opportunities for Development’, Development Policy Review, Vol.20, No.4, pp.371–88.
Reardon, T., C.P. Timmer, C.B. Barrett, and J. Berdegué. 2003. The Rise of Supermarkets in Africa, Asia, and Latin America, American Journal of Agricultural Economics 85 (5): 1140-1146.
Reinoso, I., Pico, H., Pumisacho, M., Montesdeoca, F., Monteros, C., Cuesta, X., and Thiele, G. 2007. Cadenas Agroalimentarias: Plataformas de concertación y proyectos compartidos, INIAP, Papa Andina, COSUDE, Quito.
Robins, J.M. and Rotnitzky, A. 1995. Semiparametric Efficiency in Multivariate Regression Models with Missing Data. Journal of the American Statistical Association, 90(429), pp. 122–129
Rosenbaum, P., and Rubin, D. 1983. The Central Role of the Propensity Score in Observational Studies for Causal Effects, Biometrica 70(l):41-55.
29
Ryan, J. G., and Ming, X. 2004. The Contribution of IFPRI Research and the Impact of the Food for Education Program in Bangladesh on Schooling Outcomes and Earnings, IFPRI, Impact assessment discussion paper no. 22, ifpri, Washington, D.C.
Sacerdote, B. 2004. Fixing broken experiments using the propensity score, in: A.Gelman and X. Meng (eds) Applied Bayesian Modeling and Causal Inference from Incomplete-Data Perspectives. (Hoboken, N.J.: John Wiley and Sons, Ltd.), pp: 61–71.
Thiele, G. 1999. Informal Potato Seed Systems in the Andes: Why Are They Important and What Should We Do With Them? World Development ,Vol. 21, No. 1: 83-99.
Todd, J. E., Winters, P., and Hertz, T. 2008. Conditional Cash Transfer and Agricultural Production: Lessons from the Oportunidades Experience in Mexico.
Vásquez Castillo, W., and Poole, N. 2006. Potato Industry in Ecuador: production and commercialization, El Taller Azul, Quito, Ecuador.
Weismantel, M. J. 1988. Food, Gender and Poverty in the Ecuadorian Andes, Waveland Press, USA.
Williamson, O. 1985. The Economic Institutions of Capitalism, The Free Press, New York.
Winters, P., Cavatassi, R., and Lipper, L. 2006. Sowing the Seeds of Social Relations: The Role of Social Capital in Crop Diversity, ESA Working Paper No. 06-16, ESA- FAO, Rome
Winters, P., Simmons, P., and Patrick, I. 2005. Evaluation of a Hybrid Seed Contract Between Smallholders and a Multinational Company in East Java, Indonesia, The Journal Of Development Studies, 41 (1): 62 – 89
30
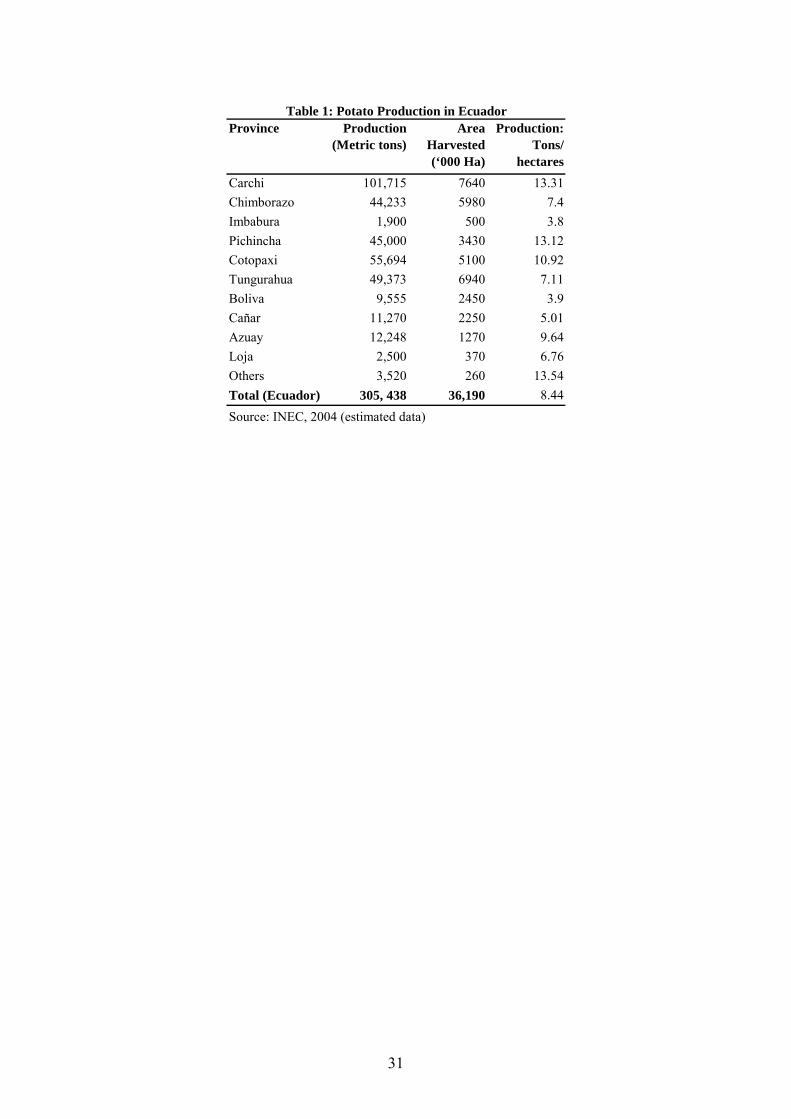
Province Production (Metric tons)
Area Harvested (‘000 Ha)
Production: Tons/
hectaresCarchi 101,715 7640 13.31Chimborazo 44,233 5980 7.4Imbabura 1,900 500 3.8Pichincha 45,000 3430 13.12Cotopaxi 55,694 5100 10.92Tungurahua 49,373 6940 7.11Boliva 9,555 2450 3.9Cañar 11,270 2250 5.01Azuay 12,248 1270 9.64Loja 2,500 370 6.76Others 3,520 260 13.54Total (Ecuador) 305, 438 36,190 8.44Source: INEC, 2004 (estimated data)
Table 1: Potato Production in Ecuador
31
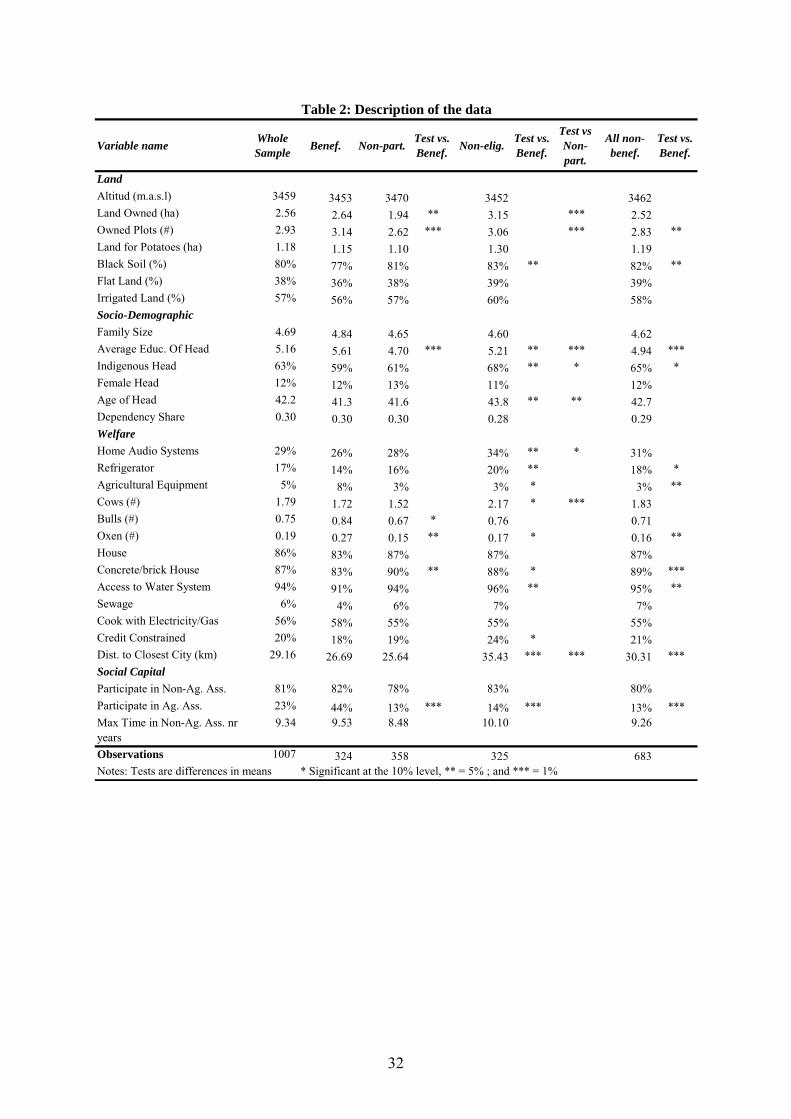
Variable name Whole Sample Benef. Non-part. Test vs.
Benef. Non-elig. Test vs. Benef.
Test vs Non-part.
All non-benef.
Test vs. Benef.
LandAltitud (m.a.s.l) 3459 3453 3470 3452 3462Land Owned (ha) 2.56 2.64 1.94 ** 3.15 *** 2.52Owned Plots (#) 2.93 3.14 2.62 *** 3.06 *** 2.83 **Land for Potatoes (ha) 1.18 1.15 1.10 1.30 1.19Black Soil (%) 80% 77% 81% 83% ** 82% **Flat Land (%) 38% 36% 38% 39% 39%Irrigated Land (%) 57% 56% 57% 60% 58%Socio-DemographicFamily Size 4.69 4.84 4.65 4.60 4.62Average Educ. Of Head 5.16 5.61 4.70 *** 5.21 ** *** 4.94 ***Indigenous Head 63% 59% 61% 68% ** * 65% *Female Head 12% 12% 13% 11% 12%Age of Head 42.2 41.3 41.6 43.8 ** ** 42.7Dependency Share 0.30 0.30 0.30 0.28 0.29WelfareHome Audio Systems 29% 26% 28% 34% ** * 31%Refrigerator 17% 14% 16% 20% ** 18% *Agricultural Equipment 5% 8% 3% 3% * 3% **Cows (#) 1.79 1.72 1.52 2.17 * *** 1.83Bulls (#) 0.75 0.84 0.67 * 0.76 0.71Oxen (#) 0.19 0.27 0.15 ** 0.17 * 0.16 **House 86% 83% 87% 87% 87%Concrete/brick House 87% 83% 90% ** 88% * 89% ***Access to Water System 94% 91% 94% 96% ** 95% **Sewage 6% 4% 6% 7% 7%Cook with Electricity/Gas 56% 58% 55% 55% 55%Credit Constrained 20% 18% 19% 24% * 21%Dist. to Closest City (km) 29.16 26.69 25.64 35.43 *** *** 30.31 ***Social CapitalParticipate in Non-Ag. Ass. 81% 82% 78% 83% 80%Participate in Ag. Ass. 23% 44% 13% *** 14% *** 13% ***Max Time in Non-Ag. Ass. nr years
9.34 9.53 8.48 10.10 9.26
Observations 1007 324 358 325 683Notes: Tests are differences in means * Significant at the 10% level, ** = 5% ; and *** = 1%
Table 2: Description of the data
32
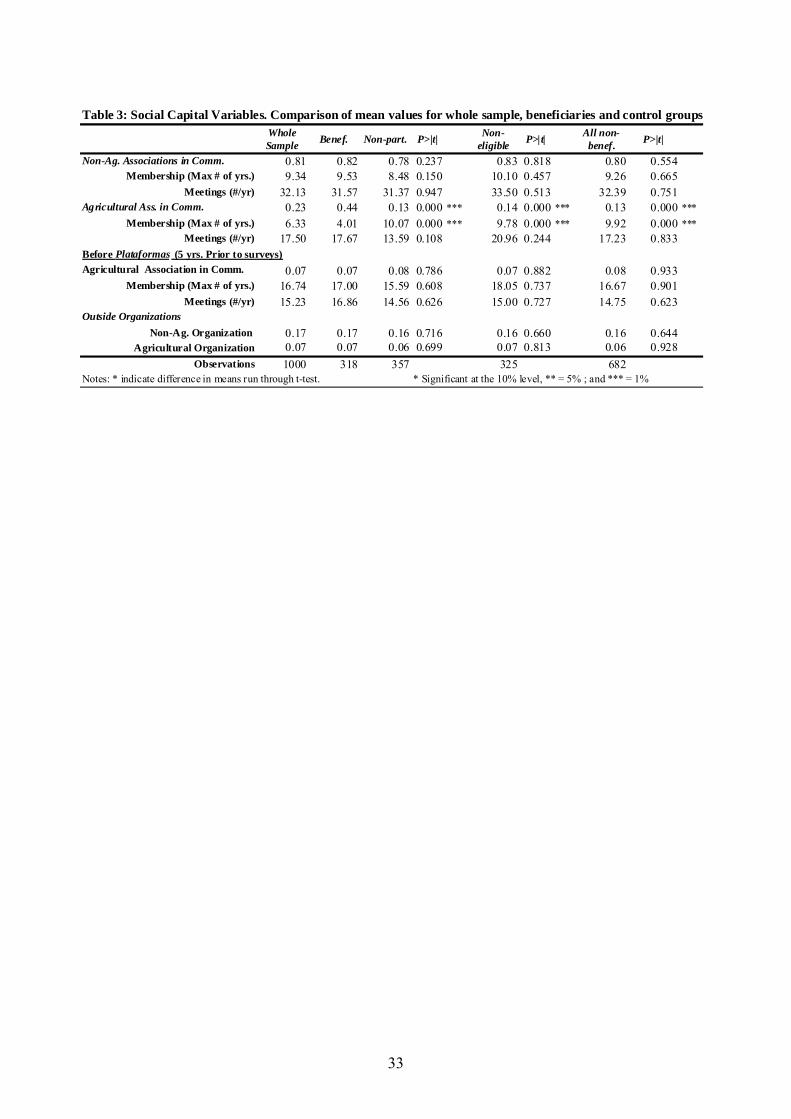
Table 3: Social Capital Variables. Comparison of mean values for whole sample, beneficiaries and control groupsWhole Sample Benef. Non-part. P>|t| Non-
eligible P>|t| All non-benef. P>|t|
Non-Ag. Associations in Comm. 0.81 0.82 0.78 0.237 0.83 0.818 0.80 0.554Membership (Max # of yrs.) 9.34 9.53 8.48 0.150 10.10 0.457 9.26 0.665
Meetings (#/yr) 32.13 31.57 31.37 0.947 33.50 0.513 32.39 0.751Agricultural Ass. in Comm. 0.23 0.44 0.13 0.000 *** 0.14 0.000 *** 0.13 0.000 ***
Membership (Max # of yrs.) 6.33 4.01 10.07 0.000 *** 9.78 0.000 *** 9.92 0.000 ***Meetings (#/yr) 17.50 17.67 13.59 0.108 20.96 0.244 17.23 0.833
Agricultural Association in Comm. 0.07 0.07 0.08 0.786 0.07 0.882 0.08 0.933Membership (Max # of yrs.) 16.74 17.00 15.59 0.608 18.05 0.737 16.67 0.901
Meetings (#/yr) 15.23 16.86 14.56 0.626 15.00 0.727 14.75 0.623Outside Organizations
Non-Ag. Organization 0.17 0.17 0.16 0.716 0.16 0.660 0.16 0.644Agricultural Organization 0.07 0.07 0.06 0.699 0.07 0.813 0.06 0.928
Observations 1000 318 357 325 682Notes: * indicate difference in means run through t-test. * Significant at the 10% level, ** = 5% ; and *** = 1%
Before Plataformas (5 yrs. Prior to surveys)
33
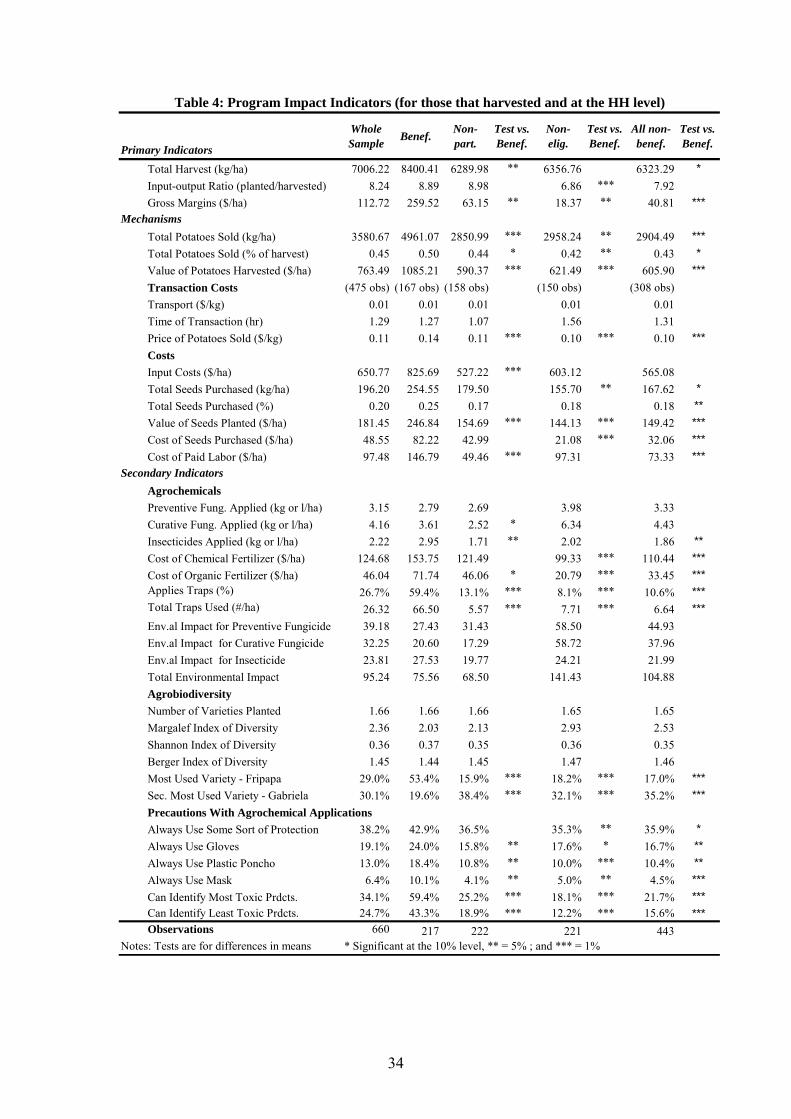
Primary Indicators
Whole Sample Benef. Non-
part.Test vs. Benef.
Non-elig.
Test vs. Benef.
All non-benef.
Test vs. Benef.
Total Harvest (kg/ha) 7006.22 8400.41 6289.98 ** 6356.76 6323.29 *Input-output Ratio (planted/harvested) 8.24 8.89 8.98 6.86 *** 7.92Gross Margins ($/ha) 112.72 259.52 63.15 ** 18.37 ** 40.81 ***
MechanismsTotal Potatoes Sold (kg/ha) 3580.67 4961.07 2850.99 *** 2958.24 ** 2904.49 ***Total Potatoes Sold (% of harvest) 0.45 0.50 0.44 * 0.42 ** 0.43 *Value of Potatoes Harvested ($/ha) 763.49 1085.21 590.37 *** 621.49 *** 605.90 ***Transaction Costs (475 obs) (167 obs) (158 obs) (150 obs) (308 obs)Transport ($/kg) 0.01 0.01 0.01 0.01 0.01Time of Transaction (hr) 1.29 1.27 1.07 1.56 1.31Price of Potatoes Sold ($/kg) 0.11 0.14 0.11 *** 0.10 *** 0.10 ***CostsInput Costs ($/ha) 650.77 825.69 527.22 *** 603.12 565.08Total Seeds Purchased (kg/ha) 196.20 254.55 179.50 155.70 ** 167.62 *Total Seeds Purchased (%) 0.20 0.25 0.17 0.18 0.18 **Value of Seeds Planted ($/ha) 181.45 246.84 154.69 *** 144.13 *** 149.42 ***Cost of Seeds Purchased ($/ha) 48.55 82.22 42.99 21.08 *** 32.06 ***Cost of Paid Labor ($/ha) 97.48 146.79 49.46 *** 97.31 73.33 ***
Secondary IndicatorsAgrochemicalsPreventive Fung. Applied (kg or l/ha) 3.15 2.79 2.69 3.98 3.33Curative Fung. Applied (kg or l/ha) 4.16 3.61 2.52 * 6.34 4.43Insecticides Applied (kg or l/ha) 2.22 2.95 1.71 ** 2.02 1.86 **Cost of Chemical Fertilizer ($/ha) 124.68 153.75 121.49 99.33 *** 110.44 ***Cost of Organic Fertilizer ($/ha) 46.04 71.74 46.06 * 20.79 *** 33.45 ***Applies Traps (%) 26.7% 59.4% 13.1% *** 8.1% *** 10.6% ***Total Traps Used (#/ha) 26.32 66.50 5.57 *** 7.71 *** 6.64 ***Env.al Impact for Preventive Fungicide 39.18 27.43 31.43 58.50 44.93Env.al Impact for Curative Fungicide 32.25 20.60 17.29 58.72 37.96Env.al Impact for Insecticide 23.81 27.53 19.77 24.21 21.99Total Environmental Impact 95.24 75.56 68.50 141.43 104.88AgrobiodiversityNumber of Varieties Planted 1.66 1.66 1.66 1.65 1.65Margalef Index of Diversity 2.36 2.03 2.13 2.93 2.53Shannon Index of Diversity 0.36 0.37 0.35 0.36 0.35Berger Index of Diversity 1.45 1.44 1.45 1.47 1.46Most Used Variety - Fripapa 29.0% 53.4% 15.9% *** 18.2% *** 17.0% ***Sec. Most Used Variety - Gabriela 30.1% 19.6% 38.4% *** 32.1% *** 35.2% ***Precautions With Agrochemical ApplicationsAlways Use Some Sort of Protection 38.2% 42.9% 36.5% 35.3% ** 35.9% *Always Use Gloves 19.1% 24.0% 15.8% ** 17.6% * 16.7% **Always Use Plastic Poncho 13.0% 18.4% 10.8% ** 10.0% *** 10.4% **Always Use Mask 6.4% 10.1% 4.1% ** 5.0% ** 4.5% ***Can Identify Most Toxic Prdcts. 34.1% 59.4% 25.2% *** 18.1% *** 21.7% ***Can Identify Least Toxic Prdcts. 24.7% 43.3% 18.9% *** 12.2% *** 15.6% ***Observations 660 217 222 221 443
Notes: Tests are for differences in means * Significant at the 10% level, ** = 5% ; and *** = 1%
Table 4: Program Impact Indicators (for those that harvested and at the HH level)
34
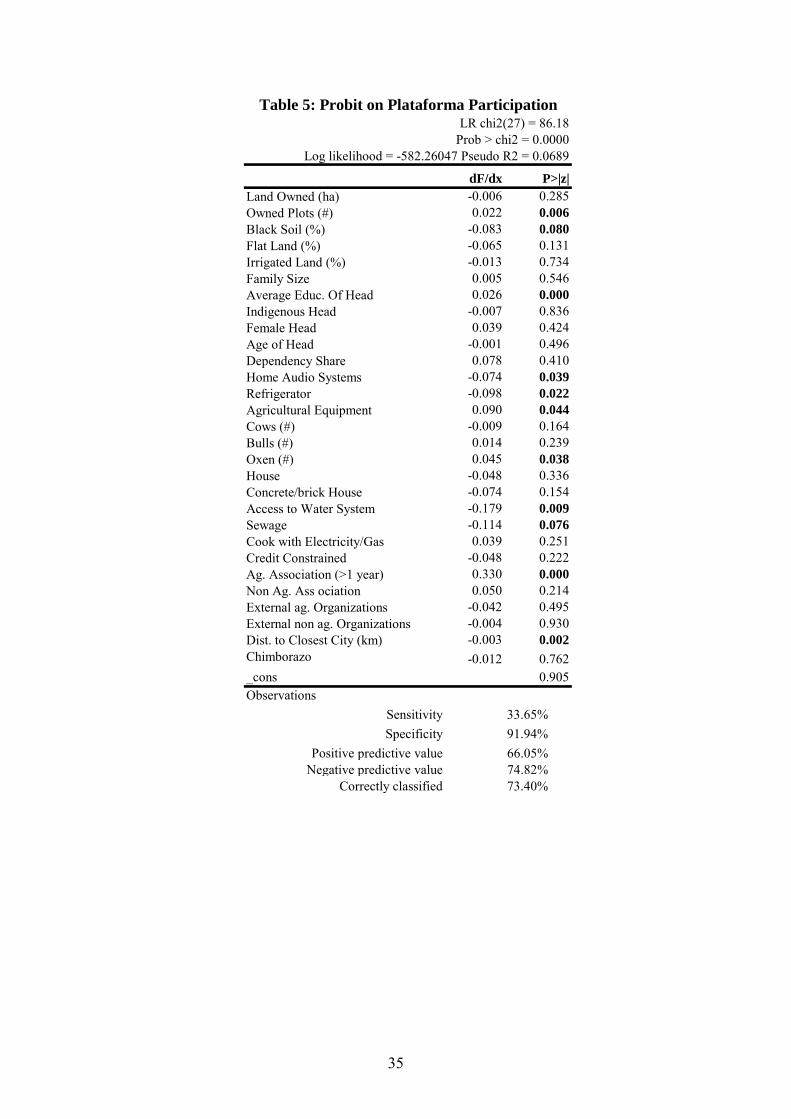
LR chi2(27) = 86.18 Prob > chi2 = 0.0000
Log likelihood = -582.26047 Pseudo R2 = 0.0689
dF/dx P>|z|Land Owned (ha) -0.006 0.285Owned Plots (#) 0.022 0.006Black Soil (%) -0.083 0.080Flat Land (%) -0.065 0.131Irrigated Land (%) -0.013 0.734Family Size 0.005 0.546Average Educ. Of Head 0.026 0.000Indigenous Head -0.007 0.836Female Head 0.039 0.424Age of Head -0.001 0.496Dependency Share 0.078 0.410Home Audio Systems -0.074 0.039Refrigerator -0.098 0.022Agricultural Equipment 0.090 0.044Cows (#) -0.009 0.164Bulls (#) 0.014 0.239Oxen (#) 0.045 0.038House -0.048 0.336Concrete/brick House -0.074 0.154Access to Water System -0.179 0.009Sewage -0.114 0.076Cook with Electricity/Gas 0.039 0.251Credit Constrained -0.048 0.222Ag. Association (>1 year) 0.330 0.000Non Ag. Ass ociation 0.050 0.214External ag. Organizations -0.042 0.495External non ag. Organizations -0.004 0.930Dist. to Closest City (km) -0.003 0.002Chimborazo -0.012 0.762_cons 0.905Observations
Sensitivity 33.65%Specificity 91.94%
Positive predictive value 66.05%Negative predictive value 74.82%
Correctly classified 73.40%
Table 5: Probit on Plataforma Participation
35
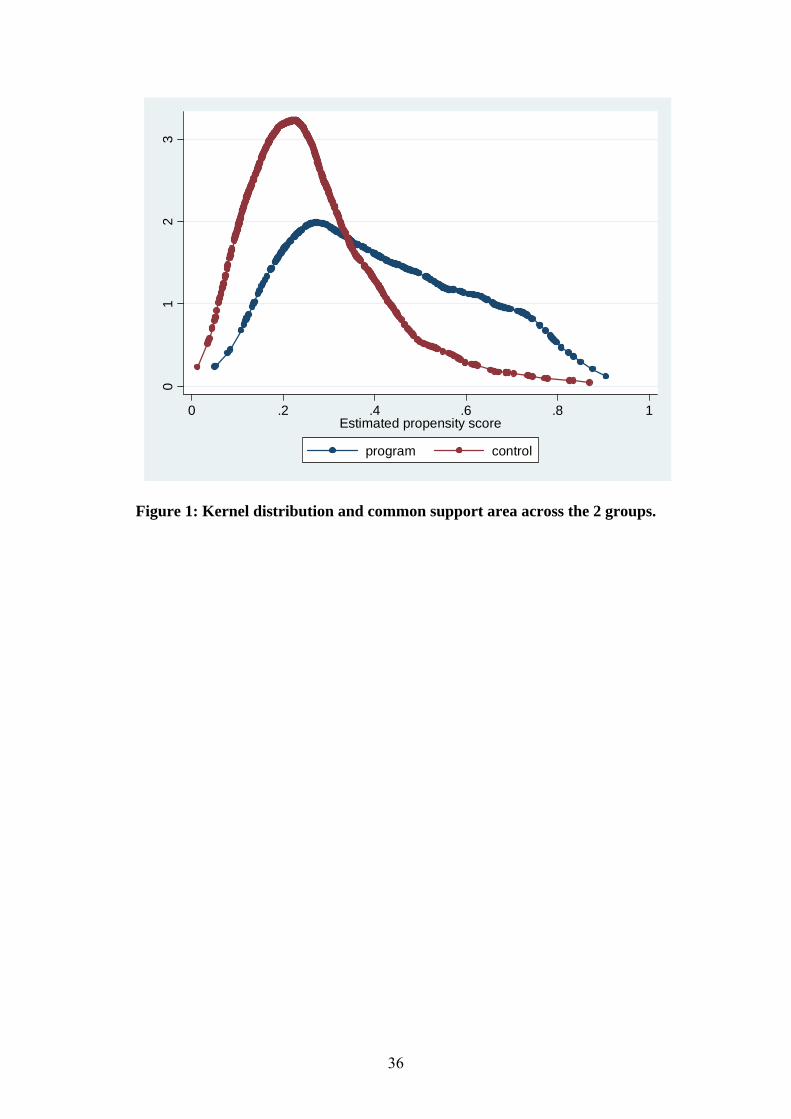
01
23
0 .2 .4 .6 .8 1Estimated propensity score
program control
Figure 1: Kernel distribution and common support area across the 2 groups.
36

VariableMean
Treated Mean
Control
% reduction
|bias| P>|t|Land Owned (ha) 2.36 2.38 86.6 0.55Owned Plots (#) 3.08 3.02 73.5 0.30Black Soil (%) 0.77 0.77 84.2 0.82Flat Land (%) 0.36 0.36 92.9 0.76Irrigated Land (%) 0.56 0.56 99.6 0.73Family Size 4.81 4.90 50.4 0.57Average Educ. Of Head 5.59 5.38 65.8 0.30Indigenous Head 0.58 0.60 62.2 0.56Female Head 0.13 0.13 54.4 0.76Age of Head 41.26 41.50 82.6 0.62Dependency Share 0.30 0.30 50.1 0.68Home Audio Systems 0.26 0.24 52.8 0.36Refrigerator 0.14 0.14 93.2 0.63Agricultural Equipment 0.08 0.03 -5.7 0.32Cows (#) 1.64 1.87 -16.9 0.36Bulls (#) 0.83 1.02 -69.7 0.56Oxen (#) 0.25 0.23 78.2 0.87House 0.84 0.85 54.6 0.95Concrete/brick House 0.84 0.86 70.2 0.71Access to Water System 0.92 0.94 32.4 0.56Sewage 0.04 0.05 90.2 0.49Cook with Electricity/Gas 0.59 0.53 -81.2 0.37Credit Constrained 0.18 0.21 -0.3 0.59Ag. Association (>1 year) 0.34 0.34 98.9 0.67Non Ag. Ass ociation 0.82 0.87 -239.1 0.13External ag. Organizations 0.07 0.05 -922.3 0.38External non ag. Organizations 0.17 0.17 62.2 0.97Dist. to Closest City (km) 26.69 26.43 93 0.57Chimborazo 0.51 0.50 52.9 0.92
Table 6: Punctual Test of Means
37
Diff. P>|t| Diff. P>|t| Diff. P>|t|Primary Indicators
Log of Total Harvest (Kg/Ha) 0.58 0.000 0.58 0.000 0.61 0.000Input-output Ratio (planted/harvested) 2.21 0.001 2.04 0.000 1.69 0.006Gross Margins ($/ha) 203.85 0.011 232.45 0.031 194.50 0.008
MechanismsTotal Potatoes Sold (kg/ha) 1639.26 0.007 2011.07 0.000 1664.11 0.001Total Potatoes Sold (% of harvest) 0.09 0.002 0.08 0.047 0.09 0.001Value of Potatoes Harvested ($/ha) 385.80 0.003 459.47 0.001 372.05 0.000Transaction CostsTransport ($/kg) 0.002 0.101 0.002 0.161 0.002 0.075Time of Transaction (hr) -0.015 0.935 0.013 0.946 -0.031 0.855Price of Potatoes Sold ($/kg) 0.029 0.000 0.031 0.000 0.030 0.000CostsInput Costs ($/ha) 181.95 0.119 227.02 0.042 177.55 0.050Total Seeds Purchased (%) 0.06 0.076 0.05 0.215 0.05 0.143Value of Seeds Planted ($/ha) 91.91 0.006 94.83 0.003 83.91 0.012Cost of Seeds Purchased ($/ha) 47.72 0.004 47.63 0.030 33.02 0.033Cost of Paid Labor ($/ha) 46.78 0.029 85.20 0.000 32.53 0.109
Secondary IndicatorsAgrochemicalsPreventive Fung. Applied (kg or l/ha) -0.32 0.618 -0.26 0.687 -0.235 0.671Curative Fung. Applied (kg or l/ha) 0.48 0.577 0.40 0.638 -0.32 0.751Insecticides Applied (kg or l/ha) 1.07 0.059 0.96 0.127 1.13 0.034Cost of Chemical Fertilizer ($/ha) 42.73 0.016 48.17 0.020 37.83 0.025Cost of Organic Fertilizer ($/ha) 17.81 0.164 24.02 0.060 16.15 0.131Applies Traps (%) 0.50 0.000 0.47 0.000 0.52 0.000Total Traps Used (#/ha) 55.92 0.000 55.51 0.000 57.81 0.000Env.al Impact for Preventive Fungicide -16.45 0.333 -17.27 0.333 -11.34 0.331Env.al Impact for Curative Fungicide -4.77 0.546 -2.34 0.729 -12.69 0.208Env.al Impact for Insecticide 5.28 0.400 4.41 0.466 7.78 0.207Total Environmental Impact Quotient (EIQ/ha) -15.94 0.554 -15.21 0.459 -16.26 0.447AgrobiodiversityNumber of Varieties Planted -0.01 0.850 0.01 0.873 -0.02 0.733Margalef Index of Diversity -0.53 0.579 -0.64 0.528 -0.56 0.532Shannon Index of Diversity 0.01 0.766 0.02 0.677 0.01 0.837Berger Index of Diversity -0.02 0.661 -0.03 0.607 -0.03 0.622Most Used Variety - Fripapa 0.36 0.000 0.36 0.000 0.36 0.000Sec. Most Used Variety - Gabriela -0.15 0.000 -0.14 0.000 -0.150 0.000Precautions With Agrochemical ApplicationsAlways Use Plastic Over Shoulders 0.08 0.085 0.07 0.162 0.06 0.211Always Use Gloves 0.05 0.196 0.04 0.330 0.03 0.376Always Use Plastic Poncho 0.06 0.043 0.08 0.005 0.07 0.026Always Use Mask 0.04 0.062 0.06 0.005 0.04 0.080Can Identify Most Toxic Prdcts. (label color) 0.36 0.000 0.36 0.000 0.35 0.000Can Identify Least Toxic Prdcts. (label color) 0.26 0.000 0.26 0.000 0.25 0.000Observations 660 660 660
PS Weighted LSOLS PSM, Kernel
Table 7: Comparison of Beneficiaries vs. All Non-Beneficiaries
38
Diff. P>|t| Diff. P>|t| Diff. P>|t| Diff. P>|t|Primary Indicators
Log of Total Harvest (Kg/Ha) 0.61 0.000 0.72 0.000 0.55 0.001 0.48 0.002Input-output Ratio (planted/harvested) 1.69 0.006 2.26 0.000 1.08 0.334 5.29 0.070Gross Margins ($/ha) 194.50 0.008 173.35 0.042 218.29 0.014 118.02 0.078
MechanismsTotal Potatoes Sold (kg/ha) 1664.11 0.001 1958.66 0.000 1939.99 0.000 1062.93 0.024Total Potatoes Sold (% of harvest) 0.09 0.001 0.09 0.004 0.10 0.004 0.06 0.033Value of Potatoes Harvested ($/ha) 372.05 0.000 410.29 0.002 436.25 0.000 236.84 0.025Transaction CostsTransport ($/kg) 0.002 0.075 0.00 0.088 0.00 0.149 0.00 0.353Time of Transaction (hr) -0.031 0.855 -0.15 0.403 0.12 0.531 -0.29 0.055Price of Potatoes Sold ($/kg) 0.030 0.000 0.03 0.000 0.03 0.000 0.02 0.002CostsInput Costs ($/ha) 177.55 0.050 236.94 0.023 217.96 0.004 118.82 0.157Total Seeds Purchased (%) 0.05 0.143 0.03 0.487 0.06 0.112 0.01 0.701Value of Seeds Planted ($/ha) 83.91 0.012 97.27 0.015 84.79 0.007 55.68 0.054Cost of Seeds Purchased ($/ha) 33.02 0.033 45.80 0.003 32.69 0.102 35.74 0.011Cost of Paid Labor ($/ha) 32.53 0.109 36.74 0.191 50.42 0.009 11.78 0.615
Secondary IndicatorsAgrochemicalsPreventive Fung. Applied (kg or l/ha) -0.235 0.671 -0.51 0.469 0.50 0.375 -0.83 0.240Curative Fung. Applied (kg or l/ha) -0.32 0.751 -0.88 0.522 1.03 0.055 -1.74 0.225Insecticides Applied (kg or l/ha) 1.13 0.034 1.11 0.047 1.27 0.019 0.47 0.221Cost of Chemical Fertilizer ($/ha) 37.83 0.025 49.57 0.019 38.79 0.036 35.04 0.033Cost of Organic Fertilizer ($/ha) 16.15 0.131 38.08 0.000 1.16 0.938 32.13 0.002Applies Traps (%) 0.52 0.000 0.54 0.000 0.50 0.000 0.29 0.000Total Traps Used (#/ha) 57.81 0.000 59.33 0.000 59.22 0.000 28.64 0.000Env.al Impact for Preventive Fungicide -11.34 0.331 -14.81 0.311 6.26 0.349 -19.18 0.192Env.al Impact for Curative Fungicide -12.69 0.208 -19.11 0.189 2.49 0.502 -23.65 0.115Env.al Impact for Insecticide 7.78 0.207 8.76 0.163 10.32 0.080 2.50 0.594Total Environmental Impact Quotient (EIQ/ha) -16.26 0.447 -25.16 0.345 19.08 0.126 -40.33 0.121AgrobiodiversityNumber of Varieties Planted -0.02 0.733 -0.05 0.567 -0.05 0.532 -0.01 0.937Margalef Index of Diversity -0.56 0.532 -1.53 0.336 -0.11 0.869 -1.40 0.262Shannon Index of Diversity 0.01 0.837 -0.01 0.778 0.00 0.936 -0.01 0.797Berger Index of Diversity -0.03 0.622 -0.05 0.403 -0.03 0.686 -0.04 0.522Most Used Variety - Fripapa 0.36 0.000 0.34 0.000 0.37 0.000 0.15 0.000Sec. Most Used Variety - Gabriela -0.150 0.000 -0.12 0.001 -0.19 0.000 -0.01 0.655Precautions With Agrochemical ApplicationsAlways Use Plastic Over Shoulders 0.06 0.211 0.07 0.207 0.04 0.423 0.05 0.286Always Use Gloves 0.03 0.376 0.00 0.993 0.06 0.118 -0.01 0.840Always Use Plastic Poncho 0.07 0.026 0.06 0.119 0.07 0.060 0.04 0.152Always Use Mask 0.04 0.080 0.03 0.268 0.04 0.072 0.02 0.429Can Identify Most Toxic Prdcts. (label color) 0.35 0.000 0.41 0.000 0.32 0.000 0.26 0.000Can Identify Least Toxic Prdcts. (label color) 0.25 0.000 0.29 0.000 0.23 0.000 0.18 0.000Observations 660 438 439 475
Table 8: Comparison of Beneficiaries Different Control Groups Using Weighted LSPlataforma vs
Non-benef.Plata vs Non
EligiblePlata Vs Non Participants
ITT vs Non Eligible
39
ESA Working Papers
WORKING PAPERS The ESA Working Papers are produced by the Agricultural Development Economics Division (ESA) of the Economic and Social Development Department of the United Nations Food and Agriculture Organization (FAO). The series presents ESA’s ongoing research. Working papers are circulated to stimulate discussion and comments. They are made available to the public through the Division’s website. The analysis and conclusions are those of the authors and do not indicate concurrence by FAO. ESA The Agricultural Development Economics Division (ESA) is FAO’s focal point for economic research and policy analysis on issues relating to world food security and sustainable development. ESA contributes to the generation of knowledge and evolution of scientific thought on hunger and poverty alleviation through its economic studies publications which include this working paper series as well as periodic and occasional publications.
Agricultural Development Economics Division (ESA)
The Food and Agriculture Organization Viale delle Terme di Caracalla
00153 Rome Italy
Contact: Office of the Director
Telephone: +39 06 57054358 Facsimile: + 39 06 57055522 Website: www.fao.org/es/esa
e-mail: [email protected]
40