LINEAR UNMIXING OF MULTIDATE HYPERSPECTRAL IMAGERY FOR CROP YIELD ESTIMATION
15
LINEAR UNMIXING OF LINEAR UNMIXING OF MULTIDATE HYPERSPECTRAL MULTIDATE HYPERSPECTRAL IMAGERY FOR CROP YIELD IMAGERY FOR CROP YIELD ESTIMATION ESTIMATION Bin Luo 1 , Chenghai Yang 2 and Jocelyn Chanussot 3 1 LIESMARS, Wuhan University, Wuhan, China 2 U.S. Department of Agriculture, Weslaco, Texas, USA 3 Grenoble Institute of Technology, Grenoble, France IGARSS 2011; 24 – 29 July, 2011; Vancouver, Canada
-
Upload
laurel-morales -
Category
Documents
-
view
28 -
download
1
description
LINEAR UNMIXING OF MULTIDATE HYPERSPECTRAL IMAGERY FOR CROP YIELD ESTIMATION. Bin Luo 1 , Chenghai Yang 2 and Jocelyn Chanussot 3 1 LIESMARS, Wuhan University, Wuhan, China 2 U.S. Department of Agriculture, Weslaco, Texas, USA 3 Grenoble Institute of Technology, Grenoble, France - PowerPoint PPT Presentation
Transcript of LINEAR UNMIXING OF MULTIDATE HYPERSPECTRAL IMAGERY FOR CROP YIELD ESTIMATION

LINEAR UNMIXING OF LINEAR UNMIXING OF MULTIDATE HYPERSPECTRAL MULTIDATE HYPERSPECTRAL IMAGERY FOR CROP YIELD IMAGERY FOR CROP YIELD ESTIMATIONESTIMATION
Bin Luo1, Chenghai Yang2 and Jocelyn Chanussot3
1 LIESMARS, Wuhan University, Wuhan, China2 U.S. Department of Agriculture, Weslaco, Texas, USA3 Grenoble Institute of Technology, Grenoble, France
IGARSS 2011; 24 – 29 July, 2011; Vancouver, Canada

2
Mapping Yield Variation for Precision Agriculture
•Remote sensing imagery has been commonly used for estimating crop yield variation
•Vegetation indices (e.g., NDVI)•With hyperspectral imagery,
the number of VIs is large•Spectral unmixing can be used
to derive abundance images
3
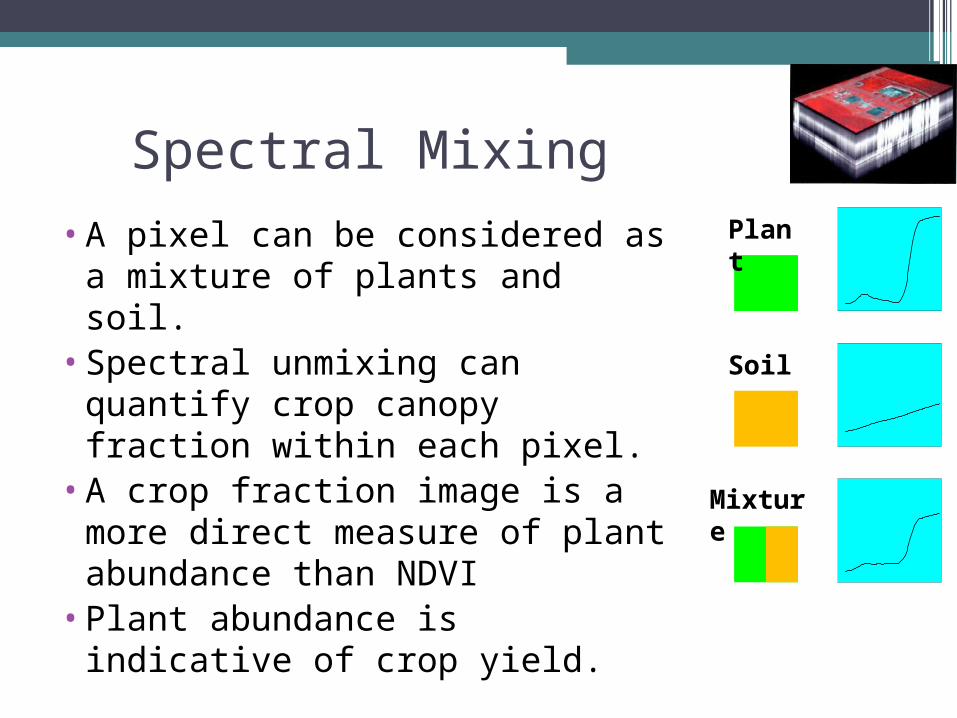
Spectral Mixing
•A pixel can be considered as a mixture of plants and soil.
•Spectral unmixing can quantify crop canopy fraction within each pixel.
•A crop fraction image is a more direct measure of plant abundance than NDVI
•Plant abundance is indicative of crop yield.
Plant
Soil
Mixture
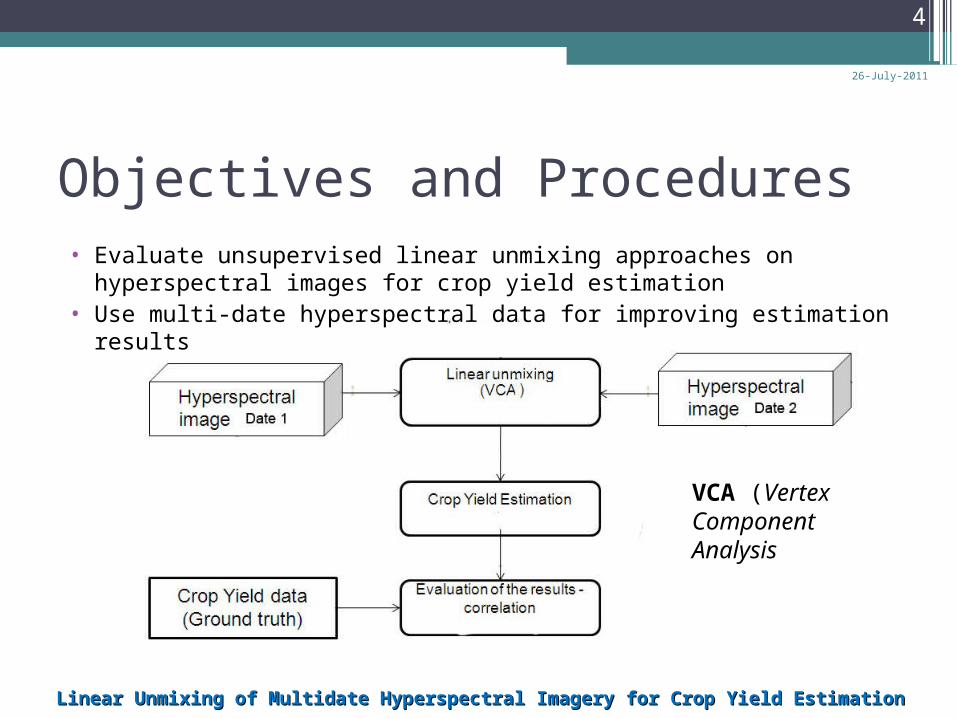
Objectives and Procedures• Evaluate unsupervised linear unmixing approaches on
hyperspectral images for crop yield estimation• Use multi-date hyperspectral data for improving estimation results
26-July-2011
4
Linear Unmixing of Multidate Hyperspectral Imagery for Crop Yield EstimationLinear Unmixing of Multidate Hyperspectral Imagery for Crop Yield Estimation
VCA (Vertex Component Analysis

• Linear mixture model of hyperspectral images
X = MS + nM = unmixing matrixS = abundance matrix
Unmixing of Hyperspectral Images
• VCA (Vertex Component Analysis) to extract endmembers
Red cross: hyperspecral data X
Blue circles: endmembers M
Abundance S: Random between 0 – 1
26-July-2011
5
Linear Unmixing of Multidate Hyperspectral Imagery for Crop Yield EstimationLinear Unmixing of Multidate Hyperspectral Imagery for Crop Yield Estimation

6
Airborne Hyperspectral Images
• Hyperspectral system Spectral range: 467–932 nm Swath width: 640 pixels Bands: 128 Radiometric: 12 bit (0–4095) Pixel size: ~1 m
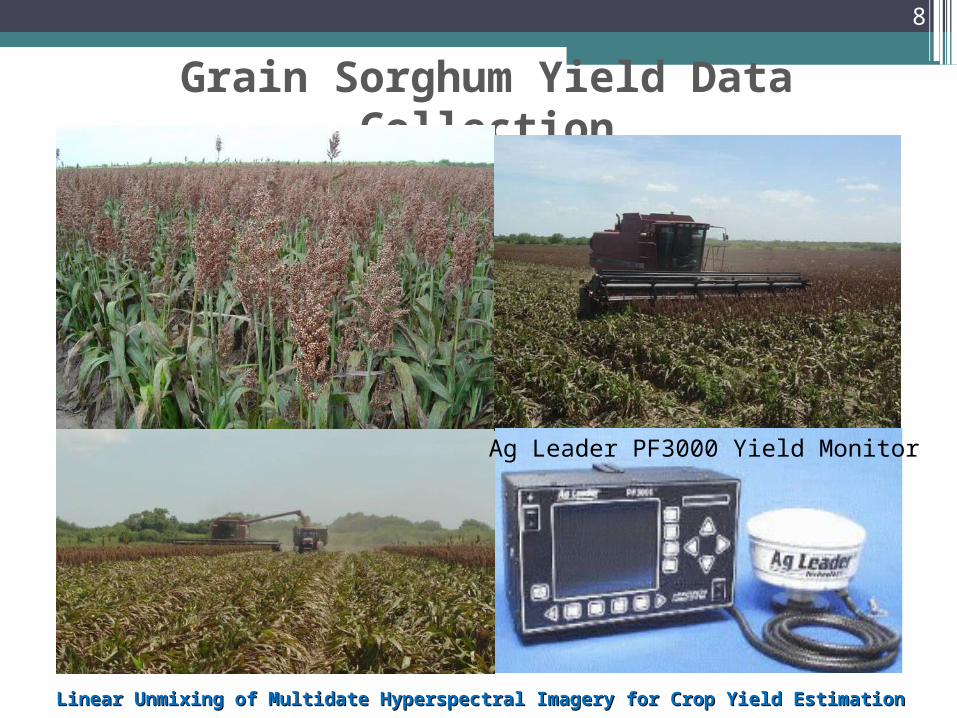
• Study site Two grain sorghum fields in south
Texas 13.4 ha and 14.0 ha in size
• Image timing Shortly before and after crop reached
maximum canopy cover 18-May-2001 and 29-May-2001
Linear Unmixing of Multidate Hyperspectral Imagery for Crop Yield EstimationLinear Unmixing of Multidate Hyperspectral Imagery for Crop Yield Estimation
7
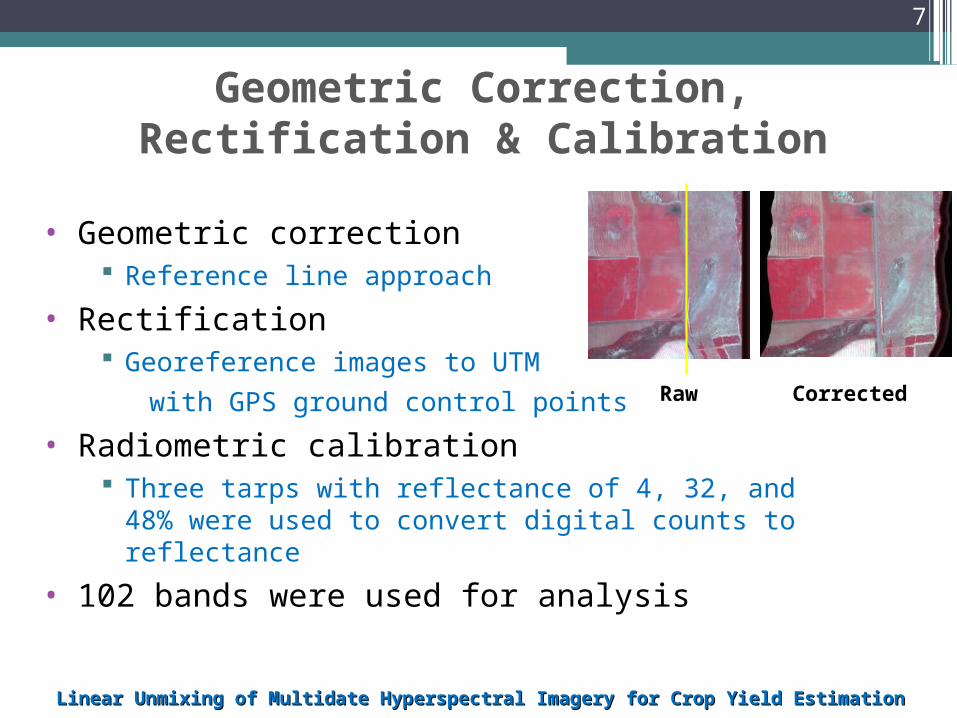
Geometric Correction, Rectification & Calibration
• Geometric correction Reference line approach
• Rectification Georeference images to UTM
with GPS ground control points
• Radiometric calibration Three tarps with reflectance of 4, 32, and 48% were
used to convert digital counts to reflectance
• 102 bands were used for analysis
Raw Corrected
Linear Unmixing of Multidate Hyperspectral Imagery for Crop Yield EstimationLinear Unmixing of Multidate Hyperspectral Imagery for Crop Yield Estimation
8
Grain Sorghum Yield Data Collection
Ag Leader PF3000 Yield Monitor
Linear Unmixing of Multidate Hyperspectral Imagery for Crop Yield EstimationLinear Unmixing of Multidate Hyperspectral Imagery for Crop Yield Estimation

Yield Data
Crop yield images of the two fields.
26-July-2011
9
Linear Unmixing of Multidate Hyperspectral Imagery for Crop Yield EstimationLinear Unmixing of Multidate Hyperspectral Imagery for Crop Yield Estimation

Fusion of Multi-date Unmixing Results
Flow chart of the fusion of the multi-date unmixing results
26-July-2011
10
Linear Unmixing of Multidate Hyperspectral Imagery for Crop Yield EstimationLinear Unmixing of Multidate Hyperspectral Imagery for Crop Yield Estimation
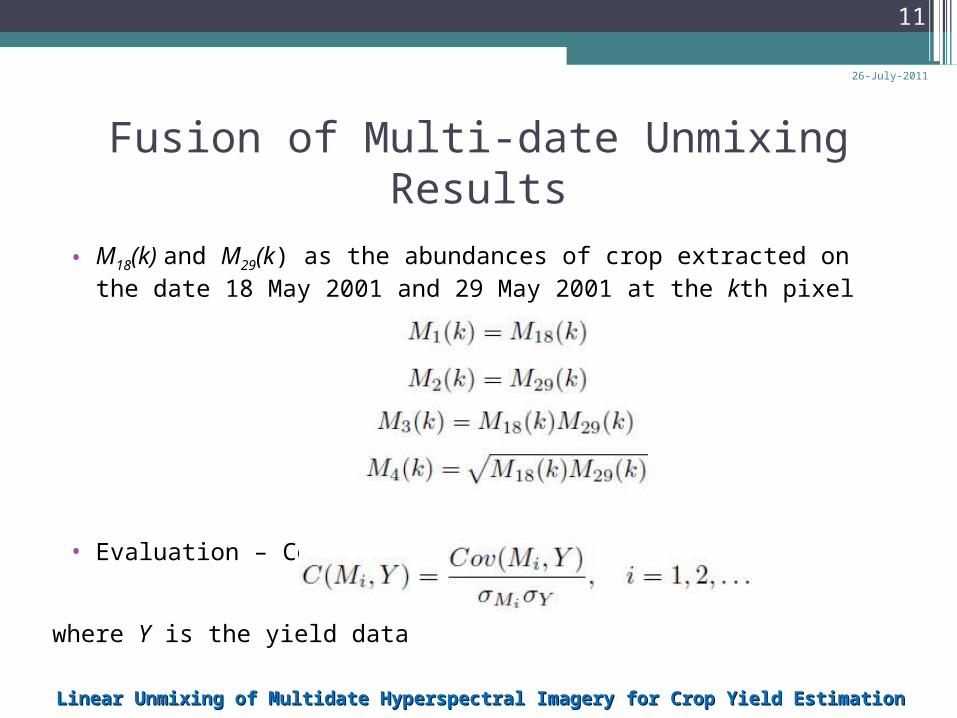
• M18(k) and M29(k) as the abundances of crop extracted on the date 18 May 2001 and 29 May 2001 at the kth pixel
• Evaluation – Correlation coefficients
Fusion of Multi-date Unmixing Results
where Y is the yield data
26-July-2011
11
Linear Unmixing of Multidate Hyperspectral Imagery for Crop Yield EstimationLinear Unmixing of Multidate Hyperspectral Imagery for Crop Yield Estimation

Fusion of Multi-date Unmixing Results
M18(k) of Field 1 M29(k) of Field 1
26-July-2011
12
Linear Unmixing of Multidate Hyperspectral Imagery for Crop Yield EstimationLinear Unmixing of Multidate Hyperspectral Imagery for Crop Yield Estimation
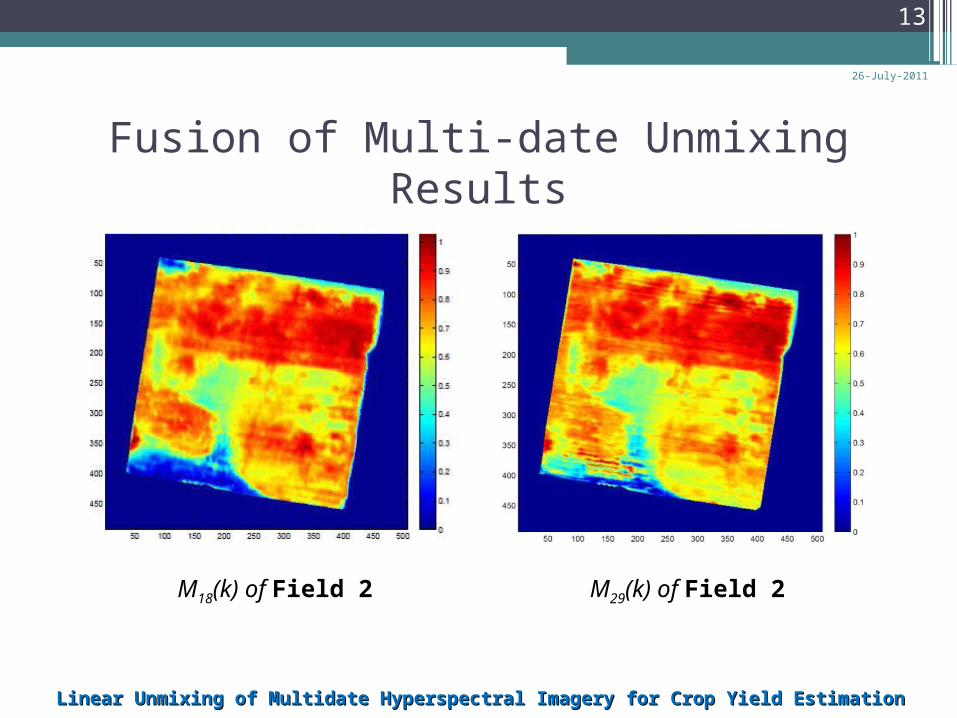
Fusion of Multi-date Unmixing Results
M18(k) of Field 2 M29(k) of Field 2
26-July-2011
13
Linear Unmixing of Multidate Hyperspectral Imagery for Crop Yield EstimationLinear Unmixing of Multidate Hyperspectral Imagery for Crop Yield Estimation

Fusion of Multi-date Unmixing Results
M1 M2 M3 M4
C(Mi, Y) 0.739 0.748 0.780 0.764
Correlation coefficients between the yield data and the (combined) crop abundances of Field 1
M1 M2 M3 M4
C(Mi, Y) 0.648 0.721 0.735 0.701
Correlation coefficients between the yield data and the (combined) crop abundances of Field 2
Recall that
26-July-2011
14
Linear Unmixing of Multidate Hyperspectral Imagery for Crop Yield EstimationLinear Unmixing of Multidate Hyperspectral Imagery for Crop Yield Estimation

Conclusions
•Crop abundances obtained by the unsupervised linear unmixing are strongly correlated to crop yield data.
•The fusion of crop abundances obtained from images taken at different dates significantly improves the correlation with yield.
26-July-2011
15
Linear Unmixing of Multidate Hyperspectral Imagery for Crop Yield EstimationLinear Unmixing of Multidate Hyperspectral Imagery for Crop Yield Estimation