Linear Inequalities in Two Variablesdgalvin1/10120/10120_S16/Topic21_3p... · 2016-04-01 · Linear...
30
Linear Inequalities in Two Variables The next topic we will study is optimization — how to make the most of limited resources. This will lead us to situations like the following: if apples cost $1.45 per kilo and pears cost $1.25 a kilo, what combination of apples and pears can I buy with at most $5? If I buy a kilos of apples and p kilos of pears then I spend 1.45a on apples and 1.25p on pears, so 1.45a +1.25p in total. So whatever combination I buy, it must satisfy 1.45a +1.25p ≤ 5. This is an example of a linear inequality.
Transcript of Linear Inequalities in Two Variablesdgalvin1/10120/10120_S16/Topic21_3p... · 2016-04-01 · Linear...

Linear Inequalities in Two Variables
The next topic we will study is optimization — how tomake the most of limited resources. This will lead us tosituations like the following: if apples cost $1.45 per kiloand pears cost $1.25 a kilo, what combination of apples andpears can I buy with at most $5?
If I buy a kilos of apples and p kilos of pears then I spend1.45a on apples and 1.25p on pears, so 1.45a + 1.25p intotal. So whatever combination I buy, it must satisfy
1.45a + 1.25p ≤ 5.
This is an example of a linear inequality.

Review of linesThe equation of a line is given by:
ax + by = c.
for some given numbers a, b and c.A vertical line which runs through the point c on the x-axishas equation
x = c.
A horizontal line which runs through the point d on they-axis has equation
y = d.
A line which runs through the point (0, 0) has an equationof the form
ax + by = 0.
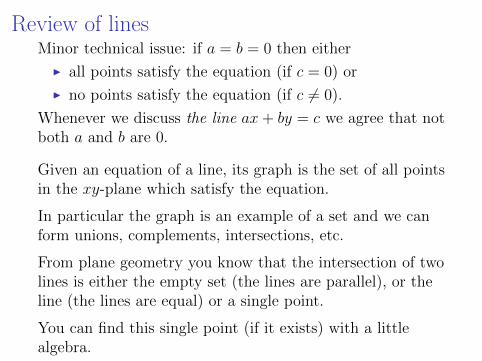
Review of linesMinor technical issue: if a = b = 0 then either
I all points satisfy the equation (if c = 0) or
I no points satisfy the equation (if c 6= 0).
Whenever we discuss the line ax + by = c we agree that notboth a and b are 0.
Given an equation of a line, its graph is the set of all pointsin the xy-plane which satisfy the equation.
In particular the graph is an example of a set and we canform unions, complements, intersections, etc.
From plane geometry you know that the intersection of twolines is either the empty set (the lines are parallel), or theline (the lines are equal) or a single point.
You can find this single point (if it exists) with a littlealgebra.

Review of lines
Example: The line 2x + 3y = 6.
The point (0, 2) satisfies the equation 2x + 3y = 6, because2(0) + 3(2) = 6. Hence the point (0, 2) is on the graph ofthat equation, so is on the line.
The point (0, 0) does not satisfy the equation 2x + 3y = 6,since 2(0) + 3(0) 6= 6. Hence the point (0, 0) is not on thegraph of the equation 2x + 3y = 6, and is not on the line.

Review of lines
We can draw the graph of a line if we know the location ofany 2 points on the line. The x- and y-intercepts (theplaces where the line hits the x-axis and the y-axis) areusually the easiest points to find.
I To find the x-intercept, we set y = 0 in the equationand solve for x.
I To find the y-intercept, we set x = 0 in the equationand solve for y.
Given these two points (or any two distrint points) we candraw the line by joining the points with a straight edge andextending.

Review of linesExample Find the x- and y- intercept of the line withequation 2x + 3y = 6 and draw its graph.
I The x-intercept occurs when y = 0: hence 2x = 6 sox = 3.
I The y-intercept occurs when x = 0: hence 3y = 6 soy = 2.

Review of lines
Graphing Lines with only one intercept. There arethree situations where a line has only one intercept:
I The graph of an equation of the form x = c is avertical line which cuts the x-axis at c.
I The graph of an equation of the form y = d is ahorizontal line which cuts the y-axis at d.
I The graph of an equation of the form ax + by = 0 cutsboth axes at the point (0, 0), so one needs to pickanother value of x (or y), find the corresponding valueof y (or x) with some algebra, and plot thecorresponding point.

Review of linesExample Draw the graphs of the lines y = 2, x = 4 and2x + y = 0.
To draw 2x + y = 0 note (0, 0) is one point. Pick anynon-zero value for x and solve for y; if x = −1, y = 2.

Review of linesProblem: Given two points (x0, y0) and (x1, y1), what isthe equation of the line that passes through the two points?
Solution: Here is one way to get the equation.
1. Find a and b by looking at the difference of the twopoints: (x1, y1)− (x0, y0) =
(x1− x0, y1− y0
)= (b,−a).
2. Find c by solving c = ax0 + by0.
3. The equation of the line is ax + by = c.
Check:I Is the point (x0, y0) on this line? YES, because
c = ax0 + by0 (from Step 2)I Is the point (x1, y1) on this line? YES, because
c = ax1 + by1 is the same as ax0 + by0 = ax1 + by1(from Step 2), which is the same asa(x1 − x0) + b(y1 − y0) = 0, which is the same asab+ b(−a) = 0 (by Step 1), which is a correct equation.

Review of linesExample: Find the equation of the line through (1, 2) and(5, 7).
Solution:
1. (5, 7)− (1, 2) = (4, 5) so a = −5, b = 4
2. −5x0 + 4y0 = −5 · 1 + 4 · 2 = 3 so c = 3
3. The equation of the line is −5x + 4y = 3.
Example: Find the equation of the line through (1, 0) and(5, 0).
Solution:
1. (5, 0)− (1, 0) = (4, 0) so a = 0, b = 4
2. 0x0 + 4y0 = 0 · 1 + 4 · 0 = 0 so c = 0
3. The equation of the line is 4y = 0. (or y = 0. )
Linear Inequalities in Two Variables
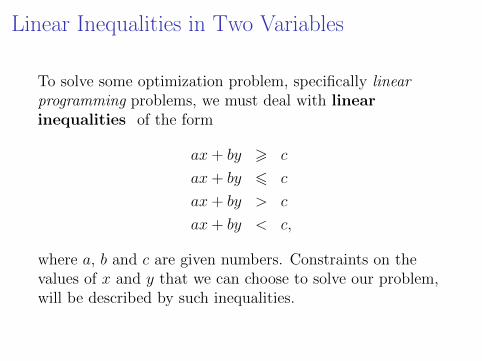
To solve some optimization problem, specifically linearprogramming problems, we must deal with linearinequalities of the form
ax + by > c
ax + by 6 c
ax + by > c
ax + by < c,
where a, b and c are given numbers. Constraints on thevalues of x and y that we can choose to solve our problem,will be described by such inequalities.

Linear Inequalities in Two VariablesExample: Michael is taking a exam to become a volunteerfirefighter. The exam has 10 essay questions and 50Multiple choice questions. Michael has 90 minutes to takethe exam and knows he is not expected to answer everyquestion. An essay question takes 10 minutes to answerand a short-answer question takes 2 minutes. Let x denotethe number of multiple choice questions that Michael willattempt and let y denote the number of essay questionsthat Michael will attempt. What linear inequalitiesdescribes the constraints on Michael’s time given above?
There is a time constraint: 2x + 10y 6 90 .
Additionally, since Michael can’t answer a negative numberof questions, there are constraints x > 0 and y > 0 .Furthermore, since he can not answer more questions thanthere are, so x 6 50 and y 6 10 .

Language of linear inequalities
I A point (x1, y1) is said to satisfy the inequalityax + by < c if ax1 + by1 < c.
I It satisfies ax + by > c if ax1 + by1 > c.
I It satisfies ax + by 6 c if either ax1 + by1 < c orax1 + by1 = c.
I It satisfies ax + by > c if either ax1 + by1 > c orax1 + by1 = c.
The graph of a linear inequality is the set of all points inthe plane which satisfy the inequality.
Notice that any point (x1, y1) satisfies exactly one ofax + by > c, ax + by < c or ax + by = c.
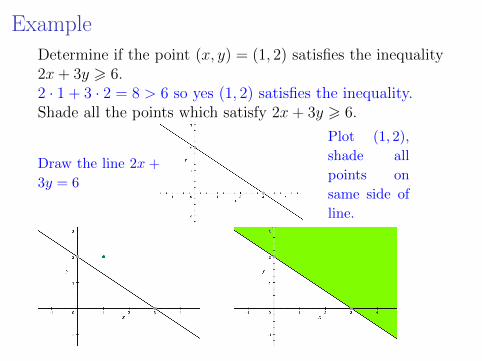
ExampleDetermine if the point (x, y) = (1, 2) satisfies the inequality2x + 3y > 6.2 · 1 + 3 · 2 = 8 > 6 so yes (1, 2) satisfies the inequality.Shade all the points which satisfy 2x + 3y > 6.
Draw the line 2x +
3y = 6
Plot (1, 2),
shade all
points on
same side of
line.
Example
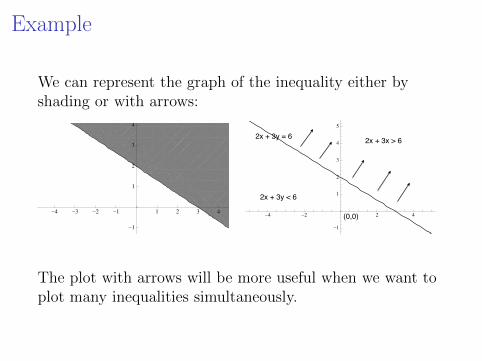
We can represent the graph of the inequality either byshading or with arrows:
-5 -4 -3 -2 -1 1 2 3 4
-5
-4
-3
-2
-1
1
2
3
4
-4 -2 2 4
-1
1
2
3
4
5
2x + 3y = 6 2x + 3x > 6
2x + 3y < 6
(0,0)
The plot with arrows will be more useful when we want toplot many inequalities simultaneously.

> versus ≥
The points satisfying an inequality like 2x + 3y ≥ 6 includeall points on the line 2x + 3y = 6. We indicate this bydrawing the graph of this line solidly.
We use a dotted line when we work with a strict inequalitylike 2x + 3y > 6:
Graph of the inequality2x + 3y > 6
-5 -4 -3 -2 -1 1 2 3 4
-1
1
2
3
42x + 3y = 6

More language of inequalities
Any line divides the plane into two disjoint subsets calledhalf-planes.
I If the line is not vertical, there is an upper half-planeand a lower half-plane.
I If the line is not horizontal, there is a right half-planeand a left half-plane.
I If the line is neither vertical or horizontal thenI sometimes right half-plane equals upper half planeI sometimes left half-plane equals upper half-plane
I Using our set theory terminology, the union of the twohalf-planes is the complement of the line.
Once you draw the line, it should be easy to pick out theupper/right and lower/left half-planes.
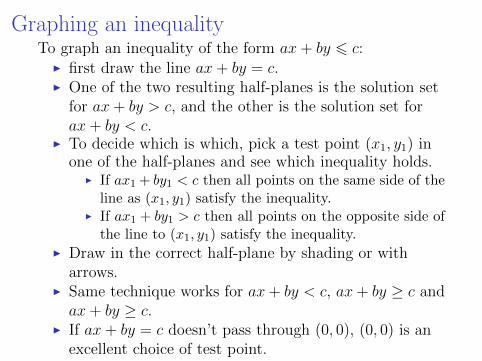
Graphing an inequalityTo graph an inequality of the form ax + by 6 c:
I first draw the line ax + by = c.I One of the two resulting half-planes is the solution set
for ax + by > c, and the other is the solution set forax + by < c.
I To decide which is which, pick a test point (x1, y1) inone of the half-planes and see which inequality holds.
I If ax1 + by1 < c then all points on the same side of theline as (x1, y1) satisfy the inequality.
I If ax1 + by1 > c then all points on the opposite side ofthe line to (x1, y1) satisfy the inequality.
I Draw in the correct half-plane by shading or witharrows.
I Same technique works for ax + by < c, ax + by ≥ c andax + by ≥ c.
I If ax + by = c doesn’t pass through (0, 0), (0, 0) is anexcellent choice of test point.

Example: 2x− 3y > 15Here’s the graph of 2x− 3y = 15:
At (0, 0), 2x− 3y = 0 < 15 which is less than 15. So weneed to shade the side of the line opposite (0, 0):
−→−→−→−→−→−→−→

Example: x− 3y > 0, x > 2, y 6 10Here’s an example where we want to satisfy threeinequalities simultaneously. First we draw each of the threeinequalities independently, but on the same graph.
−→
−→
−→
−→
−→
−→
−→
−→
−→−→−→−→−→−→−→−→ −→ −→ −→ −→ −→−→ −→ −→ −→ −→ −→ −→ −→

Example: x− 3y > 0, x > 2, y 6 10Next, we shade in that part of the plane thatsimultaneously satisfies all three inequalities:
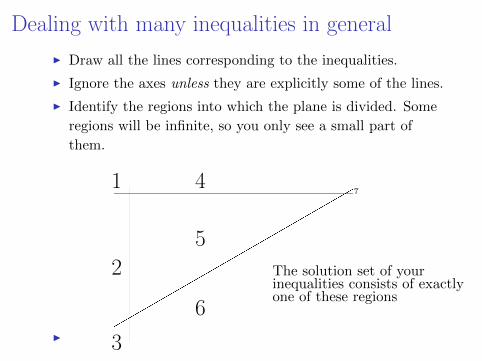
Dealing with many inequalities in general
I Draw all the lines corresponding to the inequalities.
I Ignore the axes unless they are explicitly some of the lines.
I Identify the regions into which the plane is divided. Some
regions will be infinite, so you only see a small part of
them.
I
1
2
3
4
5
6
7
The solution set of yourinequalities consists of exactlyone of these regions

Dealing with many inequalities in general
I Add the axes back in.
I Pick a point in the region you think is the solution set.
I Check that your pick satisfies all the inequalities. If itdoesn’t, you need to identify another region as thepossible solution set.
I Once you have found the right region, and tested itusing a test point, shade the region containing yourpoint.
For the example x− 3y > 0, x > 2, y 6 10, this process isillustrated on the next three slides.

Example: x− 3y > 0, x > 2, y 6 10

Example: x− 3y > 0, x > 2, y 6 10

Example: x− 3y > 0, x > 2, y 6 10

Example
Returning to a previous example: Michael is taking a examto become a volunteer firefighter. The exam has 10 essayquestions and 50 Multiple choice questions. Michael has 90minutes to take the exam and knows he is not expected toanswer every question. An essay question takes 10 minutesto answer and a short-answer question takes 2 minutes. Letx denote the number of multiple choice questions thatMichael will attempt and let y denote the number of essayquestions that Michael will attempt. Here are the linearinequalities describing the constraints on Michael:
I Time constraint 2x + 10y 6 90 .
I x > 0 and y > 0 .
I x 6 50 and y 6 10 .

ExampleHere are the lines 2x + 10y = 90, x = 0, y = 0, x = 50, y = 10.
1
2
3 4
5
I We’ve only numbered regions in the first quadrant of the
plane where x ≥ 0, y ≥ 0 since these two constraints must
be satisfied. This saves a lot of labor!
I x 6 50 and y 6 10 are redundant — we can’t have
2x + 10y 6 90 if x > 50 or y > 10. But you often can’t tell
if a constraint is redundant until you draw the graph, so
it’s best to err on the side of caution and graph too many
constraints rather than graph too few.

Example
We should suspect that region 1 is the one region where allfive constraints are satisfied simultaneously. Unfortunatelywe can’t use (0, 0) as a test point, since it lies on theconstraint lines x = 0 and y = 0. But we can use the point(1, 1), which is definitely inside region 1
Check that (1, 1) satisfies all five constraints:
I 2(1) + 10(1) = 12 ≤ 90
I 1 ≥ 0, 1 ≥ 0
I 1 ≤ 50, 1 ≤ 10
This shows that the solution set to the system of fiveinequalities is region 1. Since all the inequalities are 6, wedraw the constraint lines as solid lines.

Example
The solution: