Linear & Exponential Functions€¦ · 12. Approximately 3.24 billion gallons of water flow over...
31
Name: ALGEBRA 1 A Learning Cycle Approach MODULE 2 Linear & Exponential Functions The Mathematics Vision Project Scott Hendrickson, Joleigh Honey, Barbara Kuehl, Travis Lemon, Janet Sutorius © 2016 Mathematics Vision Project Prior work done in partnership with the Utah State Office of Education © 2013 Licensed under the Creative Commons Attribution-NonCommercial ShareAlike 4.0 Unported license
Transcript of Linear & Exponential Functions€¦ · 12. Approximately 3.24 billion gallons of water flow over...
Name:
ALGEBRA 1
A Learning Cycle Approach
MODULE 2
Linear & Exponential Functions
The Mathematics Vision Project Scott Hendrickson, Joleigh Honey, Barbara Kuehl, Travis Lemon, Janet Sutorius
© 2016 Mathematics Vision Project
Prior work done in partnership with the Utah State Office of Education © 2013 Licensed under the Creative Commons Attribution-NonCommercial ShareAlike 4.0 Unported license


1
2.0 HW: Graphing Practice
Sketch the graph of each line. Write the x- and y-intercepts as a coordinate pair.
1. 22
7 xy
x-intercept: y-intercept:
2. 36 xy
x-intercept: y-intercept:
3. 5y
x-intercept: y-intercept:
4. 24
1 xy
x-intercept: y-intercept:
5. 33
2 xy
x-intercept: y-intercept:
6. 3x
x-intercept: y-intercept:

2
7. 2054 yx
x-intercept: y-intercept:
8. 62 yx
x-intercept: y-intercept:
9. 42 yx
x-intercept: y-intercept:
10. 3 yx
x-intercept: y-intercept:
11. 313
2 xy
x-intercept: y-intercept:
12. 325
1 xy
x-intercept: y-intercept:

3
2.1 CW: Connecting the Dots
1. My little sister, Savannah, is three years old. She has a piggy bank that she wants to fill. She started with five pennies and each day when I come home from school, she is excited when I give her three pennies that are left over from my lunch money. Use a table, a graph, and an equation to create a mathematical model for the number of pennies in the piggy bank on day n. Does it make sense to connect the points on the graph? Explain. 2. Our family has a small pool for relaxing in the summer that holds 1500 gallons of water. I decided to fill the pool for the summer. When I had 5 gallons of water in the pool, I decided that I didn’t want to stand outside and watch the pool fill, so I had to figure out how long it would take so that I could leave, but come back to turn off the water at the right time. I checked the flow on the hose and found that it was filling the pool at a rate of 2 gallons every minute. Use a table, a graph, and an equation to create a mathematical model for the number of gallons of water in the pool at t minutes. Does it make sense to connect the points on the graph? Explain. 3. I’m more sophisticated than my little sister so I save my money in a bank account that pays me 3% interest on the money in the account at the end of each month. (If I take my money out before the end of the month, I don’t earn any interest for the month.) I started the account with $50 that I got for my birthday. Use a table, a graph, and an equation to create a mathematical model of the amount of money I will have in the account after m months. Does it make sense to connect the points on the graph? Explain.

4
4. At the end of the summer, I decide to drain the 1500 gallon swimming pool. I noticed that it drains faster when there is more water in the pool. That was interesting to me, so I decided to measure the rate at which it drains. I found that 3% was draining out of the pool every minute. Use a table, a graph, and an equation to create a mathematical model of the gallons of water in the pool at t minutes. Does it make sense to connect the points on the graph? Explain. 5. Compare problems 1 and 3. What similarities do you see? What differences do you notice? 6. Compare problems 1 and 2. What similarities do you see? What differences do you notice? 7. Compare problems 3 and 4. What similarities do you see? What differences do you notice?

5
2.1 HW: Connecting the Dots
READY Topic: Recognizing arithmetic and geometric sequences Predict the next 2 terms in the sequence. State whether the sequence is arithmetic, geometric, or neither. Justify your answer. 1. 4 , -20 , 100 , -500 , . . . 2. 3 , 5 , 8 , 12 , . . .
3. 64 , 48 , 36 , 27 , . . . 4. 1.5 , 0.75 , 0 , -0.75 , . . .
5. 40 , 10 ,
,
, … 6. 1, 11, 111, 1111, . . .
7. -3.6, -5.4, -8.1, -12.15, . . . 8. -64, -47, -30, -13, . . .
9. Create a predictable sequence of at least 4 numbers that is NOT arithmetic or geometric. SET Topic: Discrete and continuous relationships Identify whether the following statements represent a discrete or a continuous relationship. 10. The hair on your head grows ½ inch per month. 11. For every ton of paper that is recycled, 17 trees are saved. 12. Approximately 3.24 billion gallons of water flow over Niagara Falls daily. 13. The average person laughs 15 times per day. 14. The city of Buenos Aires adds 6,000 tons of trash to its landfills every day. 15. During the Great Depression, stock market prices fell 75%.
6
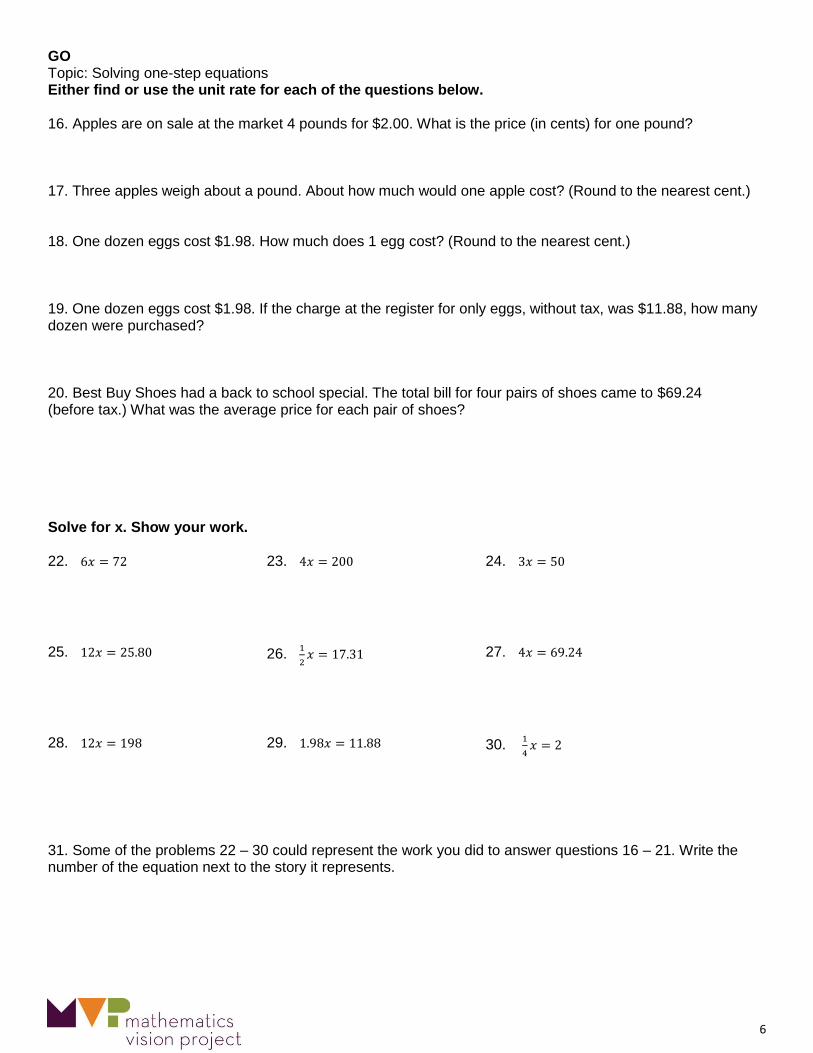
GO Topic: Solving one-step equations Either find or use the unit rate for each of the questions below. 16. Apples are on sale at the market 4 pounds for $2.00. What is the price (in cents) for one pound? 17. Three apples weigh about a pound. About how much would one apple cost? (Round to the nearest cent.) 18. One dozen eggs cost $1.98. How much does 1 egg cost? (Round to the nearest cent.) 19. One dozen eggs cost $1.98. If the charge at the register for only eggs, without tax, was $11.88, how many dozen were purchased? 20. Best Buy Shoes had a back to school special. The total bill for four pairs of shoes came to $69.24 (before tax.) What was the average price for each pair of shoes? Solve for x. Show your work. 22.
23. 24.
25. 26.
27.
28. 29. 30.
31. Some of the problems 22 – 30 could represent the work you did to answer questions 16 – 21. Write the number of the equation next to the story it represents.

7
2.3 CW: Linear, Exponential, or Neither?
1.
2.
Linear or Exponential?
b value (term 0): value of constant rate of change (constant difference) OR change factor (constant ratio):
Explicit Formula:
Recursive Formula:
Table of values:
-3 0.5
-1.5 0
0 -0.5
1.5 -1
3 -1.5
4.5 -2
Graph:
Linear or Exponential?
b value (term 0): value of constant rate of change (constant difference) OR change factor (constant ratio):
Explicit Formula:
Recursive Formula:
Table of values:
Rounds Number of players
1 64
2 32
3 16
4 8
5 4
There are 4 players after 5 rounds.
Graph:

8
3.
4.
Linear or Exponential?
b value (term 0): value of constant rate of change (constant difference) OR change factor (constant ratio):
Explicit Formula:
Recursive Formula:
Table of values:
0 -5
4 -2
-4 -8
8 1
-8 -11
Graph:
Linear or Exponential?
b value (term 0): value of constant rate of change (constant difference) OR change factor (constant ratio):
Explicit Formula:
Recursive Formula:
Table of values:
x y
-1
0
1
2
3
Graph:

9
2.3 HW: Linear, Exponential, or Neither READY Topic: Comparing rates of change in both linear and exponential situations. Identify whether situation “a” or situation “b” has a greater rate of change.
1) a.
b.
2) a.
b.
3) a. Lee has $25 withheld each week from his salary to pay for his subway pass.
b. Jose owes his brother $50. He has promised to pay half of what he owes each week until the debt is paid.
4) a.
b. The number of rhombi in each shape.
5) a.
b. In the children's book, The Magic Pot, every time you put one object into the pot, two of the same object come out. Imagine that you have 5 magic pots.

10
SET Topic: Recognizing linear and exponential functions. Based on each of the given representations of a function determine if it is linear, exponential or neither.
6) The population of a town is decreasing at a rate of 1.5% per year.
7) Joan earns a salary of $30,000 per year plus a 4.25% commission on sales.
8) 9) The number of gifts received each day of ”The 12 Days of Christmas” as a function of the day. (“On the 4th day of Christmas my true love gave to me, 4 calling birds, 3 French hens, 2 turtledoves, and a partridge in a pear tree.”)
10)
x 1 2 4 8
f(x) 3 6 12 24
11)
GO Topic: Geometric means For each geometric sequence below, find the missing terms in the sequence.
12) x 1 2 3 4 5
y 2
162
13)
x 1 2 3 4
y
-3
14)
x 1 2 3 4 5
y 10 0.625
15)
x 1 2 3 4 5
y g gz4

11
2.4 CW: Getting Down to Business
Calcu-rama had a net income of 5 million dollars in 2010, while a small competing company, Computafest, had a net income of 2 million dollars. The management of Calcu-rama develops a business plan for future growth that projects an increase in net income of 0.5 million per year, while the management of Computafest develops a plan aimed at increasing its net income by 15% each year.
1. Create standard mathematical models for the projected net income over time for both companies.
Calcu-rama Computafest
years since 2010
net income
(in millions of $)
0 5
1
2
3
4
years since 2010
net income
(in millions of $)
0 2
1
2
3
4
graph (sketch)
graph (sketch)
recursive equation
recursive equation
explicit equation
explicit equation

12
2. Compare the two companies. How are the representations for the net income of the two companies similar? How do they differ? What relationships are highlighted in each representation?
3. If both companies were able to meet their net income growth goals, which company would you choose to invest in? Why? 4. When, if ever, would your projections suggest that the two companies have the same net income? How did you find this? Will they ever have the same net income again?
13
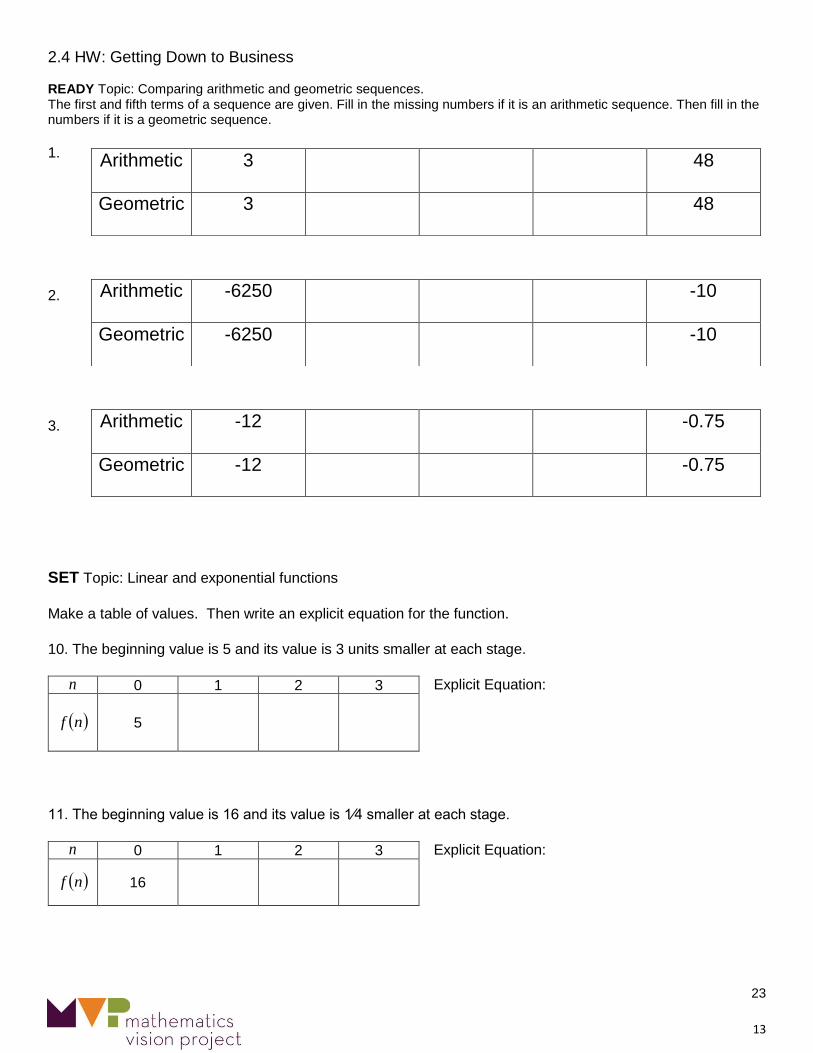
2.4 HW: Getting Down to Business READY Topic: Comparing arithmetic and geometric sequences. The first and fifth terms of a sequence are given. Fill in the missing numbers if it is an arithmetic sequence. Then fill in the numbers if it is a geometric sequence.
1.
Arithmetic 3
48
Geometric 3
48
2.
Arithmetic -6250
-10
Geometric -6250
-10
3.
Arithmetic -12
-0.75
Geometric -12
-0.75
SET Topic: Linear and exponential functions
Make a table of values. Then write an explicit equation for the function.
10. The beginning value is 5 and its value is 3 units smaller at each stage.
n 0 1 2 3
nf 5
Explicit Equation:
11. The beginning value is 16 and its value is 1⁄4 smaller at each stage.
n 0 1 2 3
nf 16
Explicit Equation:
23

14
GO Topic: Writing explicit equations for linear and exponential models. Write an explicit equation for each of the relationships represented in the tables and graphs below. This is something you really need to know. Persevere and do all you can to figure them out. Remember the tools we have used. (#21 is bonus give it a try.)
12.
13.
14.
15.
16.
17.
18.
19.
20.
21.

15
2.4B CW: Growing, Growing, Gone
The U.S. population in 1910 was 92 million people. In 1990 the population was 250 million. Create both a linear and an exponential model of the population from 1910 to 2030, with projected data points at least every 20 years, starting in 1910. (round to the nearest tenth when writing your answers in the table)
Year 1910 1930 1950 1970 1990 2010 2030 *x 0 1 2 3 4 5 6
Linear Model
(Arithmetic) 92 250
Exponential Model
(Geometric) 92 250
Actual
92
250
*: stands for the number of 20 year time periods since the year 1910.
Linear Model: Exponential Model: Find the constant difference: Find the constant ratio: Explicit Equation (Linear): Explicit Equation (Exponential): The actual U.S. population data was:
1930: 1950: 1970: 2010:
Fill in the final row of the table with this information. Which model provides a better forecast of the U.S. population for the year 2030? Explain.

16
2.4B: Warm Up Use the picture below to answer questions #1-3
stage 1 stage 2 stage 3
1. Fill in the table
Stage # # of small triangles
1
2
3
4
5
…
10
2. Write an explicit function to describe the pattern 3. Create a graph

17
2.4B HW: Growing, Growing, Gone
Compare different characteristics of each type of function by filling in each cell of the table as completely as possible
1. Type of relationship (linear or exponential)
2. Type of growth (common difference or common ratio)
3. What kind of sequence corresponds to each model?
4. Make a table of values (at least three points).
5. Find the pattern of change.
6. Graph each equation and compare the graphs. (Graph at least 3 points.) What is the same? What is different?
7. Find the coordinate of the y-intercept for each function.
x y x y

18
8. Find the y-intercepts for the following equations
a. b.
40 Use the picture below to answer questions 9-11.
Stage 1 Stage 2 Stage 3 9. Fill in the table 10. Write an explicit function to describe the pattern
11. Graph at least three points.
Stage # of dots
1
2
3
4
5
…
10

19
2.4C CW: Discrete or Continuous?
Discrete Card letters: Summarize: Describe how you identified these relationships as discrete. Continuous Card letters: Summarize: Describe how you identified these relationships as continuous.
2.7H CW: I Can See—Can’t You? (Part 1)

20
Kwan’s parents bought a home for $50,000 in 1997 just as real estate values in the area started to rise quickly. Each year, their house was worth more until they sold the home in 2007 for $309,587. 1. Model the growth of the home’s value from 1997 to 2007 with both a linear and an exponential equation. Fill in the table for each model and sketch a graph of the two models below. Linear model Rate of Change: Equation:
Year Value
1997 $50,000
…
2002
…
2007 $309,587
Exponential model Rate of Change Equation:
Year Value
1997 $50,000
…
2002
…
2007 $309,587
The average rate of change is defined as the change in y (or f(x)) divided by the change in x.

21
2. What was the average rate of change of the linear function from 1997 to 2007? 3. What is the average rate of change of the exponential function in the interval from 1997 to 2007? 4. How do the average rates of change from 1997 to 2007 compare for the two functions? Explain. 5. What was the average rate of change of the linear function from 1997 to 2002? 6. What is the average rate of change of the exponential function in the interval from 1997 to 2002? 7. How do the average rates of change from 1997 to 2002 compare for the two functions? Explain. 8. What was the average rate of change of the linear function from 2002 to 2007? 9. What is the average rate of change of the exponential function in the interval from 2002 to 2007? 10. How do the average rates of change from 2002 to 2007 compare for the two functions? Explain. 11. How can you use the equation of the exponential function to find the average rate of change over a given interval? How does this process compare to finding the slope of the line through the endpoints of the interval?

22
2.7H CW: I Can See—Can’t You? (Part 2)
Use the graph shown here to answer questions 10-17.
10. Fill in the table for the indicated values.
x -4 -3 -2 -1 0 1
y
11. What is the average rate of change of this function on the interval from: x = -4 to x = -2? 12. What is the average rate of change of this function on the interval from: x = -4 to x = -1? 13. What is the average rate of change of this function on the interval from: x = -4 to x = 0? 14. What is the average rate of change of this function on the interval from: x = -4 to x = 1?

23
15. Draw the line through the point at the beginning and end of each of the intervals in 11, 12, 13, and 14.
11. x = -4 to x = -2 12. x = -4 to x = -1 13. x = -4 to x = 0 14. x = -4 to x = 1 16. What is the slope of each of the lines you drew in question 15?
11. 12.
13.
14.
17. How does the average rate of change compare to the change factor for an exponential function? What is described by each of these quantities? 18. Which of these average rates of change best represents the change at the point (-3, 8)? Explain your answer.

24
2.7 HW: I Can See – Can’t You?
READY Topic: Finding an appropriate viewing window.
When viewing the secant line of an exponential function on a calculator, you want a window that shows the two points on the curve that are being connected. Since exponential functions get very large or small in just a few steps, you may want to change the scale as well as the dimensions of the window. Don’t be afraid to experiment until you are satisfied with what you see.
The graphs below depict an exponential function and a secant line. The equations are given. Identify the dimensions of the viewing window. Include the scale for both the x and y values. Check your answer by matching your calculator screen to the one displayed here.
a. X min =
b. X max =
c. X scl =
d. Y min =
e. Y max =
f. Y scl =
a. X min =
b. X max =
c. X scl =
d. Y min =
e. Y max =
f. Y scl =
a. X min =
b. X max =
c. X scl =
d. Y min =
e. Y max =
f. Y scl =

25
SET Topic: Using slope to compare change in linear and exponential models.
4. The tables below show the values for a linear model and an exponential model. Use the slope formula between each set of 2 points to calculate the rate of change.
Note: Recall that slope is the difference in y divided by the difference in x. Since the difference in x for each set of points is 1, you can just find the difference in the y values.
Linear Model
x y slope between each
pair of points
1 30 NA
2 630 630 – 30 = 600
3 1230
4 1830
5 2430
Exponential Model
x y slope between each
pair of points
1 30 NA
2 90 90 – 30 = 60
3 270
4 810
5 2430
5. Compare the change between each pair of points in the linear model to the change between each pair of points in the exponential model. Describe your observations and conclusions. 6. Find the average of the 4 rates of change of the exponential model. How does the average of the rates of change of the exponential model compare to the rates of change of the linear model? 7. Without using a graphing calculator, make a rough sketch on the same set of axes of what you think the linear model and the exponential model would look like. 8. How did your observations in #5 influence your sketch? 9. Explain how a table of 5 consecutive values can begin and end with the same y-values and be so different in the middle 3 values. How does this idea connect to the meaning of a secant line?

26
Module 2 Quiz Warm Up
1. How many shaded triangles will be in step 6? 2. Write an explicit equation to find the number of shaded triangles in any step

27
Exponent Rules Worksheet 1 1. Circle the correct answer or state that both are correct or neither is correct. If neither is correct, write the correct answer in the last column. All variables are non-zero.
Problem Answer A Answer B Both or neither
(correct answer if neither)
a) 6 8x x
48x 14x
b) 8
6x 48x 14x
c) 5
32x
152x 1510x
d)
35
4
3x
y
15
12
27x
y 15 1227x y
e)
5
3 7
x y
x y
2 7x y
2
6
x
y
f) 0x ;
1 x
g) 5 123 10 8 10
in scientific notation
1724 10 162.4 10

28
Exponent Rules Worksheet 2 1. Negative Exponents Write the following expressions as a fraction. (no decimals) Use a calculator to check your answers for a-h.
a. 14 b. 15 c.
110
d. 210
e.
3
2
1
f.
1
5
2
2. Determine whether the following statements are true or false. If the statement is false, rewrite the right side of the equation to make a true statement. All variables have nonzero values.
a. 66 1 b. 816 2
c.
3
362
tt
d. 2
1
2 4
14x
x
e. 623 63 xyxy f. 150

29
3. Write each of these expressions in simplest form and with positive exponents. All variables have nonzero values.
a.
-3
9 3 9
1x
x x x
b. 23 x
c. 4
7
x
x
d. 04x e. 35324 cac f. 53
124
5
45
nm
nm
g. 02402 wah
h.
52
4
3
3
y
y
i. 22 x
j. 22
x k. 2
2
x l. 22 x