Linear disturbances on discontinuous permafrost: … et al... · windrows along the edge of the...
12
IOP PUBLISHING ENVIRONMENTAL RESEARCH LETTERS Environ. Res. Lett. 8 (2013) 025006 (12pp) doi:10.1088/1748-9326/8/2/025006 Linear disturbances on discontinuous permafrost: implications for thaw-induced changes to land cover and drainage patterns Tyler J Williams, William L Quinton and Jennifer L Baltzer Cold Regions Research Centre, Wilfrid Laurier University, 75 University Avenue W, Waterloo, ON, N2L 3C5, Canada E-mail: [email protected] Received 19 December 2012 Accepted for publication 4 March 2013 Published 18 April 2013 Online at stacks.iop.org/ERL/8/025006 Abstract Within the zone of discontinuous permafrost, linear disturbances such as winter roads and seismic lines severely alter the hydrology, ecology, and ground thermal regime. Continued resource exploration in this environment has created a need to better understand the processes causing permafrost thaw and concomitant changes to the terrain and ground cover, in order to efficiently reduce the environmental impact of future exploration through the development of best management practices. In a peatland 50 km south of Fort Simpson, NWT, permafrost thaw and the resulting ground surface subsidence have produced water-logged linear disturbances that appear not to be regenerating permafrost, and in many cases have altered the land cover type to resemble that of a wetland bog or fen. Subsidence alters the hydrology of plateaus, developing a fill and spill drainage pattern that allows some disturbances to be hydrologically connected with adjacent wetlands via surface flow paths during periods of high water availability. The degree of initial disturbance is an important control on the extent of permafrost thaw and thus the overall potential recovery of the linear disturbance. Low impact techniques that minimize ground surface disturbance and maintain original surface topography by eliminating windrows are needed to minimize the impact of these linear disturbances. Keywords: permafrost thaw, active layer, resource exploration, linear disturbances, peatlands 1. Introduction Ongoing resource exploration in Canada’s North produces a dense network of linear disturbances in the form of winter roads, seismic lines, and pipelines with the potential for large cumulative environmental impacts. In a forested permafrost environment the habitat disruption, regrowth of trees, and changes in hydrology along such disturbances Content from this work may be used under the terms of the Creative Commons Attribution 3.0 licence. Any further distribution of this work must maintain attribution to the author(s) and the title of the work, journal citation and DOI. depend on the degree of permafrost thaw (Jorgenson et al 2010a). Such consequences may be particularly important along the southern margins of discontinuous permafrost where permafrost is relatively thin (∼10 m) (Burgess and Smith 2000) and ground thermal regimes are vulnerable to disturbance. A wide range of methods can be employed to create seismic lines, the most common type of linear disturbance. Decisions on the most appropriate method for a given situation, and the development of new science-based guidelines for future exploration (e.g. AANDC 2011) both require a clear understanding of potential impacts and feedbacks of seismic disturbance. 1 1748-9326/13/025006+12$33.00 c 2013 IOP Publishing Ltd Printed in the UK
Transcript of Linear disturbances on discontinuous permafrost: … et al... · windrows along the edge of the...

IOP PUBLISHING ENVIRONMENTAL RESEARCH LETTERS
Environ. Res. Lett. 8 (2013) 025006 (12pp) doi:10.1088/1748-9326/8/2/025006
Linear disturbances on discontinuouspermafrost: implications forthaw-induced changes to land cover anddrainage patterns
Tyler J Williams, William L Quinton and Jennifer L Baltzer
Cold Regions Research Centre, Wilfrid Laurier University, 75 University Avenue W, Waterloo, ON,N2L 3C5, Canada
E-mail: [email protected]
Received 19 December 2012Accepted for publication 4 March 2013Published 18 April 2013Online at stacks.iop.org/ERL/8/025006
AbstractWithin the zone of discontinuous permafrost, linear disturbances such as winter roads andseismic lines severely alter the hydrology, ecology, and ground thermal regime. Continuedresource exploration in this environment has created a need to better understand the processescausing permafrost thaw and concomitant changes to the terrain and ground cover, in order toefficiently reduce the environmental impact of future exploration through the development ofbest management practices. In a peatland 50 km south of Fort Simpson, NWT, permafrostthaw and the resulting ground surface subsidence have produced water-logged lineardisturbances that appear not to be regenerating permafrost, and in many cases have altered theland cover type to resemble that of a wetland bog or fen. Subsidence alters the hydrology ofplateaus, developing a fill and spill drainage pattern that allows some disturbances to behydrologically connected with adjacent wetlands via surface flow paths during periods of highwater availability. The degree of initial disturbance is an important control on the extent ofpermafrost thaw and thus the overall potential recovery of the linear disturbance. Low impacttechniques that minimize ground surface disturbance and maintain original surface topographyby eliminating windrows are needed to minimize the impact of these linear disturbances.
Keywords: permafrost thaw, active layer, resource exploration, linear disturbances, peatlands
1. Introduction
Ongoing resource exploration in Canada’s North producesa dense network of linear disturbances in the form ofwinter roads, seismic lines, and pipelines with the potentialfor large cumulative environmental impacts. In a forestedpermafrost environment the habitat disruption, regrowth oftrees, and changes in hydrology along such disturbances
Content from this work may be used under the terms ofthe Creative Commons Attribution 3.0 licence. Any further
distribution of this work must maintain attribution to the author(s) and thetitle of the work, journal citation and DOI.
depend on the degree of permafrost thaw (Jorgenson et al2010a). Such consequences may be particularly importantalong the southern margins of discontinuous permafrostwhere permafrost is relatively thin (∼10 m) (Burgess andSmith 2000) and ground thermal regimes are vulnerable todisturbance. A wide range of methods can be employedto create seismic lines, the most common type of lineardisturbance. Decisions on the most appropriate method for agiven situation, and the development of new science-basedguidelines for future exploration (e.g. AANDC 2011) bothrequire a clear understanding of potential impacts andfeedbacks of seismic disturbance.
11748-9326/13/025006+12$33.00 c© 2013 IOP Publishing Ltd Printed in the UK

Environ. Res. Lett. 8 (2013) 025006 T J Williams et al
Conventional techniques for seismic exploration create6–10 m wide lines, with coarse woody debris piled inwindrows along the edge of the disturbance, often usingheavy machinery such as bulldozers to clear the lineresulting in uprooting, surface soil removal, and compaction(AECOM 2009). Strategies designed to minimize the impactinclude reducing disturbance width, restricting explorationto the winter period, and the use of low-impact vehiclesor hand clearing techniques (AECOM 2009). Collectively,these strategies have been termed LIS (low-impact seismic)and while they have become commonplace in Alberta andnorthern British Columbia, they are not widely used in theNWT where adoption by industry has largely been on avoluntary basis (AECOM 2009).
Extensive ground thermal monitoring on the NormanWells Pipeline south of Fort Simpson, NWT, has shownseveral metres of vertical permafrost thaw, a complete loss ofthin permafrost, ponding, and ground subsidence of more than2 m (Smith et al 2008). A pipeline is a significant disturbance,with a large (∼25 m) right of way and a pipe that is a continualsource of heat. As such, the findings of Smith et al (2008)might not be directly transferable to the case of seismic lines.
The majority of research on seismic line impacts has beenconducted in the zone of continuous permafrost (Jorgensonet al 2010a, Kemper and Macdonald 2009, Raynolds and Felix1989, Hernandez 1973), or conducted from an ecologicalperspective with regards to tree regeneration (Lee andBoutin 2006, Revel et al 1984), and habitat disruption(Machtans 2006, Dyer et al 2001, James and Stuart-Smith2000). Consequently, the linkages among linear disturbances,permafrost thaw and changes to hydrology within thediscontinuous permafrost zone remain poorly understood(Turetsky and St Louis 2006).
In peatlands, the thermal conductivity and thus the rateof ground thaw is largely determined by its water contentdue to the large porosity of peat (>0.80) (Guan et al 2010,Woo 1986). In this environment, permafrost remains onlywhere the ground surface remains dry (Kwong and Gan1994). The ground beneath the frost table (i.e. zero-degreeisotherm) is saturated with ice and a small fraction ofunfrozen water, and is therefore relatively impermeable toinfiltrating water (Woo 1986). The frost table thus controlsthe rate and pattern of subsurface drainage. Preferential thawbelow wet surfaces induce a hydraulic gradient directingflow towards the thaw depression (Wright et al 2009). Theground thermal regime is thus dependent on feedbacks withsoil moisture and micro-topography (Jorgenson et al 2010b)and disturbance-related changes in frost table and soil waterhave the potential to feedback positively on one another tosend linear disturbances on permafrost into an unstable anddegrading state.
The goal of this research is to assess this possibilityand increase the understanding of permafrost thaw-inducedchanges to land cover and drainage patterns caused bylinear disturbances. This will be accomplished through thefollowing specific objectives: (1) assess the spatial variabilityof the ground thermal regime along linear disturbances inrelation to undisturbed sections of plateau by measuring active
layer thaw, permafrost depth, soil moisture, ground surfacesubsidence, and snow depth; (2) use surface subsidence asa proxy for the degree of site degradation, and examine thecontrols on subsidence with regards to different disturbanceages, types, and surrounding plateau properties; and (3)measure the storage and movement of surface water along alinear disturbance to better understand how disturbances alterthe hydraulic function of peat plateaus.
2. Study site
The study site is located 50 km south of Fort Simpson, NWT,in the headwaters of Scotty Creek (61◦18′N, 121◦18′W)(figure 1). As is typical of the southern margin of permafrostin Canada, Scotty Creek is a peatland environment where∼10 m thick permafrost (McClymont et al 2010) gives riseto plateaus that are elevated ∼1–2 m above the surroundingpermafrost-free flat bogs and channel fens. The elevatedplateaus allow them to develop an unsaturated peat layer nearthe ground surface, which thermally insulates the underlyingpermafrost and results in an active layer typically between 0.5and 0.8 m (Wright et al 2009). Plateaus support an open blackspruce canopy (Picea mariana), a shrub layer dominated byLabrador Tea (Rhododendron groenlandicum), and a surfacecover of lichens (Cladina mitis and Cladina rangiferina aredominant) and Sphagnum mosses. Fens and bogs have watertables near or above the ground surface and generally do notsupport trees, although in some cases larch (Larix laricina)will form a thin canopy.
The hydrology at Scotty Creek is controlled by thedistribution of these three land cover types, which generallyhave unique functions to either generate runoff (plateaus),store water (bogs), or act as the basin drainage network(channel fens). At the basin scale, permafrost plateaus act asobstacles to basin drainage that channel fens must negotiatelike a braided stream around gravel bars. As such, permafrostplateaus increase the tortuosity of flow paths along channelfens that drain towards the basin outlet. A study by Quintonet al (2003) of five similar peatland basins near Scotty Creekshowed higher runoff ratios over a four-year period in basinswith a greater percentage area of channel fens. The densityof linear disturbances within Scotty Creek is 0.875 km km−2
(Quinton et al 2011); about five times the natural drainagedensity of the basin. If such disturbances function as channelfens to connect adjacent wetlands, they would have a majorimpact on the cycling and storage of water within the basin.
Three types of linear disturbances exist at Scotty Creek(figure 1): abandoned winter roads (1943, 1969) up to15 m wide, seismic lines (1969, 1985) 7–10 m wide, andaccess paths (1969) 5–6 m wide. All seismic lines at ScottyCreek were created using conventional techniques for seismicexploration. However, the narrow paths appear to provide auseful analogue for more modern LIS techniques in whichimpact on the ground surface is minimized. The purpose ofcreating the narrow paths is unknown, but we do know thatnot all their trees were cleared from the disturbance, as someof them were found by tree-ring analysis to be over 90 yearsold, suggesting that large machinery was not used to createthese paths.
2

Environ. Res. Lett. 8 (2013) 025006 T J Williams et al
Figure 1. Location of the study site in the zone of discontinuous permafrost, with data obtained from the Geological Survey of Canada(2002), south of Fort Simpson, Northwest Territories, Canada. The four measurement plateaus are located on land cover maps interpretedfrom WorldView2 satellite imagery. P1 and P2 have large intersections with linear disturbances (each >375 m), while P3 and P4 are smallsections of plateau with short intersections (80–85 m). White dots represent individual measurement points, and the eight cross-sectiontransects are labelled (A)–(H). Transects located parallel to disturbances were positioned on the middle of the disturbance, as well as 1 mfrom the disturbance edge in the case of the three grids on Plateaus 1, 3, and 4. The streamflow measurement location (SF) is located on thewest side of Plateau 1, basin drainage is towards the northwest from Goose Lake into First Lake.
3. Methods
3.1. Field data
Beginning on 23 March 2011 on each of the four measurementplateaus (figure 1), transects located along and across 1985and 1969 seismic lines, a 1969 winter road, and a 1969path measured snow depth (snow probe) and snow waterequivalent (ESC snow tube and calibrated scale). As snowmeltincreased, so did the frequency of snow measurement surveys,and by 29 April each site was being measured every 1–2days to provide the rate of snowmelt. Upon the snow-freecondition, frost table depth below the ground surface (2 mgraduated steel rod), depth-integrated soil moisture from 0to 5 cm (site-calibrated Delta-T Theta-Probe ML2x), and thewater table depth below the ground surface or height above
it (metal ruler) were measured on all transects. Snowfalland rainfall during the measurement period (after 23 March)were measured within a large canopy gap on Plateau 2 usinga precipitation gauge (Geonor T-200B). Frost table depthmeasurements continued on a daily basis until 4 June, andwere measured once in July (between 24 and 26 July), andagain in August (between 29 and 31 August). The depth ofthe frost table at the end of August is assumed to representthe maximum extent of seasonal thaw and the location ofthe permafrost table. When large increases (>20 cm) wereobserved in the frost table depth over a single day, theprevious day measurement is assumed to represent the baseof the active layer. Early onset of this condition represents agreater potential for permafrost thaw to occur and sites werecompared based on the percentage of points that had observedthis active layer thaw (%ALT).
3
Environ. Res. Lett. 8 (2013) 025006 T J Williams et al
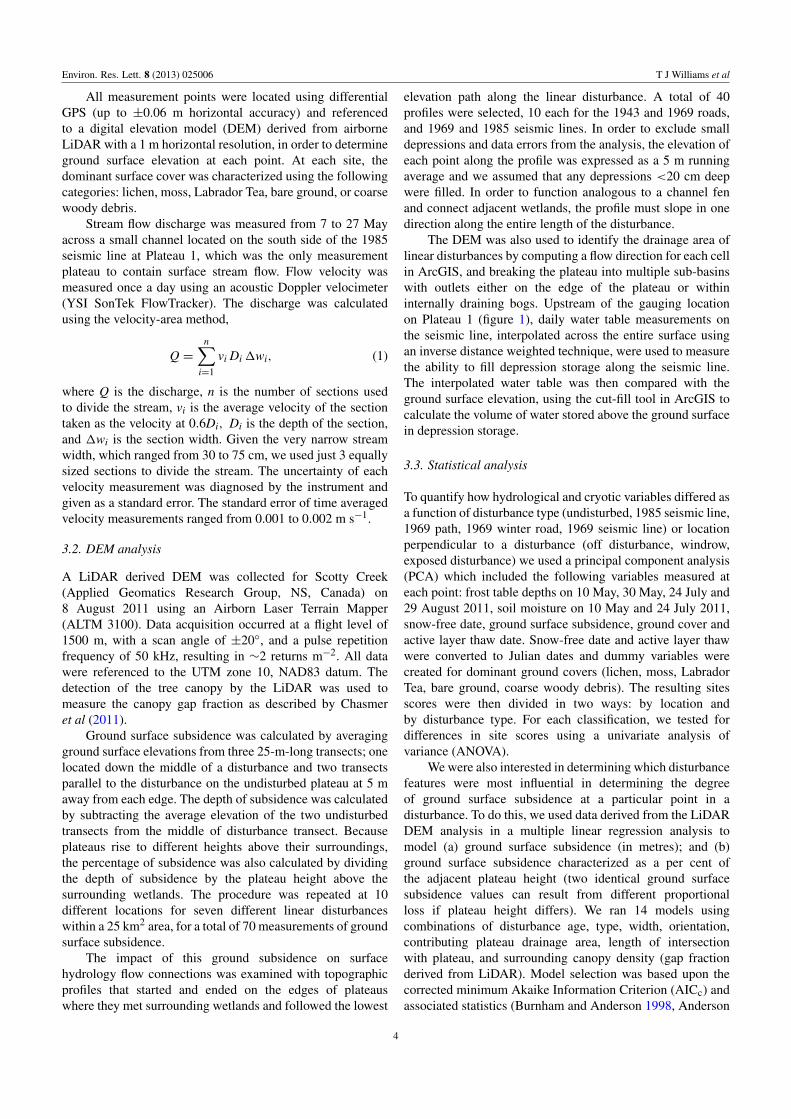
All measurement points were located using differentialGPS (up to ±0.06 m horizontal accuracy) and referencedto a digital elevation model (DEM) derived from airborneLiDAR with a 1 m horizontal resolution, in order to determineground surface elevation at each point. At each site, thedominant surface cover was characterized using the followingcategories: lichen, moss, Labrador Tea, bare ground, or coarsewoody debris.
Stream flow discharge was measured from 7 to 27 Mayacross a small channel located on the south side of the 1985seismic line at Plateau 1, which was the only measurementplateau to contain surface stream flow. Flow velocity wasmeasured once a day using an acoustic Doppler velocimeter(YSI SonTek FlowTracker). The discharge was calculatedusing the velocity-area method,
Q =n∑
i=1
vi Di 1wi, (1)
where Q is the discharge, n is the number of sections usedto divide the stream, vi is the average velocity of the sectiontaken as the velocity at 0.6Di, Di is the depth of the section,and 1wi is the section width. Given the very narrow streamwidth, which ranged from 30 to 75 cm, we used just 3 equallysized sections to divide the stream. The uncertainty of eachvelocity measurement was diagnosed by the instrument andgiven as a standard error. The standard error of time averagedvelocity measurements ranged from 0.001 to 0.002 m s−1.
3.2. DEM analysis
A LiDAR derived DEM was collected for Scotty Creek(Applied Geomatics Research Group, NS, Canada) on8 August 2011 using an Airborn Laser Terrain Mapper(ALTM 3100). Data acquisition occurred at a flight level of1500 m, with a scan angle of ±20◦, and a pulse repetitionfrequency of 50 kHz, resulting in ∼2 returns m−2. All datawere referenced to the UTM zone 10, NAD83 datum. Thedetection of the tree canopy by the LiDAR was used tomeasure the canopy gap fraction as described by Chasmeret al (2011).
Ground surface subsidence was calculated by averagingground surface elevations from three 25-m-long transects; onelocated down the middle of a disturbance and two transectsparallel to the disturbance on the undisturbed plateau at 5 maway from each edge. The depth of subsidence was calculatedby subtracting the average elevation of the two undisturbedtransects from the middle of disturbance transect. Becauseplateaus rise to different heights above their surroundings,the percentage of subsidence was also calculated by dividingthe depth of subsidence by the plateau height above thesurrounding wetlands. The procedure was repeated at 10different locations for seven different linear disturbanceswithin a 25 km2 area, for a total of 70 measurements of groundsurface subsidence.
The impact of this ground subsidence on surfacehydrology flow connections was examined with topographicprofiles that started and ended on the edges of plateauswhere they met surrounding wetlands and followed the lowest
elevation path along the linear disturbance. A total of 40profiles were selected, 10 each for the 1943 and 1969 roads,and 1969 and 1985 seismic lines. In order to exclude smalldepressions and data errors from the analysis, the elevation ofeach point along the profile was expressed as a 5 m runningaverage and we assumed that any depressions <20 cm deepwere filled. In order to function analogous to a channel fenand connect adjacent wetlands, the profile must slope in onedirection along the entire length of the disturbance.
The DEM was also used to identify the drainage area oflinear disturbances by computing a flow direction for each cellin ArcGIS, and breaking the plateau into multiple sub-basinswith outlets either on the edge of the plateau or withininternally draining bogs. Upstream of the gauging locationon Plateau 1 (figure 1), daily water table measurements onthe seismic line, interpolated across the entire surface usingan inverse distance weighted technique, were used to measurethe ability to fill depression storage along the seismic line.The interpolated water table was then compared with theground surface elevation, using the cut-fill tool in ArcGIS tocalculate the volume of water stored above the ground surfacein depression storage.
3.3. Statistical analysis
To quantify how hydrological and cryotic variables differed asa function of disturbance type (undisturbed, 1985 seismic line,1969 path, 1969 winter road, 1969 seismic line) or locationperpendicular to a disturbance (off disturbance, windrow,exposed disturbance) we used a principal component analysis(PCA) which included the following variables measured ateach point: frost table depths on 10 May, 30 May, 24 July and29 August 2011, soil moisture on 10 May and 24 July 2011,snow-free date, ground surface subsidence, ground cover andactive layer thaw date. Snow-free date and active layer thawwere converted to Julian dates and dummy variables werecreated for dominant ground covers (lichen, moss, LabradorTea, bare ground, coarse woody debris). The resulting sitesscores were then divided in two ways: by location andby disturbance type. For each classification, we tested fordifferences in site scores using a univariate analysis ofvariance (ANOVA).
We were also interested in determining which disturbancefeatures were most influential in determining the degreeof ground surface subsidence at a particular point in adisturbance. To do this, we used data derived from the LiDARDEM analysis in a multiple linear regression analysis tomodel (a) ground surface subsidence (in metres); and (b)ground surface subsidence characterized as a per cent ofthe adjacent plateau height (two identical ground surfacesubsidence values can result from different proportionalloss if plateau height differs). We ran 14 models usingcombinations of disturbance age, type, width, orientation,contributing plateau drainage area, length of intersectionwith plateau, and surrounding canopy density (gap fractionderived from LiDAR). Model selection was based upon thecorrected minimum Akaike Information Criterion (AICc) andassociated statistics (Burnham and Anderson 1998, Anderson
4

Environ. Res. Lett. 8 (2013) 025006 T J Williams et al
Table 1. Measured cryotic and hydrological variables summarized by location (off disturbance, windrow, exposed disturbance) andmeasurement site (large Plateaus 1 and 2, small Plateaus 3 and 4). Variables include: median frost table (FT) depth, percentage ofmeasurement points where the active layer (previous winter freezing) had thawed (ALT), median snow free (SF) date, and the meanvolumetric soil moisture (SM) from 0 to 5 cm expressed in May as an average of six days of measurement between 8 and 22 May and inJuly for a single measurement day between 24 and 26 July; soil moisture variance is expressed as ± standard error and ‘nd’ indicates nodata. On exposed parts of the disturbances, frost tables often exceeded 200 cm and as such were recorded as >200; we could not as aconsequence calculate standard errors for these values.
n
Median FT depth (cm) ALT (%)
Med. SFdate (days)
Mean vol. SM (%)
10 May 30 May 24–26 July 29–31 Aug30May
24–26July
8–22May 24–26 July
Off disturbance 74 9.8± 1.0 16.1± 0.7 37.9 ± 1.7 49.9 ± 1.6 0 1 6 May ± 0.2 41.7± 1.8 25.7 ± 1.6Windrow 37 8.9± 0.7 17.4± 1.0 40.0 ± 7.8 53.2 ± 7.4 3 3 2 May ± 1.2 41.2± 2.2 21.9 ± 2.1Exposed disturbance:
Plateau 1 1969 path 44 nd 20.0± 1.0 nd 61.8 0 nd nd nd ndPlateau 1 1985 seismic 61 5.8± 1.1 29.0 >200 >200 39 87 5 May ± 0.5 72.0± 1.7 59.2 ± 3.2Plateau 2 1969 road 26 7.6± 2.2 29.2 >200 >200 46 100 4 May ± 0.4 67.7± 3.1 69.5 ± 3.4Plateau 3 1985 seismic 18 5.6± 0.9 18.9 173.3 187.4 22 61 8 May ± 0.5 58.1± 4.3 43.9 ± 5.5Plateau 4 1969 seismic 38 5.7± 0.8 18.8 >200 >200 5 76 8 May ± 0.3 58.2± 2.7 48.3 ± 3.5
Figure 2. Ground surface elevation, active layer thickness, and permafrost table depth measured on six cross-sections (located in figure 1)for (a) 1985 seismic line on Plateau 1, ((b), (c)) 1969 paths on Plateau 1, (d) 1969 winter road on Plateau 2, (e) 1985 seismic line on Plateau3, and (f) 1969 seismic line on Plateau 4. Yellow shaded regions represent perennially unfrozen peat; however, where end of Augustmeasurements exceed the 2 m limit of the frost probe, these cannot be confirmed as taliks due the potential of it being free of permafrost.
2008). Lower AICc values indicate a more parsimoniousmodel (Burnham and Anderson 1998, Anderson 2008);1AICc values were calculated in relation to the minimumAICc model. Model likelihoods and evidence ratios were thencalculated to identify which model had the greatest support.All statistical analyses were conducted using R (2.13.1, The RFoundation for Statistical Computing, Vienna, Austria).
4. Results
4.1. Linear disturbance effects on hydrologic and cryoticproperties
With the exception of the 1969 paths, linear disturbancessubstantially increased soil moisture, depth to permafrost,and resulted in active layer thaw prior to the end of August(table 1, figure 2). The extent of permafrost thaw across
5
Environ. Res. Lett. 8 (2013) 025006 T J Williams et al
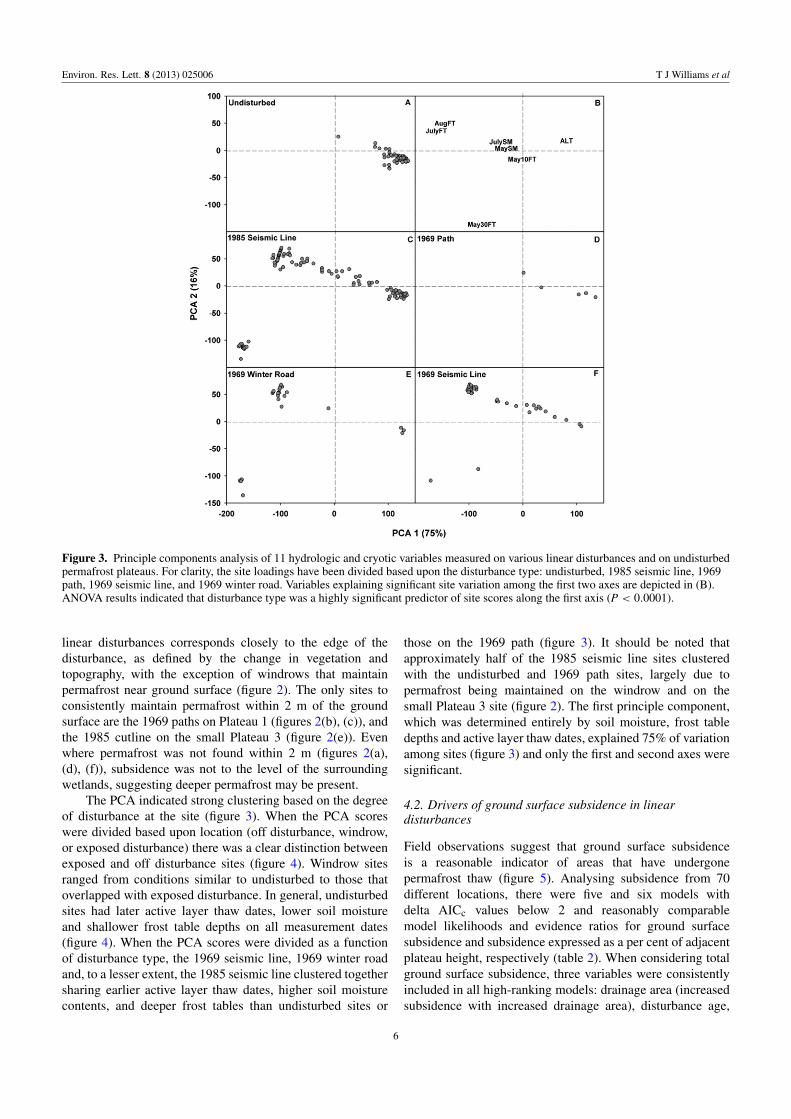
Figure 3. Principle components analysis of 11 hydrologic and cryotic variables measured on various linear disturbances and on undisturbedpermafrost plateaus. For clarity, the site loadings have been divided based upon the disturbance type: undisturbed, 1985 seismic line, 1969path, 1969 seismic line, and 1969 winter road. Variables explaining significant site variation among the first two axes are depicted in (B).ANOVA results indicated that disturbance type was a highly significant predictor of site scores along the first axis (P < 0.0001).
linear disturbances corresponds closely to the edge of thedisturbance, as defined by the change in vegetation andtopography, with the exception of windrows that maintainpermafrost near ground surface (figure 2). The only sites toconsistently maintain permafrost within 2 m of the groundsurface are the 1969 paths on Plateau 1 (figures 2(b), (c)), andthe 1985 cutline on the small Plateau 3 (figure 2(e)). Evenwhere permafrost was not found within 2 m (figures 2(a),(d), (f)), subsidence was not to the level of the surroundingwetlands, suggesting deeper permafrost may be present.
The PCA indicated strong clustering based on the degreeof disturbance at the site (figure 3). When the PCA scoreswere divided based upon location (off disturbance, windrow,or exposed disturbance) there was a clear distinction betweenexposed and off disturbance sites (figure 4). Windrow sitesranged from conditions similar to undisturbed to those thatoverlapped with exposed disturbance. In general, undisturbedsites had later active layer thaw dates, lower soil moistureand shallower frost table depths on all measurement dates(figure 4). When the PCA scores were divided as a functionof disturbance type, the 1969 seismic line, 1969 winter roadand, to a lesser extent, the 1985 seismic line clustered togethersharing earlier active layer thaw dates, higher soil moisturecontents, and deeper frost tables than undisturbed sites or
those on the 1969 path (figure 3). It should be noted thatapproximately half of the 1985 seismic line sites clusteredwith the undisturbed and 1969 path sites, largely due topermafrost being maintained on the windrow and on thesmall Plateau 3 site (figure 2). The first principle component,which was determined entirely by soil moisture, frost tabledepths and active layer thaw dates, explained 75% of variationamong sites (figure 3) and only the first and second axes weresignificant.
4.2. Drivers of ground surface subsidence in lineardisturbances
Field observations suggest that ground surface subsidenceis a reasonable indicator of areas that have undergonepermafrost thaw (figure 5). Analysing subsidence from 70different locations, there were five and six models withdelta AICc values below 2 and reasonably comparablemodel likelihoods and evidence ratios for ground surfacesubsidence and subsidence expressed as a per cent of adjacentplateau height, respectively (table 2). When considering totalground surface subsidence, three variables were consistentlyincluded in all high-ranking models: drainage area (increasedsubsidence with increased drainage area), disturbance age,
6

Environ. Res. Lett. 8 (2013) 025006 T J Williams et al
Figure 4. Principle components analysis of 11 hydrologic andcryotic variables measured on various linear disturbances and onundisturbed permafrost plateaus. For clarity, the site loadings havebeen divided based upon the location along the disturbance:undisturbed, windrow, and exposed disturbance. Variablesexplaining significant site variation among the first two axes aredepicted in the inset. ANOVA results indicated that location alongthe disturbances was a highly significant predictor of site scoresalong the first axis (P < 0.0001).
and disturbance type. The model with greatest support (i.e.,minimum AICc) also included the plateau length intersectedby the disturbance.
When subsidence was considered as a per cent of adjacentplateau height, the minimum AICc model included the samethree variables as mentioned above: drainage area, disturbanceage, and disturbance type, though of these variables onlydisturbance type was included in all top-ranking models(table 2). On average, winter roads subsided by 0.62± 0.06 m
Figure 5. Relationship between ground surface subsidence andpermafrost table depth (linear regression, y = 0.27x− 0.10,R2= 0.54, P < 0.0001) along linear disturbances for measurement
points on cross-sections A–H. Subsidence for locations where thepermafrost table exceeds 2 m is plotted on the right-hand side of thegraph, but is not included in the linear regression. A negative groundsurface subsidence indicates a point where the ground surface iselevated above the surface of the surrounding plateau.
(an average of 80% of plateau height), seismic lines subsidedby 0.53 ± 0.03 m (60%), and the paths by 0.09 ± 0.02 m(13%). Older disturbances show somewhat greater subsidencethan more recent disturbances when disturbance type isaccounted for (table 2).
4.3. Surface runoff processes along subsided disturbances
The variation in ground surface subsidence between differentlinear disturbances influences the topographic profile alongthese disturbances. Overall, the profiles indicated lowconnectivity between adjacent wetlands. For example, byfilling all depressions up to a 20 cm threshold, only 4 ofthe 40 topographic profiles were hydrologically connectedthroughout their entire length of disturbance, and sloped ina single direction. These properties are present in channelfens and are necessary for efficient flow conveyance. Of thesefour profiles, three of them were on the 1943 winter road, thedisturbance with the greatest amount of subsidence.
The profile along the 1985 seismic line on Plateau 1typifies those studied as it has multiple depressions and slopestowards each of its two adjacent wetlands (figure 6(a)). Thedischarge hydrograph for a single channel flowing along thewest end of the seismic line peaked immediately followingsnowmelt (figure 7). The 6 May flow velocity was notmeasured, but the water level was the same as it was on7 and 8 May, suggesting similarly high flows for all threedays. Assuming this was the case, then that three-day periodaccounted for ∼50% of the cumulative discharge measureduntil 3 June.
Following the rapid decline in discharge on 9 May wasa relatively steady period of approximately 2.5 l s−1 until16 May when discharge declined to a period of low flows(figure 7). The absence of any precipitation between 14 Mayand 1 June resulted in a continued lowering of the water levelon the seismic line and reduced discharge into the channelfen. Figure 6(b) shows that as the water table lowered and
7

Environ. Res. Lett. 8 (2013) 025006 T J Williams et al
Table 2. AIC-based rankings from best to worst for 14 multiple linear regression models predicting (A) total ground surface subsidenceand (B) ground surface subsidence as a per cent of plateau height. Rankings were based upon model probabilities (wi) and evidence ratios(Ei,j) (see Burnham and Anderson 1998 and Anderson 2008 for details). Also shown are the parameter penalty term (K), log-likelihoodvalues (LogLik), corrected AIC values (AICc) and the differences between each model and the minimum AICc model (∆i). Predictorsincluded drainage area (DA), disturbance age (1943, 1969, 1985; Age), length of the plateau that the disturbance traverses (PL), disturbancewidth (DW), the gap fraction (GF), disturbance type (cutline, winter road, path; type), and the orientation of the disturbance at themeasurement point (N–S, E–W, NW–SE, NE–SW; OR).
the spatial extent of ground surface saturation decreased, theseismic line gradually became hydrologically disconnectedfrom surface and shallow subsurface flow interaction withthe channel fen. By 28 May, the topographic depressionson the cutline continued to support standing water, althoughsurrounding higher micro-topography inhibited flow along theseismic line. On 2 June, a 17 mm event of rain and wet snowproduced an average water table rise on the seismic line of54 mm above the pre-storm level; however, this was still notenough to connect the surface pathways and initiate surfacerunoff (figure 7).
The cumulative measured snowmelt and rainfall inputby the end of May was 196 mm. When surface runoff isexpressed in terms of only the area for sub-basin I (13 955 m2)(figure 6(a)), the cumulative runoff was 215 mm. Notaccounting for the remaining outputs of water (evaporation,subsurface flow, groundwater recharge), this suggests thedrainage area of the small channel flowing over the seismicline extends well beyond sub-basin I. Expressed over theentire area of sub-basins I–IV (44 345 m2), the cumulative
runoff by the end of May represents 68 mm, or 35% ofsnowmelt and rainfall inputs.
During the peak runoff period daily discharge from theseismic line was three times the total volume of water storedabove the ground surface on the portion of the seismic linewithin sub-basin I. However, over the final eight days ofdeclining flow (20–27 May), the volume of surface runoff(84 m3) was similar to the volume of water loss fromdepression storage in sub-basin I (72 m3) suggesting asubstantial decline in the input of water to the seismic line.The sudden reductions in discharge noted in figure 7 mayrepresent hydrological disconnections between sub-basinsI, II, and IV (figure 6(a)). Once the sub-basins becamedisconnected, the declining flow drained the water storedabove the ground surface on the seismic line within sub-basinI until the declining water level prevented further stream flow.
5. Discussion
As observed for linear disturbances in continuous permafrost(Jorgenson et al 2010a), permafrost thaw beneath linear
8

Environ. Res. Lett. 8 (2013) 025006 T J Williams et al
Figure 6. (a) The contributing area for the 1985 cutline on Plateau 1 divided into five sub-basins based on analysis of a LiDAR DEM inArcGIS. Sub-basins II–IV are defined as being internally drained due to the presence of small isolated bogs. Arrows represent the potentialoutlets for each sub-basin, and the DEM is overlaying WorldView2 satellite imagery. (b) Ground surface saturation along the 1985 cutlinewithin Plateau 1, Sub-basin I as interpreted from water table measurements for six days early in the spring. The volume of water storedabove the ground surface (shaded in black) is noted for each day. Flow direction is towards the southwest where the sub-basin outlets into anadjacent channel fen.
disturbances at Scotty Creek is greatest where the soilmoisture is highest. However, unlike disturbances on thick,stable permafrost where there is an increased active layerthickness and eventual recovery to the pre-disturbance state(Jorgenson et al 2010a, Kemper and Macdonald 2009), lineardisturbances in the discontinuous permafrost zone have thepotential to completely remove permafrost and dramaticallytransform the overlying land cover type. McClymont et al(2010) observed 3–4 m of permafrost thaw along the 1969winter road at Scotty Creek. In the present study, the groundthermal regimes of the seismic lines and the abandoned winterroads were similar, with degrading permafrost that showslittle sign of regeneration. Active layer thaw dates (the timewhen summer thaw matches the previous winter freezingdepth) occurred well before the end of summer. The lackof permafrost regeneration results from a positive feedback
with ground surface subsidence and water impoundmentthat prevents the formation of the unsaturated surfacelayer required to maintain permafrost in this environment(Jorgenson et al 2010b, Kwong and Gan 1994).
Variation in permafrost thaw and subsidence alonglinear disturbances created depressions within the topographicprofiles that generally prevented the disturbances fromfunctioning to connect adjacent wetlands analogous tochannel fens. The temporal pattern of runoff from the Plateau1 seismic line suggests the possibility of ‘fill and spill’ typedrainage mechanisms (Spence and Woo 2003). In order forthe plateau to efficiently drain into the fen via the seismicline, the cumulative storage capacity of the depressions alongthe seismic line must first be overcome so that water canflow unimpeded over the ground surface. Additionally, thecontributing plateau area to this disturbance, and thus the
9

Environ. Res. Lett. 8 (2013) 025006 T J Williams et al
Figure 7. Discharge measured daily across a small channel flowing off the 1985 seismic cutline on Plateau 1 during the early spring. Asecondary vertical axis shows the daily snowmelt and rainfall inputs measured on the plateau.
volume of water input available to fill this depression storage,depends on whether the small internal bogs within the plateauare connected with the seismic line.
The fill and spill process on linear disturbances atScotty Creek is controlled by the position of the relativelyimpermeable frost table and seasonal variations in theavailability of water. Since snowmelt represents 45% of theannual precipitation (MSC 2012), the large amount of wateravailable early in the thaw period increases the likelihoodof filling depressions. Additionally, the position of the frosttable early in the thaw season promotes higher water levels.As a result, the observed seismic line functioned as aseasonally connected bog that is hydrologically connectedthrough surface pathways to the channel fen only duringperiods of high water availability early in the thaw season. Atpresent, linear disturbances do not appear to have substantiallyincreased the hydrological connectivity between adjacentwetlands. However, as permafrost continues to thaw alonglinear disturbances and more subsidence occurs, there isgreater potential for them to function similarly to channelfens and increase the drainage basin efficiency. We made nomeasurements of subsurface ground water flow in our study.This is expected to be negligible along most disturbances earlyin the thaw season due to position of the frost table near theground surface. However, the potential for subsurface flowincreases later in the summer and may also be present throughthe winter given the observed taliks. This is an area wherefuture research is required.
Despite being less of a disturbance than pipelines, theprocesses leading to the subsided, wet, and permafrost-degraded seismic lines is similar to those reported along theNorman Wells pipeline south of Fort Simpson (Smith et al2008). Given the concerns surrounding the impact of lineardisturbance density on wildlife (Dyer et al 2001, James andStuart-Smith 2000), the lack of recovery of these disturbancesfrom conventional exploration techniques provides futuremanagement challenges in the study region.
6. Management implications
Our results indicate that the spatial variation in ground thawand subsidence at Scotty Creek is dependent on the initialdegree of disturbance, the age which affects the progression ofthaw, and the morphology (size and shape) of individual peatplateaus which control the water supply to the disturbance.This suggests that best management practices for reducingthe impact of these disturbances should focus on minimizingthe degree of disturbance to the ground surface and avoidingchanges in drainage patterns. The following recommendationssuggests ways in which future exploration may accomplishthis and reduce the environmental impact:
(1) Route planning: exploration in such a discontinuouspermafrost environment should avoid areas of permafrostwhenever possible, particularly large permafrost plateausthat provide a greater supply of water to the disturbance.Given the lack of regeneration that is occurring, futureexploration in this environment could also make use ofpre-existing disturbances that have already experiencedconsiderable thaw. These disturbances may be wet withthin seasonally frozen layers and should be treated withthe same level of caution as bog and fen wetlands withregards to heavy machinery over potentially unstablesurfaces.
(2) Surface preparation: care should be taken to preventcompaction of the ground surface caused by heavymachinery and to avoid uprooting and other damage tothe soil surface. Exploration should only occur when theground is frozen and there is an adequate snow cover toprotect the ground surface. A complete removal of treesacross wide disturbances likely contributes to increasedsoil moisture near the ground surface due to decreasedevapotranspirational water loss (Vitt et al 1999), therefore,narrow disturbances and selective removal of trees, asopposed to removing all trees from the entire width ofthe cutline, would increase the likelihood for a quickregeneration of the disturbance.
10

Environ. Res. Lett. 8 (2013) 025006 T J Williams et al
(3) Brush disposal: windrows maintained permafrost directlybelow the pile of debris; however, they also act as abarrier to drainage that likely contributes to increased soilmoisture and permafrost thaw on the opposite side of thedisturbance. Care should be taken to avoid changes inthe surface topography, but if windrows are used, theyshould be restricted to the upslope side of the disturbancewhenever possible.
7. Conclusions
Linear disturbances at Scotty Creek have undergonesubstantial permafrost thaw, ground surface subsidence, andchanges in soil moisture. Disturbances that have experiencedpermafrost thaw do not appear to be in a process ofregeneration. Once permafrost thaw occurs, the groundsurface subsides, causing it to become wet and acting as apositive feedback to thaw. As long as the disturbances remainwet, summer thaw exceeds winter freezing and the blackspruce canopy is unable to regrow, altering the land cover typeand creating a wetland environment that is more typical ofbogs or fens.
Overland flow along these disturbances is largelygoverned by a fill and spill process in which there must bea sufficient water supply to fill depression storage along thedisturbance before a continuous saturated path develops atthe ground surface. Surface runoff is more likely to occur onlarger plateaus that contribute substantial volumes of waterto the disturbance, and early in the thaw season when thefrost table is near the ground surface and snowmelt supplieslarge volumes of water. Thus, it appears that many of thesedisturbances are unlike channel fens as they are seasonallyconnected to their surrounding wetlands.
Acknowledgments
We wish to acknowledge the financial support of the CanadianFoundation for Climate and Atmospheric Sciences, and theNatural Sciences and Engineering Research Council. Wealso acknowledge the logistical support provided by theNational Water Research Institute (Saskatoon) and by GerryWright and Roger Pilling of the Water Survey of Canada(Fort Simpson). The Aurora Research Institute is gratefullyacknowledged for their assistance in obtaining a researchlicence. We also wish to thank the Denedeh ResourcesCommittee, Dehcho First Nations, Fort Simpson Metis Local#52, Liidlii Kue First Nation and the Village of Fort Simpsonfor their support of this project. In particular we thankAllan Bouvier and Allen Bonnetrouge of the Liidli KueFirst Nation, and Chief Stanley Sanguez of the Jean-MarieRiver First Nation for continued support. Julian Kanigan ofAboriginal and Northern Development Canada and AaronBerg of University of Guelph are also thanked for theirinsightful comments on earlier versions of this manuscript, asare two anonymous reviewers who improved the quality ofthis paper.
References
AANDC (Aboriginal Affairs and Northern DevelopmentCanada) 2011 Northern Land Use Guidelines: NorthwestTerritories Seismic Operations vol 09a (Yellowknife:Government of the Northwest Territories)
AECOM 2009 Considerations in Developing Oil and Gas IndustryBest Practices in the North (Whitehorse: Government ofCanada)
Anderson D R 2008 Model Based Inference in the Life Sciences: APrimer on Evidence (New York: Springer)
Burgess M M and Smith S L 2000 Shallow ground temperaturesThe Physical Environment of the Mackenzie Valley, NorthwestTerritories: A Base Line for the Assessment of EnvironmentalChange ed L D Dyke and G R Brooks (Ottawa: GeologicalSurvey of Canada) pp 69–103
Burnham K P and Anderson D R 1998 Model Selection andInference: A Practical Information Theoretic Approach(New York: Springer)
Chasmer L, Quinton W, Hopkinson C, Petrone R andWhittington P 2011 Vegetation canopy and radiation controlson permafrost plateau evolution within the discontinuouspermafrost zone, Northwest Territories, Canada PermafrostPeriglac. Process. 22 199–213
Dyer S J, O’Neill J P, Wasel S M and Boutin S 2001 Avoidance ofindustrial development by woodland caribou J. Wildl. Manag.65 531–42
Geological Survey of Canada (GSC) 2002 Permafrost Thickness inCanada (retrieved on 25 May 2012 from: www.geogratis.cgdi.gc.ca)
Guan X J, Westbrook C J and Spence C 2010 Shallow soilmoisture—ground thaw interactions and controls—Part 1:spatiotemporal patterns and correlations over a subarcticlandscape Hydrol. Earth Syst. Sci. 14 1375–86
Hernandez H 1973 Natural plant recolonization of surficialdisturbances, Tuktoyaktuk Peninsula Region, NorthwestTerritories Can. J. Bot. 51 2177–96
James A R C and Stuart-Smith A K 2000 Distribution of caribouand wolves in relation to linear corridors J. Wildl. Manag.64 154–9
Jorgenson J, Hoef J and Jorgenson M 2010a Long-term recoverypatterns of arctic tundra after winter seismic exploration Ecol.Appl. 20 205–21
Jorgenson M T, Romanovsky V, Harden J, Shur Y, O’Donnell J,Schuur E A G, Kanevskiy M and Marchenko S 2010bResiliance and vulnerability of permafrost to climate changeCan. J. Forest Res. 40 1219–36
Kemper J T and Macdonald S E 2009 Directional change in uplandtundra plant communities 20–30 years after seismicexploration in the Canadian low-arctic J. Veg. Sci. 20 557–67
Kwong Y T J and Gan T Y 1994 Northward migration ofpermafrost along the Mackenzie highway and climate warmingClim. Change 26 399–419
Lee P and Boutin S 2006 Persistence and developmental transitionof wide seismic lines in the western boreal plains of CanadaJ. Environ. Manag. 78 240–50
Machtans C S 2006 Songbird response to seismic lines in thewestern boreal forest: a manipulative experiment Can. J. Zool.84 1421–30
McClymont A F, Bentley L R, Hayashi M, Christensen B andQuinton W L 2010 Geophysical imaging of discontinuouspermafrost in northwest Canada Near Surface 2010—16thEuropean Meeting of Environmental and EngineeringGeophysics (Zurich, Sept. 2010)
Meteorological Service of Canada (MSC) 2012 National ClimateData Archive of Canada (retrieved from: www.climate.weatheroffice.gc.ca)
11

Environ. Res. Lett. 8 (2013) 025006 T J Williams et al
Quinton W L, Hayashi M and Chasmer L E 2011Permafrost-thaw-induced land-cover change in the Canadiansubarctic: implications for water resources Hydrol. Process.25 152–8
Quinton W L, Hayashi M and Pietroniro A 2003 Connectivity andstorage functions of channel fens and flat bogs in northernbasins Hydrol. Process. 17 3665–84
Raynolds M K and Felix N A 1989 Airphoto analysis of winterseismic disturbance in Northeastern Alaska Arctic 42 362–7
Revel R D, Dougherty T D and Downing D J 1984 Forest Growthand Revegetation Along Seismic Lines (Calgary: University ofCalgary Press)
Smith S L, Burgess M M and Riseborough D W 2008 Groundtemperature and thaw settlement in frozen peatlands along theNorman Wells pipeline corridor, NWT Canada: 22 years ofmonitoring Proc. 9th Int. Conf. on Permafrost (Fairbanks,Alaska, 29 June–3 July 2008) vol 2, ed D L Kane and
K M Hinkel (Fairbanks, AK: Institute of NorthernEngineering, University of Alaska Fairbanks) pp 1665–70
Spence C and Woo M 2003 Hydrology of subarctic Canadianshield: soil-filled valleys J. Hydrol. 279 151–66
Turetsky M R and St Louis V 2006 Disturbance in boreal peatlandsBoreal Peatland Ecosystems ed R K Wieder andD H Vitt (Berlin: Springer) pp 359–79
Vitt D H, Halsey L A and Zoltai S C 1999 The changing landscapeof Canada’s western boreal forest: the current dynamics ofpermafrost Can. J. For. Res. 30 283–7
Woo M K 1986 Permafrost hydrology in North America Atmos.Ocean 24 201–34
Wright N, Hayashi M and Quinton W L 2009 Spatial and temporalvariations in active layer thawing and their implication onrunoff generation in peat-covered permafrost terrain WaterResour. Res. 45 W05414
12