Linear, bilinear, and linearLinear, bilinear, and linear-bilinear Linear, … · 2018-11-19 ·...
43
CIMMYT® Linear, bilinear, and linear-bilinear models for analyzing G×E in plant breeding and agronomy research Linear, bilinear, and linear Linear, bilinear, and linear - - bilinear bilinear models for analyzing G models for analyzing G × × E in plant breeding E in plant breeding and agronomy research and agronomy research Jose Crossa Biometrics and Statistics Unit International Maize and Wheat Improvement Center (CIMMYT) Apdo. Postal 6-641, 06600 Mexico DF, Mexico. [email protected] Jose Crossa Jose Crossa Biometrics and Statistics Unit Biometrics and Statistics Unit International Maize and Wheat Improvement Center International Maize and Wheat Improvement Center (CIMMYT) (CIMMYT) Apdo. Postal 6 Apdo. Postal 6 - - 641, 06600 641, 06600 Mexico Mexico DF, DF, Mexico Mexico . . [email protected] [email protected]
Transcript of Linear, bilinear, and linearLinear, bilinear, and linear-bilinear Linear, … · 2018-11-19 ·...

CIMMYT®
Linear, bilinear, and linear-bilinear models for analyzing G×E in plant breeding
and agronomy research
Linear, bilinear, and linearLinear, bilinear, and linear--bilinear bilinear models for analyzing Gmodels for analyzing G××E in plant breedingE in plant breeding
and agronomy researchand agronomy research
Jose CrossaBiometrics and Statistics Unit
International Maize and Wheat Improvement Center (CIMMYT)
Apdo. Postal 6-641, 06600 Mexico DF, Mexico.
Jose CrossaJose CrossaBiometrics and Statistics Unit Biometrics and Statistics Unit
International Maize and Wheat Improvement CenterInternational Maize and Wheat Improvement Center (CIMMYT) (CIMMYT)
Apdo. Postal 6Apdo. Postal 6--641, 06600 641, 06600 MexicoMexico DF, DF, MexicoMexico..
[email protected]@CGIAR.ORG

The response of the ith genotype in the jth environment is
This model isUnparsimonious each G×E cell has its owninteraction parameterUninformative the independent interaction parameters are difficult to interpret.
The response of the The response of the iithth genotype in the genotype in the jjthth environment environment isis
This model isThis model isUnparsimoniousUnparsimonious each Geach G××E cell has its ownE cell has its owninteraction parameterinteraction parameterUninformativeUninformative the independent interaction the independent interaction parameters are difficult to interpret.parameters are difficult to interpret.
ijεijδ)(τjδiτμijy ++++= ijεijδ)(τjδiτμijy ++++=
Basic ANOVA model

History of linear-bilinear models for assessing GxE
History of linearHistory of linear--bilinear models for bilinear models for assessing assessing GxEGxE
Yates and Cochran (1938)
Tukey (1949) proposed testing K=0 in the model
Williams (1952) considers where λ is the
largest singular value of ZZ′and Z′Z (Z= ) and αi and γj are the eigenvectors
Mandel (1961) generalized Tukey’s model
for genotypes or
for environments.
Yates and Cochran (1938) Yates and Cochran (1938)
TukeyTukey (1949) proposed testing K=0 in the model (1949) proposed testing K=0 in the model
Williams (1952) considers Williams (1952) considers where where λλ is the is the
largest singular value of largest singular value of ZZZZ′′andand ZZ′′ZZ ((Z= )Z= ) and and ααii and and γγj j are the eigenvectorsare the eigenvectors
Mandel (1961) generalized Mandel (1961) generalized TukeyTukey’’ss modelmodel
for genotypes orfor genotypes or
for environments.for environments.
jδiξijδ)(τ = jδiξijδ)(τ =
jδiKτijδ)(τ = jδiKτijδ)(τ =
ijεjγiλαiτμijy +++= ijεjγiλαiτμijy +++=
jδ
iλα
ijδ) (τ = j
δi
λαij
δ) (τ =
jiλ
ijδ) (τ γτ= ji
λij
δ) (τ γτ=
i.y-ijy

Gollob (1968) and Mandel (1969, 1971) extended Williams’ (1952) work such that
Gabriel (1978) described the least squares fit of the G×E term
Zobel et al. (1988) and Gauch (1988) called AMMI
GollobGollob (1968) and Mandel (1969, 1971) extended (1968) and Mandel (1969, 1971) extended WilliamsWilliams’’ (1952) work such that (1952) work such that
Gabriel (1978) described the least squares fit of the Gabriel (1978) described the least squares fit of the GG××E term E term
ZobelZobel et al. (1988) and et al. (1988) and GauchGauch (1988) called AMMI(1988) called AMMI
jkγt1k ikαkλijδ) (τ ∑ == jkγt1k ikαkλijδ) (τ ∑ ==
t1k ijεjkγik αk λ jδiτμijy ∑ = ++++= t1k ijεjkγik αk λ jδiτμijy ∑ = ++++=
..y.jyi.yijyijz +−−= ..y.jyi.yijyijz +−−=

Other classes of linear-bilinear models (Cornelius et al., 1996)
Genotypes Regression Model (GREG)
Sites Regression Model (SREG)
Completely Multiplicative Model (COMM)
Shifted Multiplicative Model (SHMM)
The SHMM model is used for identifying subsets of genotypes or environments with negligible COI.
The SREG model has been used in preference to SHMM for grouping environments without genotypic rank change.
Other classes of linearOther classes of linear--bilinear models (Cornelius et al., 1996)bilinear models (Cornelius et al., 1996)
Genotypes Regression Model (Genotypes Regression Model (GREGGREG) )
Sites Regression Model (Sites Regression Model (SREGSREG))
Completely Multiplicative Model (Completely Multiplicative Model (COMMCOMM) )
Shifted Multiplicative Model (Shifted Multiplicative Model (SHMMSHMM) )
The SHMM model is used for identifying subsets of genotypes or The SHMM model is used for identifying subsets of genotypes or environments with negligible COI.environments with negligible COI.
The SREG model has been used in preference to SHMM for grouping The SREG model has been used in preference to SHMM for grouping environments without genotypic rank change.environments without genotypic rank change.
,t1k ijεjkγik αk λ iμijy ∑ = ++= ,t1k ijεjkγik αk λ iμijy ∑ = ++=
,t1k ijεjkγik αk λ jμijy ∑ = ++= ,t1k ijεjkγik αk λ jμijy ∑ = ++=
t1k ijεjkγik αk λ ijy ∑ = += t1k ijεjkγik αk λ ijy ∑ = +=
.t1k ijεjkγik αk λ βijy ∑ = ++= .t1k ijεjkγik αk λ βijy ∑ = ++=

Linear ModelFactorial regression (FR) Model
Linear ModelLinear ModelFactorial regression (FR) ModelFactorial regression (FR) Model
ObjectiveTo replace, in the G×E subspace, the genotypic and environmental factors by a small number of genotypic and environmental covariables (Denis, 1988; van Eeuwijk et al., 1996).
The FR models are ordinary linear models that approximate the G×E effects by the products of one or more of (1) genotypic covariables (observed) × environmental potentialities
(estimated), (2) genotypic sensitivities (estimated) × environmental covariables
(observed),
ObjectiveObjectiveTo replace, in the GTo replace, in the G××E subspace, the genotypic and E subspace, the genotypic and environmental factors by a small number of genotypic and environmental factors by a small number of genotypic and environmental environmental covariablescovariables (Denis, 1988; van Eeuwijk et al., 1996).(Denis, 1988; van Eeuwijk et al., 1996).
The FR models are ordinary linear models that approximate the GThe FR models are ordinary linear models that approximate the G××E E effects by the products of one or more of effects by the products of one or more of (1)(1) genotypic genotypic covariablescovariables (observed) (observed) ×× environmental potentialities environmental potentialities
(estimated), (estimated), (2)(2) genotypic sensitivities (estimated) genotypic sensitivities (estimated) ×× environmental environmental covariablescovariables
(observed), (observed),

Factorial regression ModelENVIRONMENTAL COVARIABLES
For h=1,…,H enviromental covariables (centered),
represents regression coefficient with respect to the enviromental covariable
Factorial regression ModelFactorial regression ModelENVIRONMENTAL COVARIABLESENVIRONMENTAL COVARIABLES
For For hh=1,=1,……,,HH enviromentalenviromental covariablescovariables (centered), (centered),
represents regression coefficient with respect to the represents regression coefficient with respect to the enviromentalenviromental covariablecovariable
)1(, jHz,..., j1z −≤ JH )1(, jHz,..., j1z −≤ JH
ijε H
1h jhzihςjδiτμijy +∑ =+++= ijε H
1h jhzihςjδiτμijy +∑ =+++=
ihςihς
hjzhjz
Sum to zero constraints on the parameters are
∑ ∑ ∑ ===i j i
0ihςjδiτ
In matrix notation, the expectation is E(Y)=μ1I1′J + τ1′J + 1Iδ′ + ζZ′

Factorial regression ModelGENOTYPIC COVARIABLES
For k=1,…,G genotypic covariables (centered),
represents regression coefficient with respect to the genotypic covariable
Factorial regression ModelFactorial regression ModelGENOTYPIC COVARIABLESGENOTYPIC COVARIABLES
For For kk=1,=1,……,,GG genotypic genotypic covariablescovariables (centered), (centered),
represents regression coefficient with respect to the genotrepresents regression coefficient with respect to the genotypic ypic covariablecovariable
)1(, igx,..., i1x −≤ IG )1(, igx,..., i1x −≤ IG
ijε G
1g jgξigxjδiτμijy +∑ =+++= ijε G
1g jgξigxjδiτμijy +∑ =+++=
jgξjgξ igxigx
Constraints on the parameters are ∑ ∑ ∑ ===i j i
0ihξjδiτ
In matrix notation, the expectation is E(Y)=μ1I1′J + τ1′J + 1Iδ′ + XΞ′

Factorial regression ModelGENOTYPIC AND ENVIRONMENTAL COVARIABLES
For k=1,…,G genotypic covariables (centered),
where is a constant that scales the cross-product of the genotypic covariables
with the environmental covariables
or
Factorial regression ModelFactorial regression ModelGENOTYPIC AND ENVIRONMENTAL COVARIABLESGENOTYPIC AND ENVIRONMENTAL COVARIABLES
For For kk=1,=1,……,,GG genotypic genotypic covariablescovariables (centered), (centered),
where is a constant that scales the crosswhere is a constant that scales the cross--product of the genotypic product of the genotypic covariablescovariables
with the environmental with the environmental covariablescovariables
or or
)1(, igx,..., i1x −≤ IG )1(, igx,..., i1x −≤ IG
ijεH
1h jhzghνigxG1g H
1h jhzihς G1g jgξigxjδiτμijy +∑ =∑ =+∑ =+∑ =+++= ijε
H1h jhzghνigxG
1g H1h jhzihς G
1g jgξigxjδiτμijy +∑ =∑ =+∑ =+∑ =+++=
hZhZ
kxkx
Constraints on the parameters are jhz
ghνjgξ =
In matrix notation, the expectation is E(Y)=μ1I1′J+τ1′J+1Iδ′+XνZ+XΞ′+ζZ′
where the constraint XΞ′+ζZ′=0 is required (0 is a matrix H×G of zeros)
ghν
ghν
ihxihς =

Problems with Factorial RegressionProblems with Factorial RegressionProblems with Factorial RegressionWhen environmental (or genotypic) covariables show high collinearity, interpretation of the least squares regression coefficients is complicated because they are estimated very imprecisely.
Noise on the response variable also complicates the interpretation of the FR parameters.
Least squares estimation of the parameters in the FR models are not unique when the number of covariables is larger than the number of observations (p>>>n)
SOLUTIONConsequently, a stepwise procedure for choice of the covariables to include could be useful for model construction. An alternative estimation method is needed. Partial Least Squares (PLS) regression overcomes some of these problems and it can be used as an alternative estimation method.
When environmental (or genotypic) When environmental (or genotypic) covariablescovariables show show high high collinearitycollinearity, interpretation of the least squares regression coefficients , interpretation of the least squares regression coefficients is complicated because they are estimated very imprecisely. is complicated because they are estimated very imprecisely.
Noise on the response variable also complicates the interpretatiNoise on the response variable also complicates the interpretation of the on of the FR parameters.FR parameters.
LLeast squares estimation of the parameters in the FR models are neast squares estimation of the parameters in the FR models are not ot unique when the number of unique when the number of covariablescovariables is larger than the number of is larger than the number of observations (p>>>n) observations (p>>>n)
SOLUTIONSOLUTIONConsequently, a stepwise procedure for choice of the Consequently, a stepwise procedure for choice of the covariablescovariables to to include could be useful for model construction. An alternative include could be useful for model construction. An alternative estimation method is needed. Partial Least Squares (PLS) regressestimation method is needed. Partial Least Squares (PLS) regression ion overcomes some of these problems and it can be used as an alternovercomes some of these problems and it can be used as an alternative ative estimation method.estimation method.

Bilinear ModelPartial Least Squares (PLS)Bilinear ModelBilinear Model
Partial Least Squares (PLS)Partial Least Squares (PLS)
Multivariate Partial Least Squares (PLS) regression models (Aastveit andMartens, 1986; Helland, 1988) are a special class of bilinear models.
When genotypic responses over environments (Y) are modeled using environmental covariables, then the J×H matrix Z of H (h=1,2,…,H) environmental covariables can be written in a bilinear form as
Z=t1p1′+t2p2 ′+…+tMp′M+EM=TP′+E
T contains the tj J×1 vectors called latent environmental covariablesor Z-scores (indexed by environments)
P has the p1…pH H×1 vectors called Z-loadings (indexed by environmental variables) and E has the residuals.
where

Similarly, the response variable matrix Y in bilinear form is
Y=t1q′1+t2q′2+…+tMq′M+FM = TQ′+Fwhere
The matrix Q contains the q1…qI vectors called Y-loadings(indexed by genotypes) and F has the residuals.
The relationship between Y and Z is transmitted through the latent variable T.
Similarly, the response variable matrix Similarly, the response variable matrix Y Y in bilinear form isin bilinear form is
YY==tt11qq′′11+t+t22qq′′22++……++ttMMqq′′MM+F+FM M = TQ= TQ′′++FFwherewhere
The matrix The matrix QQ contains the contains the qq11……qqII vectors called vectors called YY--loadingsloadings(indexed by genotypes) and (indexed by genotypes) and FF has the residuals. has the residuals.
The relationship between The relationship between YY and and ZZ is transmitted through the is transmitted through the latent variablelatent variable TT. .

The PLS algorithm performs separate (but simultaneous) principal component analysis of Z and of Y that allows reduction of the number of variables in each system to a smaller number of hopefully more interpretable latent
variables.
The PLS algorithm performs separate The PLS algorithm performs separate (but simultaneous) principal component (but simultaneous) principal component analysis of analysis of ZZ and of and of YY that allows that allows reduction of the number of variables in reduction of the number of variables in each system to a smaller number of each system to a smaller number of hopefully more interpretable latent hopefully more interpretable latent
variables.variables.

Helland (1988) showed that a reduced number of PLS latent variables gives a low rank representation of the least squares estimates of the FR with environmental covariables because the expectation of Y′ is
E(Y′)=QT′=Q(ZW)′=(QW′)Z′=ζZ′= ∑ =H
1h jhzihς
W is H×1 and contains the Z-loadings (or weights) of the environmental covariables; ζ contains the PLS approximation to the regression coefficients of the responses in Y to the environmental covariables in Z.
PLS with environmental covariables

PLS Biplot with environmental covariables
Matrices
T (with J coordinates for environments),
Q (with I coordinates for genotypes) and
W (with H coordinates for environmental covariables)
can be represented in the PLS biplot such that projecting
the jth environment (row) of T on the ith genotype (row) of Q [Y′=(TQ′)′] approximates the G×E; projecting the hth environmental covariable (row) of W on the ithgenotype (row) of Q (QW′=ζ) approximates the regression coefficient of the ith genotype on the hth environmental covariable

PLS with genotypic covariables
When genotypic covariables are used to model environmentaresponses over genotypes, then the latent genotypic covariables are T=XW where vector W is G×1 and contains the weights of the genotypic covariables.
The expectation of Y isE(Y)=TQ′=XWQ′= XΞ′= ∑ =
G1g jg
ξig
x
Ξ contains the PLS approximation to the regression coefficients of the responses in Y to the genotypic covariables in X

Matrices T (with I coordinates for genotypes),
Q (with J coordinates for environments) and
W (with G coordinates for genotypic covariables)
can be represented in a PLS biplot such that projection
of the ith genotype (row) of T onto the jth environment (row) of Q (Y=TQ′) approximates the G×E; of the gth genotypic covariable (row) of W onto the jth environment (row) of Q (WQ′=Ξ) approximates the regression coefficient of the jthenvironment on the gth genotypic covariable.
Matrices Matrices T T (with (with II coordinates for genotypes), coordinates for genotypes),
QQ (with (with JJ coordinates for environments) and coordinates for environments) and
WW (with (with GG coordinates for genotypic coordinates for genotypic covariablescovariables) )
can be represented in a PLS can be represented in a PLS biplotbiplot such that projectionsuch that projection
of the of the ithith genotype (row) of genotype (row) of TT onto the onto the jthjth environment (row) of environment (row) of QQ ((YY==TQTQ′′) ) approximates the Gapproximates the G××E; E; of the of the gthgth genotypic genotypic covariablecovariable (row) of (row) of WW onto the onto the jthjth environment (row) environment (row) of of QQ ((WQWQ′′==ΞΞ) approximates the regression coefficient of the ) approximates the regression coefficient of the jthjthenvironment on the environment on the gthgth genotypic genotypic covariablecovariable..
PLS with genotypic covariables

APPLICATIONS OF FACTORIAL REGRESSION
AND PARTIAL LEAST SQUARES IN AGRONOMY
RESEARCH
APPLICATIONS OF APPLICATIONS OF FACTORIAL REGRESSION FACTORIAL REGRESSION
AND PARTIAL LEAST AND PARTIAL LEAST SQUARES IN AGRONOMY SQUARES IN AGRONOMY
RESEARCHRESEARCH

Treatment × environment interaction analysis in agronomy
Treatment Treatment ×× environment environment interaction analysis in agronomyinteraction analysis in agronomy
24 agronomic treatments evaluated during 10 consecutive years.
Objectives (1) To investigate the factorial structure of the treatments
to reduce the number of treatment terms in the interaction,
(2) To use quantitative year covariables to replace the qualitative variable year and use multiple factorial regression (MFR)with a stepwise variable selection procedure for finding themost relevant environmental covariables.
Results of the final MFR were compared with those of PLS based analysis to achieve extra insight in both the T×E and the final MFR model.
24 agronomic treatments evaluated during 10 consecutive years.24 agronomic treatments evaluated during 10 consecutive years.
Objectives Objectives (1)(1) To investigate the factorial structure of the treatments To investigate the factorial structure of the treatments
to reduce the number of treatment terms in the interato reduce the number of treatment terms in the interaction, ction,
(2)(2) To use quantitative year To use quantitative year covariablescovariables to replace the qualitative to replace the qualitative variable year and use multiple factorial regression (variable year and use multiple factorial regression (MFR)MFR)with a stepwise variable selection procedure for findwith a stepwise variable selection procedure for finding theing themost relevant environmental most relevant environmental covariablescovariables. .
Results of the final MFR were compared with those of PLS based aResults of the final MFR were compared with those of PLS based analysis nalysis to achieve extra insight in both the Tto achieve extra insight in both the T××E and the final MFR model. E and the final MFR model.

Table 2. Factorial regression model including only the six highly significantinteraction terms and the variables found by stepwise for each factorial effect.Table 2. Factorial regression model includingTable 2. Factorial regression model including onlyonly thethe sixsix highlyhighly significantsignificantinteractioninteraction termsterms and the variables found by stepwise for each factorial effect.and the variables found by stepwise for each factorial effect.
Sum of Squares Mean SquaresSource df (× 106) (× 105) Prob
Sum of Squares Sum of Squares Mean SquaresMean SquaresSourceSource dfdf ((×× 101066)) ((×× 101055)) ProbProbTreatment 23 773.970 336.508 0.0001Year 9 373.260 414.733 0.0001Year×treatment 207 279.520 13.503 0.0001
Year×tillage 9 21.070 23.410 0.0001EVD×tillage 1 14.290 142.900 0.0001Deviations 8 6.780 8.480 0.0001
Year×summer crop 9 8.729 9.699 0.0001EVA×sum crop 1 3.152 31.500 0.0001Deviations 8 5.577 6.971 0.0001
Year×manure 9 37.556 41.730 0.0001PRD×manure 1 16.170 161.700 0.0001SHF×manure 1 4.756 47.560 0.0001Deviations 7 16.630 23.750 0.0001
Year×N 18 126.900 70.500 0.0001mTF×N 2 61.360 306.800 0.0001mTJ×N 2 20.840 104.200 0.0001MTA×N 2 25.580 127.900 0.0001mTM×N 2 11.790 58.950 0.0001Deviations 10 7.330 7.330 0.0009
Year×sum crop×N 18 18.325 10.180 0.0001MTF×sum crop×N 2 8.487 42.430 0.0001Deviations 16 9.838 6.149 0.0008
Year×manure×N 18 31.366 17.430 0.0001mTUM×manure×N 2 19.050 95.250 0.0001SHJ×manure×N 2 5.457 27.290 0.0001Deviations 14 6.859 4.899 0.0141
Error 460 110.870 2.410
TreatmentTreatment 2323 773.970773.970 336.508336.508 0.00010.0001YearYear 99 373.260373.260 414.733414.733 0.00010.0001YearYear××treatmenttreatment 207207 279.520279.520 13.50313.503 0.00010.0001
YearYear××tillagetillage 99 21.07021.070 23.41023.410 0.00010.0001EVDEVD××tillagetillage 11 14.29014.290 142.900142.900 0.0000.00011DeviationsDeviations 88 6.7806.780 8.4808.480 0.00010.0001
YearYear××summer cropsummer crop 99 8.7298.729 9.6999.699 0.00010.0001EVAEVA××sum cropsum crop 11 3.1523.152 31.50031.500 0.00010.0001DeviationsDeviations 88 5.5775.577 6.9716.971 0.00010.0001
YearYear××manuremanure 99 37.55637.556 41.73041.730 0.00010.0001PRDPRD××manuremanure 11 16.17016.170 161.700161.700 0.00010.0001SHFSHF××manuremanure 11 4.7564.756 47.56047.560 0.00010.0001DeviationsDeviations 77 16.63016.630 23.75023.750 0.00010.0001
YearYear××NN 1818 126.900126.900 70.50070.500 0.00010.0001mTFmTF××NN 22 61.36061.360 306.800306.800 0.00010.0001mTJmTJ××NN 22 20.84020.840 104.200104.200 0.00010.0001MTAMTA××NN 22 25.58025.580 127.900127.900 0.00010.0001mTMmTM××NN 22 11.79011.790 58.95058.950 0.00010.0001DeviationsDeviations 1010 7.3307.330 7.3307.330 0.00090.0009
YearYear××sum cropsum crop××NN 1818 18.32518.325 10.18010.180 0.00010.0001MTFMTF××sum cropsum crop××NN 22 8.4878.487 42.43042.430 0.00010.0001DeviationsDeviations 1616 9.8389.838 6.1496.149 0.00080.0008
YearYear××manuremanure××NN 1818 31.36631.366 17.43017.430 0.00010.0001mTUMmTUM××manuremanure××NN 22 19.05019.050 95.25095.250 0.00010.0001SHJSHJ××manuremanure××NN 22 5.4575.457 27.29027.290 0.00010.0001DeviationsDeviations 1414 6.8596.859 4.8994.899 0.01410.0141
ErrorError 460460 110.870110.870 2.4102.410

Figure 3. Figure 3. BiplotBiplot of the first and second PLS factors representing the of the first and second PLS factors representing the ZZ--scoresscores of the 10 years (1988of the 10 years (1988--97), and the 97), and the YY--loadingsloadings of the 24 practice treatments (1of the 24 practice treatments (1--24) enriched with the 24) enriched with the ZZ--loadingsloadings of 27 environmental variables: EV: total of 27 environmental variables: EV: total monthly evaporation, PR: total monthly precipitation, SH: sun homonthly evaporation, PR: total monthly precipitation, SH: sun hours per day, urs per day, mTmT: mean minimum temperature : mean minimum temperature sheltered, MT: mean maximum temperature sheltered, sheltered, MT: mean maximum temperature sheltered, mTUmTU: mean minimum temperature unsheltered; : mean minimum temperature unsheltered; D: December, J: January, F: February, M: March, A: April; N: NitD: December, J: January, F: February, M: March, A: April; N: Nitrogen (from Vargas et al., 2001). rogen (from Vargas et al., 2001).
62
16
5
7 4 38
1
109
17
11
1923
12
18
1.01.01.0
0.60.60.6
0.20.20.2
-0.2--0.20.2
-0.6--0.60.6
-1.0--1.01.0
-1.0--1.01.0 -0.6--0.60.6 -0.2--0.20.2 0.20.20.2 0.60.60.6 1.01.01.0
PLS
2P
LS 2
PLS
2
mTUFMTA
mTF
21
MTF
EVA
MTJ SHJEVM
SHDMTM EVF
EVJ
PRDmTUM
PRE mTUD
mTM
1993mTD
1992
2414 PRJ
PRM
mTUJmTJ
199413
2022
mTUA15 1990
1997
mTA
MTDEVD
1988
19961995
1991
198919891989
PLS 1PLS 1PLS 1

Genotype x environment interaction for zinc and iron concentration of wheat grain in eastern Gangetic Plains of South Asia
20 elite CIMMYT wheat lines were evaluated in a multilocation trial in the Eastern Gangetic Plains (EGP) of India to determine GE for agronomic and nutrient traits.
Grain yield was available for 14 environments, while zinc and iron concentration of grains for 10 environments.
Soil and climatic data of each of the locations were also used
Genotype x environment interaction for zinc Genotype x environment interaction for zinc and iron concentration of wheat grain in and iron concentration of wheat grain in eastern eastern GangeticGangetic Plains of South AsiaPlains of South Asia
2020 elite CIMMYT wheat lines were evaluated in a elite CIMMYT wheat lines were evaluated in a multilocationmultilocation trial in the Eastern trial in the Eastern GangeticGangetic Plains Plains (EGP) of India to determine GE for agronomic and (EGP) of India to determine GE for agronomic and nutrient traits. nutrient traits.
Grain yield was available for 14 environments, while Grain yield was available for 14 environments, while zinc and iron concentration of grains for 10 zinc and iron concentration of grains for 10 environments. environments.
Soil and climatic data of each of the locations were Soil and climatic data of each of the locations were also used also used

Environmental variablesEnvironmental variablesEnvironmental variablesTMXBF =Temperature maximum before flowering; TMXAF = Temperature maximum after flowering; TMNBF = Temperature minimum before flowering; TMNAF = Temperature minimum after flowering; RHBF = Relative humidity before flowering; RHAF = Relative humidity after flowering; RBF = Rainfall before flowering (RBF); RAF = Rainfall after flowering (RAF).
TMXBF =Temperature maximum before flowering; TMXBF =Temperature maximum before flowering; TMXAF = Temperature maximum after flowering; TMXAF = Temperature maximum after flowering; TMNBF = Temperature minimum before flowering; TMNBF = Temperature minimum before flowering; TMNAF = Temperature minimum after flowering; TMNAF = Temperature minimum after flowering; RHBF = Relative humidity before flowering; RHBF = Relative humidity before flowering; RHAF = Relative humidity after flowering; RHAF = Relative humidity after flowering; RBF = Rainfall before flowering (RBF); RBF = Rainfall before flowering (RBF); RAF = Rainfall after flowering (RAF).RAF = Rainfall after flowering (RAF).
Zn_30 = Zinc concentration in 0Zn_30 = Zinc concentration in 0--30 cm soil depth; 30 cm soil depth; Zn_60 = Zinc concentration in 30Zn_60 = Zinc concentration in 30--60 cm soil depth; 60 cm soil depth; Fe_30 = Iron concentration in 0Fe_30 = Iron concentration in 0--30 cm soil depth; 30 cm soil depth; Fe_60 = Iron concentration in 30Fe_60 = Iron concentration in 30--60 cm soil depth.60 cm soil depth.
Soil variablesSoil variablesSoil variables

82.41% contribution of 5 variables
10.54495.65Zn_30
12.85604.58TMNBF
13.90653.90RFAF
15.98751.67Zn_60
29.111369.06TMNAF
Zn concentration in the grain
59.46% contribution of 4 variables
9.85463.93RHAF
13.69644.89Zn_60
13.69644.96RFAF
22.211045.64TMXBF
Fe concentration in the grain
60.26% contribution of 6 variables
7.674522150Fe_30
9.135386681RHBF
11.947038254TMNBF
12.427323023TMXAF
13.017671294RHAF
Grain yield
% variation explainedSSVariable
Proportion of variation accounted from Factorial Regression Analysis for each of the significant covariablesfor grain yield, grain iron and zinc concentration

PLS Biplot of number of locations and years with environmental and soil covariables on the performance of grain yield, Fe, and Zn in environments
in eastern Gangetic plains of south Asia
Significant variables are given in bold letters
Bhur5= site Bhurkura for year 5; Ghur 5 = Ghurahoopur for year 5; Bhad5 = siteBhadawal for year 5; Bhagwanpur5 = site Bhagwanpur for year 5; Mau5 = site Mauparasi for year 5; BHU5 = site Banaras Hindu University for year 5; Bhur6 = site Bhurkura for year 6; Mau6 = site Mauparasi for year 6; BHU6 = site Banaras Hindu University for year 6; Pidk6 = site Pidkhir for year 6; Bhur7 = site Bhurkura for year 7; Ghur7 = Ghurahoopur for year 7; Pidk7 = site Pidkhirfor year 7; BHU7 = site Banaras Hindu University for year 7.
TMXBF=Temperature maximum before flowering; TMXAF = Temperature maximum after flowering; TMNBF = Temperature minimum before flowering; TMNAF = Temperature minimum after flowering; RHBF = Relative humidity before flowering; RHAF = Relative humidity after flowering; RBF = Rainfall before flowering (RBF); RAF = Rainfall after flowering (RAF).
Zn_30 = Zinc concentration in 0-30 cm soil depth; Zn_60 = Zinc concentration in 30-60 cm soil depth; Fe_30 = Iron concentration in 0-30 cm soil depth; Fe_60= Iron concentration in 30-60 cm soil depth.
PLS PLS BiplotBiplot of number of locations and years with environmental and soil of number of locations and years with environmental and soil covariablescovariables on the performance of grain yield, Fe, and Zn in environments on the performance of grain yield, Fe, and Zn in environments
in eastern in eastern GangeticGangetic plains of south Asiaplains of south Asia
Significant variables are given in bold lettersSignificant variables are given in bold letters
Bhur5= site Bhur5= site BhurkuraBhurkura for year 5; for year 5; GhurGhur 5 = 5 = GhurahoopurGhurahoopur for year 5; Bhad5 = sitefor year 5; Bhad5 = siteBhadawalBhadawal for year 5; Bhagwanpur5 = site for year 5; Bhagwanpur5 = site BhagwanpurBhagwanpur for year 5; Mau5 = site for year 5; Mau5 = site MauparasiMauparasi for year 5; BHU5 = site Banaras Hindu University for year 5; Bhfor year 5; BHU5 = site Banaras Hindu University for year 5; Bhur6 ur6 = site = site BhurkuraBhurkura for year 6; Mau6 = site for year 6; Mau6 = site MauparasiMauparasi for year 6; BHU6 = site for year 6; BHU6 = site Banaras Hindu University for year 6; Pidk6 = site Banaras Hindu University for year 6; Pidk6 = site PidkhirPidkhir for year 6; Bhur7 = for year 6; Bhur7 = site site BhurkuraBhurkura for year 7; Ghur7 = for year 7; Ghur7 = GhurahoopurGhurahoopur for year 7; Pidk7 = site for year 7; Pidk7 = site PidkhirPidkhirfor year 7; BHU7 = site Banaras Hindu University for year 7.for year 7; BHU7 = site Banaras Hindu University for year 7.
TMXBF=Temperature maximum before flowering; TMXAF = Temperature TMXBF=Temperature maximum before flowering; TMXAF = Temperature maximum after flowering; TMNBF = Temperature minimum before flowmaximum after flowering; TMNBF = Temperature minimum before flowering; ering; TMNAF = Temperature minimum after flowering; RHBF = Relative humTMNAF = Temperature minimum after flowering; RHBF = Relative humidity idity before flowering; RHAF = Relative humidity after flowering; RBF before flowering; RHAF = Relative humidity after flowering; RBF = Rainfall = Rainfall before flowering (RBF); RAF = Rainfall after flowering (RAF).before flowering (RBF); RAF = Rainfall after flowering (RAF).
Zn_30 = Zinc concentration in 0Zn_30 = Zinc concentration in 0--30 cm soil depth; Zn_60 = Zinc concentration 30 cm soil depth; Zn_60 = Zinc concentration in 30in 30--60 cm soil depth; Fe_30 = Iron concentration in 060 cm soil depth; Fe_30 = Iron concentration in 0--30 cm soil depth; Fe_6030 cm soil depth; Fe_60= Iron concentration in 30= Iron concentration in 30--60 cm soil depth.60 cm soil depth.


STRUCTURAL EQUATION MODELING (SEM) FOR STUDYING
GENOTYPE×ENVIRONMENT
STRUCTURAL EQUATION MODELING STRUCTURAL EQUATION MODELING (SEM) FOR STUDYING (SEM) FOR STUDYING
GENOTYPEGENOTYPE××ENVIRONMENTENVIRONMENT
Development of YIELD consists of a sequence of processes
Single equation approaches (Factorial Regression or Partial Least Square) are not adequate to incorporate underlying sequential nature of development
Development of YIELD consists of a sequence Development of YIELD consists of a sequence of processesof processes
Single equation approaches (Single equation approaches (Factorial Factorial RegressionRegression or or Partial Least SquarePartial Least Square) are not ) are not adequate to incorporate underlying sequential adequate to incorporate underlying sequential nature of developmentnature of development
ProblemsProblemsProblems

ExampleExampleExample
Exogenous Endogenous Endogenous(independent) (intermediate) (dependent)
Genotype Spikes m2
Environment grains per spike Yield
Marker*weather cov Kernel weight
Trait*weather cov
ExogenousExogenous EndogenousEndogenous EndogenousEndogenous(independent) (intermediate) ((independent) (intermediate) (dependent)dependent)
GenotypeGenotype Spikes m2Spikes m2
EnvironmentEnvironment grains per spikegrains per spike YieldYield
Marker*weather Marker*weather covcov Kernel weightKernel weight
Trait*weather Trait*weather covcov
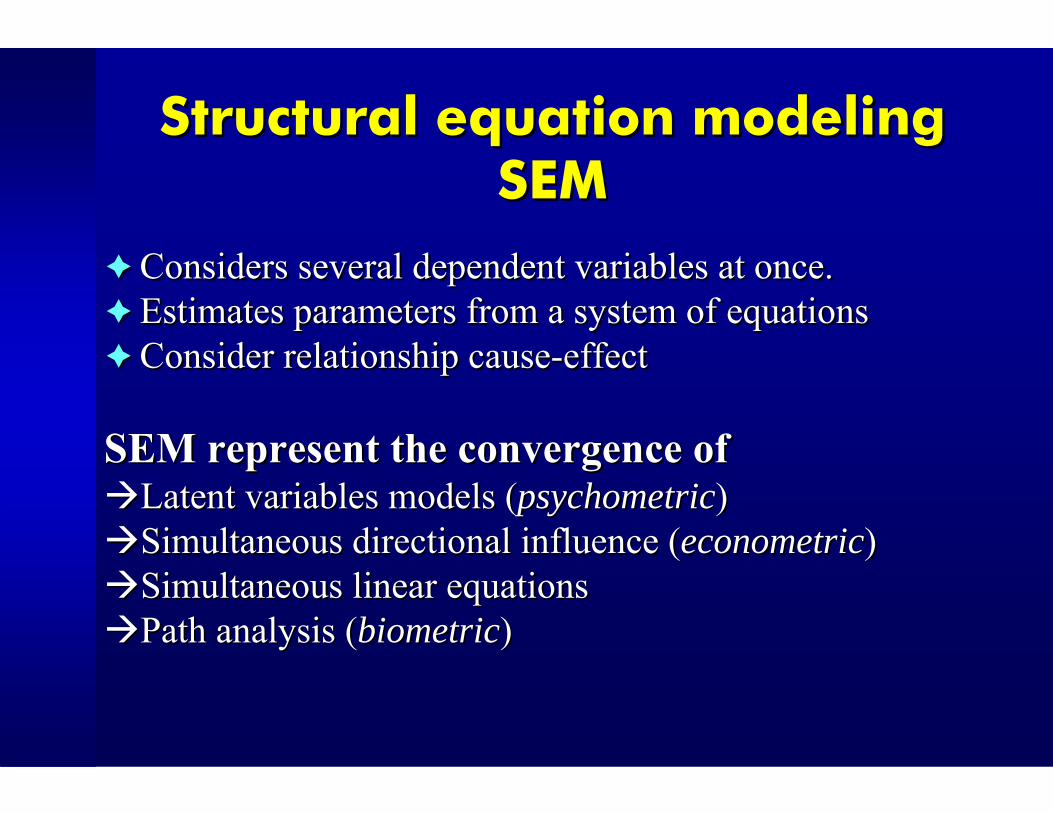
Structural equation modelingSEM
Structural equation modelingStructural equation modelingSEMSEM
Considers several dependent variables at once.Estimates parameters from a system of equationsConsider relationship cause-effect
SEM represent the convergence ofLatent variables models (psychometric)Simultaneous directional influence (econometric)Simultaneous linear equationsPath analysis (biometric)
Considers several dependent variables at once.Considers several dependent variables at once.Estimates parameters from a system of equationsEstimates parameters from a system of equationsConsider relationship causeConsider relationship cause--effecteffect
SEM represent the convergence ofSEM represent the convergence ofLatent variables models (Latent variables models (psychometricpsychometric))Simultaneous directional influence (Simultaneous directional influence (econometriceconometric))Simultaneous linear equationsSimultaneous linear equationsPath analysis (Path analysis (biometricbiometric))

ObjectiveObjectiveObjective
Utilize SEM to explain GE in a complex system of endogenous physiological variables and exogenous environmental variables.
Perform SEM in GE data as well as raw data.
Utilize SEM to explain GE in a complex system of Utilize SEM to explain GE in a complex system of endogenousendogenous physiological variables and physiological variables and exogenous exogenous environmental variables.environmental variables.
Perform SEM in GE data as well as raw data.Perform SEM in GE data as well as raw data.

General Structure Equation ModelsGeneral Structure Equation ModelsGeneral Structure Equation Models
Latent variables
Interest in modeling variation and covariation ofattributes that can not be measured directly (usedin social science)
Latent variables are often theoretical concepts(i.e., intelligence, social classes)
make measurements on observevariables that are assumed to beindicators of the latent variables
Latent variablesLatent variables
Interest in modeling Interest in modeling variationvariation and and covariationcovariation ofofattributes that can not be measured directly (usedattributes that can not be measured directly (usedin social science)in social science)
Latent variablesLatent variables are often theoretical conceptsare often theoretical concepts(i.e., intelligence, social classes) (i.e., intelligence, social classes)
make measurements on observemake measurements on observevariables that are assumed to bevariables that are assumed to beindicatorsindicators of the latent variables of the latent variables

DATADATADATAEXOGENOUS VARIABLES (X)
Weather covariatesmean maximum and minimum temperature, sun radiation
EXOGENOUS VARIABLES (XEXOGENOUS VARIABLES (X))
Weather covariatesWeather covariatesmean maximum and minimum temperature, sun radiationmean maximum and minimum temperature, sun radiation
1 stage 2 stage 3 stage 4 stage 5 stage
Emergence and tillering
Spike
Booting heading
Grain filling1 2
Climatic covariates x attributes
Five stages

DATA
86 wheat genotypes tested in three years.Incomplete Block design with two replicates.
ENDOGENOUS DEPENDENT VARIABLE (Y)Yield
INTERMEDIATE ENDOGENOUS VARIABLES (Y)
4 Grains m2 (GM2)4 Grains per spike (GSP)4 Thousand kernel weight (TKW)4 Spike m2 (SM2)3 Biomass anthesis (BMA)3 Harvest index anthesis (HIA)2 Rapid spike growth (RSG) 2 Crop growth rate in the boot stage (dBMboot)1 Biomass vegetative (BMV)

YLDGEI
RSGGEI
TKWGEI
GSPGEI
GM2GEI
SM2GEI
BMAGEI
dBMbGEI
HIAGEI
BMVGEI
Xij
β910
β810
β79
β78
β56
β68
β47
β34
β12
β25
Xij
bij9
bij7
bij4
bij1bij2
bij5
bij3
Fig. 1 Theoretical path diagram

Table 1Table 1. Direct, indirect, total, and adjusted cross . Direct, indirect, total, and adjusted cross products effect on YIELD GE (Rproducts effect on YIELD GE (R22=0.96)=0.96)
Variable Variable Direct Direct Indirect Indirect Total Total RR22
GM2GM2 1.091.09 0.000.00 1.091.09 0.900.90TKWTKW 0.640.64 0.000.00 0.640.64 0.430.43GSPGSP --0.050.05 0.610.61 0.560.56 0.440.44SM2SM2 0.000.00 0.540.54 0.540.54 0.040.04HIAHIA 0.000.00 --0.020.02 --0.020.02 0.200.20RSGRSG 0.000.00 0.090.09 0.090.09 ------DBMbDBMb 0.000.00 0.070.07 0.070.07 ------BMVBMV 0.000.00 --0.070.07 --0.070.07 ------
MXT4MXT4××GM2GM2 0.000.00 0.390.39 0.390.39 ------MXT4MXT4××GSPGSP 0.000.00 --0.230.23 --0.230.23 ------RAD2RAD2××SM2SM2 0.000.00 0.090.09 0.090.09 ------MNT4MNT4××TKWTKW 0.000.00 0.590.59 0.590.59 ------RAD2RAD2××TKWTKW 0.000.00 --0.400.40 --0.400.40 ------MXT3MXT3××BMABMA 0.000.00 0.100.10 0.100.10 ------MNT1MNT1××BMABMA 0.000.00 0.010.01 0.010.01 ------

YLDGE
RSGGE
TKWGE
GSPGE
GM2GE
SM2GE
BMVGE
MXT4*GM2
MXT4*GSP
dBMbootGE
RAD2*SM2
MXT3*BMA
MNT4*TKW
0.64
1.09
-0.05
1.01
1.04
0.08
-0.56
-0.14
0.13
-0.76-0.43
0.36
-0.37
0.16
0.15
0.92
RAD2*TKW-0.63
HIAGE
-0.02
-0.21
MNT1*BMA-0.37
0.31
Fig. 2 YLD GE

FR and PLS are useful tools for incorporating external variables.New QTL and QTL x Environments linear mixed model methods for multi trait multi environment are based on FR. PLS is a shrinkage regression method which is very robust to large number of variables with collinearity.
FR and PLS are useful tools for incorporating FR and PLS are useful tools for incorporating external variables.external variables.New QTL and QTL x Environments linear New QTL and QTL x Environments linear mixed model methods for multi trait multi mixed model methods for multi trait multi environment are based on FR. environment are based on FR. PLS is a shrinkage regression method which is PLS is a shrinkage regression method which is very robust to large number of variables with very robust to large number of variables with collinearitycollinearity..
Summary…SummarySummary……

Summary…SummarySummary……Advantages of SEM over single equation model
Provides a comprehensive view of how attributes of the plant and environments work together in a system, using a single path diagram.
Provides insight on how GE compensation effects occurs among yield components.
Decomposes total effects on GE into direct and indirect effects
Advantages of SEM over single equation modelAdvantages of SEM over single equation model
Provides a comprehensive view of how attributes Provides a comprehensive view of how attributes of the plant and environments work together in a of the plant and environments work together in a system, using a single path diagram.system, using a single path diagram.
Provides insight on how GE compensation Provides insight on how GE compensation effects occurs among yield components.effects occurs among yield components.
Decomposes total effects on GE into direct and Decomposes total effects on GE into direct and indirect effectsindirect effects

Summary…SummarySummary……
SEM can be useful for understanding interaction in other applications
Complex agronomic interactions e.g., NITROGEN x WATER on yield through yield
components.GEI in human diseases
e.g., gene x smoking on cardiac health as affected through intermediate attributes (blood pressure, arteriosclerosis, etc.)
SEM can be useful for understanding interaction in other SEM can be useful for understanding interaction in other applicationsapplications
Complex agronomic interactions Complex agronomic interactions e.g., e.g., NITROGENNITROGEN x WATER on yield through yield x WATER on yield through yield
components.components.GEI in human diseasesGEI in human diseases
e.g., gene x smoking on cardiac health as affected through e.g., gene x smoking on cardiac health as affected through intermediate attributes (blood pressure, arteriosclerosis, etc.)intermediate attributes (blood pressure, arteriosclerosis, etc.)

Biometrics and Statistics UnitCIMMYT
Biometrics and Statistics UnitBiometrics and Statistics UnitCIMMYTCIMMYT
Mateo VargasJuan Burgueno Jesus Ceron Gregorio Alvarado
Mateo VargasMateo VargasJuan Burgueno Juan Burgueno Jesus Ceron Jesus Ceron Gregorio AlvaradoGregorio Alvarado

Thank you!!!Thank you!!!Thank you!!!
Any Questions from Guelph,
Ontario, Canada?