
Linear Aerospike SR-71 Experiment (LASRE): Aerospace ... · NASA/TM- 1998-206561 Linear Aerospike...
19
NASA/TM- 1998-206561 Linear Aerospike SR-71 Experiment (LASRE): Aerospace Propulsion Hazard Mitigation Systems Masashi Mizukami, Griffin P Corpenmg, Ronald J. Ray, Neal Hass. and Kimberly A. Ennix Dryden Flight Research Center Edwards, California Scott M. Lazaroff NASA Johnson Space Center Houston, Texas National Aeronautics and Space Administration Dryden Flight Research Center Edwards, California 93523-0273 July 1998 https://ntrs.nasa.gov/search.jsp?R=19980210501 2018-06-08T19:54:01+00:00Z
Transcript of Linear Aerospike SR-71 Experiment (LASRE): Aerospace ... · NASA/TM- 1998-206561 Linear Aerospike...

NASA/TM- 1998-206561
Linear Aerospike SR-71 Experiment
(LASRE): Aerospace Propulsion HazardMitigation Systems
Masashi Mizukami, Griffin P Corpenmg,Ronald J. Ray, Neal Hass. and Kimberly A. Ennix
Dryden Flight Research Center
Edwards, California
Scott M. Lazaroff
NASA Johnson Space CenterHouston, Texas
National Aeronautics and
Space Administration
Dryden Flight Research CenterEdwards, California 93523-0273
July 1998
https://ntrs.nasa.gov/search.jsp?R=19980210501 2018-06-08T19:54:01+00:00Z

NOTICE
Use of trade names or names of manufacturers in this document does not constitute an official endorsement
of such products or manufacturers, either expressed or implied, by the National Aeronautics and
Space Administration.
Available from the following:
NASA Center for AeroSpace Information (CASI)7121 Standard Drive
Hanover, MD 21076-1320
(301) 621-0390
National Technical Information Service (NTIS)
5285 Port Royal Road
Springfield, VA 22161-2171(703) 487-4650

LINEAR AEROSPIKE SR-71 EXPERIMENT (LASRE):
AEROSPACE PROPULSION HAZARD MITIGATION SYSTEMS
Masashi Mizukami,* Griffin E Corpening, t Ronald J Ray, + Neal Hass, T Kimberly A Ennix T
NASA Dryden Flight Research Center
Edwards, California
Scott M. Lazaroff T
NASA Johnson Space Center
Houston, Texas
Abstract
A major hazard posed by the propulsion system of
hypersonic and space vehicles is the possibility of fire or
explosion in the vehicle environment. The hazard is
mitigated by minimizing or detecting, in the vehicle
environment, the three ingredients essential to
producing fire: fuel, oxidizer, and an ignition source.
The Linear Aerospike SR-71 Experiment (LASRE)
consisted of a linear aerospike rocket engine integrated
into one-half of an X-33-1ike lifting body shape, carried
on top of an SR-71 aircraft. Gaseous hydrogen and
liquid oxygen were used as propellants. Although
LASRE is a one-of-a-kind experimental system, it must
be rated for piloted flight, so this test presented a unique
challenge. To help meet safety requirements, the
following propulsion hazard mitigation systems were
incorporated into the experiment: pod inert purge,
oxygen sensors, a hydrogen leak detection algorithm,
hydrogen sensors, fire detection and pod temperaturethermocouples, water misting, and control room
displays. These systems are described, and their
development discussed. Analyses, ground test, and flight
test results are presented, as are findings and lessonslearned.
Nomenclature
canoe aerodynamically-shaped pod, housing
fluid and other systems in LASRE
GH 2 gaseous hydrogen
H 2 hydrogen
Aerospace Engineer, AIAA Member.
TAerospace Engineer.
Copyright © 1998 by the American Institute of Aeronautics and
Astronautics, Inc. No copyright is asserted in the United States under
Title 17, U.S. Code. The U.S. Government has a royalty-free license
to exercise all rights under the copyright claimed herein for Govern-
mental purposes. All other rights are reserved by the copyright owner.
H20
He
LASRE
LN 2
LO 2
model
N 2
0 2
P
Pamb
Pcalib
psi
psia
psig
PSL
R
T
TEA-TEB
V
Z
AmH 2
%H 2
%H2meas
%02
°_° 02,neas
water
helium
Linear Aerospike SR-71 Experiment
liquid nitrogen
liquid oxygen
top portion of LASRE, shaped like one-
half of a lifting body
nitrogen
oxygen
hydrogen tank pressure, psi
ambient pressure, psia
pressure during calibration, psia
pounds per square inch
pounds per square inch, absolute
pounds per square inch, gage
sea level pressure, psia
gas constant
hydrogen gas temperature, R
triethylaluminum-triethylborane
hydrogen tank volume, in 3
compressibility
change in mass of hydrogen in tanks, Ibm
volume fraction of hydrogen
volume fraction of hydrogen, measured
volume fraction of oxygen
volume fraction of oxygen, measured
1American Institute of Aeronautics and Astronautics

Introduction
For hypersonic and space vehicles that are reusable
or piloted, safety is an exceptionally importantconsideration. For piloted vehicles, this consideration is
a result of the possible tragic consequences of a mishap.For reusable launch vehicles, cost is the major driver;
the total operational costs must be minimized, including
the high cost of losing an expensive vehicle and its
payload as a result of a mishap. For a flight research
project, safe flight can be considered as important as the
technology being investigated.
A major hazard posed by the propulsion system of
hypersonic and space vehicles is the possibility of a fire
or explosion in the vehicle environment. These systemsstore a large amount of potential energy in the form of
fuel, oxidizer, high pressures or a combination of
these.l'2 The three ingredients essential to the
production of fire are fuel, oxidizer, and an ignition
source (except in the case of hypergolics and
pyrophorics, which can combust without an ignitionsource). Minimizing or detecting those three ingredients
in the vehicle environment mitigates the hazard. In
addition to sound design and operational practices, it is
often necessary to provide dedicated hazard mitigation
systems.
The Linear Aerospike SR-71 Experiment (LASRE) is
a flight experiment of a reusable launch vehicle
propulsion concept done in cooperation with the
industry. NASA Dryden Flight Research Center,Edwards, California was responsible for the flight test. 3
The experiment consisted of a linear aerospike rocket
engine integrated into one-half of an X-33-1ike lifting
body shape, carried on top of an SR-71 aircraft (figs. 1,2). Unlike conventional bell nozzle rockets, the linear
aerospike engine can compensate for ambient back-
pressure effects to provide higher performance over a
wide range of altitudes. However, external flow
slipstream effects on the nozzle flow may reduce
performance. Therefore, the primary objective ofLASRE was to evaluate flight effects on aerospike
engine performance at several altitudes and Mach
numbers. Although LASRE is a one-of-a-kind
experimental system, it had to be rated for piloted flight,which demands a high degree of safety. A rapid
prototyping approach was taken to hardware
development. This approach resulted in an extendedseries of tests to troubleshoot and validate the integrated
system. These tests included various functional testssuch as 'cold flows' of inert fluids, 'ignition tests' using
LO 2 and triethylaluminum-triethylborane (TEA-TEB),and actual 'hot fires' of the engine.
A simplified schematic of fluid systems in the LASRE
pod is shown in figure 3. Essentially, this was a flying
rocket engine test facility. The model is the top portion
shaped like half of a lifting body. The canoe is an
980345
Figure 1. LASRE configuration mounted on SR-71 aircraft.
2American Institute of Aeronautics and Astronautics
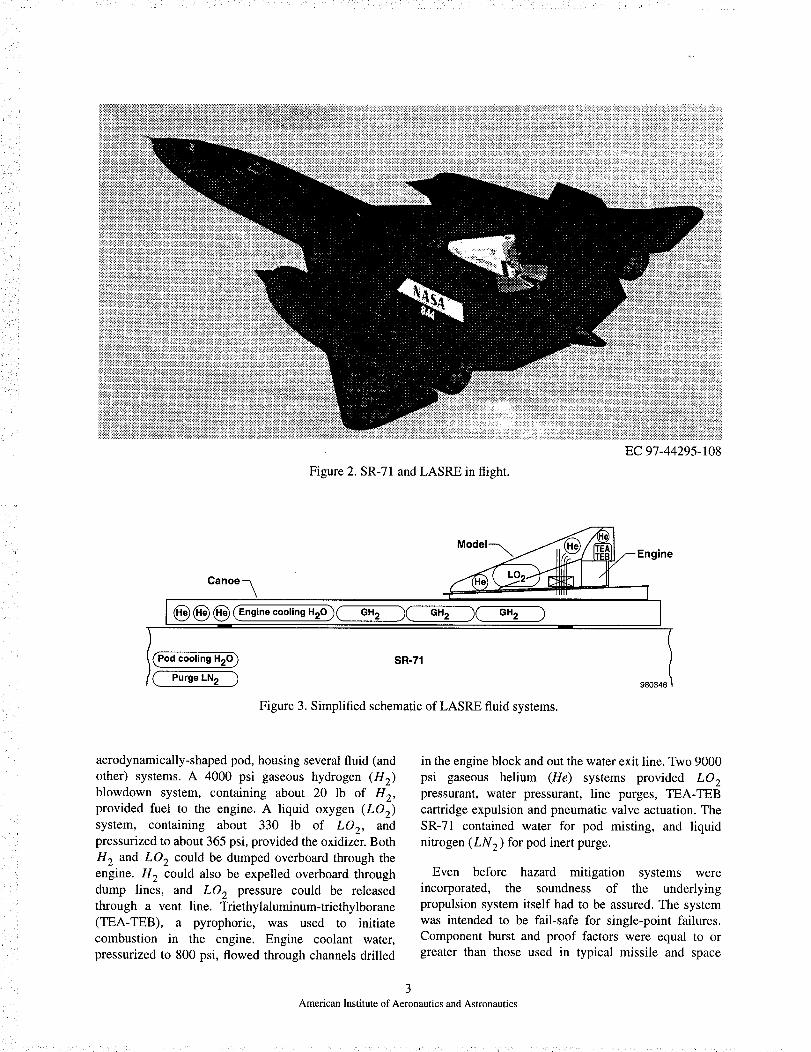
Figure 2. SR-71 and LASRE in flight.
EC 97-44295-108
Engine
Canoe -\ -_ '"" I
(_ (_ (_ (Engine cooling H20)( GH 2 )( GH 2 )( GH 2 )
(Pod cooling H20 ) SR-71
Purge LN 2 )9803461
Figure 3. Simplified schematic of LASRE fluid systems.
aerodynamically-shaped pod, housing several fluid (and
other) systems. A 4000 psi gaseous hydrogen (H2)
blowdown system, containing about 20 lb of H 2,
provided fuel to the engine. A liquid oxygen (LO2)
system, containing about 330 lb of L02, andpressurized to about 365 psi, provided the oxidizer. Both
H 2 and LO 2 could be dumped overboard through the
engine. H 2 could also be expelled overboard through
dump lines, and LO 2 pressure could be releasedthrough a vent line. Triethylaluminum-triethylborane
(TEA-TEB), a pyrophoric, was used to initiate
combustion in the engine. Engine coolant water,
pressurized to 800 psi, flowed through channels drilled
in the engine block and out the water exit line. Two 9000
psi gaseous helium (He) systems provided LO 2pressurant, water pressurant, line purges, TEA-TEB
cartridge expulsion and pneumatic valve actuation. The
SR-71 contained water for pod misting, and liquid
nitrogen (LN 2 ) for pod inert purge.
Even before hazard mitigation systems were
incorporated, the soundness of the underlying
propulsion system itself had to be assured. The system
was intended to be fail-safe for single-point failures.
Component burst and proof factors were equal to or
greater than those used in typical missile and space
3American Institute of Aeronautics and Astronautics

systems. 4 The H 2 and LO 2 systems were leak checkedas much as was feasible on the integrated pod, using
long-term pressure decay, bubble fluid, an ultrasonicleak detector, a thermal conductivity leak detector, an
electrochemical hydrogen sensor, and blowdown testing.
Flammability limits for H 2 - 0 2 - N 2 mixtures at sea
level are about 4 percent H 2 and 4 percent 02, and arefairly independent of each other (fig. 4). The limits
remained about the same throughout the LASRE flight
envelope, extending up to an altitude of 50,000 ft, and
were not significantly narrowed by reduced pressures atthose altitudes. 5 Calculation of combustion conditions
at equilibrium or for detonation showed that even for
low flammable concentrations of H 2 and 02,
temperatures and pressures high enough for catastrophic
consequences could develop. Therefore, a ground rule
was established that 02 and H 2 concentrations in thepod should be maintained below 4 percent during the
entire mission, because any combustion in the pod was
considered unacceptable.
To help meet safety requirements, propulsion hazard
mitigation systems were incorporated in LASRE. These
systems were: a pod inert purge, 02 sensors, a H 2 leak
detection algorithm, H 2 sensors, fire detection and podtemperature thermocouples, water misting, and control
room displays. These systems are described, and their
development discussed. Analyses, ground test, and flight
test results are presented, as are findings and lessonslearned. Use of trade names or names of manufacturers
in this document does not constitute an official
endorsement of such products or manufacturers, either
expressed or implied, by the National Aeronautics and
Space Administration.
Propulsion Hazard Mitigation Systems
The following sections discuss the systems and
methods used to mitigate propulsion hazards. Findings
and lessons learned as a result of tests performed are
also presented.
Pod Inert Purge
The pod cavity was purged with inert N 2 gas, forseveral reasons. The primary purpose was to minimize
the presence of oxidizer in the pod environment to
below 4 percent 0 2 by displacing air out of the pod.The purge may also reduce the presence of fuel by
displacing any leaked H 2. The H 2 and LO 2 valves and
some of the electronics boxes were purged with N 2, tominimize ignition sources. This purge surrounded the
electronics with inert gas, and prevented moisture
caused by water misting from coming into contact withthe electronics.
Figure 5 shows a schematic of the N 2 purge system
N 2 was supplied from two LN 2 Dewar flasks onboard
lOO
o lOO
90
4American Institute of Aeronautics and Astronautics

t _,_'] • ,.,._1-- I "l'! I¥1VLJ_L= I BOX J
i' " '" LO 2 I "._,s'_"_ GASEOUS N2 ] L'V_I ]_ / I
.-"_ _/'_ _ _" _ PICCOLO IN I_'_V_l I !.- _-_,. .oDE, ' ' ,_L_, ,.._ _ :| I _ I EUECTRON_CSI.Qm
.......................... -_11,-_.__z._._-___ "2""'"TOU_..... I .... I .... ! ........ _ _ ............. _ N 2N- u ..,=ou._I:= I -_ .... I °ASEOU.,=I_._ ,11I ._o_.o._I ":--I T °ROUNOCART
I-_i. P CCOLO .I,... --_,c- ATFORWAIO-IF fl '--_c---' _c-'LL--_______JLoENDOFCAN=Etl IL_2L 3f i
_:( . I o.,=.NUMBER 3 LN 2 SYSTEMTEXlSTING)
50 LITER LN 2 DEWAR
_T "_1._ATE.
FILL & VENT VALVE & FILTER
ium_
AUXILIARY LN2 SYSTEM
50 LITER LN 2 DEWAR
V_T /I .E=ER
I FILL & VENT VALVE & FILTER
GN 2 CONNECTION
FLOW CONTROL
40 PSIGREUEF VALVE
pRE..,W'---_---f_:----:°U_,l_ -- vo..o.A,
('p_ III_HEATER PRESSURE TRANSDUCERS
_lt=_ REF=ENCEOTO,=.=E.,
L ..,. y. FUELTANK LN2
SENSE PORTS J SOLENOID VALVE GASIFIER
FL%_IT"O"( / PRE"_I (TOCONTROLPANEL).....y- - TO_ST"--' -i _ . @:_VE.TTO.A*
.PRESSURE REGULATOR _He_K LFME BAY (K BAY)
VALVE
40 PSIG REUEF VALVE
I CHECK
•r---_ _-_ VA_V_I _ ....
I FLOW CONTROL
I PRESSURE ORIFICEI SWITCH TO COCKPIT /
i PRESS LOW UGHTPRE33URETRANSDUCER FOR FLT
I TEST INSTRUMENTATIONII
_ --.-_ VENT TO BAY
J[ 4o PSIG RELIEF VALVE
PRESS _ _. * _ "---_'
°u_i_ w,.o.,_1_ REFER=CEO.OS.A.,ENT
FLO_ T_)_ I_- _ • i I
PRESSURE REGULATOR I
CHECK
VALVE
980348
Figure 5. Nitrogen purge system schematic.
5American Institute of Aeronautics and Astronautics

the SR-71. LN 2 was vaporized by electric heaters, itwas dispersed into the pod through perforated piccolo
tubes near the front of the pod, and also into theelectronics boxes and valves. The two Dewar flasks held
a total of 100 liters (180 lb) of LN 2. The flow rate wasabout 2.5 lb/min, or 34 standard cubic feet per minute,
for an operating duration of 72 minutes. These flow
rates gave about 0.3 volume change-outs per minute on
the ground, and 2.4 change-outs per minute at an
altitude of 50,000 ft. For ground operauons, N 2 was
directly provided from a ground cart to conserve the
onboard LN 2 supply. During flight, flow could beturned on or off from the SR-71 rear cockpit, and the
operating pressure was monitored in the control room to
verify flow.
Purge effectiveness was evaluated primarily by using
0 2 sensors distributed in the pod. Preliminary groundtesting revealed that it took a long time to establish a
purged environment, and the pod panels had to be well-
sealed to maintain it. Therefore, a separate monster
purge was implemented to establish an initially purged
environment by using ground service equipment that fed
large quantgies of N 2 directly into the pod. During
subsequent ground tests an adequate purge was
confirmed. In flight however, substantial infiltration ofexternal air occurred shortly after takeoff and purge
effectiveness was quickly lost, with 0 2 levels reaching
nearly 21 percent. Therefore, attempts were made to
seal gaps in the pod by using elastic materials such as
foam rubber and caulking. Also, the second LN 2 Dewar
flask was added, and purge flow rate was doubled tocurrent levels (2.5 lb/min). In addition, a valve was
placed in the purge vent line, which could be remotelyactuated from the cockpit. With the valve open, the
purge gas flowed through the pod and out the vent as
originally designed, which also allowed any major leaksto be vented out of the pod. With the valve closed, the
purge gas maintained a positive pressure in the pod, thus
reducing air infiltration. The purge gas flowed out from
any remaining leak paths. A subsequent flight testdemonstrated adequate purge performance for flight, up
to about Mach 0.9 and an altitude of 26,000 ft, with 02
levels below 4 percent. Figure 6 shows Mach number,
altitude, and the measured 0 2 levels during a portion of
the flight. The canoe 02 sensor that reads consistently
low 0 2 levels is located close to a purge piccolo tubenear the front of the canoe. The spike above 4 percent is
believed to be telemetry noise. A preliminary
assessment of additional data suggested that purge
integrity may be maintained up to Mach 1.6 and an
altitude of 50,000 ft. It was observed that with the vent
valve closed, pressure was maintained in the pod during
climb and descent. During climb, ambient pressure
decreased, and pod pressure was maintained above
ambient pressure, which aided purge effectiveness.
However, during descent the opposite effect occurred,which made it difficult to maintain an adequate purge.
These tests demonstrated that it is important to provide
an adequate purge flow rate, and to seal the vehicle well
against outside air infiltration.
Oxygen Sensors
Twelve oxygen sensors were located in the pod to
detect the presence of oxidizer, eight in the canoe and
four in the model. The purpose of these sensors was to
determine inert purge effectiveness, infiltration of
outside air, and the presence of any leaked LO 2.
Commercially available electrolytic sensors were used,
originally intended for automotive applications. Each
sensor was installed in a temperature-controlled canisterwhich was heated to about 115 °F, to reduce effects of
ambient temperature changes on the readings. These
sensors were point measurements that would not detect
air or oxygen which could have been trapped in other
areas, but the number and distribution of the sensors
were judged sufficient to characterize overall 0 2 levels
in the pod.
It was evident from data at altitude that these sensors
actually measured the partial pressure of 0 2 , but
volume fraction is of greater interest than partial
pressure for determining the flammability of mixtures.
Therefore, volume fraction of 0 2 (%0 2 ) was
calculated by correcting the measured partial pressure
of 0 2 (%0 2 .... ) to sea level pressure (PsL)' usingambient pressure (Pamb)' as follows:
PSL
%02 = %02 .... Pamb(1)
Accuracy of the sensor at sea level, according to the
specification sheet, was 1 percent. But for a given
volume fraction of 0 2 , as altitude increased, ambientpressure decreased, and the partial pressure of 0 2
decreased, approaching sensor accuracy limits. As a
result, at high altitudes 0 2 volume fraction determinedfrom sensor readings appeared erratic.
A test program was undertaken to better characterize
sensor accuracy at altitude. In a small test chamber,
sensors were exposed to a range of 0 2 concentrations
varying from 0 percent to 21 percent, at a range of
pressure altitudes from sea level to 80,000 ft. Becausesensors have a life of about 2 years, new sensors as well
as older ones were tested to help determine aging
6American Instituteof Aeronautics and Astronautics

Mach
1.0
.8
.6
.4
.2
0
iiiiiiiiiiii_iiiiiiill _L ...... _ ................... j ...............
_.,-,,,/ i ; ;
30 x 10 3
25
2O
Altitude, 15ft
10
5
0
10
8
6
%0 24
2
0
10
8
6
%0 24
2
0
Ii
iiiiiiiiiiiiiiiiiiiiiiiii ii!iii iiiiiiiiiii ................................ 2 ................... i ..............
i t
............. /: .................. !................... i...............J i i
, , , Canoe
, , , 0 2 sensorsi i i
i i
i i i .................... r- .................. -_ ................... i ...............
.............. ,';................._._.:-_. _----,--_-_.-__-_..................._-- '!................... _ I ...._,_.__.__" . .'.._,.................................................. ,....._.-_..*--_..j_ ,_J.............. ...... _ _ - - - _._,_ - - .... _, :.,b._,_ _._,._.;-.._._L_..,_, ;.,J
' I?" .... ' ' --I
i I i
i i i
i t Ji t i
t r............... r- .................. 1
i i i
i i t
ii
............... r- .................. 1 ................... i ...............J i i
i i J
i t i
............... r ................. .-..¢ _- -._._- _._ - _.- _.; :._.- :.: -, ............. -_
i i i " _ ¢'" _i
10.0 10.5 11.0 x 10 3
Time, sec 980349
Figure 6. Nitrogen purge effectiveness in flight, from takeoff up to Mach 0.9 and an altitude of 26,000 ft.
Model
0 2 sensors
7American Institute of Aeronautics and Astronautics

effects. Representative results for 0 percent, 1 percent,
2 percent and 5 percent 0 2 concentrations are shown in
figure 7(a). Accuracy at sea level appears much better
than the specified 1 percent accuracy, but a distinct
drop-off is seen above an altitude of 30.000 ft. To
compensate for the drop-off, a fifth-order polynomial
correction was applied to the average of the sensor
readings (fig. 7(b)). Ninety-nine percent confidence
intervals for the corrected readings, based on the
t-distribution, were less than 1.3 percent up to an
altitude of 50,000 ft (fig. 7(c)).
Rules were established for interpreting and acting on
0 2 sensor data during flight. If any 02 sensor, plus itsuncertainty, exceeded a specified threshold level
(nominally 4 percent), steps would be taken to secure
the system and mitigate the hazard, typically by
dumping the H 2 overboard.
Clearly, it was important to validate 02 sensor
accuracy before use, especially because these sensors
were being used outside their originally intended
environment. Characteristics of other types of sensors,
or sensors from other manufacturers, might be entirely
different.
Hydrogen Pressure Decay Leak Detection
In order to infer the presence of fuel in the pod, a
real-time pressure-decay method was used to detect
leaking hydrogen. Conventionally, pressure-decay leak
detection takes a long time to perform, and is done
during system checkout. A noticeable pressure drop in
the gaseous hydrogen tanks during flight operation
would indicate a large leak, or perhaps a thermaltransient. However, as a result of the unavailability of
hydrogen sensors, a pressure-decay method was
implemented for real time in-flight use. It was for
detection of leaks from the H 2 tanks in a static mode
only, and not for detection of leaks in the H 2 lines or
during flow.
In theory, the hydrogen tank leak rate can be
determined from the change in mass of hydrogen in the
tanks (AmH2) as follows:
=V PAmH2 -R(ZT ZffoTo!
(2)
Tank pressure (P) was measured by a pressure
transducer. Hydrogen gas temperature (T) was measured
by two redundant thermocouples mounted on probes
i
7 ...................... _ .....................
6 ...................... 7 ............. -: .......
i
i
i
i
3 .............. _ ............................
2
1
5
%0 2 4
0 20 30 40
Pressure altitude, ft
It ..................................
i i I
I1- ................................
I i I I I
,in i m na at an i
10 50
Sensor• 1• 2• 3o 4[] 5
6
60 x 103
980350
(a) Pressure altitude compared with percent 02, for 5 percent, 2 percent, 1 percent and 0 percent 02 mixtures.
Figure 7. Oxygen sensor altitude chamber test data.
8American Institute of Aeronautics and Astronautics

%0 2fifth ordercorrection
t _ i J
I Ii
6 ...........................................
÷6
4 ....... : ......................... _ ......i
I
i
i
3 ............................ t- ...... _" ......i i i
i i i
2_15 .... E]..............................i i i i
i I I I
, ,a-....a...... ...... ...... e............i I
0 10 20 30 40 50 60 x 103
Pressure altitude, ft980351
Sensor1
• 2• 3o 4D 5A 6
(b) Pressure altitude compared with percent 0 2 with fifth order correction, for 5 percent, 2 percent, 1 percent and
0 percent 0 2 mixtures.
%0 2uncertainty
2.0
1.5
1,0
.5
i J
"1
..................... I .......
....... L ............. I ...... i ..... L ......
p I b I
I I I I
I J I I I
i i I i
I c i
_ : -- . , ,• f t t10 20 30 40 50 60 x 103
Pressure altitude, I_980352
Sensor--e-- 1--B- 2
5
(c)Pressurealtitudecompared with 99 percentconfidenceintervalsfor5 percent, 2 percentand 1 percent O2mixtures.
Figure 7. Concluded.
9American Institute of Aeronautics and Astronautics

inside the tanks, which were averaged together. Note,
that to obtain an accurate measurement of gas
temperature under changing conditions, a tank surfacemeasurement would have been inadequate. Tank volume
(V) was assumed to be constant. Compressibility (Z)
was a function of P and T, and the subscript 0 denotes
initial conditions. R is the gas constant for H 2.
In software, digital low-pass filtering was applied to
the AmH2 signal, to remove high frequency randomnoise, and to facilitate data interpretation. The filter time
constant was adjustable, and was set by the user to obtain
a readable signal, while preserving reasonable response
time and quick recovery from data spikes. Magnitude
limits were imposed to prevent telemetry data spikes
from corrupting the calculation. The calculation could be
configured for either hydrogen or inert helium as the
working gas. The resulting AmH2 signal was displayedon a scrolling time history display (fig. 8).
The ability to detect leaks depended on discerning
small changes in pressure and temperature, which was a
function of instrumentation accuracy. The trace showed
good stability under the varying ambient conditions of
flight. Uncertainty analysis indicated that a mass loss of
0.15 lb or more could be detected. Ground testing, done
by releasing controlled small amounts of gas from the
tanks and observing the trace, showed that mass loss aslow as 0.03 lb could be detected.
In the control room, if a mass loss rate of greater than
0.03 lb was seen in 8 minutes or less, it would be
considered a positive determination of leakage, and
steps would be initiated to secure the system by
dumping propellants overboard. This leak rate
corresponds to about 4 percent of the N 2 purge flow rate
in the vicinity of the H 2 tanks, or about 1460 standardcubic inches per minute. This amount was judged to be
the minimum leak rate reliably detectable in areasonable timeframe. However, this is still a substantial
and potentially hazardous quantity of hydrogen that is
capable of locally forming combustible mixtures in the
pod. Lower leak rates could possibly be detected over a
longer period of time.
The H 2 leak detection algorithm was a useful tooland was the only available means of H 2 leak detectionon LASRE, but could not be relied upon to detect all
hazardous leaks. This algorithm could detect moderate
to large tank leaks, or smaller leaks over a long period oftime. However, it could not detect small but still
hazardous leaks in a timely manner, nor did it detect
leaks in the H 2 lines.
Hydrogen Sensors
Although H 2 sensors were not used, they would haveconstituted a more direct way to detect the presence of
fuel. Sensors were planned to be strategically positionedwithin the canoe and model. The sensor proposed for
use was based upon a design developed by SandiaNational Laboratories, Albuquerque, New Mexico. 6 The
sensor element was a Palladium-Nickel patch that has a
current passing through it. When present, hydrogen
freely infiltrates the lattice network of the crystal,
causing a change to the electrical resistance of the
element proportional to the local concentration. The
element was temperature regulated by a controller,which aided in the response time of the sensor and
removed one of the operational variables. The
advertised range of detection was 1 percent to
100 percent volume fraction, with 0.5 percent accuracy.
The suitability and accuracy of the sensor in a flightenvironment needed to be ascertained. A test chamber
was used to simulate pressure altitudes. Testing was
conducted with pure N 2 and with calibration gases of
specific concentrations of H 2 in N 2 , at discrete ambient
.05
0
AmH 2,Ib
- .05
- .100 5 10 15 20 25 30
Time, min 980353
Figure 8. Hydrogen tank leak detection algorithm scrolling time history plot display.
10AmericanInstitute of Aeronauticsand Astronautics

pressurepointsrangingfrom2 psiato 13.5psia.Thesensorheatingelementmitigatedtemperatureeffects.
Preliminarydatafor sevensensorswitha 3 percentH 2 concentration by volume are shown in figure 9(a). It
is clear from the data that when the ambient pressure
was reduced the sensor measured concentration was
also lowered and a linear relationship existed between
ambient pressures and the measured concentration.
Therefore, the H 2 sensors appear to measure partial
pressure of the gas to be detected, much like the 02
sensors. If this phenomenon was not accounted for, and
the sensor readings (%H 2 ..... ) were used withoutcorrecuon during flight, the readings could potentially
lead to the false conclusion that the flammability limits
had not yet been reached. Like the 0 2 sensors, the
following correction algorithm could be applied real-
time during flight using ambient pressure measurements
(Pamb) in the pod and the pressure at which the sensors
were calibrated (Pcalib)' to obtain percent volume of
hydrogen (%H 2 ) present.
Pcalib
= (3)%H2 %H2 .... Pamb
Results of applying this simple correction to the raw
data are shown in figure 9(b). Stable readings were seen
up to nearly 27,000 ft pressure altitude. Deviation from
3 percent actual concentration indicates a bias error, butit was believed this could be corrected with a more
rigorous calibration program. Above an altitude of
27,000 ft, the accuracy limitation of the sensor isreflected in the nonlinear deviation and data scatter. Very
similar results where achieved using a 10 percent H 2concentration.
Unfortunately, once installed in the pod, the system
could not be made to function correctly, apparently
because of design flaws in the H 2 sensor controller.
Programmatic and schedule constraints ruled out the
possibility of troubleshooting to correct the system, so
the H 2 sensors were not installed for flight.
Certainly, a H 2 detection system would be highlydesirable for hazard mitigation. Bench test results were
promising for future flight applications. However. H 2sensors and systems that are qualified for use in inert
background, with varying pressures and temperatures
and that are robust and compact enough for flight
application are difficult to find. 7'8 H 2 detection
technologies can be pursued for future projects, as this
type of fuel becomes more prevalent.
8 ' ' ' ' ' Sensori t t i t
' i ' ' ' --e-- 1i i i ti t t _ t
7 ........................................ __ -'4-- 2t t t t tt t i ' ' -----N--- 4_ t t i t
6-- ' ...... _ 5..... 7 ...... 7 ...... T ...... r ...... 7 ....
.... ' --0-- 6_ t i i t
' ' ' ' ' -.-'4--- 7i t t i t
5 ....... l- ...... t- ...... • ...... _- ...... +i t t _ tL t t. i ti t t i ii t t i i
%H2meas 4 - ' ......... ;" ...... ;" ...... 7 ...... 7 ...... T ......i t i i ii t t i ti t t I t
t i I t:'l ..... r- ...... t- ...... t- ...... r ...... t- ......
t t i tt i t i t
t t i tt t t i
t i t...... T ...... T ...... 7---
.... r .... r ...... r .......i i i
• _ i t
0 10 20 30 40 50 60 x 103
Pressure altitude, tt980354
(a) Pressure altitude compared with percent H 2 measured, for 3 percent H 2 mixture.
Figure 9. Hydrogen sensor altitude chamber test data.
11American Institute of Aeronautics and Astronautics

i
, i I
I I I I
I I J I
i I r i i
i i i i i
I I _ I I
i I I I I
^ i I I i iIO ...... F ...... i" ...... T .... r ............
i i ¢ I
i r i i i
i i i t
I I I i I
I I i I I
i I i I
i I I I
I I I I.... F ...... T .......... T ......
I I I
i I i I
i i i i
.... _ ...........................
2 ___L .... u...... T...... _...... T ......i i i I
0 10 20 30 40 50 60 x 103
Pressurealtitude, ft 980355
5
%H 2 4
3
Sensor1
•-B-- 23
--x--- 4---)K--- 5--<>-- 6-_ 7
(b) Pressure altitude compared with percent H 2, for 3 percent H 2 mixture.
Figure 9. concluded.
Fire Detection and Pod Temperature Thermocouples
Fifteen thermocouples were distributed throughout
the pod for sensing heat from nearby combustion.Thermocouples are commonly used for local fire
detection. Procedurally, if high temperatures that were
far above expected ambient total temperatures were
seen (especially locally), fire would be indicated and
steps would be taken to dump the propellants and securethe aircraft.
The thermocouples were also used to monitor pod
environment temperatures, because certain components
were temperature limited, such as the composite H 2tanks and electronics. Flight data (fig. 10) showed that,
except for some areas near cryogenic components, the
pod thermal environment was quite benign throughout
the mission profile. During ground operations and in
flight up to Mach 1.6 and an altitude of 50,000 ft,temperatures typically ranged from 45 °F to 85 °E This
benign environment was unexpected, given the wide
range of external static and total temperatures
throughout the mission. If pod temperatures had
approached the H 2 tank temperature limit of 130 °F,steps would have been taken to cool the pod by
decelerating the aircraft or turning on the water mist. If
these measures had not been successful, the H 2 tanks
would have been depressurized by dumping the contentsoverboard.
Water Misting and Coolant System
The coolant water system was used to provide a
cooling water mist for the pod, and to recirculatecoolant for the electronics. The recirculating coolant
was required anytime the pod was powered up. The mist
was to be turned on only when necessary and
appropriate for pod cooling, such as during high
stagnation temperature flight conditions
Figure 11 shows a schematic of the system. About
20 gallons of water was carried aboard the SR-71. The
recirculating coolant flow rate was 3 gallons per minute
(gpm), and the mist flow rate was 0.18 gpm. The water
was chilled by cold air from the SR-71 environmental
control system. It was important to verify that the N 2
purge was on before turning on the water mist, to
prevent moisture from entering the electronics boxes.
Figure 12 shows the altitude and temperature regimes
where the water mist boils into vapor; condensing water
was undesirable, because it could cause hardware
problems. The upper temperature limit for the
composite high-pressure tanks is also indicated. Clearly,
the usable range for water mist is limited if
12American Institute of Aeronautics and Astronautics

Mach
Altitude,ft
2.0
1.5
1.0
.5
0
i i!i!i60 xl03
50
40
30
20
10
0'
100
8O
60
°F 40
20
0
-20
100
80
60
°F 40
20
0
- 20
......... i_' ..................... _mml............... ii_L...............' ,' ! 'i i m
............. m........
i
- i i _ i
....... i ..................... . ..............i
m m
i................................ , ..................... r ..............
.......... + ..................... m..................... _ ..............
, m ,I m ,
I I I
_,'-,,..',.-.""_'.,.....:':',,_,,.: - _._.,_...--,. .................. :................ .. "-_-,..._,.,,-............. .;",
......... _ .......... '-"-'-"r ;.,,_.-.,,-- - - -
......... r ......... . ............ ,................... t- - r ..... ._ -_ -
, : _ ,, u- /_._
......... : ..................... i................... _-ct..... -_-_.......l I l
10 12 14 x 10 3
Time, sec 980356
Figure 10. Pod in-flight thermal environment, up to Mach 1.6 and an altitude 50,000 ft.
13
American Institute of Aeronautics and Astronautics
Canoethermocouples
Model
thermocouples

./MODEL, w,,_ * EJ ..o..,/ II II i/_(_--_] MISTNOZZLE5 _,_ (O.OMOPM)/ II II'111L_-, , ,_ '........,
PURQE I1 ro I_l:P WAlrll
_ iqJomr Tw4r_ oo¢_J.,r 1.on
__ (0.12 GPM)
,._ (o.os LB/MIN) t
SOV
4- CANOEC
SR-71 BAY _t_J._ swn_.mUONT IN _OCKPlT roll
riump VALVm ..... l[ • . -OYIOYPI_P.IIIRIHI "rr_dPr_qlATU_ ._ FAU.URE CONDITION
xo _r_ NIO_Vl MU|p ' "" MAIII_DLD• AV (_ ' VJ_L_ TP,JIT I/ _ _ TEMPERA1UflG EEMSOR
T_NgDUL_RF_ FLIGHT TG_;T
nz.I _rt
980357
Figure 11. Pod water-misting and coolant system schematic.
60 x 103Tank temperature
limit
5O
4O
Pressurealtitude, 30
ft
2O
I0
080 100 120 140 160
Temperature, °F 980358
Figure 12. Pod water-misting envelope, pod temperature compared with pressure altitude.
14
American Institute of Aeronautics and Astronautics

condensation is to be avoided. Also, water mist was not
for use as a fire suppressant, and could aggravateelectrical fires.
The original dual coolant pumps experienced repeated
failures, because they were not designed for continuous
service. These pumps were replaced with a more robust
single pump. In practice, the water mist system was
never used in flight because additional cooling was not
necessary and because there were concerns about
hardware damage from water condensation.
Control Room Displays
Propulsion systems and fire hazard mitigation system
parameters were monitored in real time using control
room displays. Two displays (not shown) were
dedicated to monitoring propulsion system parameters
and general system health. These displays schematically
represented the propellant feed systems, and were used
for decision making during tests and missions.
Additional displays and strip charts showed more
detailed and time history data of specific parts of the
propulsion and fire hazard mitigation systems.
One display was primarily used for monitoring of the
fire hazard mitigation systems and parameters (fig. 13).
This display included: a time history plot of the H 2 leak
detection algorithm; bar charts and digital values of the
fire detection thermocouples and 0 2 sensors; and digital
indicators of LN 2 purge and water misting and coolant
systems. The operator of this display could easily switch
to time histories of the fire detection, thermocouples,
0 2 sensors, or H 2 sensors by selecting the appropriate
on-screen button. A keyboard interface allowed
real-time setup and resets of the leak detection
algorithm. All critical parameters changed from green,
MACH X.XX Fire TC's, LOX/GH2 Sensors, & ConsumablesGH2 TANK LEAKAGE (Ib)
ALT XXXXX 0.05KEAS XXXPAMB XX.X
TAMB XXX 0 •no xxx
- 0.05GH2TKP XXXGH2TKT1 XXXGH2TKT2 XXX - 0.10
11:09:12 + 5 + 10 TIME (MIN) + 20
- 50 0 °F 50 100 150 200 250
XXX GHeCAN
XXX TB065
XXX TB066
XXX TB067
XXX TB068
XXX TB069
XXX TB070
XXX TB071
XXX
XXX
XXX
XXX
J__ -50 0 °F 50
__ [] _32°F _32°><120 °
+ 25
im.
_g_lill:! .................................
100 150 200 250
[] 120°>< 140 ° [] >140°F
H20_MST_P
MAX H20_OUT_P
DMGH2 H20_OUT_T
ALLOWE H20_RTN_T
H20_RMN
--80K
--2.2 KLN2_TNK%
LN2_TIME
+ 30 LN2_MDOT
LN20RF P
PINF
MODEL PPOD AP
CANOE_P
VENT_PVENT Ap
XX.X
XX.X
XXX
XXX
XX,X
XXX
XXX
X.XX
XX.X
XX.X
XX.X
X.XX
XX.X
XX.X
X.XX
02 SENSORS 0 1 2 3 4 5%
XXoX O2S01
XX.X O2S02
XX.X O2S03
XX.X O2S04
XX.X O2S05
XX.X O2S06
XX.X O2S07
XX.X O2S08
O 1 2
_<2.0,/0 _ z0.4.0o/0
iiiiiii_i!ili_!i
_iii_ii!iiii_iii3 4 5%
[] _4.0%
Figure 13. Primary control room display for fire hazard mitigation systems.
980359
15American Institute of Aeronautics and Astronautics

to yellow, then red, as they approached and then
exceeded predetermined limits.
Ground tests and inert flight tests helped validate and
mature the control room displays and operating
procedures. Control room displays, although they may
appear overly detailed, proved indispensable during the
extended development and troubleshooting program,
and for determining system status and performance.
Conclusions
The LASRE experiment incorporated a number of
propulsion hazard mitigation systems. Hazards were
mitigated by minimizing or detecting the three
ingredients essential to the production of fire: fuel,oxidizer, and ignition source. The major findings wereas follows.
For inert purge of the vehicle cavity, it was important
to provide an adequate purge flow rate and to seal thevehicle well against outside air infiltration. Those efforts
reduced the in-flight cavity 02 levels from nearly21 percent to below 4 percent.
Oxygen and hydrogen sensor accuracies in flightneeded to be considered. Accuracy in terms of volume
fraction-of-gas degraded at high altitudes. This was
because the sensors actually measured partial pressure
of the gas. For a given volume fraction-of-gas, asaltitude increased, ambient pressure decreased, and the
partial pressure of the gas also decreased, approaching
sensor accuracy limits. Sensor accuracy could be better
characterized by calibration at reduced pressures.
Oxygen sensors were a mature technology and werevalue-added for safety monitoring. Accurate and robust
hydrogen sensors able to operate in an inert flight
environment were identified as an important safety
technology, requiring further development.
A pressure- and temperature-based gaseous propellanttank leak-detection algorithm was found to be a useful
tool, but could not be relied upon to detect all hazardous
leaks. This algorithm could detect moderate to largetank leaks, or smaller leaks over a long period of time.However it could not detect small, but still hazardous,
leaks in a timely manner, nor did it detect leaks in the
H 2 lines or during flow.
The pod thermal environment was found to be
surprisingly benign throughout the mission, up to
Mach 1.6 and an altitude of 50,000 ft, given the wide
range of static and total temperatures. The water mist
system was never used in flight, because additional
cooling was not necessary, and because of concerns
about hardware damage from water condensation.
Detailed control room displays proved indispensable
during the extended development and troubleshooting
program, and for determining system status and
performance.
References
h'Safety Standard for Hydrogen and Hydrogen
Systems," NASA NSS-1740.16, Office of Safety and
Mission Assurance, Washington DC, 1995.
2"Safety Standard for Oxygen and Oxygen Systems,"
NASA NSS-1740.15, Office of Safety and Mission
Assurance, Washington DC, 1996.
3Corda, Stephen, David E Lux, Edward T. Schneider,
and Robert R. Meyer Jr., "Blackbird Puts LASRE to the
Test," Aerospace America, vol. 36, no. 2, pp. 24-29,Feb. 1998.
4"Standard General Requirements for Safe Design
and Operation of Pressurized Missile and Space
Systems," MIL-STD-1522A (USAF), May 1984.
5Benz, E J. and E L. Boucher, "Flammability
Characteristics of Hydrogen/Oxygen/Nitrogen Mixtures
at Reduced Pressures," in: Proceedings of the Workshop
on the Impact of Hydrogen on Water Reactor Safety,
vol. 3, M. Berman, ed., SAND-81-0661, vol. 3, 1981.
6Miller, S. L., K. L. Hughes, J. L. Rodriguez, and E J.
McWhorter, "Calibration and Characterization of Wide
Range Hydrogen Sensors," in: Advanced Earth-to-Orbit
Propulsion Technology Conference, CP-3282, vol. 1,
Huntsville, AL, 1994.
7Hunter, Gary W., A Survey and Analysis of
Commercially Available Hydrogen Sensors, NASA
TM- 105878, 1992.
8Hunter, Gary W., A Survey and Analysis of
Experimental Hydrogen Sensors, NASA TM-106300,1992.
16American Institute of Aeronautics and Astronautics

Form ApprovedREPORT DOCUMENTATION PAGE OMBNo.0 04-0188
Public reporting burden for this collection of information is estimated to average 1 hour per response, including the time for reviewing instructions, searching existing data sources, gathering and
maintaining the data needed, and completing and reviewing the collection of information. Send comments regarding this burden estimate or any other aspect of this collection of information,
including suggestions for reducing this burden, to Washington Headquarters Services, Directorate for Information Operations and Reports, 1215 Jefferson Davis Highway, Suite 1204, Arlington,
VA 22202-4302, and to the Office of Management and Budget, Paperwork Reduction Project (0704-0188), Washington, DC 20503.
1. AGENCY USE ONLY (Leave blank) 2. REPORT DATE 3. REPORTTYPE AND DATES COVERED
July 1998 Technical Memorandum
4.TITLE AND SUBTITLE 5. FUNDING NUMBERS
Linear Aerospike SR-71 Experiment (LASRE): Aerospace Propulsion
Hazard Mitigation SystemsWU 242-33-02-00-33-00-T 15
6. AUTHOR(S)
Masashi Mizukami, Griffin P. Corpening, Ronald J. Ray, Neal Hass,
Kimberly A. Ennix, and Scott M. Lazaroff
7.PERFORMINGORGANIZATIONNAME(S)ANDADDRESS(ES)
NASA Dryden Flight Research CenterP.O. Box 273
Edwards, California 93523-0273
9. SPONSORING/MONITORINGAGENCYNAME(S)ANDADDRESS(ES)
National Aeronautics and Space Administration
Washington, DC 20546-0001
8. PERFORMING ORGANIZATION
REPORT NUMBER
H-2268
1O. SPONSORING/MONITORING
AGENCY REPORT NUMBER
NASA/TM-1998-206561
11. SUPPLEMENTARY NOTES
Presented at the 34th AIAA/ASME/SAE/ASEE Joint Propulsion Conference, Cleveland, Ohio, July 13-15, 1998.Masashi Mizukami, Griffin P. Corpening, Ronald J. Ray, Neal Hass and Kimberly A. Ennix, NASA Dryden FlightResearch Center, Edwards, California; Scott M. Lazaroff, NASA Johnson Space Center, Houston, Texas.
12a. DISTRIBUTION/AVAILABILITY STATEMENT
Unclassified--Unlimited
Subject Category 20
12b. DISTRIBUTION CODE
13. ABSTRACT (Maximum 200 words)
A major hazard posed by the propulsion system of hypersonic and space vehicles is the possibility of fire or
explosion in the vehicle environment. The hazard is mitigated by minimizing or detecting, in the vehicle
environment, the three ingredients essential to producing fire: fuel, oxidizer, and an ignition source. The Linear
Aerospike SR-71 Experiment (LASRE) consisted of a linear aerospike rocket engine integrated into one-half
of an X-33-1ike lifting body shape, carried on top of an SR-71 aircraft. Gaseous hydrogen and liquid oxygen
were used as propellants. Although LASRE is a one-of-a-kind experimental system, it must be rated for piloted
flight, so this test presented a unique challenge. To help meet safety requirements, the following propulsion
hazard mitigation systems were incorporated into the experiment: pod inert purge, oxygen sensors, a hydrogen
leak detection algorithm, hydrogen sensors, fire detection and pod temperature thermocouples, water misting,
and control room displays. These systems are described, and their development discussed. Analyses, ground
test, and flight test results are presented, as are findings and lessons learned.
14. SUBJECTTERMS
Fire prevention, Flight safety, Hypersonic vehicles, Reusable launch vehicles,
Rocket engines
17. SECURITY CLASSIFICATION
OF REPORT
Unclassified
NSN 7540-01-280-5500
18. SECURITY CLASSIFICATION
OFTHIS PAGE
Unclassified
19. SECURITY CLASSIFICATION
OF ABSTRACT
Unclassified
15. NUMBER OF PAGES
22
16. PRICE CODE
A03
20. LIMITATION OF ABSTRACT
Unlimited
Standard Form 298 (Rev. 2-89)Prescribed by ANSI Std. Z39-18
298-102