Economic Partnership Agreements: Managing Revenue Implications

Making all the difference for business.
LincolnN E B R A S K A
Detailed Lincoln, Nebraska Data
LINCOLN PARTNERSHIP FOR ECONOMIC DEVELOPMENT1135 M STREET, SUITE 200
LINCOLN, NE 68508402.436.2350
WWW.SELECTLINCOLN.ORG

1135 M Street, Suite 200Lincoln, NE 68508
402.436.2350
Detailed Economic and Demographic Tables(Developed in Accordance with IEDC Recommendations)
Table 1 Demographic Characteristics
Table 2 Labor Force Characteristics
Table 3 Leading Employers: Overall and By Selected Sectors
Table 4 Research Base
Table 5 Higher Education Resources - 4 Year Institutions
Table 6 Higher Education Resources - Community and Junior Colleges
Table 7 Vocational/Technical Center Resources, Excluding Community Colleges
Table 8 Elementary and Secondary Education
Table 9 Establishments, Employment and Average Annual Salary by Industry
Table 10 Employment and Average Salary By Selected Occupation
Table 11 Nebraska Worker’s Compensation and Unemployment Insurance
Table 12 Labor Management Relations
Table 13 Transportation
Table 14 Taxation
Table 15 Commercial Real Estate Occupancy/Supply
Table 16 Utilities
Table 17 Environmental
Table 18 Government
Table 19 International Resources
Table 20 Quality of Life

Table 1: Demographic CharacteristicsAll data are for Lincoln MSA unless otherwise indicated. Lincoln MSA comprises Lancaster & Seward counties.
A. Total Population
1990 2000 2010 2011 % chg 90-11 % chg 10-11Lincoln MSA 229,091 266,787 302,954 306,503 25.3% 1.2%
City of Lincoln 191,972 225,581 258,381 262,341 26.8% 1.5%Labor Market Population* 331,729 376,532 407,868 418,230 20.7% 2.5%
B. Distribution of Population by Age, 2010
Under 5 years 7.2%5 to 9 years 6.3%10 to 14 years 5.7%15 to 19 years 7.7%20 to 24 years 12.0%25 to 34 years 22.7%35 to 44 years 12.0%45 to 54 years 12.7%55 to 59 years 5.6%60 to 64 years 4.5%65 to 74 years 5.3%75 to 84 years 3.7%85 years and over 1.7%Median age (years) 31.7
C. Components of Population Change, 2000 to 2009
2000-2009 % chg 2010-2011 % chgTotal change 31,225 11.7% 4,346 1.4% Natural increase 21,821 2,932 Net migration 11,147 1,426 International 6,828 595 Internal 4,319 831
D. Household Income, 2010
Total households 119,268 100.0%Less than $10,000 8,170 6.8%$10,000 to $14,999 6,209 5.2%$15,000 to $24,999 12,651 10.6%$25,000 to $34,999 13,853 11.6%$35,000 to $49,999 16,820 14.1%$50,000 to $74,999 23,778 19.9%$75,000 to $99,999 15,923 13.4%$100,000 to $149,999 14,220 11.8%$150,000 to $199,999 4,291 3.8%$200,000 or more 3,353 2.8%
Median household income ($) 55,073

Information submitted herein was received from sources deemed to be reliable. Although we have no reason to doubt the accuracy or completeness of the data, it may be subject to errors or omissions.
*Labor Market Population: Lancaster, Butler, Cass, Gage, Johnson, Otoe, Saline, Saunders and Seward Counties
Sources: A. US Census Bureau, 1990, 2000 and 2010 Censuses of Population, and 2011 Annual Estimates of Population; US Census
Bureau Population Estimates Program, http://www.census.gov/popest; http://quickfacts.census.gov/qfd/index.html B. US Census Bureau,2011 Censuses of Population, Lincoln MSA, General Demographic Characteristics: 2010: http://
quickfacts.census.gov/qfd/states/31/3128000lk.html C. http://www.census.gov/popest/data/counties/totals/2011/CO-EST2011-05.html; http://www.census.gov/popest/data/
counties/totals/2011/index.html D. US Census Bureau, 2011American Community Survey 5-year estimates, Data Profiles, Lincoln MSA, Selected Economic
Characteristics: 2011; includes benefits & adjusted for inflation: S1901
Table 2: Labor Force & EmploymentAll data are for Lincoln MSA unless otherwise indicated. Lincoln MSA comprises Lancaster & Seward counties.
A. Educational Attainment, Population Age 25 and Over, 2010# %
Population 25 years and over 185,073 100%Less than 9th grade 4,418 2.4%9th to 12th grade, no diploma 7,881 4.2%High school graduate (includes equivalency)
44,020 23.8%
Some college, no degree 42,888 23.2%Associate's degree 20,321 11.0%Bachelor's degree 43,597 23.5%Graduate or professional degree 21,948 12.0%
Percent high school graduate or higher 92.9%Percent bachelor's degree or higher 31.2%
B. Labor Force Participation, Unemployment and Employment
2005 2006 2007 2008 2009 2010 2011Total Labor Force (Annual Average) 165,285 165,464 166,762 169,454 168,153 168,680 172,266 Unemployment Rate (Annual Average) 3.60% 2.80% 2.80% 3.00% 4.3% 4.2% 4.0%Employment (Place of Residence) 159,386 160,911 162,955 164,323 160,854 161,540 165,418 Total Nonfarm Employment (Place of Work) 168,500 171,200 172,800 174,300 171,700 171,300 173,100
Participation Rates by Age, 2010 Male Female16 to 19 years: 43.63% 59.28%20 to 24 years: 79.02% 84.24%25 to 44 years: 86.61% 84.44%45 to 54 years: 87.72% 84.38%55 to 64 years: 75.52% 73.82%65 to 74 years: 38.53% 25.51%75 years and over: 11.76% 3.49%
Total 73.38% 69.54%
C. Distribution of Employment by Occupation, 2010%
Management, professional, and related 37.5%Service occupations 15.0%Sales and office occupations 23.7%Natural Resources, construction, and maintenance
11.5%
Production, transportation, and material moving
12.3%
Total 100.0%

D. Nonfarm Employment , Total and By Industry
Lincoln MSA 2005 2006 2007 2008 2009 2010 2011Total non-farm employment (Place of Work) 168,500 171,200 172,800 174,300 171,700 171,300 173,100 By Industry Goods-Producing 23,700 23,700 23,200 22,500 20,400 19,400 19,500 Manufacturing 15,200 15,400 15,300 14,900 13,200 12,600 12,700 Durable Goods 8,800 9,200 9,400 9,300 8,100 7,800 8,000 Non-Durable Goods 6,400 6,200 5,900 5,500 5,100 4,800 4,700 Natural Resources & Construction 8,500 8,300 7,900 7,600 7,200 6,800 6,800 Service-Providing 144,800 147,500 149,700 151,800 151,300 152,000 153,600 Trade,Trans,Warehousing,Utilities 30,300 30,600 31,600 32,600 31,900 31,900 32,600 Total Trade 21,600 21,700 22,000 22,200 21,700 21,700 22,300 Wholesale Trade 4,100 4,100 4,000 4,000 3,900 3,900 4,000 Retail Trade 17,500 17,600 18,000 18,200 17,800 17,800 18,300 Trans,Warehousing,Utilities 8,700 9,000 9,600 10,500 10,200 10,200 10,300 Information 2,600 2,700 2,700 2,400 2,300 2,200 2,200 Financial Activities 12,600 12,900 13,100 13,300 13,200 13,300 13,500 Prof & Bus Services 17,600 18,600 19,000 19,200 17,500 17,600 18,000 Ed & Health Services 22,500 23,000 23,200 23,700 25,100 25,900 25,900 Leisure & Hospitality 15,500 15,700 15,600 15,800 15,600 15,800 16,100 Other Services 6,800 6,800 6,900 7,000 7,000 6,900 6,900 Total Government (Pub Admin) 36,800 37,300 37,500 37,800 38,700 38,400 38,400 Federal Government 2,800 2,700 2,700 2,900 3,000 3,000 2,900 State Government 19,900 20,100 20,200 20,300 20,600 20,400 20,400 Local Government 14,200 14,400 14,600 14,700 15,100 15,000 15,000
E. Long Term Occupational Projections, Lincoln MSA
Industry Title2008
Annual Employment
2018 Projected
Change in Employment
2008-2018% Change 2008-2018
Compound Annual Growth
Total 190,233 210,952 20,719 10.89% 1.04%Total Self-Employed and Unpaid Family Workers
12,429 13,252 823 6.62 0.64
Goods-Producing 25,808 27,051 1,243 4.82% 0.47%Services-Providing 151,996 170,649 18,653 12.27% 1.16%Agriculture, Forestry, and Fishing 2,725 2,485 -240 -8.81% -0.92%Mining 6 6 0 0.00% 0.00%Utilities 701 786 85 12.13% 1.15%Construction 8,192 9,668 1476 18.02% 1.67%Manufacturing 14,885 14,892 7 0.05% 0.00%Wholesale Trade 4,317 4,739 422 9.78% 0.94%Retail Trade 18,212 19,912 1700 9.33% 0.90%Transportation and Warehousing 10,402 12,087 1685 16.20% 1.51%Information 2,667 2,409 -258 -9.67% -1.01%Finance and Insurance 11,953 13,680 1727 14.45% 1.36%Real Estate and Rental and Leasing 1,705 1,878 173 10.15% 0.97%Professional, Scientific, and Technical Services
8,988 10,907 1919 21.35% 1.95%
Management of Companies and Enterprises 3,142 3,527 385 12.25% 1.16%

Administrative & Waste Management Services
7,717 8,142 425 5.51% 0.54%
Educational Services (including state and local gov)
20,226 22,706 2480 12.26% 1.16%
Health Care and Social Assistance 22,048 25,892 3844 17.43% 1.62%Arts, Entertainment, and Recreation 2,625 3,167 542 20.65% 1.89%Accommodation and Food Services 13,275 14,686 1411 10.63% 1.02%Other Services (except Government) 7,035 7,717 682 9.69% 0.93%Government 16,983 18,414 1431 8.43% 0.81%
F. Commute Times 2010
Less than 10 minutes 13.0%10 to 14 minutes 22.2%15 to 19 minutes 24.0%20 to 24 minutes 17.2%25 to 29 minutes 6.6%30 to 34 minutes 7.3%35 to 44 minutes 1.3%45 to 59 minutes 3.0%60 or more minutes 2.7%Mean travel time to work (minutes) 18.8
G. Military Presence
Nebraska Air & Army National Guard 155th Air Refueling Wing67th Infantry Brigade92nd Headquarters Troop Command
Information submitted herein was received from sources deemed to be reliable. Although we have no reason to doubt the accuracy or completeness of the data, it may be subject to errors or omissions.
Sources:A. US Census Bureau, 2010 American Community Survey, Data Profiles, Lincoln MSA, Selected Social Characteristics: 2010 B. US Census Bureau, 2010 American Community Survey, Lincoln MSA, Table B23001 C. US Census Bureau, 2010 American Community Survey, Data Profiles, Lincoln MSA, Selected Economic Characteristics: 2010 D. Nebraska Workforce Development, Labor Force/Workforce Summaries; (accessed 5/27/11) E. Nebraska Workforce Development, 2008-2018 Nebraska Long - Term Occupational Projections for the Lincoln MSA; http://www.dol.
state.ne.us/nwd/workserv/jobcareer/co/proj/ltindproj/Lincoln.xls (accessed 5/28/11) F. US Census Bureau, 2010 American Community Survey, Lincoln MSA, Economic Profile & Table B08303. Travel Time to WorkG.Nebraska National Guard, http://www.neguard.com/
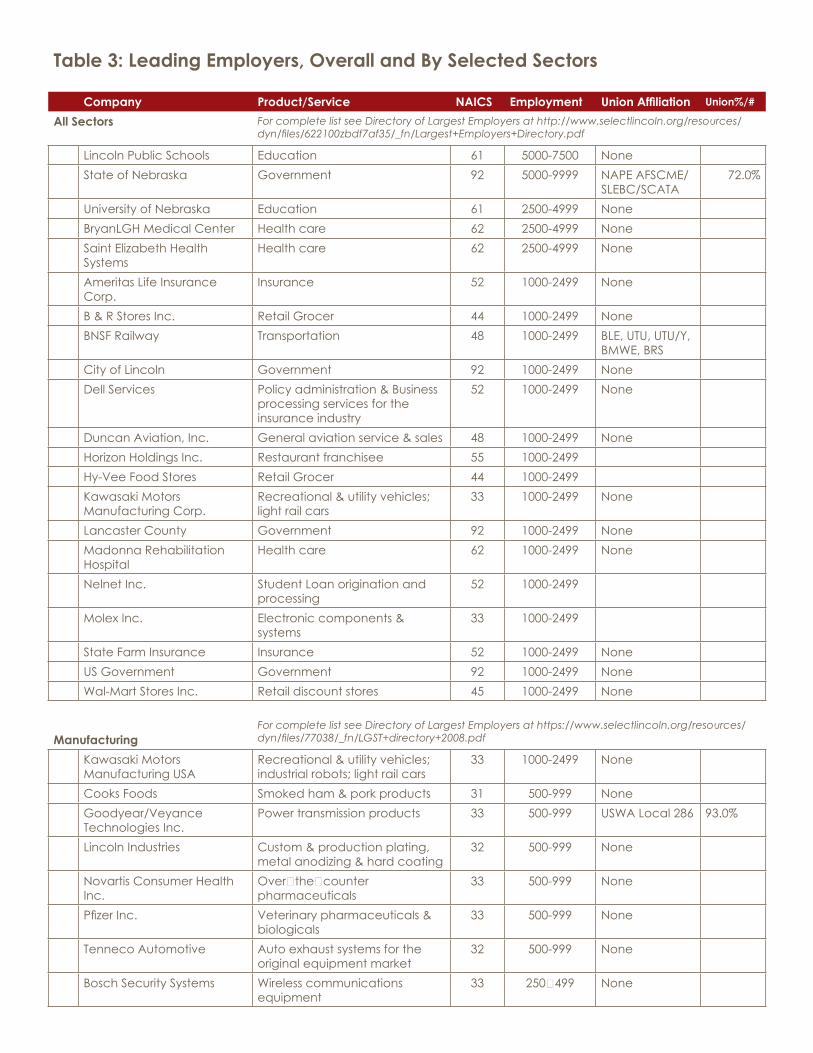
Table 3: Leading Employers, Overall and By Selected Sectors
Company Product/Service NAICS Employment Union Affiliation Union%/#
All Sectors For complete list see Directory of Largest Employers at http://www.selectlincoln.org/resources/dyn/files/622100zbdf7af35/_fn/Largest+Employers+Directory.pdf
Lincoln Public Schools Education 61 5000-7500 NoneState of Nebraska Government 92 5000-9999 NAPE AFSCME/
SLEBC/SCATA72.0%
University of Nebraska Education 61 2500-4999 NoneBryanLGH Medical Center Health care 62 2500-4999 NoneSaint Elizabeth Health Systems
Health care 62 2500-4999 None
Ameritas Life Insurance Corp.
Insurance 52 1000-2499 None
B & R Stores Inc. Retail Grocer 44 1000-2499 NoneBNSF Railway Transportation 48 1000-2499 BLE, UTU, UTU/Y,
BMWE, BRSCity of Lincoln Government 92 1000-2499 NoneDell Services Policy administration & Business
processing services for the insurance industry
52 1000-2499 None
Duncan Aviation, Inc. General aviation service & sales 48 1000-2499 NoneHorizon Holdings Inc. Restaurant franchisee 55 1000-2499Hy-Vee Food Stores Retail Grocer 44 1000-2499Kawasaki Motors Manufacturing Corp.
Recreational & utility vehicles; light rail cars
33 1000-2499 None
Lancaster County Government 92 1000-2499 NoneMadonna Rehabilitation Hospital
Health care 62 1000-2499 None
Nelnet Inc. Student Loan origination and processing
52 1000-2499
Molex Inc. Electronic components & systems
33 1000-2499
State Farm Insurance Insurance 52 1000-2499 NoneUS Government Government 92 1000-2499 NoneWal-Mart Stores Inc. Retail discount stores 45 1000-2499 None
ManufacturingFor complete list see Directory of Largest Employers at https://www.selectlincoln.org/resources/dyn/files/77038/_fn/LGST+directory+2008.pdf
Kawasaki Motors Manufacturing USA
Recreational & utility vehicles; industrial robots; light rail cars
33 1000-2499 None
Cooks Foods Smoked ham & pork products 31 500-999 NoneGoodyear/Veyance Technologies Inc.
Power transmission products 33 500-999 USWA Local 286 93.0%
Lincoln Industries Custom & production plating, metal anodizing & hard coating
32 500-999 None
Novartis Consumer Health Inc.
Over‐the‐counter pharmaceuticals
33 500-999 None
Pfizer Inc. Veterinary pharmaceuticals & biologicals
33 500-999 None
Tenneco Automotive Auto exhaust systems for the original equipment market
32 500-999 None
Bosch Security Systems Wireless communications equipment
33 250‐499 None

Company Product/Service NAICS Employment Union Affiliation Union%/#
Energy Recovery International
Heat recovery steam generators
33 250-499 None
Hughes Brothers Inc. Wood, metal & fiberglass products, including fiberglass rebar
32 250-499 None
Lester Electrical Inc. Industrial battery chargers & power mgmt systems
33 250-499 None
Li‐Cor Biosciences Integrated instrument systems for biotechnology
33 250-499 None
MBA Poultry Air‐chilled poultry products 31 250-499 NoneSquare D Company Electronic circuit breakers 33 250-499 IBEWTeledyne Isco Wastewater samplers, water
flow measuring equipment33 250-499 None
Public SectorState of Nebraska Government 92 5000-7500 NAPE AFSCME/
SLEBC/SCATA72%
University of Nebraska Education 61 2500-4999 NoneCity of Lincoln Government 92 1000-2499 NoneLancaster County Government 92 1000-2499 NoneUS Government Government 92 1000-2499 NoneSI International Government 92 500-999 NoneNebraska Army & Air National Guard
Government 92 250-499 None
InsuranceAmeritas Life Insurance Company
Insurance 52 1000‐2499 None
Dell Services Policy administration & business processing services
52 1000-2499 None
State Farm Insurance Insurance 52 1000‐2499 NoneLincoln Benefit Life Company, Inc.
Insurance 52 500‐999 None
Allied Insurance Insurance 52 250-499 NoneAssurity Life Insurance Company
Insurance 52 250-499 None
Continental Western Group Insurance 52 100-249 NoneFarm Bureau Financial Services
Insurance 52 100-249 None
Farmers Mutual Insurance Co. of Nebraska
Insurance 52 100-249 None
Transportation & DistributionBNSF Railway Transportation 48 1000-2499 BLE, UTU, UTU/Y,
BMWE, BRSDuncan Aviation Aviation service; avionics
inspection, installation & service48 1000-2499 None
Crete Carrier Corporation Transportation 48 500-999 NonePegler Sysco Wholesale food distribution 42 250-499 None
Information submitted herein was received from sources deemed to be reliable. Although we have no reason to doubt the accuracy or completeness of the data, it may be subject to errors or omissions.
Lincoln Partnership for Economic Development, Directory of Largest Employers, 2011
Table 4: Research Base
Name of Center Affiliation Research SpecialityUniversity of Nebraska‐Lincoln University Land‐grant research university; primary doctoral degree
granting institution in the state. See http://www.unl.edu/ucomm/research/
University of Nebraska Technology Park University Foundation
Promotes synergy between the University of Nebraska and park tenants by facilitating technology transfer and interaction with the private sector via basic and applied research of technology based projects and services. http://www.nebraskatechpark.com/
University of Nebraska Innovation Campus
University "Seeks to develop a premier private/public-sector sustainable research campus, capitalizing on research growth and the expertise of UNL faculty. http://innovate.unl.edu/"
Agricultural Processing & BiotechnologyAgricultural Research Division (ARD) University Agricultural profitability and value‐added processing of
agricultural commodities; bioengineering; bioinformatics and biological modeling; biotechnology and molecular biology; food safety and molecular nutrition; genomics, proteomics and structural biology; meteorology and climatology, and water resources and hydrologic sciences.
ARS University Soil & water conservation; Improve the productivity, stability of production, sustainability and profitability of crop and livestock production systems in the Great Plains.
Food Processing Center University Market research, product costing, ingredient sourcing, market testing, and business venture development for the food industry.
Benchmark Biolabs Corporate Laboratory services & reagents for veterinary vaccine researchers; mfg vaccines
GeneSeek (Neogen) Corporate DNA-based diagnostic products & servicesLi-Cor Biosciences Corporate "Instrumental systems for biotechnology, plant biology and
environmental research. "
Celerion Corporate Drug development & discovery solutions-ligand binding services
Merial Corporate IGENITY brand DNA testing services for dairy and beef producers
National Agroforestry Center Non‐Profit Tree-based buffer technologiesNature Technology Corporate DNA vectors for vaccine deliveryNebraska District Office of Water Resources
Federal Government
Groundwater systems, supply; and quality.
Novartis Consumer Health Inc. Corporate PharmaceuticalsPfizer Global Manufacturing, Inc. Corporate Veterinary pharamaceuticalsCenter for Plant Science Innovation University Plant biology research including plant‐microbe interactions,
plant signaling & organellar biology, abiotic and biotic stress responses, and genomics/proteomics.
Rieke Metals Corporate Organic metals and conductive polymers; pharmaceutical research reagents
Teledyne ISCO, Inc. Corporate Wastewater samplers, water flow measuring equip., liquid chromatography products, pumps
University of Nebraska Southeast Research and Extension Center
University Agriculture & Natural Resources, Consumer and family economics, community and economic development, 4-H/youth development

Specialty ElectronicsCenter for Electro-Optics University Electro‐magnetic and optical technology research for
government and private sector organizations.Center for Microelectric & Optical Mate-rials Research University A leading research facility for ellipsometry and process diag-
nostics.Nebraska Center for Materials and Nanoscience
University Research in magnetic materials at the nanoscale that has applications in advanced speciality electronics.
Nebraska Center for Excellence in Electronics (NCEE)
Technology Park
Full‐service electronics testing facility.
J.A. Woollam Co, Inc. Corporate Spectroscopic ellipsometryLaird Technologies Corporate Research & development of antennas & wireless power
productsRieke Metals Corporate Organic metals and conductive polymers; pharmaceutical
research reagentsRieke Metals Corporate Organic metals and conductive polymers; pharmaceutical
research reagents
Warehousing/Distribution/LogisticsMid‐America Transportation Center University Conducts research & educational activities aimed at
improving the design and operation of transportation facilities.
Customer Support Centers and Software DevelopmentCenter for Applied Land Management Information Technology (CALMIT)
University Remote sensing, geographic information systems, global positioning systems. http://www.calmit.unl.edu/calmit/
Holland Computer Center University Home to Prairie Fire, a 256 processor supercomputer that enables advanced simulation to perform product analysis, design, development, testing and manufacturing in a virtual environment.
Jeffrey S. Raikes School of Computer Science & Management (formerly JD Edwards Honors Program)
University An innovative integration of computer science and management education, including a 2-year applied software design studio.
Public Opinion & Market ResearchGallup Research Center University Survey research & quantitative methods including public
opinion, consumer and employee satisfaction, and data utilization in the workplace.
Fairfield Research Inc. Corporate Market Research - Interactive MediaKenexa Corporate Performance measurement; HR consultingNational Research Corp. Corporate Healthcare - performance measurementService Research Corporation Corporate Market research; HR consulting; software design
Information submitted herein was received from sources deemed to be reliable. Although we have no reason to doubt the accuracy or completeness of the data, it may be subject to errors or omissions.

Table 5: Higher Education Resources--4 Year Institutions
University of Nebraska-Lincoln www.unl.eduType: Public Doctoral/Research University--Extensive ; Bachelor's, Master's, PhD and First Professional Degrees
Enrollment, Fall 2011 Bachelor's Degrees Awarded 2008-09 2009-10 2010-11Total 24,593 100% Agriculture, Agriculture Oper & Related
Sciences214 244 268
Undergraduate 19,345 79% Architecture and Related Services 77 81 89 Undergraduate, full-time 17,990 93% Area, Ethnic, Cultural, & Gender Studies 2 4 9Graduate, Professional 5,248 21% Biological & Biomedical Sciences 153 156 181
Business, Management, Marketing 713 668 750Communication, Journalism & Related Programs
212 248 250
Computer & Information Science 24 31 33Education 315 275 294Engineering, incl. Computer Engr 328 326 363Engineering Technologies 117 106 83English Language & Literature/Letters 69 84 81Family & Consumer Sciences 260 248 336Foreign Languages, Literatures & Linguistics 43 49 46Health Professions & Related Clinical Sciences
61 46 73
History 67 80 65Homeland Security, Law Enforcement, Firefighting
NA 7 15
Liberal Arts & Sciences 3 5 2
Mathematics & Statistics 24 32 33Multi-Interdisciplinary Studies 5 3 10Natural Resources & Conservation 54 66 74Parks, Recreation & Leisure 0 0 0Philosophy & Religious Studies 9 6 7Physical Sciences 30 38 49Psychology 168 191 185Social Sciences 161 204 187Visual & Performing Arts 109 114 138Total Bachelors Degrees Awarded 3,219 3,312 3,621
Nebraska Wesleyan University www.nebrwesleyan.eduType: Private not-for-profit, Baccalaureate--Liberal Arts; Bachelor's and Master's Degrees
Enrollment, Fall 2011 Bachelor's Degrees: Selected Fields 2008-09 2009-10 2010-11Total 2,070 100% Biological and Biomedical Sciences 44 45 39Undergraduate 1,781 86% Business, Management, Marketing 96 66 78 Undergraduate, full-time 1,567 88% Communication, Journalism, and Related
ProgramsNA 5 32
Graduate, Professional 289 14% Computer and Information Sciences and Support Services
NA 3 4
Education 22 27 34English Language & Literature/Letters 31 24 30Foreign Languages, Literatures & Linguistics 8 6 12

Health Professions & Related 41 51 48History NA 7 10Mathematics and Statistics NA 4 5Multi/Interdisciplinary Studies NA 7 4Parks, Recreation, Leisure & Fitness Studies 35 40 38Philosophy and Religious Studies NA 2 6Physical Sciences 6 6 3Psychology 33 40 33Public Administration & Social Service Professions
15 12 15
Social Sciences 14 13 16Visual & Performing Arts 31 29 24Total Bachelors Degrees Awarded 404 387 431
Doane College (Crete & Lincoln Campuses) www.doane.eduType: Private not-for-profit; Master’s College/University II; Bachelor's and Master's Degrees
Enrollment, Fall 2011 Bachelor's Degrees: Selected Fields 2009-10 2010-11Total 2,701 100% Biological and Biomedical Sciences 15 16Undergraduate 1,835 68% Business, Management, Marketing 182 171 Undergraduate, full-time 1,284 70% Communication, Journalism & Related 14 10Graduate 866 32% Computer and Information Sciences and
Support Services5 6
Education 38 47English Language and Literature/Letters 13 7Family and Consumer Sciences/Human Sciences
1 2
Foreign Languages, Literatures, and Linguistics
1 3
History 7 9Health Professions and Related Programs 4 3Homeland Security, Law Enforcement, Firefighting
NA 4
Legal Professions and Studies 5 6Liberal Arts and Sciences, General Studies and Humanities
16 20
Mathematics and Statistics 8 6Multi/Interdisciplinary Studies NA 1Natural Resources and Conservation 1 2Philosophy and Religious Studies NA 1Physical Sciences 2 4Psychology 8 10Public Administration andSocial Service Professions
6 7
Social Sciences 14 16Visual and Performing Arts 36 31Total Bachelors Degrees Awarded 376 382

Table 5: Higher Education Resources--4 Year Institutions
Concordia University (Seward) www.cune.eduType: Private not-for-profit, Baccalaureate--Liberal Arts; Bachelor's and Master's Degrees
Enrollment, Fall 2011 Bachelor's Degrees: Selected Fields 2008-09 2009-10 2010-11Total 2,196 100% Biological and Biomedical Sciences 15 25 13
Undergraduate 1,552 71% Business, Management, Marketing 28 26 55 Undergraduate, full-time 1,148 74% Communication, journalism, and related
programs11 7 8
Graduate 644 29% Computer and Information Sciences and Support Services
NA 2 1
Education 88 78 85English Language and Literature/Letters NA 6 4Foreign Languages, Literatures & Linguistics NA NA 3History NA 11 7Mathematics and Statistics NA 1 1Multi/Interdisciplinary Studies NA 6 8Natural Resources and Conservation NA NA 1Parks, Recreation, Leisure, and Fitness Studies
NA 13 10
Physical Sciences NA 2 2Psychology NA 22 8Social Sciences NA 4 4Theology and religious vocations 24 8 24
Visual and performing arts 16 15 21
Total Bachelors Degrees Awarded 234 226 255
Union College www.ucollege.eduType: Private not-for-profit, Baccalaureate--Liberal Arts; Bachelor's and Master's Degrees
Enrollment, Fall 2011 Bachelor's Degrees: Selected Fields 2008-09 2009-10 2010-11Total 886 100% Biological and Biomedical Sciences 5 7 8Undergraduate 810 91% Business, Management, Marketing 27 21 17 Undergraduate, full-time 672 83% Communication, Journalism, and Related
ProgramsNA 8 8
Graduate 76 9% Computer and Information Sciences and Support Services
NA 7 3
Education 21 11 21English Language and Literature/Letters NA NA 1Foreign Languages, Literatures, and Linguistics
NA 3 8

Foreign Languages, Literatures, and Linguistics
NA 3 8
Health Professions & Related 51 38 60History NA NA 3Liberal Arts and Sciences, General Studies and Humanities
NA 4 4
Mathematics and Statistics NA 1 0Multi/Interdisciplinary Studies NA NA 1Parks, Recreation, Leisure, and Fitness Studies
NA 5 2
Physical Sciences NA 3 1Psychology NA 5 10Public Administration andSocial Service Professions
NA 3 5
Social Sciences NA 1 0Theology and Religious Vocations NA 1 11Visual and Performing Arts NA 8 1Total Bachelors Degrees Awarded 178 126 164
BryanLGH College of Health Sciences www.bryanlgh.com/collegeofhealthsciences
Type: Private not-for-profit, Baccalaureate--Health ; Bachelor’s and Master’s Degrees
Enrollment, Fall 2011 Bachelor's Degrees: Selected Fields 2008-09 2009-10 2010-11Total 636 100% Health Professions & Related NA 69 82Undergraduate 562 88% Total Bachelors Degrees Awarded NA 69 82 Undergraduate, full-time 320 57%Graduate 74 12%
Information submitted herein was received from sources deemed to be reliable. Although we have no reason to doubt the accuracy or completeness of the data, it may be subject to errors or omissions. Source: National Center for Education Statistics, College Navigator, http://nces.ed.gov/collegenavigator/ (accessed 1/12/13)

Table 6: Higher Education Resources - Community & Associates Colleges
Southeast Community College System*Type: Public, 2-year, Associate’s Degrees, Certification Programs
Enrollment, Fall 2011 Associate's Degrees, Total & Selected Fields 2009-10 2010-11Total 11,479 Agriculture, Agriculture Operations & Related
Sciences63 65
Full-Time 54% Business, Management, Marketing 234 235Part-Time 46% Communications Technologies/Technicians &
Support Svcs40 46
Construction Trades 34 33*3 campuses: Lincoln, Beatrice, Milford
Engineering Technologies/Technicians 130 133Family and Consumer Sciences/Human Sciences 19 17Health Professions and Related Clinical Sciences 201 237Homeland Security, Law Enforcement, Fire Fighting 65 87Liberal Arts & Sciences, General Studies & Humanities
191 207
Mechanic and Repair Technologies/Technicians 176 153Personal and Culinary Services 29 24Precision Production 75 59Science Technologies/Technicians 8 7Visual and Performing Arts 29 36Total Associate's Degrees 1296 1339
Certificates, Total & Major Fields 2009-10 2010-11Business, Management, Marketing 16 13Computer & Information Sciences 5 4Engineering Technologies/Technicians 3 1Family and Consumer Sciences/Human Sciences 3 4Health Professions and Related Clinical Sciences 175 192Mechanic and Repair Technologies/Technicians 26 27Personal and Culinary Services 17 12Precision Production 10 8Transportation & Materials Moving 69 73Visual and Performing Arts 2 1Total Certificates 326 335

*Kaplan University--Lincoln Campus
Type: Private for-profit; Associate’s & Bachelor’s Degrees, Certification Programs
Enrollment, Fall 2011 Associate's Degrees 2009-10 2010-11Total 469 Business, Management, Marketing, & Related
Support Svcs21 34
Full-Time 68% Computer & Information Sciences & Support Svcs 14 6Part-Time 32% Education NA 1
Health Professions and Related Clinical Sciences 24 77*Formerly Hamilton College
Homeland Security and Law Enforcement 18 32Legal Professions and Studies 10 12
Security & Protective Svcs 2 2Total Associate's Degrees 89 164
Bachelor's Degrees 2009-10 2010-11Business, Management, Marketing, & Related Support Svcs
8 15
Computer and Information Sciences and Support Svcs
NA 1
Health Professions and Related Clinical Sciences NA 1Homeland Security and Law Enforcement 9 14Total Bachelor's Degrees 17 31
Information submitted herein was received from sources deemed to be reliable. Although we have no reason to doubt the accuracy or completeness of the data, it may be subject to errors or omissions.Source:National Center for Education Statistics, College Navigator, http://nces.ed.gov/collegenavigator/ (accessed 1/12/13).

Table 7: Vocational/Technical Center Resources, Excluding Community CollegesNebraska Institute of Technology http://www.neit.org/#
Program Certificate Diploma Associate SeminarsElectronic Technician X HydraulicsMicrocomputer Applications X PneumaticsComputer Service Technician X Electrical Electronics Service Technician X Programmable Logic ControllersIndustrial Service Technician X Mechanical Power TrainsInformation Management Systems XInformation Systems Technology XInternet Systems Management XMicrocomputer Programming XComputer Science XElectronic Technology XIndustrial Technology X
Nebraska Workforce Development, Worker Training Program
Access information at: http://traininglink.dol.state.ne.us/
New Horizons Computer Learning Center http://www.newhorizons.com
Certifications: Microsoft / Cisco / Information Security / CompTIA / Linux / Novell / CitrixSelected training tracks:A+ InDesign CS5 Medical Coding Microsoft .NETDreamweaver CS6 InDesign CS6 Medical Insurance Microsoft OfficeIllustrator Linux Medical Office Photoshop CS
Easel Solutions (formerly Tech Ed Solutions) http://www.techedsolutions.com
Adobe Microsoft MiscellaneousAcrobat Professional Access Cascading Style SheetsAcrobat Connect Professional Excel Crystal ReportsAfterEffects Outlook HTMLAuthorware PowerPoint QuarkXpressCaptivate Project Mac OSXColdFusion PublisherDreamweaver VisioFireworks WordFlashFlexIllustratorInDesignLightroomLiveCycle Designer FormsPhotoshopPresenterRobohelp
Information submitted herein was received from sources deemed to be reliable. Although we have no reason to doubt the accuracy or completeness of the data, it may be subject to errors or omissions.Sources:Institution/organization web sites

Table 8: Elementary & Secondary Education
A. Public Schools
1. School District Profile: Lincoln Public SchoolsTotal Enrollment (2010-11) 35,861Enrollment by Race/EthnicityWhite/Other 69.8%American Indian or Alaskan Native 0.9%Black or African American 6.6%Asian 4.5%Hispanic/Latino 11.7%Native Hawaiian or Pacific Islander 0.1%Two or More Races 6.4%Total Minority 30.2%Spending per StudentTotal (2011-2012) $9,755Regular Instructional $6,487
2. 5th & 8th Grade Metropolitan Achievement Test Results3rd Grade 8th Grade
Reading Average District
AverageState
AverageDistrict
Average State
2010-2011 60 62 58 562011-2012 60 60 58 56Mathematics Average
DistrictAverage
StateAverageDistrict
Average State
2010-2011 58 59 55 552011-2012 58 58 55 55Total Score Average
DistrictAverage
StateAverageDistrict
Average State
2010-2011 62 63 57 562011-2012 62 62 57 56Total Score Tested Percentage Not
TestedPercentage
2010-2011 4,766 93.71% 320 6.29%
2011-2012 5,027 94.30% 304 5.70%
3. ACT Average ScoresAll Students
Years LPS National State
2007-2008 23.30 21.10 22.102008-2009 23.30 21.10 22.102009-2010 23.20 21.00 22.102010-2011 23.20 21.10 22.10

4. National Merit Scholars (2012)High School Semi Finalists Est. # Graduating Seniors Lincoln East 9 9 304Lincoln High 2 2 262Lincoln Northeast 1 1 263Lincoln Southeast 5 5 416Lincoln Southwest (opened 2002) 3 3 456Lincoln North Star (opened 2003) 1 1 374Total 21 21 2075
% of High School Seniors attending college 73.8%Mandatory Competency Testing for Graduation Yes
5. Specialized ProgramsFocus ProgramsEntrepreneurial Focus Program: collaboration with Gallup OrganizationInformation Technology Focus Program: Students attend school for regular classes and go off site for tech programs.Science Focus Program: All classes, all day held at the Lincoln Zoo.Arts & Humanities Focus Program Career and technical educational department programsTech Prep Programs: All LPS high schools offer classes in CAD, Business Mgt., etc. for college creditOccupational Clusters or Career Pathways: Lincoln North Star
B. Parochial & Private Schools Enrollment Contact
Total Enrollment (Spring 2010)
School Grade rangeTotal Enrollment (excluding PK)
Preschool enrollment Phone number
AdventistHelen Hyatt Elementary K-8 134 402-483-1181 College View Acadmey 9-12 75 — 402-483-1181 George Stone Elementary 2-8 30 __ 402-486-2896
CatholicPius X High School 9-12 1065 __ 402-488-0931 Blessed Sacrament Elementary School
PK-8 133 20 402-476-6202
Cathedral of the Risen Christ Elementary
K-8 341 43 402-489-9621
North American Martyrs School PK-8 497 73 402-476-7373 Sacred Heart Elementary School
PK-8 176 24 402-476-1783
St. John's Elementary School PK-8 289 45 402-486-1860St. Joseph's Catholic School PK-8 542 41 402-489-0341 St. Mary's Elementary School PK-8 133 17 402-476-3987 St. Patrick's Elementary School PK-8 116 14 402-466-3710St. Peter's Catholic School PK-8 473 49 402-421-6299 St. Teresa Elementary School PK-8 289 22 402-477-3358 Villa Marie School ungraded
special education
14 — 402-786-3625

ChristianLincoln Christian School PK-12 481 42 402-488-8888Parkview Christian School PK-12 128 48 402-474-5820Home SchoolNebraska Christian Home Educators Assoc.
PK-12 — — 402-423-9476
LutheranLincoln Lutheran Jr/Sr High School 6-12 380 _ 402-467-5404Christ Elementary School PK-5 69 42 402 483-7774Faith Lutheran School PK-6 126 195 402-466-6861Good Shepherd Lutheran School PK-8 19 89 402-423-7677Messiah Lutheran Elementary School PK-5 169 145 402-489-3024St. Mark Elementary School K-8 22 — 402-423-1497Trinity Kindergarten Program PK-K 11 — 402-475-9731Trinity Lutheran Elementary School PK-5 117 42 402-466-1800PrivatePrairie Hill Learning Center (Roca, NE) 18 mo.-14
yr. olds38 — 402-438-6668
Child View Montessori 18 mo.-6 yr. olds
3 26 402-484-8277
Lincoln Montessori 30 mo.-6 yr. olds
25 - 402-489-8110
Children's Circle Montessori 18 mo.-6 yr. olds
5 22 402-489-0872
Berniklau Ed Solutions 9-19 yr. olds
25 — 402-420-2888
Information submitted herein was received from sources deemed to be reliable. Although we have no reason to doubt the accuracy or completeness of the data, it may be subject to errors or omissions.
Sources:A.4 “Percent of Students Enrolled in College at Any Time During the First Year After High School, 2008”
National Student Clearing House graduate follow up study (2009) Lincoln Public Schools; Assessment, Evaluation, and Testing Services; Rob McEntarfer
A.5 Lincoln Public Schools; Focus Programs; John Neal Lincoln Public Schools; Career and Technical Education Department; Andringa, Carol
B. National Center for Education Statistics, Private School Universe Survey, http://nces.ed.gov/surveys/pss/privateschoolsearch/ (accessed 1/12/13)

Table 9: Establishments, Employment & Avg. Annual Salary by Industry
Lincoln MSA, 2010 Estab. Avg Emp Avg Weekly Avg Annual Total WagesTotal, All Industries 9,527 149,640 $710 $36,896 $5,521,049,196 Natural Resources& Mining 67 471 $511 $26,572 $12,515,412 Construction 1,005 7,312 $765 $39,780 $290,871,360 Manufacturing 263 13,347 $906 $47,134 $629,098,080 Trade, Transportation & Utilities 1,755 32,843 $641 $33,332 $1,094,722,876 Information 120 2,150 $839 $43,628 $93,800,200 Financial Activities 1,000 12,062 $930 $48,360 $583,318,320 Professional & Business Services 1,558 18,380 $809 $42,068 $773,209,840 Education & Health Services 1,047 40,798 $790 $41,080 $1,675,981,840 Leisure & Hospitality 815 16,395 $251 $13,052 $213,987,540 Other Services 1,897 5,882 $502 $26,104 $153,543,728
Total Government 326 32,931 $850 $44,179 $1,454,867,360 Local Government 69 14,202 $744 $38,672 $549,220,192 State Government 179 15,684 $884 $45,947 $720,630,290 Federal Government 78 3036 $1,172 $60,941 $185,016,878 Total All Industry/Ownership: 9,853 182,571 $735 $38,209 $6,975,916,556
Information submitted herein was received from sources deemed to be reliable. Although we have no reason to doubt the accuracy or completeness of the data, it may be subject to errors or omissions.
Sources:• Nebraska Workforce Development, Labor Market Information, Quarterly Census of Employment and Wages in Nebraska by NAICS
Super Sector, 2011• Lincoln MSA accessed 1/11/13

Lincoln MSA Entry wageExper. wage
Median wage
Lincoln MSA (4Q 2011) Entry wage Exper. wage
Median wage
Total All Occupations $19,164 $50,736 $32,458Management Occupations $50,006 $117,708 $82,447Chief Executives $104,614 $230,097 $173,894General and Operations Managers $52,745 $132,845 $92,192Legislators $17,195 $52,124 $32,052
Advertising and Promotions Managers $52,009 $78,904 $67,314Marketing Managers $61,995 $132,227 $97,904Sales Managers $63,343 $134,784 $95,963Public Relations and Fundraising Managers $64,914 $122,491 $96,872Administrative Services Managers $46,932 $86,572 $64,258Computer and Information Systems Managers $68,221 $11,653 $89,965Financial Managers $74,583 $144,536 $100,678Industrial Production Managers $54,024 $94,243 $78,369Purchasing Managers $65,517 $106,192 $83,314Transportation, Storage, and Distribution Managers $48,327 $91,272 $75,107Compensation and Benefits Managers $65,064 $127,285 $109,512Human Resources Managers $62,490 $104,908 $85,075Training and Development Managers $54,242 $128,403 $105,077Construction Managers $52,424 $101,401 $75,616Education Administrators, Preschool and Childcare Center/Program $33,054 $43,840 $40,314Education Administrators, Elementary and Secondary School $74,625 $105,901 $99,065Education Administrators, Postsecondary $44,601 $129,805 $76,077Architectural and Engineering Managers $83,336 $122,752 $102,594Food Service Managers $36,277 $60,118 $50,248Lodging Managers $35,604 $61,193 $48,773Medical and Health Services Managers $55,765 $105,856 $78,287Postmasters and Mail Superintendents $34,218 $62,545 $52,853Property, Real Estate, and Community Association Managers $69,247 $125,143 $85,138Social and Community Service Managers $40,456 $64,321 $55,315Emergency Management Directors $37,442 $49,287 $41,902Managers, All Other $54,574 $92,905 $74,826
Business and Financial Operations Occupations $37,212 $71,422 $55,405Buyers and Purchasing Agents, Farm Products $48,152 $77,426 $63,203Wholesale and Retail Buyers, Except Farm Products $32,175 $61,334 $47,593Purchasing Agents, Except Wholesale, Retail, and Farm Products $30,359 $55,839 $45,489Claims Adjusters, Examiners, and Investigators $38,026 $68,448 $53,908Compliance Officers $45,626 $75,651 $64,657Cost Estimators $34,160 $61,873 $50,623Logisticians $49,948 $75,326 $64,413Management Analysts $39,587 $70,875 $54,865
Table 10: Employment and Average Salary By Selected Occupation

Lincoln MSA Entry wageExper. wage
Median wage
Meeting, Convention, and Event Planners $32,000 $45,132 $39,541Compensation, Benefits, and Job Analysis Specialists $43,567 $69,907 $57,215Training and Development Specialists $38,286 $61,140 $51,803Market Research Analysts and Marketing Specialists $32,350 $65,170 $47,180Business Operations Specialists, All Other $37,954 $75,083 $60,498Accountants and Auditors $39,538 $73,725 $54,894Appraisers and Assessors of Real Estate $32,743 $67,360 $51,651Credit Analysts $42,816 $83,449 $62,223Financial Analysts $43,062 $74,552 $58,479Personal Financial Advisors $35,348 $72,193 $47,851Insurance Underwriters $39,501 $68,775 $55,446Financial Examiners $43,466 $75,965 $62,630Loan Officers $44,238 $93,143 $71,747Financial Specialists, All Other $39,234 $99,232 $62,603
Computer and Mathematical Occupations $37,788 $68,953 $54,864Computer Systems Analysts $45,727 $71,712 $59,752Computer Programmers $42,861 $75,173 $63,732Software Developers, Applications $42,839 $76,759 $61,404Software Developers, Systems Software $41,490 $71,656 $58,090Database Administrators $47,171 $81,932 $68,541Network and Computer Systems Administrators $40,136 $68,008 $55,280Actuaries $41,329 $116,644 $83,057
Statisticians $34,516 $57,833 $41,488
Architecture and Engineering Occupations $39,388 $75,659 $60,196Architects, Except Landscape and Naval $54,548 $111,212 $75,733Landscape Architects $49,320 $80,608 $74,853Cartographers and Photogrammetrists $43,759 $67,437 $55,947Surveyors $33,888 $58,635 $48,892Biomedical Engineers $56,772 $83,923 $73,368Civil Engineers $51,281 $86,273 $73,380Electrical Engineers $56,299 $87,435 $78,444Electronics Engineers, Except Computer $56,428 $81,503 $73,863Environmental Engineers $48,034 $80,606 $68,835Industrial Engineers $54,481 $75,790 $64,995Mechanical Engineers $52,650 $81,614 $71,266Engineers, All Other $34,038 $47,530 $43,749Architectural and Civil Drafters $33,219 $52,288 $46,035Electrical and Electronics Drafters $30,679 $43,489 $37,269Mechanical Drafters $32,607 $47,793 $42,469Drafters, All Other $31,195 $50,029 $43,805Civil Engineering Technicians $30,351 $50,954 $43,701Engineers, All Other $38,015 $51,371 $46,961Civil Engineering Technicians $30,867 $49,969 $42,530Mechanical Drafters $35,154 $45,046 $39,870Surveying and Mapping Technicians $32,187 $46,533 $39,054Drafters, All Other $32,407 $50,614 $44,993

Lincoln MSA Entry wageExper. wage
Median wage
Civil Engineering Technicians $31,628 $52,758 $43,911Electrical and Electronic Engineering Technicians $31,857 $55,577 $51,120Electro-Mechanical Technicians $31,857 $55,577 $51,120Environmental Engineering Technicians $33,934 $62,010 $55,245Industrial Engineering Technicians $30,723 $52,296 $42,334Mechanical Engineering Technicians $41,526 $48,123 $45,243Engineering Technicians, Except Drafters, All Other $33,891 $43,218 $36,121Surveying and Mapping Technicians $33,781 $46,145 $40,375
Life, Physical, and Social Science Occupations $35,314 $63,930 $50,944Food Scientists and Technologists $35,266 $56,712 $52,255Soil and Plant Scientists $42,719 $74,564 $62,861Microbiologists $50,076 $72,415 $60,033Conservation Scientists $50,287 $80,058 $62,549Medical Scientists, Except Epidemiologists $42,888 $85,719 $59,737Chemists $45,089 $79,118 $62,084Environmental Scientists and Specialists, Including Health $41,883 $59,132 $51,891Hydrologists $46,180 $69,626 $56,115Survey Researchers $26,245 $64,181 $48,425Clinical, Counseling, and School Psychologists $49,998 $85,524 $73,942Urban and Regional Planners $50,173 $77,441 $68,274Agricultural and Food Science Technicians $27,936 $41,337 $35,668Biological Technicians $21,791 $41,573 $32,373Environmental Science and Protection Technicians, Including Health $34,822 $54,286 $46,669
Sales and Related Occupations $17,349 $39,994 $21,223
First-Line Supervisors of Retail Sales Workers $25,983 $48,433 $35,873First-Line Supervisors of Non-Retail Sales Workers $43,918 $99,852 $73,750
Cashiers $17,565 $20,182 $18,797Counter and Rental Clerks $17,759 $30,812 $21,847Parts Salespersons $18,145 $33,881 $23,398Retail Salespersons $17,604 $25,867 $19,556Advertising Sales Agents $19,319 $59,069 $32,227Insurance Sales Agents $36,985 $102,526 $80,384Securities, Commodities, and Financial Services Sales Agents $37,580 $117,688 $70,362Travel Agents $26,328 $43,675 $37,323Sales Representatives, Services, All Other $28,764 $76,102 $46,948Sales Representatives, Wholesale and Manufacturing, Technical and Scientific Products
$46,777 $100,767 $74,645
Sales Representatives, Wholesale and Manufacturing, Except Technical and Scientific Products
$31,049 $65,198 $47,134
Demonstrators and Product Promoters $17,587 $30,944 $205,888Real Estate Brokers $28,766 $53,469 $32,075Sales Engineers $65,647 $85,376 $81,557Telemarketers $18,241 $19,136 $18,689

Lincoln MSA Entry wageExper. wage
Median wage
Office and Administrative Support Occupations $19,538 $36,580 $28,925
First-Line Supervisors of Office and Administrative Support Workers $33,692 $59,014 $47,410Switchboard Operators, Including Answering Service $21,450 $28,666 $25,966Bill and Account Collectors $23,647 $34,629 $29,705Billing and Posting Clerks $26,417 $38,986 $34,180Bookkeeping, Accounting, and Auditing Clerks $23,816 $37,120 $31,672Payroll and Timekeeping Clerks $26,447 $40,011 $35,323Procurement Clerks $22,917 $37,401 $30,650Tellers $20,428 $25,917 $23,064Brokerage Clerks $26,254 $37,976 $30,681Court, Municipal, and License Clerks $31,018 $37,958 $35,397Credit Authorizers, Checkers, and Clerks $23,626 $32,165 $28,856Customer Service Representatives $19,320 $32,907 $27,542Eligibility Interviewers, Government Programs $33,180 $42,868 $39,565File Clerks $19,982 $30,344 $26,632Hotel, Motel, and Resort Desk Clerks $17,314 $18,660 $18,384Interviewers, Except Eligibility and Loan $17,372 $31,703 $24,482Library Assistants, Clerical $17,661 $27,856 $25,228Loan Interviewers and Clerks $27,774 $40,339 $35,029New Accounts Clerks $31,791 $38,669 $36,289Order Clerks $17,761 $24,395 $19,665Human Resources Assistants, Except Payroll and Timekeeping $25,539 $39,249 $33,593Receptionists and Information Clerks $18,990 $27,952 $24,100Information and Record Clerks, All Other $29,710 $43,084 $37,745Cargo and Freight Agents $27,038 $56,533 $38,460Couriers and Messengers $17,373 $25,104 $21,330Police, Fire, and Ambulance Dispatchers $26,349 $38,205 $32,148Dispatchers, Except Police, Fire, and Ambulance $31,987 $44,885 $38,858Postal Service Clerks $53,451 $55,023 $54,300Postal Service Mail Carriers $45,037 $57,483 $56,777Postal Service Mail Sorters, Processors, and Processing Machine Operators $43,529 $54,399 $54,289Production, Planning, and Expediting Clerks $25,046 $45,751 $38,039Shipping, Receiving, and Traffic Clerks $21,003 $34,354 $28,938Stock Clerks and Order Fillers $17,418 $24,281 $19,703Weighers, Measurers, Checkers, and Samplers, Recordkeeping $27,071 $33,094 $30,150Executive Secretaries and Executive Administrative Assistants $31,928 $45,433 $39,076Legal Secretaries $31,535 $38,795 $36,109Medical Secretaries $25,974 $35,284 $32,090Secretaries and Administrative Assistants, Except Legal, Medical, and Executive $24,191 $35,596 $30,752Computer Operators $24,014 $36,769 $31,531Data Entry Keyers $22,185 $30,323 $27,007Word Processors and Typists $22,470 $33,289 $30,417Desktop Publishers $16,993 $27,772 $25,294Insurance Claims and Policy Processing Clerks $27,203 $40,382 $34,129Mail Clerks and Mail Machine Operators, Except Postal Service $18,739 $26,293 $22,811Office Clerks, General $17,400 $27,162 $21,225Office Machine Operators, Except Computer $17,947 $23,350 $21,991

Lincoln MSA Entry wageExper. wage
Median wage
Production Occupations $21,980 $41,161 $33,599First-Line Supervisors of Production and Operating Workers $39,825 $65,414 $55,208Electrical and Electronic Equipment Assemblers $18,019 $28,802 $22,834Structural Metal Fabricators and Fitters $33,291 $44,247 $42,700Team Assemblers $19,629 $39,361 $33,830Assemblers and Fabricators, All Other $21,703 $26,363 $24,240Bakers $17,707 $27,428 $23,006Butchers and Meat Cutters $21,860 $35,031 $28,956Food Batchmakers $17,551 $19,130 $25,603Computer-Controlled Machine Tool Operators, Metal and Plastic $26,785 $39,568 $34,575Extruding and Drawing Machine Setters, Operators, and Tenders, Metal and Plastic $21,906 $32,264 $24,626Rolling Machine Setters, Operators, and Tenders, Metal and Plastic $34,091 $38,155 $36,450Cutting, Punching, and Press Machine Setters, Operators, and Tenders, Metal and Plastic
$28,386 $39,429 $36,417
Drilling and Boring Machine Tool Setters, Operators, and Tenders, Metal and Plastic $33,709 $37,612 $37,201Grinding, Lapping, Polishing, and Buffing Machine Tool Setters, Operators, and Tenders, Metal and Plastic
$34,912 $37,102 $36,004
Lathe and Turning Machine Tool Setters, Operators, and Tenders, Metal and Plastic $28,658 $37,118 $35,338Milling and Planing Machine Setters, Operators, and Tenders, Metal and Plastic $39,926 $43,383 $43,118Machinists $28,792 $43,933 $37,531Molding, Coremaking, and Casting Machine Setters, Operators, and Tenders, Metal and Plastic
$23,212 $38,797 $32,288
Multiple Machine Tool Setters, Operators, and Tenders, Metal and Plastic $29,359 $35,219 $34,297Tool and Die Makers $42,120 $56,025 $53,711Welders, Cutters, Solderers, and Brazers $25,801 $38,758 $34,212Prepress Technician and Workers $27,552 $40,558 $36,833Printing Press Operators $26,871 $41,143 $36,448Print Binding and Finishing Workers $24,171 $34,421 $28,769Laundry and Dry-Cleaning Workers $17,118 $21,769 $19,947Sewing Machine Operators $17,339 $26,207 $21,836Cabinetmakers and Bench Carpenters $27,826 $36,186 $34,109Woodworking Machine Setters, Operators, and Tenders, Except Sawing $27,661 $46,894 $40,177Stationary Engineers and Boiler Operators $31,768 $47,702 $43,199Water and Wastewater Treatment Plant and System Operators $30,628 $48,858 $43,124Chemical Equipment Operators and Tenders $24,039 $49,168 $41,474Separating, Filtering, Clarifying, Precipitating, and Still Machine Setters, Operators, and Tenders
$24,154 $29,170 $27,992
Mixing and Blending Machine Setters, Operators, and Tenders $27,009 $38,816 $35,430Cutters and Trimmers, Hand $19,935 $35,390 $33,824Cutting and Slicing Machine Setters, Operators, and Tenders $23,270 $29,852 $27,541Inspectors, Testers, Sorters, Samplers, and Weighers $27,746 $45,554 $41,714Dental Laboratory Technicians $27,518 $53,451 $50,504
Medical Appliance Technicians $18,641 $36,234 $27,005Ophthalmic Laboratory Technicians $22,251 $34,805 $28,247Packaging and Filling Machine Operators and Tenders $21,108 $28,710 $24,916Coating, Painting, and Spraying Machine Setters, Operators, and Tenders $25,403 $36,418 $31,980

Lincoln MSA Entry wageExper. wage
Median wage
Painters, Transportation Equipment $32,670 $43,416 $38,345Cleaning, Washing, and Metal Pickling Equipment Operators and Tenders $17,786 $22,941 $20,529Etchers and Engravers $21,182 $30,381 $27,392Molders, Shapers, and Casters, Except Metal and Plastic $22,298 $30,883 $26,755Helpers--Production Workers $17,555 $28,305 $21,780
Transportation and Material Moving Occupations $18,101 $38,038 $27,014First-Line Supervisors of Helpers, Laborers, and Material Movers, Hand $32,351 $54,461 $45,632First-Line Supervisors of Transportation and Material-Moving Machine and Vehicle Operators
$33,247 $53,514 $39,171
Bus Drivers, Transit and Intercity $27,572 $43,695 $41,692Driver/Sales Workers $17,521 $25,624 $19,815Heavy and Tractor-Trailer Truck Drivers $20,614 $44,383 $33,907Light Truck or Delivery Services Drivers $18,520 $38,953 $25,762Taxi Drivers and Chauffeurs $17,036 $24,871 $19,673Motor Vehicle Operators, All Other $17,312 $26,834 $18,614Parking Lot Attendants $17,567 $18,802 $18,197Conveyor Operators and Tenders $26,734 $37,709 $30,633Excavating and Loading Machine and Dragline Operators $30,905 $49,173 $36,167Refuse and Recyclable Material Collectors $18,698 $35,919 $28,430Taxi Drivers and Chauffeurs $17,886 $27,546 $22,418Cleaners of Vehicles and Equipment $16,390 $22,999 $19,616Parking Lot Attendants $17,519 $18,068 $17,925Driver/Sales Workers $16,947 $24,056 $19,043Packers and Packagers, Hand $17,319 $22,629 $18,832
Installation, Maintenance, and Repair Occupations $26,586 $48,342 $39,660First-Line Supervisors of Mechanics, Installers, and Repairers $40,240 $68,259 $55,115Computer, Automated Teller, and Office Machine Repairers $30,699 $47,101 $41,557Electric Motor, Power Tool, and Related Repairers $17,752 $42,000 $40,371Electronic Home Entertainment Equipment Installers and Repairers $24,066 $35,222 $30,358Automotive Body and Related Repairers $32,007 $45,187 $38,187
Automotive Service Technicians and Mechanics $24,750 $44,772 $39,616Bus and Truck Mechanics and Diesel Engine Specialists $28,986 $44,111 $37,237Farm Equipment Mechanics and Service Technicians $29,344 $42,503 $37,832Mobile Heavy Equipment Mechanics, Except Engines $34,039 $48,086 $43,009Motorboat Mechanics and Service Technicians $26,558 $39,348 $35,630Outdoor Power Equipment and Other Small Engine Mechanics $23,868 $27,116 $24,693Tire Repairers and Changers $18,219 $26,465 $22,359Heating, Air Conditioning, and Refrigeration Mechanics and Installers $37,156 $52,514 $47,748Industrial Machinery Mechanics $32,809 $50,110 $44,680Maintenance Workers, Machinery $24,062 $39,410 $35,022Telecommunications Line Installers and Repairers $26,374 $42,004 $33,411Medical Equipment Repairers $32,821 $45,321 $37,251Maintenance and Repair Workers, General $24,132 $42,094 $35,882Coin, Vending, and Amusement Machine Servicers and Repairers $24,236 $36,868 $32,627Locksmiths and Safe Repairers $36,707 $60,828 $49,751

Lincoln MSA Entry wageExper. wage
Median wage
Riggers $35,292 $51,665 $49,946Helpers--Installation, Maintenance, and Repair Workers $16,903 $26,149 $21,199
Information submitted herein was received from sources deemed to be reliable. Although we have no reason to doubt the accuracy or completeness of the data, it may be subject to errors or omissions.
Sources:Nebraska Workforce Development, Labor Market Information, Occupational Employment and Wages, Lincoln MSA, http://neblswages.nwd.ne.gov, accessed 01/11/13All wage estimates are adjusted to November 2011 Employment Cost Index (ECI) factors

Table 11: Nebraska Worker’s Compensation & Unemployment Insurance
A. Workers’ Compensation Minimum & Maximum Benefits, Nebraska
For Injury Occuring in: 2006 2007 2008 2009 2010 2011 2012 2013Maximum Weekly Benefit 600 617 644 671 691 698 710 728Minimum Weekly Benefit 49 49 49 49 49 49 49 49
B. Workers’ Compensation, Benefits Profile, Nebraska
2006 2007 2008 2009 2010 2009Covered Workers (000) 886 901 898 876 870 876Covered Wages ($mil) 29,637 31,420 32,219 31,755 32,089 31,755Benefits ($000) 271,992 284,259 323,702 304,156 313,066 304,156Benefits Per $100 of Covered Wages 0.92 0.90 1.00 0.96 0.98 0.96Benefits by Type of Insurer
Total 304,156 313,066Private Carriers 236,868 250,734State Funds Self-Insured 67,287 62,332Medical 184,014 191,283
% Medical 60.5 61.6
C. Unemployment Insurance
Eligibility For Benefit (2012) Gross earning of $3,868 (in 2012), of which 800 must have been paid in one quarter and $1,850 in another quarter
Maximum Weekly Benefit Amount (2010):
$354
Maximum Benefit Entitlement Period: 26 weeksTax Rate and Tax BaseTax Rate-New Employers Lesser of State rate or 2.5 percent Tax rate applies to the taxable wage
base.
New employers pay at the assigned rate for at least two calendar years. After that, an employer will be eligible to have the account experience rated. The rate can go up or down from the initial rate based upon the employer’s experience with the unemployment insurance program.
Taxable wage base (effec. 2008) $9,000 For most current information:http://www.dol.nebraska.gov Select: Labor Market Information; Employment/Unemployment; Unemployment
Insurance Statistics
Information submitted herein was received from sources deemed to be reliable. Although we have no reason to doubt the accuracy or completeness of the data, it may be subject to errors or omissions.
Sources:A. Nebraska Workers’ Compensation Court, http://www.wcc.ne.gov/legal/benefits.pdf, accessed 01/11/13B. National Academy of Social Insurance,Worker’s Compensation: Benefits, Coverage & Costs, 2009: http://www.nasi.org/sites/default/
files/research/Workers_Comp_Report_2008.pdf, Tables 3,7,8,10, accessed 01/11/13C. Nebraska Workforce Development, Labor Market Information, Unemployment Insurance Statistics, http://www.dol.nebraska.gov
Table 12: Labor Management Relations
A. State of Nebraska
Is a Right to Work State? YesEmployment Members Covered % Mem % Cov
Total 28,434 65,356 82,738 7.9 10Private 670,202 25,158 31,094 3.8 4.6Public 158,232 40,207 51,644 25.4 32.6Priv. Construction 43,041 3,754 4,146 8.7 9.6Priv.Manucfaturing 112,982 10,255 12,246 9.1 10.8
B. Lincoln Union Membership, Coverage, Density & Employment
Employment Members Covered % Mem % CovTotal 135,852 9,111 13,215 6.7 9.7Private 111,676 4,982 5,294 4.5 4.7Public 24,176 4,129 7,922 17.1 32.8
Information submitted herein was received from deemed to be reliable. Although we have no reason to doubt the accuracy or completeness of the data, it may be subject to errors or emissions.
Sources:A.Union Membership, Coverage, Density and Employment by State from the CPS, 2011,www.unionstats.com, accessed 01/11/13B. Union Membership, Coverage, Density and Employment by CMSA, MSA&PMSA from the CPS, May 2003-April 2004, www.unionstats.
com, last available as of 1-13.

Table 13: Transportation
A. Major 2 or 4-Lane Highways Linking the Areas
Interstate I-80 (east-west); access to I-29 (north-south) < 1 hr away
Limited Access, Four Lane US 2, US 77Improved Two Lane US 6, US 34
B. Distance in Miles to the Nearest Metro Areas
Omaha, NE 53 Topeka, KS 169 Des Moines, IA 188 Kansas City, MO 196 Sioux Falls, SD 216 Wichita, KS 277 Minneapolis, MN 430 Oklahoma City, OK 436 St. Louis, MO 446 Denver, CO 488 Chicago, IL 519
C. Motor Carriers/Trucks
Carriers based in County - 2004 178 An estimated 1,000 or more trucking firms operate equipment within a 100 radius of the Lincoln area.
D. Railroads (by Rail Carrier)
Name Burlington Northern Santa Fe, Union PacificMain or Branch Line MainShortline or National NationalNearest Switching Yard (miles) Lincoln, NE

E. Commercial Airports
Name Lincoln Municipal Airport Eppley AirfieldHub Status Non-hub Non-hubDistance from the Community in Miles 4 miles NW of Downtown Lincoln 50 miles NE of Downtown Lincoln# of Runways 3 3 Runway Lengths (feet) 12901, 8649, 5800 9502, 8153, 8500
Passenger Delta; United Express Twenty-two jet service air carriersCharter Duncan Aviation; Silverhawk Aviation One commuter air carrierAir Cargo N/A Eight freight carriersNon-stop cities 3 21
Non-Stop Cities Arrivals/DeparturesChicago 4/4Denver 3/2Minneapolis 3/3Current Flight Schedule www.lincolnairport.com http://www.eppleyairfield.com/fids/
default.htm
F. General Aviation Airport
Name Lincoln Municipal AirportLocation/City 4 miles NW of Lincoln# of Runways 3 Runway Lengths 8649, 12901, 5800Full Instrument Landing Capabilities YesHours of Operation 24 hours; most carriers run 6am - 11pm
G. Ports
Nearest Port Nebraska City, NE (45 miles); Omaha, NE (50 miles)River, Lake or Ocean Missouri River
H. Foreign Trade Zone
Designation General PurposeNumber 59 Site/Location Lincoln, NE Airpark West & North# of Acres 372 Magnet Site; 2,000 designated
under ASF Plan Operator Lincoln Chamber of CommerceSubzone Tenant Kawasaki Motors Manufacturing USA;
CNN - Grand Island; Cabela’s - Sidney
I. Custom Port of Entry in the Area
Name United States Customs Nebraska Port of EntrySite Location 5229 Boeing Court, Omaha, Nebraska 68110

J. Overnight Express Service Availability
Fed-ExLatest Pick-Up Time 6:00 PMEarliest Delivery Before 8:30 AMNext Day Delivery Guarantee YesSaturday Delivery YesLast Ground Drop-off 6:00 PM M-F; 3:00 PM Sat.UPSLatest Pick-Up Time 6:00:00 PM M-F’ 1:00 Sat.Earliest Delivery 8:30 PMNext Day Delivery Guarantee YesSaturday Delivery By 9:30 or noonUnited States Post OfficeNearest General Mail 7 Post Office locations in LincolnLatest Pick-Up Time Overnight express window closes at 6 PMEarliest Delivery Before NoonNext Day Delivery (specify States) Specified by townNearest Bulk Mail Facility 700 R Street, Lincoln
Information submitted herein was received from sources deemed to be reliable. Although we have no reason to doubt the accuracy or completeness
Sources:B. www.maps.google.com/ C. Nebraska Trucking Association, http://www.nebtrucking.com E. Lincoln Airport Authority http://www.lincolnairport.com; http://www.airnav.com/airport/KLNK F. Lincoln Airport Authority http://www.lincolnairport.com; http://www.airnav.com/airport/KLNK; http://www.eppleyairfield.com/sf/
default.htm G. US Army Corp of Engineers, Port Series No. 68, http://www.iwr.usace.army.mil/ndc/ports/pdf/ps/ps68.pdf J. Federal Express, United Parcel Service, US Postal Service

Table 14: Taxation
A. Income Tax
Corporate Income Tax/Franchise Tax: State Rate (range) 5.58 - 7.81 Formula (e.g. Sales, Property & Payroll) Sales only Federal Taxes Deductible No Accelerated Depreciation Permitted? Yes (MACRS)Personal Income Tax: State Rate 2.56 - 6.84Gross Receipts Tax Rate by Type of Business noneLocal Occupation Tax (Paid by Employee) noneLocal Wage Tax (Paid by Employer) none
B. Sales/Use Tax
1. RatesState 5.5%Local 1.5%Total 7.0%2. Property Subject to Sales TaxProduction Machinery & Equipment NoNon-Production Machinery & Equipment YesPollution Control Equipment Yes/refund
availableOffice Furniture/Fixtures/Equipment YesOffice Building Construction Materials YesIndustrial Building Construction Materials YesManufacturers’ Raw Materials YesStandard Software YesCustom Software YesIntangible Property Yes3. UtilitiesElectric Power 7.0%Natural Gas 7.0%Fuel Oil 7.0%Water & Sewer 7.0%4. TelephoneLocal Sales Tax 1.5%Local Occupational Tax 6%State Sales Tax 5.5%State Universal Svc Fee 6.95%

C.Property Tax
There is no state-levied property tax in NebraskaThere is no Property tax on business inventories in Lincoln1. Local Tax Rate/$100 of Valuation 2009 2010 2011 2012Lancaster County 0.268300 0.268300 0.2683000 0.2843000 Public Building Commission 0.017000 0.017000 0.0170000 0.0166600 City of Lincoln 0.287880 0.287880 0.3158000 0.3158000 Lincoln Public School 1.253663 1.246207 1.2462070 1.2447050 ESU #18 0.014957 0.014991 0.0150000 0.0150000 Lower Platte South NRD 0.040979 0.040586 0.0398480 0.0377500 Railroad Trans. Safety District 0.026000 0.026000 0.0260000 0.0100000 Southeast Community College 0.067600 0.060000 0.0627000 0.0627000 Lancaster County Ag. Society 0.001643 0.001655 0.0015810 0.0015010 Lancaster County Ag. Society JPA 0.003830 0.003814 0.0037310 0.0035120 Lancaster Co Correctional Facility JPA-County 0.010729 0.010639 0.0105110 0.0099400 Lancaster Co Correctional Facility JPA-Lincoln 0.019363 0.018878 0.0185340 0.0176720 Consolidated Rate 2.0119440 1.9959500 2.0252120 2.0195400
2. Local Property TaxProduction Machinery & Equipment YesNon Production Machinery & Equipment YesPollution Control YesInventory NoOffice Furniture‐Fixtures YesComputer Equipment YesWorkstations YesTelephones YesFurniture YesCompany Vehicles NoMotor vehicles (non-registered, not depreciable) NoMotor vehicles (non-registered, depreciable) YesStandard Operating System Software (tangible) YesApplication Custom Sorftware (intangible) NoFreeport Legislation NAApplicable to Warehousing NAApplicable to Manufacturing NAGoods Stored in a Public Warehouse NA
Information submitted herein was received from sources deemed to be reliable. Although we have no reason to doubt the accuracy or completeness of the data, it may be subject to errors or omissions.
Sources:A. Nebraska Department of Revenue, http://www.revenue.state.ne.us/question/business.htm#c12 B1. Nebraska Department of Revenue, http://www.revenue.state.ne.us/research/4-607tables5.pdf B4. Nebraska Public Service Commission, 2011 Annual Report on Telecommunications C1. http://lancaster.ne.gov/Cnty/ASSESS/TaxDist1Sum09.pdf

Table 15: Commercial Real Estate Occupancy/ SupplyA. Available Land and Buildings
See www.LocateLincoln.com for list of searchable properties
B. Cost Per Acre for Fully Developed Sites, 2011
Development Land Low ($/Acre) High ($/Acre)Office in CBD (Per buildable foot) N/A N/ALand in Office Parks $55,000 $280,000Land in Industrial Parks $40,000 $110,000Office/Industrial Land‐Non‐park $65,000 $326,000Retail/Commercial Land $230,000 $1,800,000Residential $25,000 $100,000
C. Average Asking Rents for 2011 (Gross Rent/Sq ft)
Downtown Office Low High Effective Ave. VacancyPremium (AAA) N/A N/A N/A N/AClass A (Prime) $14.75 $20.00 $16.16 7.3%Class B (Secondary) $8.00 $22.00 $15.27 17.3%Suburban OfficeNew construction (AAA) $12.50 $21.00 $18.35 62.2%Class A (Prime) $17.00 $23.00 $20.64 7.2%Class B (Secondary) $8.00 $22.00 $15.52 13.4%IndustrialBulk Warehouse $2.00 $8.00 $4.27 8.1%Manufacturing $2.00 $5.00 $2.30 8.1%High Tech/R&D $4.00 $12.00 $6.45 8.2%RetailDowntown $6.00 $19.00 $8.75 12.5%Neigborhood Service Centers $6.00 $25.00 $13.19 11.4%Community Power Center $6.00 $25.00 $11.76 10.1%Regional Malls $23.00 $35.00 $25.18 17.1%
D. Average Length of Time for Local Permit
Residential CommercialReview & comment *Approval possible Review & comment *Approval possible
Certificate of Occupancy Within 1 week Within 1 weekBuilding Permit 5-7 days 5-7 days 10 days Avg. 15 days;
Range 10 days - 6 months
*Contingent upon the timeliness of applicant provision of resubmittals or revisions.*Contingent upon builder/owner completing the necessary steps prior to issuing the permit to occupy.
Information submitted herein was received from sources deemed to be reliable. Although we have no reason to doubt the accuracy or completeness of the data, it may be subject to errors or omissions.
Sources:B. NAI Global Commercial Real Estate, http://www.naidirect.com/market_research/html/502510_marketrep.aspx?pageTitle=Market%20
Research, updated 2/2/12, accessed 01/10/13C. NAI Global Commercial Real Estate, http://www.naidirect.com/market_research/html/502510_marketrep.aspx?pageTitle=Market%20
Research, updated 2/2/12, accessed 01/10/13D. City of Lincoln, Department of Building and Safety, Plan Review Section

Table 16: Utilities
A. Water & Wastewater
Water source: Groundwater from Platte River basinProvider: City of Lincoln Public Works Department
1. Water Demand/Capacity2010 2025
Rated Capacity (mgd): 131.0 160.0 Average Daily Demand (mgd) 41.9 52.4 Maximum Day Demand (mgd) 113.0 141.0 Expansion plans: Supply improvements, rehabilitations, and facility upgrades planned in 2020 and 2031
2. Water CostsWater Connection Fee: YesWater is sold by the unit. One unit equals 100 cubic feet (748 gallons.)Less than 12 million cubic feet: $1.344/unit $1.911/unitMonthly 1-80 units all additional unitsBi-monthly 1-160 units all additional unitsMore than 12 million cubic feet: billed according to a base average of the previous 3 years. $1.276 per unit for usage less than base to 5% above base $1.323 per unit for usage 5% - 15% above base $1.365per unit for usage 15% - 25% above base $1.407 per unit for usage more than 25% above base
3. Wastewater Demand/CapacityAverage Daily Demand
(mgd)Rated Capacity (mgd)
Theresa Street Treatment Plant 24.0 27.4 Northeast Treatment Plant 9.0 10.0 Total 33.0 37.4 The City of Lincoln’s wastewater collection system currently serves an area of 83 square miles.Population and wastewater service demand are projected at 1.5% annually.
4. Wastewater CostsSewer Connection Fee: YesFlat fee of $1.86 per unit; total determined by water useSome industries pay surcharge for high-strength waste

B. Natural Gas
Name of Provider: Black Hills Energy www.blackhillsenergy.comNebraska Firm Commercial/Industrial Franchised Rates, Lincoln Rate AreaEffective Date Regulatory Assess. Rate Per Therm Customer Charge12/1/2012 $0.10 $0.68968 $18.50 11/1/2012 $0.10 $0.68478 $18.50 10/1/2012 $0.10 $0.62490 $18.50 9/1/2012 $0.10 $0.59234 $18.50 8/1/2012 $0.10 $0.62245 $18.50 7/1/2012 $0.10 $0.58291 $18.50 6/1/2012 $0.10 $0.56820 $18.50 5/1/2012 $0.10 $0.51053 $18.50 4/1/2012 $0.10 $0.73995 $18.50 3/1/2012 $0.10 $0.75351 $18.50 2/1/2012 $0.10 $0.76479 $18.50 1/1/2012 $0.10 $0.75164 $18.50
C. Electric Power www.les.com
Name of Company: Lincoln Electric System (LES); LES is a net exporter of power
1. 1. Service Area: Greater Lincoln area (200 sq mi) including Waverly, Walton, Emerald, & Cheney
2. Number of Customers: 129,000±3. Name of Power Pool Membership: Southwest Power
Pool (SPP)4. % of Reserve margin including generation & net
purchases: 36.3%5. Total Capacity: 1021 MW; Available Capacity: 272 MW
(relative to summer peak of 749 MW)6. Generation capacity: 749 MW
7. 514 outages/yr (5-yr avg). History of specific circuits can be available during the site selection process
8. Average Service Availability Index (ASAI) = 99.985%
9. Dual primary rate = $2.05 per kw of dual primary demand per billing period
10. Outage duration: 43.1 min (2010 System Avg Interruption Duration Index)
11. State electric power not deregulated
Electric Rates: Vary according to customer type & electric demand/energy consumption (see table below); Website link to schedules: http://www.les.com/your_business/rate_schedules.aspInfrastructure Incentive: No-fee for new service installation if estimated revenue exceeds cost of installation over 2.5-year period.

Power Purchase Program: Pays customers operating stand-by generators with at least 100kW of connected load during periods of high system peak loads.
(Effective January 1, 2010) Small Medium LargeIndustrial Low Load Factor 28% Load Factor
150 kW & 30,000 kWh28% Load Factor 500 kW & 100,000 kWh
28% Load Factor 1,000 kW & 200,000 kWh
150 kW & 30,000 kWh 500 kW & 100,000 kWh 1,000 kW & 200,000 kWhPrimary (cents per kWh) 9.78 11.85 11.71 Secondary (cents per kWh) 10.58 12.34 12.21 Industrial High Load Factor 90% Load Factor
150 kW & 97,000 kWh90% Load Factor 500 kW & 325,000 kWh
90% Load Factor 1,000 kW & 650,000 kWh
150 kW & 97,000 kWh 500 kW & 325,000 kWh 1,000 kW & 650,000 kWhPrimary (cents per kWh) 5.02 5.40 5.35 Secondary (cents per kWh) 5.38 5.59 5.55 Commercial Low Load Factor 42% Load Factor
150 kW & 45,000 kWh42% Load Factor 300 kW & 90,000 kWh
42% Load Factor 500 kW & 150,000 kWh
150 kW & 45,000 kWh 300 kW & 90,000 kWh 500 kW & 150,000 kWhPrimary (cents per kWh) 7.49 7.46 8.74 Secondary (cents per kWh) 8.07 8.04 9.09 Commercial High Load Factor 50% Load Factor
100 kW & 36,000 kWh50% Load Factor 280 kW & 100,000 kWh
50% Load Factor 500 kW & 180,000 kWh
100 kW & 36,000 kWh 280 kW & 100,000 kWh 500 kW & 180,000 kWhPrimary (cents per kWh) 6.74 7.87 7.71 Secondary (cents per kWh) 7.26 8.17 8.01 Source: Lincoln Electric System (LES)

D. TelecommunicationsMultiple Long Distance Service Providers
Local Service Providers1. Windstream
Communications 2. Unite Private Networks 3. Time Warner Cable4. Pinpoint Network
Solutions• Digital switch technology • 247 route miles of fiber in
Lincoln. Usually available within 1/2 mile.
• Nortel host switch, Cisco network gear
• Primary central office connect by Fiber, SONET
• Redundant connections to other switching centers
• Spare bandwidth available
• ISDN-PRI (1.544 Mbps) • ISDN-BRI • Fractional DS-1 Service• Transparent LAN Service:
10/10/1000Mbps options• ATM Service• Frame Relay Service• DSL• Centrex• www.Windstream
communications.com
• Dark-fiber• Lit fiber (1-10 gig)• Private line• Metro optical Ethernet
(MOE)• Internet• VOIP• Storage area networks• Fiber WANS• http://www.
uniteprivatenetworks.com
• Digital residential service & business class broadband service
• www.timewarner cable.com/Nebraska
• Business telecommunications
• Data center services• http://www.
pnptnetworks.com
E. Points of Presence (POPs) of Long Distance Carriers
Windstream CommunicationsMicrowave or Hardwire Fiber-SONETDiverse Routing Available
Information submitted herein was received from sources deemed to be reliable. Although we have no reason to doubt the accuracy or completeness of the data, it may be subject to errors or omissions.
Sources:A1. Lincoln Water System Facilities Master Plan, Executive Summary, Table 3-9 (updated 2010 based on 2007 data), http://lincoln.ne.gov/
city/pworks/water/mplan/2007/pdf/complete.pdf A2. Lincoln Water System, Rates and Service Charges, http://www.lincoln.ne.gov/city/pworks/business/wtswbill/rates/index.htm, accessed
6/22/2012 A3. Lincoln Department of Public Works; Wastewater, Solid Waste & Recycling Operations Division A3. Wastewater Facilities Master Plan (Nov. 2007). http://lancaster.ne.gov/city/pworks/waste/wstwater/wwplan/2007/index.htm,
accessed 6/22/2012 A4. Lincoln Water and Wastewater Rates (Nov. 2009), http://www.lincoln.ne.gov/city/pworks/business/wtswbill/rates/index.htm, accessed
6/22/2012 B: Black Hills Energy, http://www.blackhillsenergy.com/customers/energyrates/documents/ne/NeGFirmCommRates.pdf, accessed
1/11/2013 C. Lincoln Electric System (LES); Rates, Forecasting and Load Research Department, 12/2012 D. Windstream Communications; Unite Private Networks; Time Warner Cable; PinPoint Network Solutions

Table:17 Environmental
Air Pollution
Area in Attainment for Federal Air Pollution RegulationsOzone YesCarbon Monoxide YesParticular Matter YesLead YesSulfur Dioxide YesNitrogen Dioxide YesOne-Stop Air & Water Quality Permitting System? No:
However the Environmental Assistance Division is a one-stop place to gain information on requirements, etc.
Permitting Process
Air Permit Simple: 3-6 months; large/complex: 6-9 monthsWater Permit New Facility NPDES Storm Water Construction General Permit Submit 7 days prior to commmencement of building NE pre-treatment permit NPP (Sending water to city plant) 3-5 months (depends on complexity and
backlog) NPDES Discharge Permit (to discharge into a stream) 3-5 months (depends on where discharging) NPDES Industrial Storm Water Permit general Submit notice of intent for approval
30-60 days prior to commencement of building
Waste Water Handling System Construction Permit Minimum of 30 days for review (usually quick)Hazardous Waste Permit Most companies don't need this.
Hazardous Waste
Nearest Licensed Hazardous Waste Disposal Site Licensed Hazardous Waste Haulers Serving the Area*
Clean Harbors, Kimball, NE Hazardous Waste Transporters: 4383 miles west Hazardous Waste Providers, Including consultants: 32Subtitle C Hazardous Waste Incinerator
Landfills
City of Lincoln/Bluff Road Landfill - Lincoln - North on Hwy. 77The City of Lincoln N. 48th Street Construction and Demolition Waste Disposal Area
Contact Information
Air, Water Quality & Hazardous Waste Nebraska Department of Environmental Quality1200 N St., Suite 400(402) 471-2186
Information submitted herein was received from sources deemed to be reliable. Although we have no reason to doubt the accuracy or completeness of the data, it may be subject to errors or omissions.
Sources:Hazardous Waste: http://pested.unl.edu/Hazardous, accessed 1/11/2013.Landfills: http://lincoln.ne.gov/city/pworks/waste/sldwaste/landfill/, accessed 1/11/2013.

Table 18: Government
A. City Government
Form (Structure) Mayor/City Council# of Elected Officials 8 Chief Executive: MayorName Chris BeutlerYears in Office Sworn in May 2007Next Election Date May 2013City Manager (Administrator) No
B. Lancaster County Government
Form (Structure) County Commission# of Elected Officials 15 Top Elected Officials County CommissionersCounty Manager (Yes or No) No
C. State Government
Form (Structure) Unicameral# of Elected Officials 49
Nebraska is the only state in the US with a unicameral (single-house) form of government. Reorganized in 1937, Nebraska’s unicameral is usually referred to as the legislature. Representatives of the legislature are called Senators.
GovernorName David HeinemanYears in Office Appointed 2005Current Term Expiration Date 2014Allowed to Run for Another Term (Yes or No) No
Next Election Date Nov. 2014
State SenatorsBill Avery Tony Fulton Amanda McGillDanielle Conrad Kathy Campbell Ken HarrNorm Wallman Colby Coash
D. US Government Representation: District 1
House of RepresentativesName Jeff FortenberryYears in Office Elected 2004Current Term Expiration Date 2012Next Election Date Nov. 2012

SenateName Mike Johanns Ben NelsonYears in Office Elected November 2008 Elected Nov. 2000Current Term Expiration Date 2014 2012Next Election Date Nov. 2014 Nov. 2012
Information submitted herein was received from sources deemed to be reliable. Although we have no reason to doubt the accuracy or completeness of the data, it may be subject to errors or omissions.
Sources:A. City of Lincoln. http://lincoln.ne.gov/city/council/members.htm, accessed 1/7/13B. National Association of Counties. http://www.naco.org/Template.cfm?Section=Find_a_County&Template=/cffiles/counties/county.
cfm&id=31109, accessed 1/7/13C. Nebraska Legislature. http://www.nebraskalegislature.gov/senators/senator_find.php, accessed 1/7/13

Table 19: International Resources
A. Local Firms Owned by Non-US Corporations
# of Companies
Local Emp Country Industry
Arctic Glacier 1 5-9 Canada MFG-312Bosch Security Systems 1 100-249 Germany MFG-222Con-Space Communications 1 20-49 Finland MFG-222Daitron Incorporated 1 50-99 Japan MFG-334GT Exhaust 1 100-249 United Kingdom MFG-336Kawasaki Motors Manufacturing 1 1000-2499 Japan MFG-336Lincoln Composites 1 100-249 Norway MFG-332Linweld, Inc. 1 20-49 Japan MFG-325Masport, Inc. 1 20-49 New Zealand MFG-333Celerion 1 500-999 Canada PST-54Novartis Consumer Health 1 500-999 Switzerland MFG-325Pratt Industries 1 20-49 Australia MFG-322Tri-Con Industries & Stamping Plant (TS Tech. Company, Inc.)
2 350-750 Japan MFG-336
Yasufuku, USA 1 100-249 Japan MFG-326Square D/Schneider Electric 1 100-249 France MFG-332
B. Foreign Institutions
Foreign Consulate by Country (Omaha) Mexico, Sweden, Denmark, & Norway (Honorary Consulate)# of Language Translation Firms in the Area 9
C. Languages
Spanish Indo-Euro. Asian-Pacific Other Total English onlyLanguages spoken at home (Population > 5 years old)
10,495 7,566 8,054 3,417 29,532 214,783
Schools w/instruction solely in another language
None None None None
# of schools geared to families of foreign nationals
None None None None
D. International Air Transportation
Multiple daily international flights connecting from Atlanta, Chicago, Dallas, Denver, Detroit, Houston, Minneapolis, Newark, Phoenix, St Louis and Washington National via Lincoln Municipal Airport and Omaha Eppley Airport.
E. Educational International Focus
Numerous international academic programs, research and outreach centers, and study abroad opportunities at the University of Nebraska-Lincoln. Link to www.unl.edu.
Information submitted herein was received from sources deemed to be reliable. Although we have no reason to doubt the accuracy or completeness of the data, it may be subject to errors or omissions.
Sources:C. U.S. Census Bureau American FactFinder website. 2010 estimates for Lincoln, NE

Table 20: Quality of Life
A. Climate
Average temperature 51° Jan. high 35.4°Average clear days 230 annually Jan. low 13.8°Annual precipitation 29 inches July high 89°Average growing season 180 days July low 66.1°Wind Speed (Annual Average) 10.4 mph
Elevation: Range 1150'-1220'Elevation: Average 1163'
B. Violent Crime Rate Index
2006 2007 2008 2009 2010 2011 2010-2011 2002-2011Murder 5 6 4 4 3 4 33.3% -33.3%Rape 108 114 111 126 144 170 18.1% 75.3%Robbery 154 167 217 190 178 176 -1.1% -0.6%Aggravated Assault 937 1,029 946 836 927 603 -35.0% -36.3%Burglary-Residential 1,310 1,456 1,218 1,231 1,116 1,069 -4.2% -22.5%Burglary-Commercial 559 460 331 355 315 305 -3.2% -47.8%Larceny-Theft 9,649 9,421 8,203 7,912 8,367 8,365 0.0% -24.0%Auto Theft 404 410 351 271 340 346 1.8% -32.6%Total 13,126 13,063 11,381 10,925 11,389 11,038 -3.1% -25.0%*Rank among 50 Peer Communities
32 31 217 29 N/A N/A
(*ranked in order of violent crime)
C. Housing
1. Single-Family Detached HomesExisting Home Sales 2004 2005 2006 2007 2008 2009 2010 2011Number of Sales 3,552 3,599 3,416 3,513 3,160 3,574 3,067 3,507 Average Sale Price $141,908 $146,067 $152,591 $146,804 $145,443 N/A N/A N/AMedian Sale Price $120,000 $124,900 $125,500 $127,000 $125,000 $125,000 $125,000 $130,000 New Home SalesNumber of Sales 1,080 974 711 627 466 467 400 381 Average Sale Price $210,418 $232,087 $246,099 $242,049 $245,697 N/A N/A N/AMedian Sale Price $170,970 $179,950 $195,000 $190,839 $191,543 $179,975 $184,768 $189,950
2. Average Rents for Multi-Family Units, 2008(Avg. low – Avg. high $)
Area West East1-br 417-480 560-6152-br 509-584 662-746
Average Vacancy Rate
6.50%

D. Health Care
# of Hospitals 5 # of Teaching Hospitals 2 # of beds 908 # of Outpatient Clinics 27 # of Physicians 600 Ratio per 1,000 Population 1:416# of Dentists 150 Ratio per 1,000 Population 1:1664
E. Religious Institutions
Protestant 166 Catholic 15 Synagogues 2 Orthodox 2 Muslim 1 Other 24
F. Recreational and Cultural Amenities See www.lincoln.org for detailed information
Dining & Entertainment: Historic Haymarket http://www.historichaymarket.com/Entertainment: Lancaster Events Center http://www.lancastereventcenter.com/Entertainment: Lied Center for Performing Arts http://www.liedcenter.org/Entertainment: Lincoln Children's Zoo http://www.lincolnzoo.org/Entertainment: Lincoln Midwest Ballet Company http://www.artsincorporated.org/lmbc/Entertainment: Lincoln Symphony Orchestra http://www.lincolnsymphony.com/Entertainment: Mary Riepma Ross Media Arts Ctr http://theross.org/Entertainment: Multiple Theater CompaniesEntertainment: Pershing Auditorium http://www.pershingcenter.com/Entertainment: Youth Symphony http://lys.lps.org/Museum: Germans from Russia Museum http://www.ahsgr.org/Museum: Museum of Nebraska History http://www.nebraskahistory.org/sites/mnh/Museum: Nebraska State Historical Society http://www.nebraskahistory.org/Museum: Sheldon Memorial Art Gallery http://www.sheldonartgallery.org/Recreation: Golf Courses 3 private and 11 public throughout cityRecreation: Hiker-Biker Trails Extensive system throughout cityShopping: South Pointe Pavillions (Regional Mall) http://www.southpointeshopping.com/Shopping: Westfield Gateway (Regional Mall) http://www.westfield.com/gateway/Entertainment: Omaha Royals Baseball Omaha 1 hourEntertainment: Ak-Sar-Ben Aquarium Gretna 30 min north of LincolnEntertainment: Henry Doorly Zoo Omaha 1 hourMuseum: Archway Monument Kearney 2 hrsMuseum: Strategic Air Command Museum Ashland 30 min north of LincolnRecreation: Eugene T. Mahoney State Park Ashland 30 min north of LincolnShopping: Outlet Mall Gretna 30 min north of LincolnShopping: Outlet Mall Nebraska City 45 min southeast of Lincoln
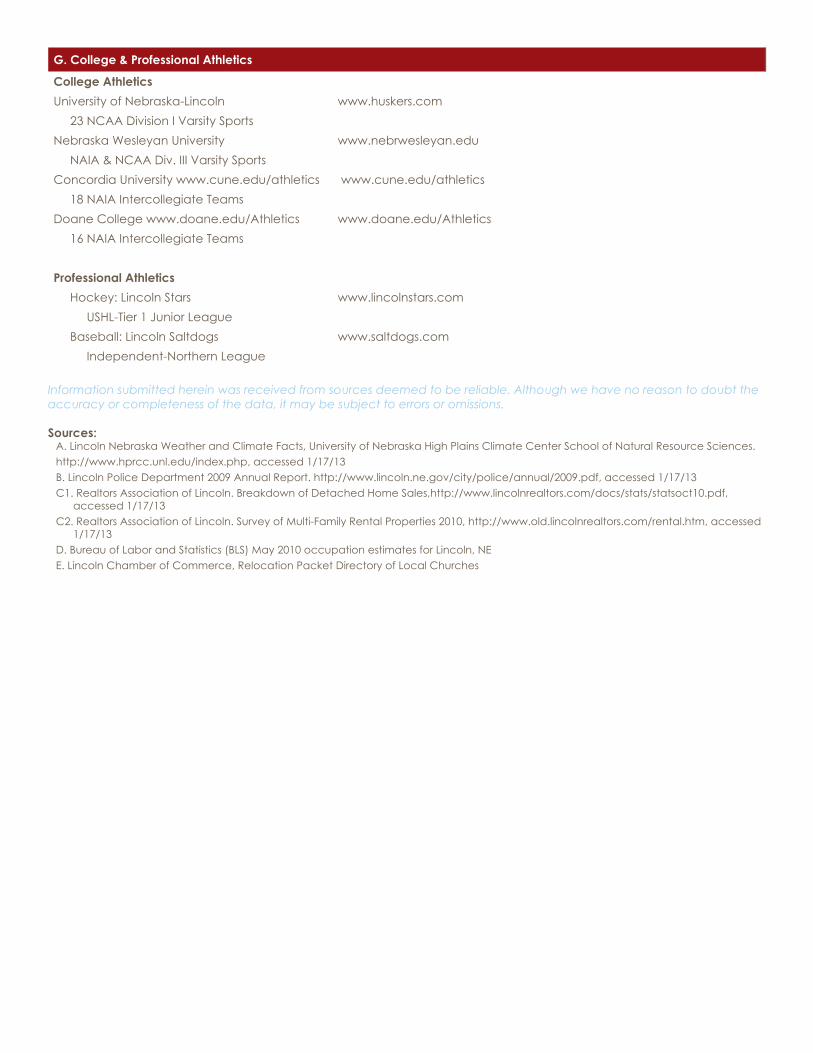
G. College & Professional Athletics
College AthleticsUniversity of Nebraska-Lincoln www.huskers.com 23 NCAA Division I Varsity SportsNebraska Wesleyan University www.nebrwesleyan.edu NAIA & NCAA Div. III Varsity SportsConcordia University www.cune.edu/athletics www.cune.edu/athletics 18 NAIA Intercollegiate TeamsDoane College www.doane.edu/Athletics www.doane.edu/Athletics 16 NAIA Intercollegiate Teams
Professional Athletics Hockey: Lincoln Stars www.lincolnstars.com USHL-Tier 1 Junior League Baseball: Lincoln Saltdogs www.saltdogs.com Independent-Northern League
Information submitted herein was received from sources deemed to be reliable. Although we have no reason to doubt the accuracy or completeness of the data, it may be subject to errors or omissions.
Sources:A. Lincoln Nebraska Weather and Climate Facts, University of Nebraska High Plains Climate Center School of Natural Resource Sciences. http://www.hprcc.unl.edu/index.php, accessed 1/17/13B. Lincoln Police Department 2009 Annual Report. http://www.lincoln.ne.gov/city/police/annual/2009.pdf, accessed 1/17/13C1. Realtors Association of Lincoln. Breakdown of Detached Home Sales,http://www.lincolnrealtors.com/docs/stats/statsoct10.pdf,
accessed 1/17/13C2. Realtors Association of Lincoln. Survey of Multi-Family Rental Properties 2010, http://www.old.lincolnrealtors.com/rental.htm, accessed
1/17/13D. Bureau of Labor and Statistics (BLS) May 2010 occupation estimates for Lincoln, NEE. Lincoln Chamber of Commerce, Relocation Packet Directory of Local Churches