LiNbO3 optical waveguides formed in a new proton source
7
JOURNAL OF LIGHTWAVE TECHNOLOGY,VOL. 20, NO. 1,JANUARY 2002 71 LiNbO Optical Waveguides Formed in a New Proton Source Vittorio M. N. Passaro, Member, IEEE, Member, OSA, Mario N. Armenise, Member, OSA, Diana Nesheva, Ivanka T. Savatinova, and Edwin Y. B. Pun, Senior Member, IEEE Abstract—Proton-exchanged planar waveguides have been fabricated on Z-cut and X-cut lithium niobate crystals by using a new proton source formed by a mixture of benzoic and adipic acids. Waveguide index profiles and optical characteristics have been obtained at different values of the adipic–benzoic acid concentration ratio. The samples have been structurally char- acterized by Raman and infrared (IR) absorption spectroscopy and double-crystal X-ray diffraction. Good quality samples have been fabricated by using 30 mol% ratio dilution, showing very low scattering levels ( 0.1 dB/cm), relatively high electrooptic coefficient ( pm/V), and low relative percentage of interstitial protons (26%). The main factor limiting the waveguide optical properties is the substitutional–interstitial proton ratio, which can be easily controlled to produce good quality waveguides. A demonstration of the repeatability of the exchange process in the acid mixture is also provided. Index Terms—Diffusion processes, electrooptic measurements, integrated optics, lithium compounds, optical planar waveguides, optical variables measurement. I. INTRODUCTION P ROTON exchange (PE) is a well-known technique for the fabrication of high-index low-loss lithium niobate (LiNbO ) waveguides [1]. Several proton sources [2] have been used to control the surface refractive index change, including benzoic [3], pyrophosphoric [4], adipic [5], and stearic acid [6]. A number of papers have been also presented on proton exchanged waveguides in LiNbO doped with ZnO [7], MgO [8], or Fe [9]. Some efforts have been spent to understand the waveguide formation mechanism and some significant results regarding the model of the exchange process kinetics have also been obtained [10]. Direct proton exchange in either single or diluted source is utilized to obtain abrupt or smooth profiles, respectively. Postannealing procedure is usually required to restore some structural properties of the waveguides. However, it generates a smoother profile and reduced index change, and, in some cases, partially reduces the nonlinear coefficients and does not maintain the periodic domain orientation [11]. Therefore, more interest is actually devoted to soft proton exchange (SPE), which is a process carried out at relatively Manuscript received January 23, 2001; revised October 9, 2001. This work was supported in part by the Bulgarian Science Foundation under Grant F-824. V. M. N. Passaro and M. N. Armenise are with the Optoelectronics Labo- ratory, Dipartimento di Elettrotecnica ed Elettronica, Politecnico di Bari, Bari 70125, Italy (e-mail: [email protected]). D. Nesheva and I. T. Savatinova are with the Institute of Solid State Physics, Bulgarian Academy of Sciences, Sofia 1784, Bulgaria. E. Y. B. Pun is with the Department of Electronic Engineering, City Poly- technic of Hong Kong, Kowloon, Hong Kong. Publisher Item Identifier S 0733-8724(02)00373-0. high temperatures in strongly diluted melts without any postannealing procedure [12] because the phase transitions are inhibited and the optical properties preserved. Recently, an efficient high-temperature SPE method has been presented by using a high boiling point source, i.e., stearic acid diluted by lithium stearate, to obtain -phase optical waveguides in a short enough time [13]. Graded proton exchange (GPE) [14] has been used as an alternative to SPE process, since the relatively low proton concentrations do not affect the periodic inversion of the ferroelectric domains [15]. In principle, SPE and GPE techniques allow the control of crystallographic phases formed and, thus, the optical properties by varying the concentration of lithium benzoate (stearate) or KHSO for SPE and GPE, respectively. Thus, and/or phases could be obtained, if required. However, a conclusive study on the portions of the different phases required to obtain high quality waveguides is not yet available, and more efforts are needed to achieve this aim. In this paper, the influence of the mixture of two acids with weak acidity (benzoic and adipic) is investigated for the first time, to our knowledge, in terms of waveguide index profile, waveguide thickness, scattering level, electroooptic effect, and crystallographic phases. These acids have different values of some physical parameters, i.e., boiling point, vapor pressure, and dissociation constant [13], and their mixture induces inter- esting effects during the waveguide formation. In particular, im- portant improvements of the optical properties have been found under specific fabrication conditions, even after a high temper- ature and long time exchange process. II. EXPERIMENTAL RESULTS AND DISCUSSION A. Waveguide Fabrication PE waveguides were fabricated in optical grade Z-cut and X-cut LiNbO substrates. A mixed proton source formed by benzoic acid and different molar percentages of adipic acid was used. After melting together the acid powders in a beaker placed in an oil bath at 235 C with a temperature control within 0.1 C, the sample was fully immersed and the exchange occurred for 2 h in air. After this process, the sample was cooled for 5 min in air and cleaned by an ultrasonic bath to eliminate the residual acid. A number of Z-cut planar waveguides, named series I, and two X-cut planar waveguides (samples PEXB1 and PEXBA1) were fabricated by using various adipic acid concentrations in the 0 mol%–100 mol% range. Series II of Z-cut samples has been also fabricated under the same fabrication conditions of series I to check the repeatibility of the exchange process in the 0733–8724/02$17.00 © 2002 IEEE
Transcript of LiNbO3 optical waveguides formed in a new proton source
JOURNAL OF LIGHTWAVE TECHNOLOGY, VOL. 20, NO. 1, JANUARY 2002 71
LiNbO3 Optical Waveguides Formed in aNew Proton Source
Vittorio M. N. Passaro, Member, IEEE, Member, OSA, Mario N. Armenise, Member, OSA, Diana Nesheva,Ivanka T. Savatinova, and Edwin Y. B. Pun, Senior Member, IEEE
Abstract—Proton-exchanged planar waveguides have beenfabricated on Z-cut and X-cut lithium niobate crystals by usinga new proton source formed by a mixture of benzoic and adipicacids. Waveguide index profiles and optical characteristics havebeen obtained at different values of the adipic–benzoic acidconcentration ratio. The samples have been structurally char-acterized by Raman and infrared (IR) absorption spectroscopyand double-crystal X-ray diffraction. Good quality samples havebeen fabricated by using 30 mol% ratio dilution, showing verylow scattering levels ( 0.1 dB/cm), relatively high electroopticcoefficient (r33 = 0 88 pm/V), and low relative percentage ofinterstitial protons (26%). The main factor limiting the waveguideoptical properties is the substitutional–interstitial proton ratio,which can be easily controlled to produce good quality waveguides.A demonstration of the repeatability of the exchange process inthe acid mixture is also provided.
Index Terms—Diffusion processes, electrooptic measurements,integrated optics, lithium compounds, optical planar waveguides,optical variables measurement.
I. INTRODUCTION
PROTON exchange (PE) is a well-known technique forthe fabrication of high-index low-loss lithium niobate
(LiNbO ) waveguides [1]. Several proton sources [2] have beenused to control the surface refractive index change, includingbenzoic [3], pyrophosphoric [4], adipic [5], and stearic acid[6]. A number of papers have been also presented on protonexchanged waveguides in LiNbO doped with ZnO [7], MgO[8], or Fe [9]. Some efforts have been spent to understand thewaveguide formation mechanism and some significant resultsregarding the model of the exchange process kinetics have alsobeen obtained [10]. Direct proton exchange in either single ordiluted source is utilized to obtain abrupt or smooth profiles,respectively. Postannealing procedure is usually required torestore some structural properties of the waveguides. However,it generates a smoother profile and reduced index change,and, in some cases, partially reduces the nonlinear coefficientsand does not maintain the periodic domain orientation [11].Therefore, more interest is actually devoted to soft protonexchange (SPE), which is a process carried out at relatively
Manuscript received January 23, 2001; revised October 9, 2001. This workwas supported in part by the Bulgarian Science Foundation under Grant F-824.
V. M. N. Passaro and M. N. Armenise are with the Optoelectronics Labo-ratory, Dipartimento di Elettrotecnica ed Elettronica, Politecnico di Bari, Bari70125, Italy (e-mail: [email protected]).
D. Nesheva and I. T. Savatinova are with the Institute of Solid State Physics,Bulgarian Academy of Sciences, Sofia 1784, Bulgaria.
E. Y. B. Pun is with the Department of Electronic Engineering, City Poly-technic of Hong Kong, Kowloon, Hong Kong.
Publisher Item Identifier S 0733-8724(02)00373-0.
high temperatures in strongly diluted melts without anypostannealing procedure [12] because the phase transitions areinhibited and the optical properties preserved. Recently, anefficient high-temperature SPE method has been presented byusing a high boiling point source, i.e., stearic acid diluted bylithium stearate, to obtain -phase optical waveguides in a shortenough time [13]. Graded proton exchange (GPE) [14] hasbeen used as an alternative to SPE process, since the relativelylow proton concentrations do not affect the periodic inversionof the ferroelectric domains [15]. In principle, SPE and GPEtechniques allow the control of crystallographic phases formedand, thus, the optical properties by varying the concentrationof lithium benzoate (stearate) or KHSO for SPE and GPE,respectively. Thus, and/or phases could be obtained, ifrequired. However, a conclusive study on the portions of thedifferent phases required to obtain high quality waveguides isnot yet available, and more efforts are needed to achieve thisaim.
In this paper, the influence of the mixture of two acids withweak acidity (benzoic and adipic) is investigated for the firsttime, to our knowledge, in terms of waveguide index profile,waveguide thickness, scattering level, electroooptic effect, andcrystallographic phases. These acids have different values ofsome physical parameters, i.e., boiling point, vapor pressure,and dissociation constant [13], and their mixture induces inter-esting effects during the waveguide formation. In particular, im-portant improvements of the optical properties have been foundunder specific fabrication conditions, even after a high temper-ature and long time exchange process.
II. EXPERIMENTAL RESULTS AND DISCUSSION
A. Waveguide Fabrication
PE waveguides were fabricated in optical grade Z-cut andX-cut LiNbO substrates. A mixed proton source formed bybenzoic acid and different molar percentages of adipic acid wasused. After melting together the acid powders in a beaker placedin an oil bath at 235 C with a temperature control within 0.1 C,the sample was fully immersed and the exchange occurred for2 h in air. After this process, the sample was cooled for 5 minin air and cleaned by an ultrasonic bath to eliminate the residualacid. A number of Z-cut planar waveguides, named series I, andtwo X-cut planar waveguides (samples PEXB1 and PEXBA1)were fabricated by using various adipic acid concentrations inthe 0 mol%–100 mol% range. Series II of Z-cut samples hasbeen also fabricated under the same fabrication conditions ofseries I to check the repeatibility of the exchange process in the
0733–8724/02$17.00 © 2002 IEEE
72 JOURNAL OF LIGHTWAVE TECHNOLOGY, VOL. 20, NO. 1, JANUARY 2002
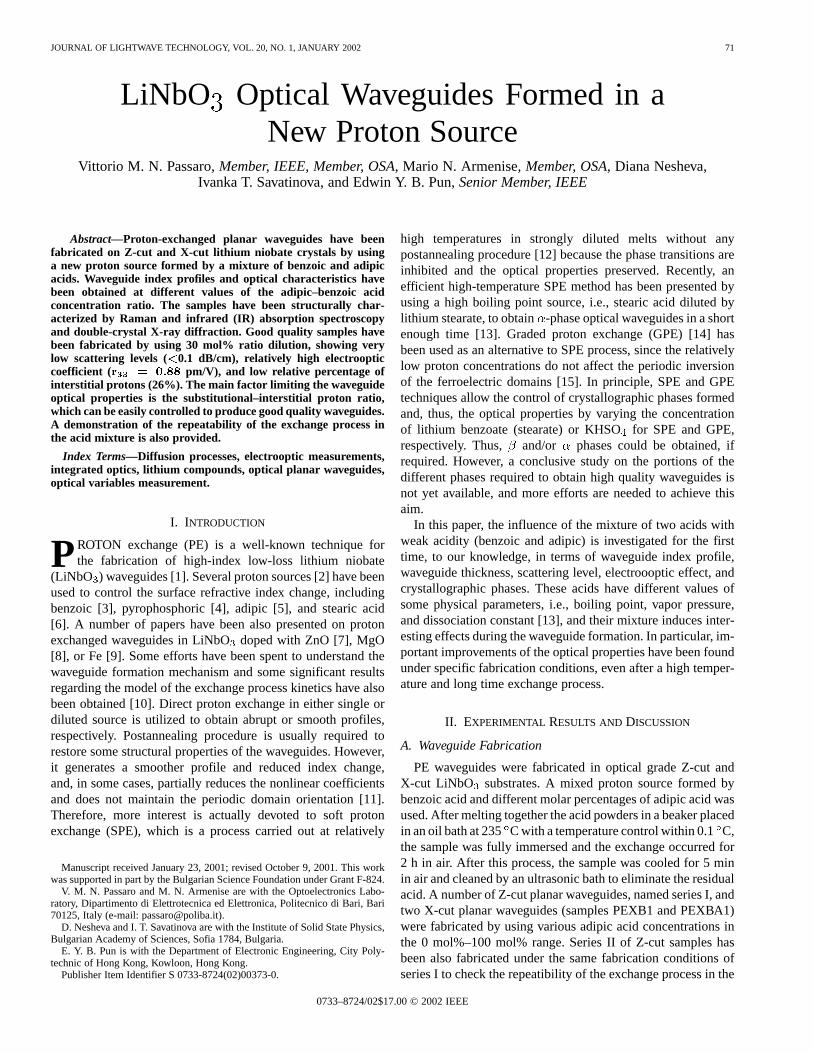
TABLE IOPTICAL AND ELECTROOPTICAL PROPERTIES AT � = 632:8 nm (SERIES I)
acid mixture. Even if, in this paper, we refer to Z-cut samples ofseries I and II and to two X-cut samples, a very large number ofsamples were fabricated and characterized.
B. Index Profile and Waveguide Thickness
All the prepared samples were optically characterized atnm. The fabrication conditions and the results of the
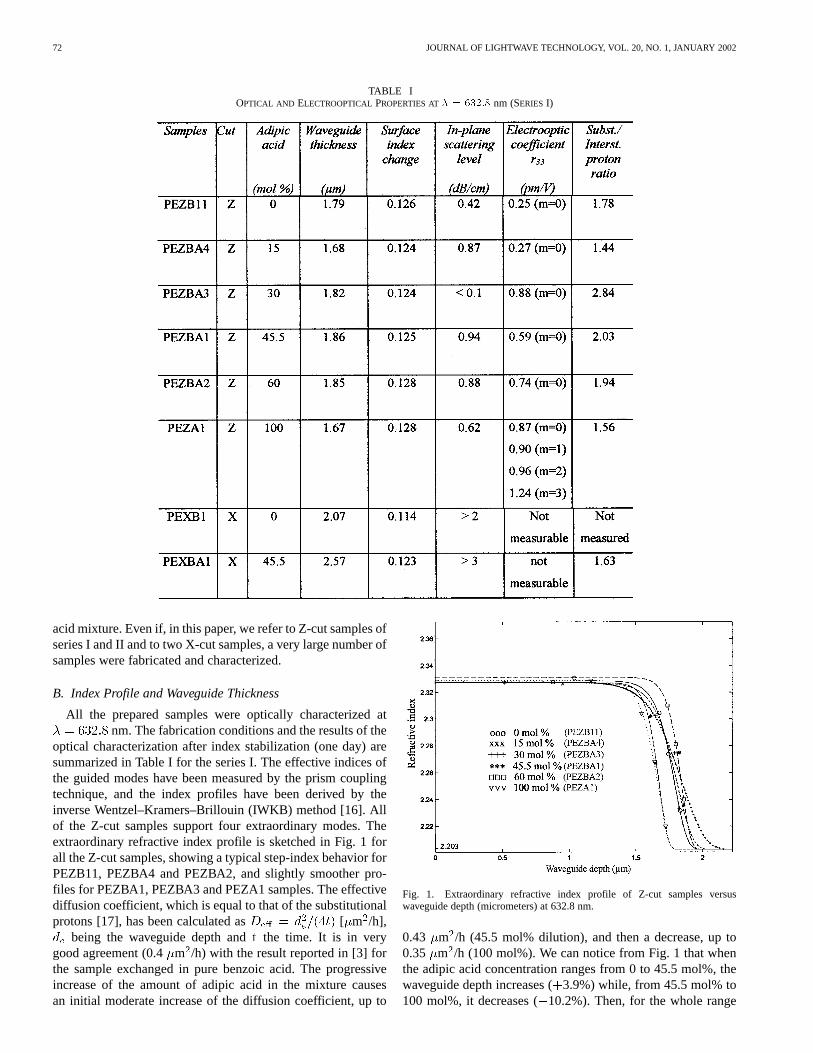
optical characterization after index stabilization (one day) aresummarized in Table I for the series I. The effective indices ofthe guided modes have been measured by the prism couplingtechnique, and the index profiles have been derived by theinverse Wentzel–Kramers–Brillouin (IWKB) method [16]. Allof the Z-cut samples support four extraordinary modes. Theextraordinary refractive index profile is sketched in Fig. 1 forall the Z-cut samples, showing a typical step-index behavior forPEZB11, PEZBA4 and PEZBA2, and slightly smoother pro-files for PEZBA1, PEZBA3 and PEZA1 samples. The effectivediffusion coefficient, which is equal to that of the substitutionalprotons [17], has been calculated as [ m /h],
being the waveguide depth and the time. It is in verygood agreement (0.4 m /h) with the result reported in [3] forthe sample exchanged in pure benzoic acid. The progressiveincrease of the amount of adipic acid in the mixture causesan initial moderate increase of the diffusion coefficient, up to
Fig. 1. Extraordinary refractive index profile of Z-cut samples versuswaveguide depth (micrometers) at 632.8 nm.
0.43 m /h (45.5 mol% dilution), and then a decrease, up to0.35 m /h (100 mol%). We can notice from Fig. 1 that whenthe adipic acid concentration ranges from 0 to 45.5 mol%, thewaveguide depth increases ( 3.9%) while, from 45.5 mol% to100 mol%, it decreases ( 10.2%). Then, for the whole range

PASSARO et al.: LiNbO OPTICAL WAVEGUIDES FORMED IN A NEW PROTON SOURCE 73
Fig. 2. Index profile versus waveguide depth for PEZBA1 sample, 15 min afterthe exchange (xxx) and one day later (ooo).
of the adipic acid concentration, we observe a change of thewaveguide depth of the order of 14%. In the same range ofdilution, the surface index change substantially remainsconstant, the maximum variation being less than 3.2%. Noordinary modes have been found in Z-cut samples, as expected.
We have verified the repeatibility of the exchange processby comparing the two series of Z-cut samples in terms ofwaveguide parameters. In fact, the waveguide thicknesses andindex profiles do not change significantly for the two series, themaximum variation being less than 6% in the PEZBA4 sample.Optical measurements on PEXB1 and PEXBA1 samples havedetected a quasi-step-index profile, five extraordinary modesfor the former and six for the latter, a large thickness increase( 23.7%), and a moderate increase ( 8.2%) of the surfaceindex change when the mixed melt is used (45.5 mol%) withrespect to the 0% case. However, the X-cut samples exhibitedsome surface damage (stronger after immersion in the mixedmelt) and it was impossible to make some of the measurements,e.g., electrooptic coefficient measurements and waveguideRaman spectroscopy.
The index stability of the Z-cut samples has been studiedby measuring the effective index on the samples as exchanged,after one day and again three months later. Only the PEZBA1sample of series I showed a significant index instability, witha step-index profile immediately after the exchange (shown inFig. 2) and a smoother profile (shown in Figs. 1 and 2) afterone day, its depth and surface index change decreasing from1.93 to 1.86 m and from 0.13 to 0.125, respectively. SamplesPEZBA4 and PEZBA3 showed a similar index variation withtime, stable after one day, their index profiles maintaining thesame shape. High index stability was observed in the remainingsamples, namely PEZB11, PEZBA2, PEZA1, and PEXBA1. Noindex changes have been observed in all the samples of both se-ries after three months.
The index profile has been modeled with high accuracy by ageneralized Gaussian function as
Fig. 3. In-plane scattering level (decibels) versus prism spacing (millimeters)for Z-cut samples at 632.8 nm.
where is the substrate index and a is the Gaussian functionexponent. After the extraction of the parameters, , , and ,by IWKB method, the function has been used in a com-puter program, based on the transfer matrix method (TMM), tocalculate the effective indexes. Then, these theoretical valueshave been compared with those obtained experimentally, theerror in the evaluation of the surface index change and of thewaveguide depth remaining always less than 0.3% and 0.22%,respectively, for each sample. The obtained values confirm thestep-index profile [18] ( ) for PEZB11, PEZBA4, andPEZBA2 samples and smoother profile ( ) for PEZBA3,PEZBA1, and PEZA1 samples.
C. In-Plane Scattering
Measurements of the in-plane scattering levels have been car-ried out on both Z-cut and X-cut samples by a standard ex-perimental set-up [19]. The scattering levels are represented inFig. 3 for the samples of series I in terms of the slope of thelinear regression lines. The slope ranges from 0.42 (PEZB11) to0.94 dB/cm (PEZBA1) (standard deviation of 0.04 dB), whichis typical in high index proton exchanged waveguides [5]. How-ever, the sample PEZBA3 has shown an unexpected decrease ofscattering loss, lower than 0.1 dB/cm. Moreover, the measure-ments on the samples of series II have confirmed the order ofmagnitude of the loss, which is rather low for PEZBA3 sample( 0.1 dB/cm) and 0.4 dB/cm for the other samples. X-cutsamples exhibited higher scattering levels, 2 dB/cm, the worstcase being the sample exchanged in the mixed melt.
D. Optical Dispersion
Measurements of the optical dispersion have been carriedout at several wavelengths (457.9, 465.8, 472.7, 476.5, 488,496.5, 501.7, 514.5, and 632.8 nm) by using both a tunableArgon source and a He–Ne laser on PEXB1, PEXBA1 samplesand PEZB11 and PEZBA1 samples of both series I and II. Thenumber of modes increases with decreasing the wavelength, asexpected. The relevant index profiles at different wavelengthshave given a constant waveguide depth for PEXB1 ( 2 m),
74 JOURNAL OF LIGHTWAVE TECHNOLOGY, VOL. 20, NO. 1, JANUARY 2002
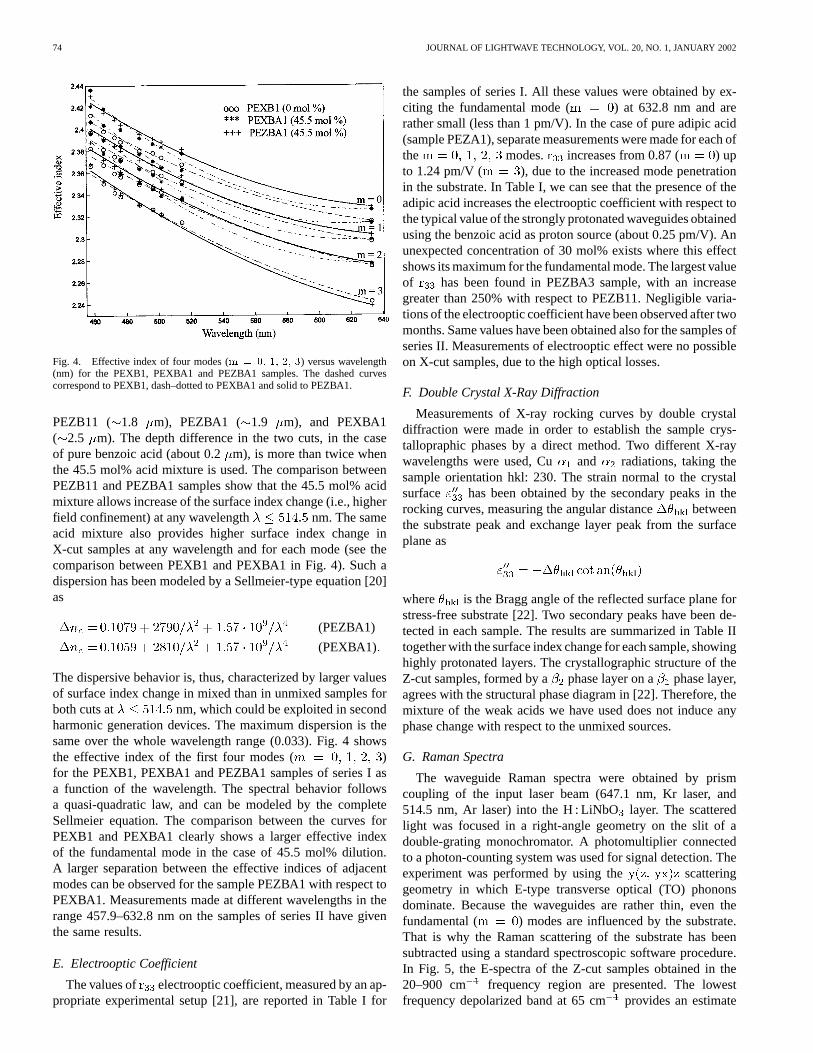
Fig. 4. Effective index of four modes (m = 0; 1; 2; 3) versus wavelength(nm) for the PEXB1, PEXBA1 and PEZBA1 samples. The dashed curvescorrespond to PEXB1, dash–dotted to PEXBA1 and solid to PEZBA1.
PEZB11 ( 1.8 m), PEZBA1 ( 1.9 m), and PEXBA1( 2.5 m). The depth difference in the two cuts, in the caseof pure benzoic acid (about 0.2 m), is more than twice whenthe 45.5 mol% acid mixture is used. The comparison betweenPEZB11 and PEZBA1 samples show that the 45.5 mol% acidmixture allows increase of the surface index change (i.e., higherfield confinement) at any wavelength nm. The sameacid mixture also provides higher surface index change inX-cut samples at any wavelength and for each mode (see thecomparison between PEXB1 and PEXBA1 in Fig. 4). Such adispersion has been modeled by a Sellmeier-type equation [20]as
(PEZBA1)
(PEXBA1)
The dispersive behavior is, thus, characterized by larger valuesof surface index change in mixed than in unmixed samples forboth cuts at nm, which could be exploited in secondharmonic generation devices. The maximum dispersion is thesame over the whole wavelength range (0.033). Fig. 4 showsthe effective index of the first four modes ( )for the PEXB1, PEXBA1 and PEZBA1 samples of series I asa function of the wavelength. The spectral behavior followsa quasi-quadratic law, and can be modeled by the completeSellmeier equation. The comparison between the curves forPEXB1 and PEXBA1 clearly shows a larger effective indexof the fundamental mode in the case of 45.5 mol% dilution.A larger separation between the effective indices of adjacentmodes can be observed for the sample PEZBA1 with respect toPEXBA1. Measurements made at different wavelengths in therange 457.9–632.8 nm on the samples of series II have giventhe same results.
E. Electrooptic Coefficient
The values of electrooptic coefficient, measured by an ap-propriate experimental setup [21], are reported in Table I for
the samples of series I. All these values were obtained by ex-citing the fundamental mode ( ) at 632.8 nm and arerather small (less than 1 pm/V). In the case of pure adipic acid(sample PEZA1), separate measurements were made for each ofthe modes. increases from 0.87 ( ) upto 1.24 pm/V ( ), due to the increased mode penetrationin the substrate. In Table I, we can see that the presence of theadipic acid increases the electrooptic coefficient with respect tothe typical value of the strongly protonated waveguides obtainedusing the benzoic acid as proton source (about 0.25 pm/V). Anunexpected concentration of 30 mol% exists where this effectshows its maximum for the fundamental mode. The largest valueof has been found in PEZBA3 sample, with an increasegreater than 250% with respect to PEZB11. Negligible varia-tions of the electrooptic coefficient have been observed after twomonths. Same values have been obtained also for the samples ofseries II. Measurements of electrooptic effect were no possibleon X-cut samples, due to the high optical losses.
F. Double Crystal X-Ray Diffraction
Measurements of X-ray rocking curves by double crystaldiffraction were made in order to establish the sample crys-tallopraphic phases by a direct method. Two different X-raywavelengths were used, Cu and radiations, taking thesample orientation hkl: 230. The strain normal to the crystalsurface has been obtained by the secondary peaks in therocking curves, measuring the angular distance betweenthe substrate peak and exchange layer peak from the surfaceplane as
where is the Bragg angle of the reflected surface plane forstress-free substrate [22]. Two secondary peaks have been de-tected in each sample. The results are summarized in Table IItogether with the surface index change for each sample, showinghighly protonated layers. The crystallographic structure of theZ-cut samples, formed by a phase layer on a phase layer,agrees with the structural phase diagram in [22]. Therefore, themixture of the weak acids we have used does not induce anyphase change with respect to the unmixed sources.
G. Raman Spectra
The waveguide Raman spectra were obtained by prismcoupling of the input laser beam (647.1 nm, Kr laser, and514.5 nm, Ar laser) into the H : LiNbO layer. The scatteredlight was focused in a right-angle geometry on the slit of adouble-grating monochromator. A photomultiplier connectedto a photon-counting system was used for signal detection. Theexperiment was performed by using the scatteringgeometry in which E-type transverse optical (TO) phononsdominate. Because the waveguides are rather thin, even thefundamental ( ) modes are influenced by the substrate.That is why the Raman scattering of the substrate has beensubtracted using a standard spectroscopic software procedure.In Fig. 5, the E-spectra of the Z-cut samples obtained in the20–900 cm frequency region are presented. The lowestfrequency depolarized band at 65 cm provides an estimate

PASSARO et al.: LiNbO OPTICAL WAVEGUIDES FORMED IN A NEW PROTON SOURCE 75
TABLE IISTRAIN OF EACH PHASE INSIDE THE Z-CUT SAMPLES
Fig. 5. Waveguide Raman spectra of (a) PEZB11, (b) PEZBA4, (c) PEZBA3,(d) PEZBA1, (e) PEZBA2, and (f) PEZA1. � = 647:1 nm.
of the proton fraction in the H Li NbO layers [23]. Thelarge intensity of this band in all of the spectra in Fig. 5 is agood evidence that the samples are highly protonated.
The spectra shown in Fig. 5 correspond to what is usu-ally called “common PE guides made of a mixture of( ) phases” [24] and not to individual layersof a definite phase. The waveguide mode, which is excitedin the waveguide volume, is totally reflected back and forthbetween the interfaces of the film, crossing many times theguide depth, thus detecting all of the existing phases. From aRaman-spectroscopy point of view, the waveguide should actas a multiphase system. In such a case, the spectra should bea superposition of the spectra of the coexisting phases withan intensity determined by their abundance and Raman crosssections. In Fig. 6, the spectrum of one of the samples, PEZBA3(30 mol% adipic acid), is compared with that of a PE sampleprepared under conditions known to result in the formation of
– phase waveguides [22], [23], i.e., PE process in purebenzoic acid (8 h, 225 C) followed by annealing procedure(1 h, 240 C). We observe that the two spectra are almostidentical. Thus, because the spectra of all of the Z-cut samplesare very similar to each other, we can conclude that the samplesformed by the immersion in a mixture of benzoic–adipic acidsare also of – structure, i.e., a two-phase system with a
-phase top layer and a -phase bottom one. This conclusionagrees well with the X-ray diffraction measurements, thereconstructed index profiles, which are characterized by a
Fig. 6. A comparison between the waveguide Raman spectra of H : LiNbOsamples made in (a) pure benzoic acid, (b) a mixture of benzoic and adipic(30 mol%) acids, and (c) a pure substrate. � = 647:1 nm.
substantially constant surface index change, and with thetypical two-phase system observed in PE waveguides formed,for instance, in benzoic acid at 240 C for 7 h [22]. For thesample PEZBA1 (45.5 mol%), we have observed a considerablebackground in the spectrum, due to a diffused Raman scatteringfrom the layer, which can explain the relatively high valueof the in-plane scattering levels (see Table I).
H. Infrared Spectra
Additional information has been derived from the OH in-frared spectra. They have been recorded with a two-beam setupso that the bulk OH absorbance was subtracted from that ofthe proton-exchanged region. The absorbance curve in Fig. 7implies the existence of three OH bands around 3500 cm ,characteristic for the presence of substitutional protons (relevantto free OH groups), and a very wide band with a maximum atabout 3300 cm (relevant to hydrogen-bounded OH groups),due to the presence of interstitial protons, which are randomlydistributed in the lattice and have a strong influence on the scat-tering losses. These four OH components have been identifiedin all of the prepared samples. An important parameter for eachsample could be defined from the analysis of this spectral re-gion. In fact, the substitutional–interstitial proton ratio can befound as the ratio of the sum of the integral intensities of thethree bands around 3500 cm to the integral intensity of the3300 cm band. The values of the proton ratio determined in
76 JOURNAL OF LIGHTWAVE TECHNOLOGY, VOL. 20, NO. 1, JANUARY 2002
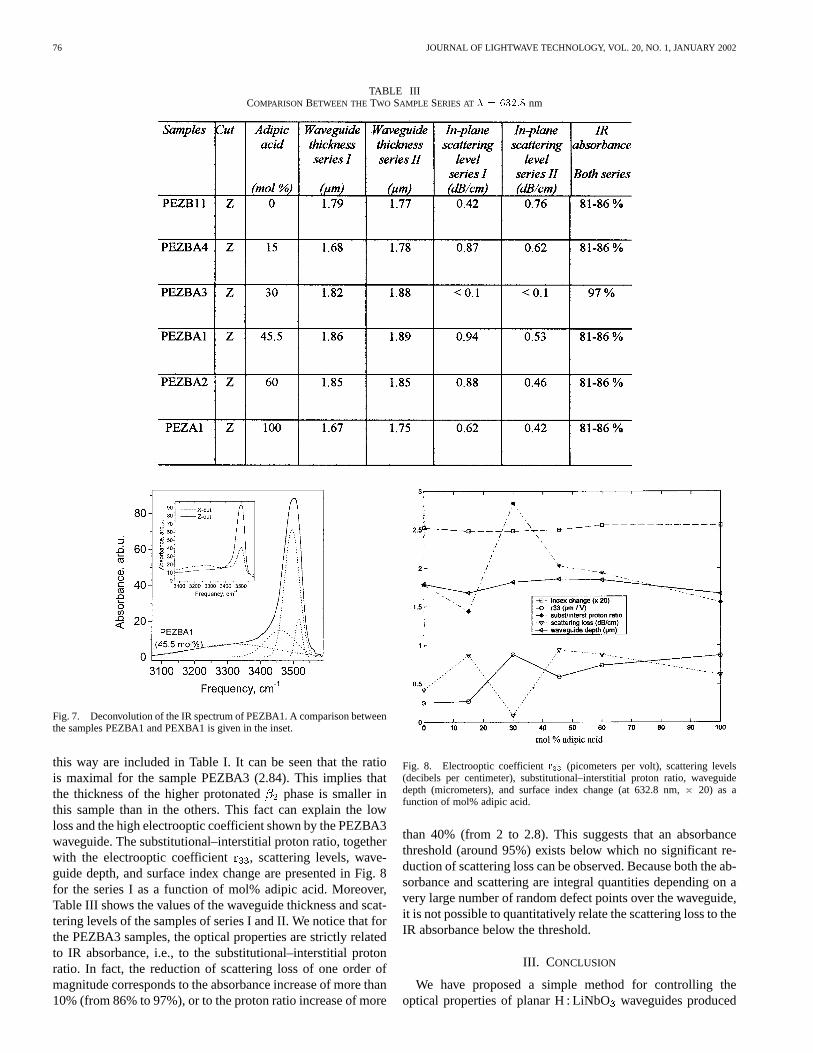
TABLE IIICOMPARISON BETWEEN THE TWO SAMPLE SERIES AT � = 632:8 nm
Fig. 7. Deconvolution of the IR spectrum of PEZBA1. A comparison betweenthe samples PEZBA1 and PEXBA1 is given in the inset.
this way are included in Table I. It can be seen that the ratiois maximal for the sample PEZBA3 (2.84). This implies thatthe thickness of the higher protonated phase is smaller inthis sample than in the others. This fact can explain the lowloss and the high electrooptic coefficient shown by the PEZBA3waveguide. The substitutional–interstitial proton ratio, togetherwith the electrooptic coefficient , scattering levels, wave-guide depth, and surface index change are presented in Fig. 8for the series I as a function of mol% adipic acid. Moreover,Table III shows the values of the waveguide thickness and scat-tering levels of the samples of series I and II. We notice that forthe PEZBA3 samples, the optical properties are strictly relatedto IR absorbance, i.e., to the substitutional–interstitial protonratio. In fact, the reduction of scattering loss of one order ofmagnitude corresponds to the absorbance increase of more than10% (from 86% to 97%), or to the proton ratio increase of more
Fig. 8. Electrooptic coefficient r (picometers per volt), scattering levels(decibels per centimeter), substitutional–interstitial proton ratio, waveguidedepth (micrometers), and surface index change (at 632.8 nm, � 20) as afunction of mol% adipic acid.
than 40% (from 2 to 2.8). This suggests that an absorbancethreshold (around 95%) exists below which no significant re-duction of scattering loss can be observed. Because both the ab-sorbance and scattering are integral quantities depending on avery large number of random defect points over the waveguide,it is not possible to quantitatively relate the scattering loss to theIR absorbance below the threshold.
III. CONCLUSION
We have proposed a simple method for controlling theoptical properties of planar H : LiNbO waveguides produced
PASSARO et al.: LiNbO OPTICAL WAVEGUIDES FORMED IN A NEW PROTON SOURCE 77
using a mixture of weak acids as proton source. Good opticalquality has been obtained by using a concentration of 30 mol%adipic acid in benzoic acid. The optical characterization,double-crystal X-ray diffraction, and Raman spectra havesimultaneously shown that the crystallographic phases formedin these samples have the – structure for any acid dilution,i.e., the mixture does not change the exchanged layer structureobtained by using pure adipic or benzoic acids. The diffusioncoefficients of both interstitial and substitutional protonsdepend on the adipic acid concentration which, in this way,directly influences the exchange process kinetics. Moreover,we have found, by IR absorption measurements, that the aciddilution significantly changes the substitutional–interstitialproton ratio and, then, directly influences the waveguide opticaland electrooptical properties. The repeatability of the exchangeprocess in the new proton source has been also proved on alarge number of samples.
REFERENCES
[1] J. L. Jackel, C. E. Rice, and J. J. Veselka, “Proton exchange for highindex waveguides in LiNbO ,” Appl. Phys. Lett., vol. 41, pp. 607–608,1982.
[2] M. N. Armenise, V. M. N. Passaro, I. Savatinova, C. Ziling, E. Y. B.Pun, K. K. Loi, and P. S. Chung, “Structural characteristics of protonexchanged lithium niobate waveguides formed in different protonsources,” Proc. SPIE, vol. 1813, addendum, 1992.
[3] D. F. Clark, A. C. G. Nutt, K. K. Wong, P. J. R. Laybourn, and R. M. DeLa Rue, “Characterization of proton-exchange slab optical waveguidesin z-cut LiNbO ,” J. Appl. Phys., vol. 54, no. 11, pp. 6218–6220, 1983.
[4] C. C. Ziling, L. Pokrovskii, N. Terpugov, I. Savatinova, M. Kuneva, S.Tonchev, M. N. Armenise, and V. M. N. Passaro, “Optical and structuralproperties of annealed PE : LiNbO waveguides formed with pyrophos-phoric and benzoic acids,” J. Appl. Phys., vol. 73, no. 7, pp. 3125–3132,1993.
[5] E. Y. B. Pun, K. K. Loi, C. F. Mak, and P. S. Chung, “High-indexproton-exchanged MgO : LiNbO optical waveguides using adipicacid,” J. Appl. Phys., vol. 73, no. 6, pp. 3114–3116, 1993.
[6] E. Y. Pun, K. K. Loi, S. Zhao, and P. S. Chung, “Proton exchangedLiNbO optical waveguides using stearic acid,” IEEE Photon. Technol.Lett., vol. 3, pp. 1006–1008, Nov. 1991.
[7] W. X. Hou and T. C. Chong, “Characterization of annealed, proton-ex-changed optical waveguides in ZnO : LiNbO crystal,” Appl. Opt., vol.36, no. 21, pp. 5083–5088, 1997.
[8] G. Hagner and T. Bachmann, “Refractive index profiles and exchangeratios of proton-exchanged waveguides in congruent and MgO-dopedLiNbO ,” Phys. Stat. Sol. (a), vol. 165, pp. 205–212, 1998.
[9] H. Zhang and C. Xu, “Element profiles in proton exchanged Fe : LiNbOwaveguides,” Mater. Chem. Phys., vol. 47, pp. 151–153, 1997.
[10] K. Ito and K. Kawamoto, “The dependence of the diffusion coefficienton the proton concentration in the proton exchange of LiNbO ,” Jpn. J.Appl. Phys., vol. 36, pp. 6775–6780, 1997.
[11] K. El Hadi, M. Sundheimer, P. Aschieri, P. Baldi, M. P. De Micheli, D.B. Ostrowsky, and F. Laurell, “Quasi phase-matched parametric inter-actions in proton-exchanged lithium niobate waveguides,” J. Opt. Soc.Amer. B, vol. 14, pp. 3197–3203, 1997.
[12] L. Chanvillard, P. Aschieri, P. Baldi, M. De Micheli, D. B. Ostrowsky,L. Huang, and D. J. Bamford, “Highly efficient integrated optical para-metric generator produced by soft proton exchange in PPLN,” in Proc.9th Eur. Conf. Integrated Optics (ECIO’99), Turin, Italy, Apr. 13–16,1999, pp. 513–516.
[13] Y. N. Korkishko, V. A. Fedorov, and O. Y. Feoktistova, “LiNbO opticalwaveguide fabrication by high-temperature proton exchange,” J. Light-wave Technol., vol. 18, pp. 562–568, Apr. 2000.
[14] V. A. Ganshin and Y. N. Korkishko, “Proton exchange in lithium niobateand lithium tantalate single crystals: Regularities and specific features,”Phys. Stat. Sol. (a), vol. 119, pp. 10–25, 1990.
[15] J. Webjorn, “Structural influence of proton exchange on domain-in-verted lithium niobate revealed by means of selective etching,” J.Lightwave Technol., vol. 11, pp. 589–594, Apr. 1993.
[16] K. S. Chiang, “Construction of refractive-index profiles of planar dielec-tric waveguides from the distribution of effective indexes,” J. LightwaveTechnol., vol. LT-3, pp. 385–391, 1985.
[17] J. M. Zavada, H. C. Casey, R. J. States, S. W. Novak, and A. Loni,“Correlation of substitutional hydrogen to refractive index profiles inannealed proton-exchanged Z- and X-cut LiNbO ,” J. Appl. Phys., vol.77, no. 6, pp. 2697–2708, 1995.
[18] Y. N. Korkishko, V. A. Fedorov, M. P. De Mishely, P. Baldi, K. L. Hadi,and A. Leycuras, “Relationships between structural and optical proper-ties of proton exchanged waveguides on Z-cut lithium niobate,” Appl.Opt., vol. 35, no. 36, pp. 7056–7060, 1996.
[19] M. N. Armenise, C. Canali, M. De Sario, P. Franzosi, J. Singh, R. H.Hutchison, and R. M. De La Rue, “Dependence of inplane scatteringlevels in Ti : LiNbO optical waveguides on diffusion time,” IEE Proc.,pt. H, vol. 131, no. 5, pp. 295–298, 1984.
[20] K. El Hadi, V. Rastogi, M. R. Shenoy, K. Thyagarajan, M. De Micheli,and D. B. Ostrowsky, “Spectral measurement of the film-substrate indexdifference in proton-exchanged LiNbO waveguides,” Appl. Opt., vol.37, no. 27, pp. 6463–6467, 1998.
[21] I. Savatinova, S. Tonchev, R. Todorov, M. N. Armenise, V. M. N. Pas-saro, and C. C. Ziling, “Electro-optic effect in proton exchanged LiNbOand LiTaO waveguides,” J. Lightwave Technol., vol. 14, pp. 403–409,Mar. 1996.
[22] Y. N. Korkishko and V. A. Fedorov, “Structural Phase Diagram ofH Li NbO waveguides: The correlation between optical andstructural properties,” IEEE J. Select. Topics Quantum Electron., vol.2, pp. 187–196, Feb. 1996.
[23] I. Savova, I. Savatinova, and E. Liarokapis, “Phase composition of Z-cutprotonated LiNbO : A Raman study,” Opt. Mater., vol. 16, no. 3, pp.353–360, 2001.
[24] J. Rams, F. Agullo-Rueda, and J. M. Cabrera, “Structure of high indexproton exchanged LiNbO waveguides with undergraded nonlinear op-tical coefficients,” Appl. Phys. Lett., vol. 71, no. 23, pp. 3356–3358,1997.
Vittorio M. N. Passaro (M’92) was born in Bari, Italy, in November 1962. Hereceived the laurea degree in electronic engineering from the University of Bari,Bari, in 1988 and the Ph.D. degree in electronic engineering from Polytechnicof Bari, Bari, in 1992.
In 1991, he joined the Polytechnic of Bari as a Researcher of Electronics, andas Associate Professor of Electronic Technologies in October 2000. Since 1988,his principal research interests have been in the fields of optoelectronics and in-tegrated optics. His interests include fabrication and characterization techniquesof lithium niobate-based optical waveguides and devices, and design and sim-ulation of guided-wave devices and circuits in ferroelectric and semiconductormaterials for optical signal processing, optical computing, and optical controlof microwaves. He is the author or coauthor of more than 60 journal articles andconference presentations.
Dr. Passaro is a member of the Optical Society of America (OSA), the IEEELasers and Electro-Optics Society (LEOS), the Associazione Elettrotecnica Ital-iana (AEI) and the Societa’ Italiana di Ottica e Fotonica (S.I.O.F.).
Mario N. Armenise, photograph and biography not available at the time ofpublication.
Diana Nesheva, photograph and biography not available at the time of publica-tion.
Ivanka T. Savatinova, photograph and biography not available at the time ofpublication.
Edwin Y. B. Pun (S’79–M’79–SM’91), photograph and biography not availableat the time of publication.