LIMNOLOGICAL STUDIES OF KARLUK LAKE, ALASKA, 1926 … · LIMNOLOGICAL STUDIES OF KARLUK LAKE,"...
30
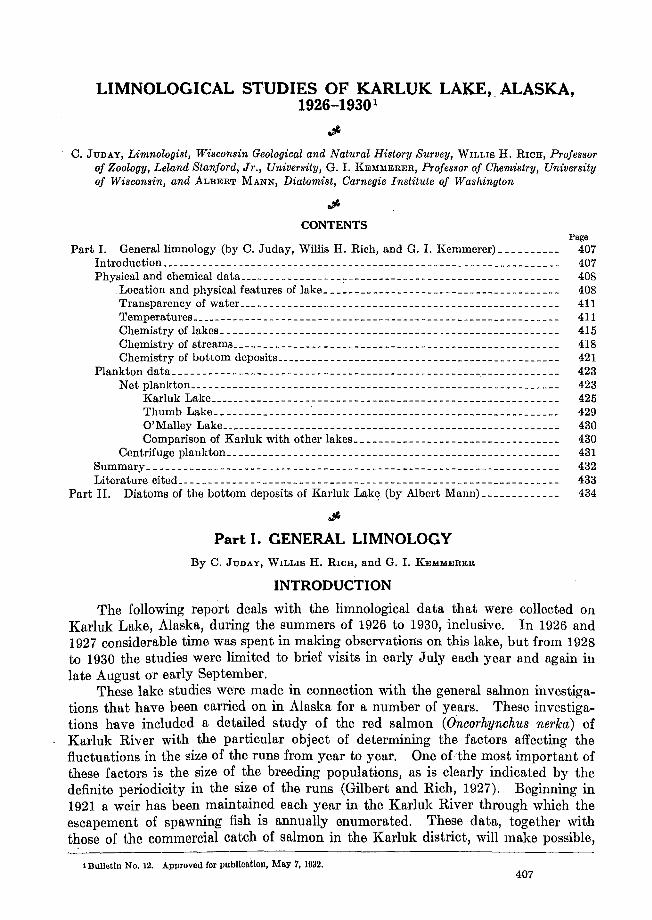
LIMNOLOGICAL STUDIES OF KARLUK LAKE," ALASKA, 1926-1930 1 $ C. JUDAY, Limnologist, Wisconsin Geological and Natural History Survey, WILLIS H. RICH, Professor of Zoology, Leland Stanford, Jr., University, G. 1. KEMMERER, Professor of Chemistry, University of Wisconsin, and ALBERT MANN, Diatomist, Carnegie Institute of Washington $ CONTENTS Page Part 1. General limnology (by C. Juday, Willis H. Rich, and G. 1. Kemmerer) c____ 407 Introduction__________________________________________________________________ 407 Physical and chemical data -- __ -----_c ________ ________ __ _ 408 Location and physical features of lake_ ___ __ __ ___ __ __ ___ ___ _ 408 Transparency of water_____________________________________________________ 411 Temperatures_____________________________________________________________ 411 Chemistry of lakes ________________________________________________________ 415 Chemistry of streams .. ______ ___ 418 Chemistry of bottom deposits_____ _______ __ _________ ______ __ 421 Plankton data 423 Netplankton_____________________________________________________________ 423 Karluk Lake__________________________________________________________ 425 Thumb Lake "___ ________ __ __ __ ______ ___ __ 429 O'Malley Lake________________________________________________________ 430 Comparison of Karluk with other lakes __________________________________ 430 Centrifuge plankton_ ______________________________________________________ 431 Summary____________________________________________________________________ 432 Literature cited__ __ __ __ __ ____ ________ ___ _ _________ 433 Part II. Diatoms of the bottom deposits of Karluk Lake (by Albert Mann) _____________ 434 $ Part I. GENERAL LIMNOLOGY By C. JUDAY, WILLIS H. RICH, and G. 1. KEMMERER INTRODUCTION The following report deals with the limnological data that were collected on Karluk Lake, Alaska, during the summers of 1926 to 1930, inclusive. In 1926 and 1927 considerable time was spent in making observations on this lake, but from 1928 to 1930 the studies were limited to brief visits in early July each year and again in late August or early September. These lake studies were made in connection with the general salmon investiga- tions that have been carried on in Alaska for a number of years. These investiga- tions have included a detailed study of the red salmon (Oncorhynchus nerka) of Karluk River with the particular object of determining the factors affecting the fluctuations in the size of the runs from year to year. One oithe most important of these factors is the size of the breeding populations, as is clearly indicated by the definite periodicity in the size of the runs (Gilbert and Rich, 1927). Beginning in 1921 a weir has been maintained each year in the Karluk River through which the escapement of spawning fish is annually enumerated. These data, together with those of the commercial catch of salmon in the Karluk district, will make possible, 1 Bulletin No. 12. Approved for publication, May 7, 1032. 407
Transcript of LIMNOLOGICAL STUDIES OF KARLUK LAKE, ALASKA, 1926 … · LIMNOLOGICAL STUDIES OF KARLUK LAKE,"...
LIMNOLOGICAL STUDIES OF KARLUK LAKE," ALASKA,1926-1930 1
$
C. JUDAY, Limnologist, Wisconsin Geological and Natural History Survey, WILLIS H. RICH, Professorof Zoology, Leland Stanford, Jr., University, G. 1. KEMMERER, Professor of Chemistry, Universityof Wisconsin, and ALBERT MANN, Diatomist, Carnegie Institute of Washington
$
CONTENTSPage
Part 1. General limnology (by C. Juday, Willis H. Rich, and G. 1. Kemmerer) c____ 407Introduction__________________________________________________________________ 407Physical and chemical data - - __ - - - - - _c _ _ _ _ _ _ _ _ _ _ _ _ _ _ _ _ __ _ 408
Location and physical features of lake_ ___ __ __ ___ ____ ___ ___ _ 408Transparency of water_____________________________________________________ 411Temperatures_____________________________________________________________ 411Chemistry of lakes ________________________________________________________ 415Chemistry of streams .. ______ ___ 418Chemistry of bottom deposits_____ _______ __ _________ ______ __ 421
Plankton data ~------------- 423Netplankton_____________________________________________________________ 423
Karluk Lake__________________________________________________________ 425Thumb Lake "___ ________ __ __ __ ______ ___ __ 429O'Malley Lake________________________________________________________ 430Comparison of Karluk with other lakes __________________________________ 430
Centrifuge plankton_ ______________________________________________________ 431Summary____________________________________________________________________ 432Literature cited__ __ __ __ __ ____ ________ ___ _ _________ 433
Part II. Diatoms of the bottom deposits of Karluk Lake (by Albert Mann) _____________ 434
$
Part I. GENERAL LIMNOLOGY
By C. JUDAY, WILLIS H. RICH, and G. 1. KEMMERER
INTRODUCTION
The following report deals with the limnological data that were collected onKarluk Lake, Alaska, during the summers of 1926 to 1930, inclusive. In 1926 and1927 considerable time was spent in making observations on this lake, but from 1928to 1930 the studies were limited to brief visits in early July each year and again inlate August or early September.
These lake studies were made in connection with the general salmon investigations that have been carried on in Alaska for a number of years. These investigations have included a detailed study of the red salmon (Oncorhynchus nerka) ofKarluk River with the particular object of determining the factors affecting thefluctuations in the size of the runs from year to year. One oithe most important ofthese factors is the size of the breeding populations, as is clearly indicated by thedefinite periodicity in the size of the runs (Gilbert and Rich, 1927). Beginning in1921 a weir has been maintained each year in the Karluk River through which theescapement of spawning fish is annually enumerated. These data, together withthose of the commercial catch of salmon in the Karluk district, will make possible,
1 Bulletin No. 12. Approved for publication, May 7, 1032.407

408 BULLETIN OF THE BUREAU OF FISHERIES
in time, a fairly. reliable determination of the correlation existing between the sizeof the escapement--that is, breeding population-and the number of the resultingprogeny. On a priori grounds, however, it could be anticipated that this correlationwould not be perfect, since there are various environmental factors which doubtlessaffect the rate of mortality throughout the life of the salmon from the time the eggsare laid until sexual maturity is reached and the fish return from the sea to spawn.A few clear cut cases are known in which enviromental conditions have destroyedthe effect of large spawning escapements. Of the various factors which may affectsurvival in the ocean we know, at present, very little, but it seems rather probablethat conditions in the sea are much more constant than in fresh water. Certainlysuch factors as the water conditions at the time of spawning and during the incubation period, the abundance of enemies and competitors, and the abundance of naturalfood organisms in the lakes bear directly upon the ultimate success of breeding.
The Karluk watershed, which is situated in the western part of Kodiak Island,is occupied by the Karluk River, Karluk Lake, Thumb Lake, O'Malley Lake, and aconsiderable number of tributary streams of various sizes and which together constitute very important breeding grounds for the red salmon. The spawning escapements since 1921 have varied from about four hundred thousand to approximatelytwo and a half millions. Gilbert and Rich (1927) estimated that well over 1,000million red salmon eggs were deposited in the lakes and streams of this watershedduring the spawning season of 1926.
The young red salmon derived from the eggs deposited in this watershed spendsome time in Karluk Lake, where they are almost exclusively plankton feeders; theymigrate to the sea in the spring of their second to fourth year. The great majorityof them leave the lake in the spring of their third year. By far the larger number ofthem mature in their fifth year and return to spawn at that time, so they spend approximately half of their lives in the lake and half in the sea. The lake, therefore,plays a very important role as a nursery for the young red salmon, and this fact hasled to a general assessment of its physical, chemical, and biological status. TheKarluk system is of special interest in this connection since it is generally recognizedthat, for its size and the area of its suitable spawning grounds, it is unusually productive. It has maintained a large run over a long period of intense exploitationa run that is still considered one of the best of the whole of Alaska outside of BristolBay where there are numerous streams and lakes all of which are much larger thanthose of the Karluk system.. Those engaged in the salmon investigations at Karlukhave spent some time each year on the spawning grounds making such studies of theconditions as were possible in such an isolated locality and with the limited timeavailable. Particular attention has been paid to conditions on the spawning beds,but the obvious importance of a knowledge of conditions in the lakes led to the collection of the data which form the basis of this report.
PHYSICAL AND CHEMICAL DATA
LOCATION AND PHYSICAL FEATURES OF LAKE
Karluk Lake lies in latitude 57° 24' N. and longitude 154° 5' W. The lake islong, narrow, and straight sided, with a prominent bay, the Thumb, situated aboutthe middle of the east side. (See fig. 1.) Three small islands help to separate theThumb from the main part of the lake. The main axis of the lake lies in a generalnorth and south direction and its maximum length is 19.6 kilometers (12.2 miles);

FIGURE I.-Map or Karluk Lake region, Kodiak Island, Alaska
·IIKILOMET£RS

410 BULLETIN OF THE BUREAU OF FISHERIES
the greatest width is 3.1 kilometers (2 miles). The area is 39.5 square kilometers(15.2 square miles) and the maximum 'depth is 126 meters (413 feet). The meandepth is 48.6 meters (159 feet). The surface of the lake is about 106 meters (350feet) above sea level, so that the deepest part of the basin is about 20 meters (65 feet)below sea level. .
The lake is surromided by mountains which rise to a height of 760 meters (2,500feet) and the immediate shores consist of shale with an occasional small ledge or veinof quartz. The lake basin appears to be of recent glacial origin and the water isimpounded by a large terminal moraine at the north end. In general, the beachesare composed of gravel and bowlders of various sizes. The shores are still in ayouthful stage and the subaqueous terrace is poorly developed; as a result the bottomslopes away abruptly from the shores. The outlet, the Karluk River, flows out ofthe north end of the lake; it is a stream of considerable size and it is about 48 kilometers (30 miles) long (Gilbert and Rich, 1927). A rough estimate of the quantityof water discharged into Karluk Lake by the more important tributary streams wasplaced at 7 cubic meters per second in late August 1928.
The narrow subaqueous terrace and the steep slope of the bottom make conditions unfavorable for the growth of the large aquatic plants along most of the shore;such growths are found in only three favorable localities. Filamentous algre arefound in considerable abundance on submerged rocks and bowlders along the marginof the lake. The shores are well covered with groves of cottonwoods, alders, birches,willows, and shrubs.
Thumb Lake is situated about the middle of the east side of Karluk Lake (fig. 1);it is about 1 kilometer (% mile) long and half a kilometer (% mile) wide. Its maximum depth is 10 meters (33 feet). A short stream known as the Thumb River connects Thumb Lake with Karluk Lake.
O'Malley Lake is situated at the south end of Karluk Lake; it is about 3 kilometers(2 miles) long and %of a kilometer 0' mile) wide. It has a maximum depth of 12meters (40 feet); and its outlet, the 0 'Malley River, flows into the south end ofKarluk Lake.
Gilbert and Rich (1927) published a hydrographic map of Karluk Lake which wasbased' on surveys and soundings made in the summer of 1926. The data concerningthe area and the volume of the lake, which are given in Table 1, are based uponmeasurements of the original map prepared by these authors.
TABLE I.-Area and volume of Karluk Lake
Areas Volume
Squaremiles
Squarekilo
meters
1-----,,----1 Per cent 1----,----1 Per centoC total Stratum Million Million of total
area cubic cubic volumemeters yards
Depth in meters
---------------1---------------------o -." --" -- .. --. -- -- -- --. -- _. -- -- -- -- --. -_.10 _ ,. - -- -- - _' --. -- -- --"" -- .. --' .•-- •... --.--20 __ .••. ,. -- -. -- - --. -- -- .. -- -- -- .. -- .. --. --- -- - --. -- ----30 -------- - .-------------- -- -------------- ------40. _' -------- -- ------ ---- -------- ------------00 -- -- -- -- -- --.--. -- -- -- -- -- -- -- •• - -- --- -- -- -- -- ----60 .• ---- ------ ---. ---. ------------ ------------------70. _' ------ ----. --. ------ ------ -- ---- ---------- -- ..80_. ------ -- -------- --- .•• - ..------- --.----- ------ •.90. _•. -- .. -- -- ---- ------ .--- ---------- -------- ---------100 __ •. __ -- - -- -- -- -- -- -- -- - - -- -- -- -- - -- -- -- - - -- -- - --. ---110 __ •• _-- -- --' -- -- -- ----. --- -- -- - -- - - -- - -- -- - -----120 ..__ --- - - - - --- - -- -- ••• - -- - - -- -- -- _•• - -- - ---
39.535.431. 626.320.21&.411. 09.57.96,34.83.82.8
15.213.712.210.17.85.94,23.73.02.41.81.51.1
100,089.680.066.651. 139.027.824.020.016.012.19.67.1
0-1010-2020-3030-4040-5050-6060-7070-8080-9090-100
100-110110-120120-126
374.3 489.6 19.50334. 7 437. 8 17. 44288. 9 377. 9 15, 06230. 9 302. 0 12. 02173.2 226.5 9.02121. 2 158.5 6.31102. 4 133, 9 5, 33
86. 9 113. 7 4. 5270. 8 92. 6 3, 6955. 3 72. 3 2. 8842. 9 56. 1 2. 2332. 9 43. 0 1. 715.6 7.3 0.29---------
1,920.0 2,511.2 100.00

LIMNOLOGICAL STUDIES OF KARLUK LAKE 411
TRANSPARENCY OF WATER
The transparency of the water was measured by means of the Becchi disk. Theresults of the readings in the three lakes are given in Table 2. In general, the waterof Karluk Lake was more transparent than that of Thumb and 0 'Malley Lakes.Thumb Lake was the least transparent of the three. Karluk Lake was more transparent in 1928 than in either of the other years represented in the table.
TABLE 2.-Transparency of the water in Karluk, Thumb, and 0'Malley Lakes
[The readings of the Secchi disk are indicated in meters and they show the d~pth at which the disk disappeared from view]
Karluk Lake
Date Depth
Thumb Lake
Date Depth
O'Malley Lake
Date Depth
July 10, 1928 _Sept. 3,1928 _July 9,1929 , _Sept. 7, 1929 _July 12,1930 _Sept. 9, 1930 _
8.0 July 9, 1928 _8.0 Sept. 3, 1928 _5.5 July 11, 1929 _4.5 Sept. 7, 1929 _7.5 July 13, 1930 _7.8 Sept. 6, 1930 _
2.5 July 10, 1929 _3.0 Sept. 12, 1929 _2.8 July 15, 1930 _2.5 Sept. 5, 1930 _2.62.0
5.53.84.04.0
TEMPERATURES
The climate of Kodiak Island, on which Karluk Lake is situated, is temperate.The lake lies in the Pacific coast climatic zone of Alaska, and this region possesses amarine climate, with a large amount of cloudy weather. There is no permanent settlement in the vicinityofKarluk Lake, and the nearest weather-observing station is locatedat the village of Kodiak on the eastern end of Kodiak Island, about 160 kilometers(100 miles) from the lake. Table 3 shows the range of variation of atmospherictemperatures at Kodiak from 1926 to 1930, inclusive, as well as the mean temperaturefor these years. The United States Weather Bureau reports that temperatures wereabove normal throughout the year in 1926 at nearly all Alaskan stations, considerablyexceeding all previous records. The mean annual temperature was about normalin 1927 and 1930 and just a little above normal in 1928 and 1929.
TABLE 3.-Range of air temperatures at Kodiak on Kodiak Island, Alaska, during the years 19261930, inclusive, and the mean annual temperature for these five years
Maximum
Year
Minimum Mean annual
"C. "F. "C. "C. "F.
1926______________________________ 25.51927______________________________ 20.01928______________________________ 22.21929______________________________ 27.81930______________________________ 27.2
-------------78 -12.2 10 7.3 45.168 -13.3 8 4.6 40.372 -15.6 4 5.2 41. 482 -11. 6 11 6.2 43.281 -16.7 2 4.7 40.5
The mean monthly temperature was lowest in February, 1926, being 0.5° C. or33° F., but December was almost as low, namely, 0.7° C. or 33.2° F. The meanmonthly temperature was lowest in March from 1927 to 1929; it was -1.8° C.(28.7 0 F.) in 1927, -1.3 0 C. (29.7° F.) in 1928, and -0.3° C. (31.4° F.) in 1929.February had the lowest mean in 1930, namely, -5.3° C. (22.5° F.). The monthlymean was highest in August in 1926 to 1928, inclusive; it was 13.7° C. (56.6° F.) in1926, 11.7° C. (53° F.) in 1927, and 12° C. (53.4° F.) in 1928. In 1929 the monthlymeans were the sallle for July and August, namely, 13.2° C. (55.8° F.). It WElS
highest in August, 1930, namely, 13.5° C. (56.3° F.).

412 BULLETIN OF THE BUREAU OF FISHERIES
The total precipitation at the Kodiak weather station was 195.8 centimeters(77.08 inches) in 1926; 151 centimeters (59.47 inches) in 1927; 167.1 centimeters(65.79 inches) in 1928; 135.7 centimeters (53.42 inches) in 1929; andU9.3 centimeters(46.99 inches) in 1930.
Karluk Lake is usually covered with ice in winter; it freezes over during thelatter part of December and opens again some time in April. In 1931 the lake·becamefree of ice on April 20. In very mild winters, such as that of 1925-26, the lake doesnot freeze, but this is reported to happen only once in about 20 to 25 years.
Table 4 shows the results of the temperature readings obtained at station 1, whichis situated in the deepest part of Karluk Lake. The surface temperature ranged from
4°C 6 8 10 12 14 16OM
5 \------j-----l--f----,f---+-+---br-----\------,f---1
10 t-----+-----l--H---r-++---J'---t---=-"'~_1-----1
15 t------+---F---+7""'-~I--+-_+_---l-----.f_---_!
201-----Jf-------,f...,ff--l-l----7'-'-----+----I------\-----1
25 t-------H'-It
30 '--__--'.LL.l----L--'--_-'-- --'-- --'-----L------'
}<'IGURE 2.-Summer temperatures of the upper 30 meters of Karluk Lake, 1926 to 1930, inclusive. Theseries shown in the diagram were taken as follows: August 15, 1926; August 13, 1927; July 10, 1928; July 9,1929 (J); September 8, 1929 (8); July 12, 1930. The temperatures are indicated in degrees centigrade.Nate the definite stratification in 1926
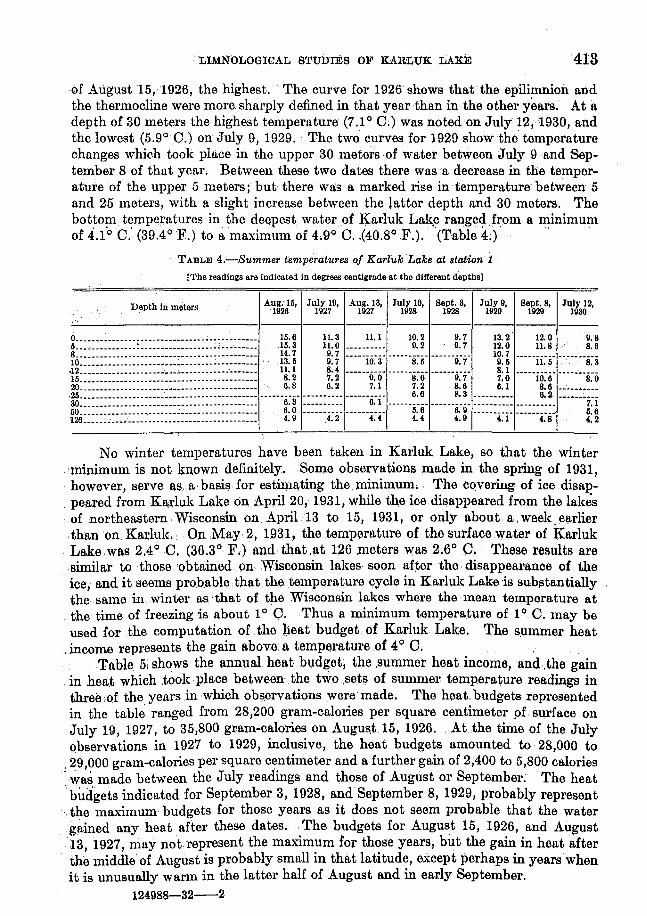
about 100 C. (50 0 F.) in early July to a maximum of 15.6° C. (56 0 F.) about the middleof August; the highest temperatures were found during the warm summer of 1926,In this year the three thermal strata of the lake were well marked. The epilimnionextended from the surface to a depth of about 8 meters on August 15, 1926; thethermocline extended from 8 to 15 meters and the hypolimnion from the latter depthto the bottom. The epilimnion and thermocline were not so definitely outlined in theother yeATS.
Six sets of the temperature readings for the upper 30 meters are shown in Figure 2.The readings taken on July 12, 1930, show the lowest surface temperature and those
'LIMNOLOGICAL STUDIES OF KARLUK LAKE 413
of August 15,1926, the highest. The curve for 1926 shows that the epilimnion andthe thermocline were more sharply defined in that year than in the other y~ars. At adepth of 30 meters the highest temperature (7.1° C.) was noted'on July 12; '1930, andthe lowest (5.9°0.) on July 9, 1929. The two curves for 1929 show the temperaturechanges which took place in the upper 30 meters ,of water between July 9 and September8 of that year. Between these two dates there was a decrease in the temperatureof the upper 5 meters; but there was a marked rise in temperature between 5and 25 meters, with It slight increase between the latter depth and 30 meters. Thebottom temperatures in the deepest water of J(arlukLak.e ranged from a minimumof 4.1(, C: (39.4 0 R) to a'maXim-llm of4,go C..(40.8° F.). '(Table 4,;)'
, TABLE 4;-Summer temperatures of Karluk Lake at station i[The readings are Indicated in degrees centigrade at the different depths)
Depth In \!leters Aug; 16, July 19, Aug. 13, July 10, Sept, 3, July 9, Sept. 8, July 12,1926 1927 1927 1928 1928 1929 1929 1930
~~-----------I--- ---------------------
L:::::::::::::~::::::::::::::::::::::::::::: Jtg U: ~ ~~~~_ 1&: ~ ,~: ~ g: ~' l~: gI' '~: ~8_____________________________________________ 14.7 9.7 •• _.______ 10.7 _10 •• .: •• : •• ' ,13.5 9.7 10.3 8.5 9.7 9.5 11.6 8.3.12_. • ._: ...__c._. •• __ ._.. 11.1 8.4 •• _••••• • ._ •••_ 8.1 _••••••_._ •• __ ••• __ •15. •• •• __ • __ ._ •••• _. • __ •• •• __ 8.2 7.2 11.0 8.0 9.7 7.0 10.6 8.020__ •• ... 6.8 6.2 7.1 7.2 ' 8.6 6.1 8.6 __'._••• _
.~~~~~~~~~~~~~~~~~~~~~~~~~~~~~~~~~~~~~~~~~~~~~ '-"cTr ::::::~~~: ::::::~~~: ---'-ii' -.----i+ ::::::~~~: ::::::~~~: ---'-:T~
No winter temperatures have been taken in Karluk Lake, so that the winter: minimum is not known definitely. Some observations made in the spring of 1931,, however, serve, as. a basis for estimating the minimum; The covering of icedisap, peared from ,Karluk Lake (in April 20,' 1931, while the ice 4isappeared from the lakisof northeastern ,Wisconsin on April 13 to 15, 1931, or only about a ,w~ek. el,trlier,than on Karluk. On May. 2, 1931, thet~mperature of ,the surface water of KarlukLake was 2.4°C. (36.3° F.) and that ,at 126 meters was 2.6 0 C. These results are,similar to those obtained On Wisconsin lakes soon after the disappearance of the
. ice, and it seems probable ,that the temperature cycle in Karluk Lake is substantiallythe same in winter as,that of the Wisconsin lakes where the mean temperature at
, the time' of freezing is about 1°, O. Thus a minimum temperature of 10 C. may beused for the computation of, the heat budget of Karluk Lake. The summer heat
.income represents the gain above a temperature of 4° C. ,Table 5; shows the annual heat b\ld~et, the ,summer heat income, and',the gain
in heat which took place between the two ;sets of summer temperature readings inthree of the years ,in which ,obs,ervations were'made. The heat, budgets representedin the table ranged from 28,200 gram-calories per square centimeter pI. su,rface, onJuly 19, 1927, to 35,800 gram-calories on AugU!~t 15, 1926. At the time of the Julyobservations in 1927 to 1929, inclusive, the heat budgets amounted to 28,000 to
.29,000 gram-calories per square centimeter and a further gain of 2,400 to 5,800 calories'~aS made between the July readings and those of August or September. 'The heat'budgets indicated for September 3, 1928, and September 8, 1929, probably represent. the maximum budgets for those years as it does not seem probable that the watergained any heat after these dates. The budgets for August 15, 1926, and August13,1927, may not, represent the maximum for those years, but the gain in heat afterthe middle of August is probably small in that latitude, except perhaps in years whenit is unusually warm in the latter half of August and in early September.
124988-32-2

414 BULLE'.I'IN OF '.I'HE BUREAU OF FISHERIES
The summer heat incpme ranged from 16,000 calories on August 13, 1927, to21,200 calories. on August 15, 1926.' The mean summer heat income for the fourAugust aRd. September observations is 18,900 calories.
The gain of 5,800 gram..calories between July 10 and September 3, 1928, represented an average daily gain of a little more than 105 gram-calories for this periodof 55 days. The gain between July 19 and August 13, 1927, was about 96 caloriesperqay, while that between July 9 and September 8, 1929, was only 68 caloriesper day.
TAllLE5.-The mean temperature,heat budget, lJummer heat income, and gain in heat between the twodates on which summer temperature observations were made on Karluk Lake
[The. r~ults tor heat are Indlcat~d Ingram.calorles per square centimeter ot sqrtace)
Oain In heat
21, 200 .~. ••• __••
14,60018, 800 4, 200 68
14,500 _._._._._. ._•• _
Date
Aug. 15, 1926. • • _. ~ ••_•• •• __ • ._••_
lu!y 19, 1927__ • • _c • • • _. __ • _. • _Aug. 13, 1927_•• _. _._ •••• __ ._. ._. . __ •_. _._. __ •••_. .• _. __ • _
lu1y 10, 1928__ • • • __ •• • _. • -. __ ._. _. _. ._. - -- -. ._ -._._Sept. 3, 1928_ •• _. •• __ • _,_ •• _._. __ • ._ •__ • _. _._. • _. __ • _
lu1y 9, 1929_•• _••• _•• _._. __ • • _. _. __ • _• •• _. _. - ._.Sept. 8, 1929_ •• _•• __ ••, _. •••• ._ •• • •••• _
lu!y 12, 1930_.__ • _. _. • _._. __ • _. _•••• • • _. __ •• __
.
Meantempera.ture, ·C.
8.37
6.807.30
6.848.03
7.027.87
7.00
Heatbudget
35,800
28,20030,600
28,40034,200
29,20033,400
29,100
Summerheat
Income
13,60016,000
13,80019,600
Total
2,400
5,800
Averageper day
105
, The mean of the August and September heat budgets of Karluk Lake in 1926·to 1929, inclusive, is 33,500 gram-calories. This budget is comparable in size to'those of a number of lakes situated in much lower latitudes, such as Green Lake,Wis., and some of the Finger Lakes of New York, as well as some of the Europeanlakes.' The heat budgets of several American and European lakes are givenin Table 6.
These data show that the average heat budget of Karluk Lake is exceeded somewhat by those of.some of the larger lakes represented in the table, such as Seneca,Cayuga, and Owasco of New York, Geneva of Switzerland, and Loch Ness of Scotland, but the 1926 budget of Karluk almost or quite reaches that of some of themembers' of this group. The averages for Karluk and Green Lake are substantiallythe same, as well as that of Traun See of Austria. Four of the lakes included in thetable have smaller heat budgets than Karluk Lake. While the temperature of theupper water of Karluk Lake is not as high as that of Green Lake, Wis., and of theFinger Lakes of New York, yet its area and depth are such that it absorbs a similaramount of heat per unit of area during the warming period each year, as indicatedin the table. .
TABLE 6.-Heat budgets of Bome American and European lakeB
Lake . LocationHeat
bUdget,gram·
caloriesLake Location
Heatbudget•Illlill'
calorle8
Karluk••••••••••••••"'" Alaska•••••••••••••••• -•••Oreen•• _._............... Wl.~consln_••_••••_••••••••
g~~:::.:.::::::::::::::::~~~~E;~::::.::::::::::::Oeneva. ••••••••• ••••••••• Switzerland•••••••••••••• ,
33,50034,00036,70037,40035,60036,600
ZUrich.................... Switzerland•••••••••••••••
~~~~==::::::::::=::::::=~~~Ifr~.~::::::::::::=::::Vettern................... Sweden•••••••••••••••••••Nes8._."•••••c__•• ._... Scotland•• _._•••••••••••••Loch)'•••••••••••••••••••••; •••do•••••••••••••••••••••
21,80026.00033,40032,00037,20031, 500

LIMNOLOGICAL STUDIES OF KARLUK LAKE, 415
. Table 7 shows the results of the temperature readings on Thumb and O'MalleyLakes. The surface temperatures of these two lakes did not differ greatly from thoseof Karluk Lake on corresponding dates; the maximum difference was noted in 1929when the surface water of O'Malley Lake had a temperature of 16° C. (60.8° F.)on July 10 and that of Karluk Lake was 13.2° C. (55.8° F.) on July 9. The maximum difference between surface and bottom temperatures in Thumb Lake was.4.2° C. on July 11, 1929, and a difference of 4° C. was noted in O'Malley Lake onJuly 10, 1929.
TABLE 7.-Summer temperatures of Thumb and O'Malley Lakes
[The readings are Indicated In degrees centigrade]
Date
Thumb Lake
Depth In Temper·meters ature Date
O'Malley Lake
Depth In Temper·meters ature
------------1------1-------------------July 21, 1927 __ __ .
Do ..Aug. 3,1927.__ __ •
Do .July 0, 1928 __ .
Do __ •• _.. _ ..Sept. 3, 1928•• __ _•.••
Do .July 11, 1929 _ .
Do _•••••• " __..- ..Sept. 12, 1929 __•.•. __ .
Do .July 13, 1930 __•••..
Do _.•..Sept. 6. 1930 .
Do ..
o10o
10o
10o
10o
10o
10o
10o
10
11.810.012.010.410.78.18.27.4
10.36.1
12.410.210.48.3
12.710.1
July 23,1927•••.•••••••.•••••.•.•••••••••••Do••••...•••.•••••••••••••••••••••••••
Aug. 10, 1027 .•.•.••••••••••••••.••.•••.•••Do__ ..
July 10, 1929 __ __Do , ••••.•.•
septD~~:~~~~::::::::::::::::::::::::::::::JulyJg::~.3.~.::::::::::::::::::::::::::::::Sept. 5. 1930 .
Do "'"
o12o
12o
12o
12o
12o
12
13.112.813.212.216.012.013.212.413.413.014.914.8
CHEMISTRY OF LAKES
Table 8 shows the results of the chemical analyses that were made on the watersof Karluk, Thumb, and O'Malley Lakes during July and August, 1927. In KarlukLake the hydrogen-ion concentration ranged from pH 8.6 at the surface to pH 7.0at a depth of 120 meters. In Thumb Lake the hydrogen-ion readings were somewhat lower, ranging from pH 8.2 at the surface to pH 6.8 at the bottom, while inO'Malley Lake the readings were still lower, being pH 8.0 at the surface and pH 6.6at the bottom.
In Karluk Lake the free carbon dioxide amounted to 1 milligram per liter of waterat the surface and to 3.5 to 4 milligrams at the bottom. In both Thumb and O'MalleyLakes the free carbon-dioxide content was somewhat larger in the bottom water than
·in the main basin of Karluk Lake, but the quantity found in the lower water of theThumb Basin of Ka,rluk Lake on August 2, 1927, was a little greater than that in thelower wa,ter of Thumb Lake. The fixed or bound carbon dioxide in Karluk Lakevaried between 9 and 10 milligrams per liter of water and O'Malley Lake had thesame amount; the quantity was a little larger in Thumb Lake, namely 11 to 12milligrams per liter. This relatively small quantity of fixed carbon dioxide indicates
· that these waters contain correspondingly small amounts of carbonates in solution,· and this compa,rativelysmall carbonate content is due to the fact that the countryrock of this drainage basin consists chiefly of slate.

416 :ButLETINOF THE BUREAUO:F FI~HERI]!jS
TABLE 8.-"-Results of chemical analyses of the waters of Karluk, Thumb, a1id 0: Malley Lakes in 192'1(The results are stated In mllligrams per liter of water, Tt. =tracel
KARLUK LAKE, STATION 1
Date, 1927
Carbon dl. Phosphorus NitrogenTern· oxide
Depth pera· pH Oxy· SllIeaIntll6~'
genII\etersFree Fixed Solu· Organ· TotAl Ammo· Nitrite N ltrateble Ie nla
------1---------------------------July 19 ••••. _. __
Do . __ •.• _July 31. __ ... _....... __Do. .
Do __ . • • __Do __ ._ .. • _
Aug. 13 • • ••Do_ .. • _
o ..120
o13
122125
o125
11.3 8.4 1. 0 9.5 _. __ .___ 0.002 0.004 0.006 0.0 0.008 • • _4;·2 7.0 4.0 \l.0 11.3 • . __ • •. __ .6 .040 Tr. 0.030
11.4 8.2 1.0 9.5 _. __ ... _ .002 .003 .005 .5 .000 ._.__ .0128.9 8.0 1.0 • _.______ .002 __ ,._.. _ .5 . _._. __ ..4.3 7.6 2.0 ...... .010 .... .... __ ...... .. __4.3 7.5 3.5 \l.5 12.1 .010 .5 .050 .001 .052
11.1 8.2 1.0 9.5 .002 .028 .030 0 .004 .000 ••••• __ •4.4 7.5 3.5 9.5 _... .008 .014 :,022 .5 .022 .000 ....
KARLUK LAKE, STATION 2 (THE THUMB)
July 20 ... • 0Do.• ;.____________ 40
· Aug. 2 • __.. 0Do. ._.__ 10Do... ••• __ .__ 41Do ._ .. _... __ 42.5
· Aug. 12.....__ .. ._. 0Do • ... 40Do ...... __ .. __ 41. 5
11. 2 8.2 1.0 9.5 ... _.&5 ~2 L5 1~0 &8
11.2 8.2 .1.0 __"" • _10.8 8.0 1.5 ._. __ ..5.5 7.4 3.5 •__ :.__ ..5.5 7.2 8.5 .... c.. _ 9.6
11.0 8.6 0 10.0 ........5.6 7.6 ; __ • .• _. _.. _••••5.6 7.2 2.5 10.0 __ • •
.002 .003 .005 . •• __ • ••• __ •__ __
.010 _._._..; _.........__ .. ._... _..... ; __ • .020
.002 .018 .020 C .000 .000 .035
.003 .022 .025 0 .030 .000 .035
.006 .014 .020 0 .060 .000 •
.015 • • .__ .5 .120 .000 .050
.002 .._... _......._. Tr. .000 __
:g~~ -":oiii' "-:030' :::::::: "':080- ---·Tr~· ::::::::
July 21 __ . __ ..Do. _.. __
Aug. 3 ••••_. __Do ._
Aug. 12 _ _. •Do ..Do __ • .Do•• ••_. •__
o10o
10o35
10
11.810.012.010.511.1
8.26.88.26.88.07.S·7.67.0
THUMB LAKE
1. 5 10.5 __ ••• __ •7.5 10.5 6.32.0 11.5 .. _.. _..6.5 11.0 __ •2.0 11.5 _..1.5 •__ : •• __ __ •2.5 11.5 __5.1) 12.0 •• __ ..
.004 . 006 .010 .5 • 040 .002 .012
.020 .022 .042 1. 0 .250 .002 .018• 004 • 016 .020 0 • 064 .000 .050.020 .020 .040 1. 0 .400 .005 .060.006 .044 .050 .5 .032 .001 _ ..004 .. • __ • • .. __ .. _. __ .... __ •.012 . 033 .045 .5 .040 .001.070 • 022 .092 2.0 .400 .001
July 23................ 0. . Do _: _...... 12Aug. ·10 _........ . 0
· Do_.______________ 11
13.1 7.2 1.512. 8 6.6 3.013.2 8.0 1.·512.2 7.4 2:8
O'MALLEY LAKE
10.0 •••• __ •• .003 .044 .04710. 0 6.3 .007 .041 . 0489.0 .003 .032 .0359. 5 10.5 . 005 .035 .040
BOG POND
o.5
1.01.5
•008 •000 •056.084 .000 .052
.!2'0 :::::::: :::::~::
.JUiY 30_. _.. __ ....- __ ...1 0'/. 17.01 7.81 2.51 11.0J--·.. -·1 .000 .1....---·1--,··:-·1 1.51 •000 I....::..I-.:··~: ..No complete series .ofdissolved oxygen determinations was made, but samples were
obtained from the bottom water of each of the three lakes. At station 1 in the deepest; water of .Karluk Lake the lower w.ater was well supplied with dissolved O:ICygen; the. quantity ranged from 85 to 92 .per .cent .ofthe amount required for saturation•..A· smaller amount was found in the lower water of The Thumb Basill of Karluk Lake;here.the~mountreached only 69 to 72 per cent of saturation. A.still smaller amount,was found in the bottom wat~rs of J'humb and O'Malley Lakes where the quantityreached only 55 and 58 per cent, ofsatw:ation, re$pectively.. In. spite of the lower'percentages in the latter lakes, the lower water of all three lakes was well supplied withdissolved oxygen, so that all three of them belong to the oligotrophic type.
The quantity of soluble phosphorus in the surface water of Karluk Lake was 0.002milligram per liter. In Thumb Lake it varied from 0.004 to 0.006 milligram per literand in O'Malley Lake it was 0.003 milligram per liter. The amount of soluble phos-

LIMNOLOGICAL STU1HES OF KARLUK LAKE, 417
phorus was larger in the lower water than in the'surface water in aU cases.. This isdue to the decomposition oforganic matter in the lower stratum. The plankton andother organic material which settles into the lower water and decomposes there contains organic phosphorus which is changed to the. soluble form during the decomposi.;,tion process. As a result of this change the soluble phosphorus shows a more or lessmarked increase in quantity in the lower water during the summer; the extent of thisincrease is dependent upon the amount oJ organic matter which. decomposes in thiss'tratum. . ' . . '.
The.organic phosphorus consists of that part ot this element which is. combinedwith the organic matter that is present in the water in the form of living organisms,'or in organic material derived from such organisms. The quantity oforganic phos.,phorus is dependent upon the amount of organic matter, but the·former is not directlyproportional to the latter. 'fhe various organic compounds possess· different .percentages of phosphorus, so that there is no direct quantitative relation between thetwo. The quantity of organic 'phosphbrus is usually larger ,than that of the solublephosphorus; frequently the former is. several times as large as the latter, as shown in'the surface water of Karluk Lake on August 13, 1927. In the bottom water, however,the quantity of soluble phosphorus may be ~everal times as large as that of the organicphosphorus; the 10-meter sample of Thumb Lake on August 12, 1927, contained morethan three times as much soluble as organic phosphorus. In Karluk Lake there wasonly half as much organic phosphorus in the 125-meter sample as in the surface sampleon August 13, 1927. A similar result was obtained in Thumb Lake on August 12,1927; o,nJuly 21, however, there was a larger amount of organic phosphorus in thelower than in the upper' water of this lake.
The quantity of titratable silica in the waters of the three lakes varied from none'to 2 milligrams per liter. This substa,nce is used by the diatoms in making theirslliceous shells, so that the quantity of silica in the water is correlated mo~~e or lessclosely with the growth of these organisms. A large crop of diatoms may completelyexhaust the supply of available silica as shown in some of the surface samples of thesethree lakes. The largest amounts of silica were found in the lower water where lightconditions were unfavorable fbtthegrowth ofdia-toms. The plankton contained arather large ,number of diatoms, so there was ,an active demand for silica in the upperwater.
Only small a:rp.otints of ammonia nitrogen were found in the upper waters ,of thethree lakes, but larger amounts were obtained from bottom samples. The activities ofthe phytoplankton in the upper strata create a demand for nitrogen, and free. ammonia'c,an he used ,by these organisms .as well as nitrite and nitrate nitrogen. ,This accountsfor the small amount of ammonia nitrogen in the upper water. The free ammoniaof 'the lower water is derived from the organic matter which. decomposes in' thatregion; since light conditions are unfavorable ior photosynthesis thereis no demandfor the ammonia nitrogen in the lower strata.., ,
. Only a very small amount of nitrite nitrogenwas found at,any depth. In KarlukLake the nitrate nitrogen varied from 0.02 to 0.052 milligram per liter, the largestamount being found in the bottom water. The waters of Thumb and O'MalleyLakes yielded from 0.012. to 0.06 milligram of nitrate nitrogen per liter. '
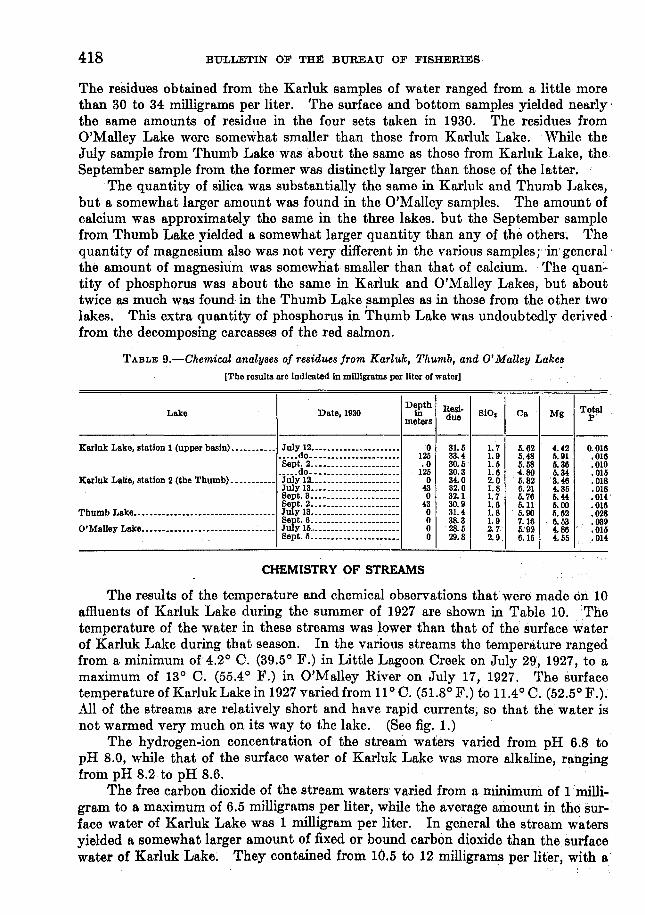
, Two liter samples, of surface and l;>ottom water, frOm Karluk Lake owereevapo'"rated. in July and September, 1930, andthe;l.'esidues obtained from them ,wereanalyzed for variousconstit~ents. Eesi<\ueswere obtained from ,surfac~.s1l.mplesorThumb and O'Malley Lakes also. The results of these analyses are given in Table 9.
418 BULLETIN OF THE BUREAU OF FISHERIES
The residues obtained from the Karluk samples of water ranged from a little morethan 30 to 34 milligrams per liter.' The surface and bottom samples yielded nearly'the same amounts of residue in the four sets taken in 1930. The residues fromO'Malley Lake were somewhat smaller than those from Karluk Lake. While theJuly sample from Thumb Lake was about the same as those from Karluk Lake, theSeptember sample from the former was distinctly larger than those of the latter.
The quantity of silica was substantially the same in Karluk and Thumb Lakes,but a somewhat larger amount was found in the O'Malley samples. The amount ofcalcium was approximately the same in the three lakes. but the September samplefrom Thumb Lake yielded a somewhat larger quantity than any of the others. Thequantity of magnesium also was not very different in the various samples; in general'the amount of magnesium was somewhat smaller than that of calcium. The quantity of phosphorus was about the same in Karluk and O'Malley Lakes, but abouttwice as much was found in the Thumb Lake ~amples asin those from the other twolakes. This extra quantity of phosphorus in Thumb Lake was undoubtedly derived'from the decomposing carcasses of the red salmon.
TABLE 9.-Chemical analY8e8 of re8iduIJ8 from Karluk, Thumb, and 0'Malley Lake8
[The results are indicated in milligrams per liter ot water]
Lake Date, 1930D~th Resi.meters due
SiOs Ca Mg TotalP'
-------------I-----~--I------------
Karluk Lake, station 1 (upper basin) ••••••••••• July 12•.•••••••••••••••••••••••••do••••••••••••••••••••••
.~~~~;::::::::::::::::::::::Karluk Lake, station 2 (the Thumb) ••••••••••• July 12••.••.••••••••••••••••
July 13•••••••••.••••••••••.•Sept. 3••••.•••.•••••••••••••
Thumb Lake•.•••• '" •• , .e•••••••••••••••_..... r~;'li::::::::::::::::::::::O'Malley Lake•••"" ••••••.•. ~.....•••.• •••••• ~~:1:::::::::::::::::::::::
o125.0
125o
43o
43oooo
31. 533.430.530.334.032.032.130.931. 438.328.529.8
1.71.91.51.62.01.81.71.61.81.92.72.9,
5.625.485.584.805.826.215.765.11
, 5.007.165.926.15
4.425.915.365.343.464.366.446.005.626.634.864.55
0:016.016.019.015.018
" 018.014'.016.028.039.015.014
CHEMISTRY OF STREAMS
The results of the temperature and chemical observations that were made on 10afHuents of Karluk Lake during the summer of 1927 are shown in Table 10. ;Thetemperature of the water in these streams was lower than that of the surface waterof Karluk Lake during that season. In the various streams the temperature rangedfrom a minimum of 4.2 0 C. (39.50 F.) in Little Lagoon Creek on July 29., 1927, to amaximum of 13 0 C. (55.40 F.) in O'Malley River on July 17, 1'927. The surfacetemperature of Karluk Lake in 1927 varied from 11 0 C. (51.8 0 F.) to 11.40 C. (52.5 0 F.).All of the streams are relatively short and have rapid currents, so that the water isnot warmed very much on its way to the lake. (See fig. 1.)
The hydrogen-ion concentration of the stream waters varied from pH 6.8 topH 8.0, while that of the surface water of Karluk Lake was more alkaline, rangingfroin pH 8.2 to pH 8.6.
The free carbon dioxide of the stream waters varied from a minimum of 1milligram to a maximum of 6.5 milligrams per liter, while the average amount in the surface water of Karluk Lake was 1 milligram per liter. In general the stream watersyielded a somewhat larger amount of fixed or bound carbon dioxide than the surfacewater of Karluk Lake. They contained from 10.5 to 12 milligrams per liter, with a

LIMNOLOGICAL STUDIES OF KARLUK LAKE 41-9
maximum of 22 milligrams in one stream; the surface water of the lake yielded from9.5 to 10 milligrams of fixed carbon dioxide per liter. The 22 milligratrts per literfound in Little Lagoon Creek was about twice the amount present in the other'streams. This indicates that there is. a much larger quantity of calcareous materialin the drainage basin of this stream thim in those of the other streams. .
TABLE 1O.-,-Re3ults of the chemica'l analyses oj the stream waters
[Results are stated In milligrams per liter oC water. Tr. means trace. ,The station numbers are Indicated. on the map, fig. II
Nltr(lgen
Am· NI· NI.monla trite: trate·
PqosphorusCarbondioxideTern·
~~~. pH I-;--,--'I.,...--;--~--I~~ I---.,...,,---'--;-~·C. F Fix d Solu· Or· Ttlree e ble ganlc 0 a
Date,1927LocalityStream.No.
-·1-;--:--:-------1-----'----1....---;- -.- '-.-, - ----' -- --,---.-'-.-.---1 Canyon Creek••..•••. At lake.....••••.•••. July 17 7.6 7.7 1.22 Falls Creek .••••.••.•• At mouth..•••••••••.•.do•••• 8.0 7.6 1.23 O'Malley·Rlver.•••••• Above Falls Creek do•••• 13.0 8.0 1.0..• Cascade Creek•.•.•••• At lake do.... '7.68.0 1; 26 Upper Thumb River•• North Cork ab(lve July 21 8.9 7.6 2.2
Calls.6 do At Thumq Lake do••.••••••• 7.2 6.57 Upper O'Malley July 23 """ 7.• 2.5
River. .8 Moraine Creek Upper end.' July 25 •••••• 7.4 2: a9 .•.••do•••••••••••••••• At lake.•••.•.•.•.•••••.do•••• 7.5 7.0 6.0
10 'HaltwayCreek do do•... 7.9 6.9 3.511 Cascade Creek••••.••• At Calls••.•••..•••••• July 27 8.3 8. 0 32.. ,~12 ......do••.•••••••••.••• Atlake..•.•...•••••••:.do•••. 8.3 7.8 u13 Meadow Creek••••••••••••.do.•..•.•••••••••••do•.•• 9.5 7.6 4.014 Canyon Creek ••••.••• Above Calls•.•••••••• July 29 8.0 7.6 2. 515 l'alls Creek do do•••. 9.2 7.8 2.516 'Llttle Lagoon Creek•• Above Salmon••.•••••.do.... 4.2 7.8 2.617 UpperThumbRlver•. Atlake Aug. 3 8.3 6.8 4.518 SalmonOreek•••••.••. AtThumbRlver•••••.do•... 7.2 7;2 4.619 Thumb Rlver••••~ ••.• At Karluk Lake.•••• Aug. 13 10.0 7.8 3.0
11;7 0.008 0.032 0.040 3.a 0.084 0.. 01611.5 .005 .003 .008 3.0 .056 .•••: 015
g:g :gg~ :g~ :gi~ ~:~ :~~ 2E:t: :gtlg10.0 .004 .006 .010 2. 2 Tr•. 0.000 .00,5.
10.6 .025 .015 .040 2.0 .328 .018 .06010.6 .002 .030 .032 2.0 .020 .000 .072
11.0 .004 .018 .022 2.0 :000 .000 .040
}J:g :~ :~g:trs ~:g :t~ :l: :~g.n.5 Tr..003.003 3.0 Tr.••••••. 04012.0 .016 "'''' 2.0 .080 .004 .03010.5 .030 .006 .035 3.0 .220 .008 .06012.0 .002 .016 .018 1.5 Tr. .020n.6 .003 .019 .022 1; 5 Tr. •••••• .02022.0 .005 .0205 .030 2.0 Tr..... ~••. 040n.o .019 2.0 .280 .010 .06011.5 .005 .010 .015 1.5 005 •••••n. 0 •015 •020 .035 1. 5. .080.001 •••,.
Most of the streams carried a larger quantity of. phosphorus, .both soluble andorganic, than the surface water of Karluk Lake. There was also a marked difference,in the amount of phosphorus found in. the different streams.. The. soluble, phpsphorusvaried from only a trace in Cascade Creek at the falls tQ a ma~..imum of 0.06.milligram per liter in Moraine Creek at the lake. The organicpho~phorus ranged·from a minimum of 0.003 milligram in Falls and Cascade Creeks to, a maximum of.0.13 milligram per litex; in Moraine Creek at the lake. ,
There was also a marked difference in the quantity ofboth soluble and ,organicphosphorus in the upper courses and in the lower courses of several streams. : Suchdifferences are shown in Table 10 for Canyon Creek, Cascade Creek, Moraine Creek,and the Upper Thumb River. The stations at which. the various salllpies were takenare indicated on Figure 1. The water at the mouth o£Moraine Creek yielded 15times as much soluble phosphorus as that at the upper end of this stream .and 7times8:s much organic phosphorus. The quantity of soluble phosphorus was morethan six times as large at the. mouth of the Upper. Thumb River as it was above thefalls in the north fork of this stream. The differences in Canyon and ,Cascade Creekswere not as :rn.arked as. those ·in the other two streams indioated above, while ,a smallerquantity of phosphorus was found at the mouth of Falls Creekth.an at ~hestation
above the falls in that stream.The titratable silica in the various streams ranged from 1 to 3.5 :rn.illigraD;ls per
liter of water. This qU(l.ntity was larger than that in the upper water. of~J{arlukLake.
.In general, much larger amounts of ammonia, nitrite, ,and ,nitra.te nitrogen. werefound in the stream waters than in the surface water of Karluk Lake; also considerable

420 BULLETIN OF THE BUREAU OF FISHERIES
differences,were noted in the different streams" as well as between the upper and lowercour~es of the individual streams. The maximum quantity of'ammonia nitrogen wasfou~d in the sample obtained at the mouth of Moraine Creek on July 25, 1927,namely0.4 milligram per liter of water; the next in rankwas a sample .from the mouth of'Upper Thumb River which contained 0.328 milligram of ammonia,nitrogen per liter.The smallest amounts of free ammonia were found in the upper courses of some of thestreams, such as none in the upper part of Moraine Creek and only traces in the upper'parts of Canyon, Falls, and Little Lagoon Creeks, and the north fork of Upper ThumbRiver.
The maximum quantity of nitrite nitrog~n was found at 'the mouth of UpperThumb River, namely 0.018 milligram' per liter, while none was found in thesamples taken in the upper courses of three streams. The other samples on whichdeterminations were made yielded from 0.001 to 0.01 milligram of nitrite nitrogenper liter. '
The largest amount of nitrate nitrogen found in the stream waters was obtained atthe mouthof Mor~ineCreek, namely 0.085 milligram per liter. In the other streamsamples the quantity of nitrate nitrogen ranged from 0.005 milligram in the northfork of the Upper Thumb River to 0.072 milligram per liter in Upper O'Malley River.In Canyon', Cascade, and Falls Creeks there was a somewhat larger amount Qfnitratenitrogen in the samples from the upper courses than in those from the mouths Of thesestreams. In Moraine Creek, on the other hand, there was a little more than twiceas much nitrate nitrogen in the sample obtained from the mouth as in that from theupper course Of this stream. In the Upper Thumb River there were 12 times asmuch in the sample taken at the mouth as in that taken in the north fork of this streamabove the falls. ' .
The ted salmon which com'e into these lakes and streams t? 'spawn have a veryimportant effect upon the chemical status of their waters. Aft~r spawning :thesesalmon die and the carcasses decompose either in the water or along the shores of thelakes and streams. The greater part of this decomposition takes place in the streams~
In an average year more 'than 'a million red salmon, each weighing from 2 to 3 'kilograms or more, migrate'into these waters 'for the purpose of spawning, and their sub~sequent death adds probably in excess of 2,000,000 kilograms of decomposable organicmatter to the waters of the Karluk drainage system. The' decomposition Of thismaterial makes a very important contribution to the quantity of both organic andinorganic substances that are held in solution by these waters.
Some observations lllade during the summer of 1927 serve to give an idea of the'abundance of dead salmon in some of 'the streams, On July 17, Canyon Creek 'waslisted as having comparatively few dead salmon; on July 21 it was estimated thatthere were 50,000 to 60,000 dead salmon in the two forks of Upper Thumb River,'OnJuly 25 Moraine Creek WitS listed as having about 10,000 dead fish. '
, 'Shostrom,Clough, and Clark (1924) give the following results for"cherhical:anaJysesof bone-free samples of the red salmon of ~arluk River: Moi,sture, 69':5per cent; fat, 5.6'per cent; protein, 21.6 percent; and 'ash, 1.3 per cent. , They statethat bone constitutes 2.2 per cent of the total weight of,the ,nsh. On this hasis 'mOl'ethan 400,000' kilograms of the total; estimated decomposable matter contributed bythe dead salinon would consist of protein material, and the decomposition of thisprotein furnishes a supply of nitrogen compounds to these stream and lake waters.'In their final stages of decomposition these compounds yield ammonia, nitrites and
, ',' ",'., ( t;

LIMNOLOGICAL STUDIES· OF KARLUK LAKE: 421;
nitrates which, in turn, serve asa eource of nitrogen for the various plant forms thatpopulate .·these.lakes and etreame; they are of special importance to the organismsthat constitute the: phytoplankton. ,"
.No.'data are available for the phosphorus content of the red salmon, ,but Atwater'(1892) states thatF2Q5 constitutes 0.69 percent ofthefleshofthe California salmon. andTaylor (1926) gives 0.57' percent for the edible .portionof the chin.bok salmon. .From:these results the'P205 content of the red salmon may be, e13timatedas about 0.6 percent, :which is equivalent. to 0.26 per ,cent when expressed. in terms of the elementphosphorus; This percentage represents about '5;000 kilograms of pho$phorus inthe estimated 2,000,000 kilograms of organic matter in the red salmon which migrateintotIDese waters to spawn in an average year. In the process of decomposition thispliosphorusis liberated and becomes available fo.1,' the plants which thrive in thes(:\waters..
. Some of the salmon carcasses decompose in very shallow water or are washed upon the shores of· the lakes and streams above the. water line ;Oin such .cases a large part.or· all of ithe ammonia nitrogen is lost to the water, but the nitrates and phosphatesof those decomposing on shore are washed back into ,the water by rain, or meltingSilOW and .thus b.ecome available for. the .aquatic plants. The nitrates .and phosphatesderived. from the decaying sabllon are. excellent fertilizers and serve to stimulate thegrowth' of·. phytoplankton .organisms. This is shown by the fact that enormousgrowths;of certain algm .are correlated with an abundance of decomposing salmoncarcasses in. Thumb. Lake, and also by the fact that Karluk Lake supports a largerc1,'op,.of phytoplankton than several lakes belonging to the same class; the latterpro.blemie discussed further in the section dealing with the plankton of Karluk Lake.
The decomposition of the salmon carcasses in the lower courses of the streamsaccounts for the. differences in the quantity of nitrogen and phosphorus found in theupper-and lower"courses of some .ofthe streams. The samples taken at the upperstationr;lwere obtained: from portions of the stre(lms that were not occupied by thesalmon, consequently the water in these localities contained only the. nitrogen andphosphorUs compounds lea-chedfromthe earth through:which the water.had. passed;in thelow~rcourses of the streams, on the otherhaIld,these amounts were augmentedby those derived from the; qe.coJIlposing salmon.' Some of the strQams were ·not asdensely populated by the salmon as o.thers,andthisaccounts for the di,fferences notedbetween the different st:t:eams.
CHEMISTRY OF BOTTOM DEPOSITS
.Five samples of bottom material. were 'collected in Karluk" Lake and one eachfront 'Thumb' and.0'MalleyLakes 'during July and August, 1927, for the purpose ofmaking'chemicalanalysesof them.· One of· the samples was· taken in the: deepestpal't of Karluk Lake, indioatedas station 1 on the map, Figure 1. One was taken inthe deeper part· of Therhumb (station 2 on the .map), and two others' were securedin this basin of Karluk Lake. One 'sample was also obtained in the third or lowerbasin of Karluk Lake.which iS'indicated as station 3 on the map. One sample wastaken in the deepest part of ,Thumb Lake;ahd 'another from that of O'Malley Lake;
The"sampleswere spread out and air dried: as'promptly as possible after they weresecured. When: dry -they were placed in glass containers and kept until the analyseswere made'in the-autumn of 1927. Theair..dried samples were ground ina disk mill;the material was then spread out on watch glasses and dried in a' vacuum desiccator
422 BULLETIN OF THE BUREAU OF FISHERIES
for 10 days at a temperature of 70° C. The drying was carried out at :70° ratherthan at 100° or higher in order to avoid the possible loss of carbonaceous material,especially of any volatile oils that might be present. The moisture content rangedfrom 1.43 to 5.19 per cent ofthe weight of the undried material in the various samples.
The character of the water in·these three lakes is indicated in the analyses givenin Tables 8 and 9. There is a comparatively small amount offixed or bound carbondioxide present and relatively small amounts of calcium, magnesium, and silica.The water, therefore, may be regarded as having a medium hardness. It might bebetter, in fact, to class them as soft-water lakes. They' are certainly at the lowerlimit of the class with medium hardness.'
The results of the analyses of the bottom deposits are given in Table 1l.Ohe of,the striking features of these bottom deposits is the large percentage of silica found iiI.them; this substance comprises from 60 per cent to a little more than 73 per centof the :dry material. Such high pereentages of silica raised' a question regardingits source and portions of the various samples were submitted to Dr~ Albert Mannwho examined them for diatom remains. He found the shells of 67 different speciesof diatoms in these bottom deposits. His estimates of the percentages of diatoms in'the various samples from Karluk Lake, based upon his microscopical examination,show a rather striking similarity to the results obtained in the chemical analyses.His statement regarding the sample from station 3 of Karluk Lake is "nearly purediatoms, 80 to 90 per cent of the mass." .The 40-meter sample from The Thumb isestimated as 60 per cent or more diatoms, and the 125;.meter sample from station 1of Karluk Lake as 75 to 80 per cent. He states that diatoms are not so abundant'inthe samples from Thumb and O'Malley Lakes (20 to 30 per cent), but the percentage'of silica is the same in them as in those from Karluk Lake. No explanation Of thisdifference is evident from the data in hand; (See Doctor Mann's report on p.434.)
There is almost a twofold difference in the percentage 'ofiron in th~ varioussamples and likewise almost a fourfold difference in the percentage of 'alumina; Thecalcium and magnesium content of these bottom 'deposits is small and the same is·true of the phosphorus, su'lphate, and carbon dioxide. The percentage of organiccarbon shows a little more than a fourfold difference. The largest percentage wasfound in the sample from O'Malley Lake. Large aquatic plants grow ;much 'riioreabundantly in this lake t.han in the other two, and it seems probable that they makean important contribution to the bottom deposits here and thus increase the amountof organic carbon therein. .
In comparison with the results obtained on other lakes, the high percentage ofsilica is the outstanding characteristic of the bottom deposits of these three Alaskanlakes. Bottom material from two of the lakes of northeastern Wisconsinyielded·a.little more than 42 percent of silica and this is the largest percentage' that: has beenfound in any of the Wisconsin lakes up to the present time.' A maximum of 54 percent was found in one sample from Lake Balaton, Hungary (Eniszt 1911), and alittle over 36 per cent was the largest amount found in. the bottom deposits of .thelakes' at Lunz, Austria (Mulley, 1914). Halbfass (1923) reports a maximum of 78per cent of silica in Lake Girotte and 74 per cent in,Lac Pavin.
The small percentage of calcium is also an important characteristic ·of the deposits of these Alaskan lakes. Smaller percentages have been obtained onIyin thevery soft water lakes of northeastern Wisconsin. Less than 1 per cent· of calciumhas been found in 4 of these soft-water lakes, and from 1 to almost 2 per cent in8

LIMNOLOGICAL STUDIES OF KARLUK LAKE 423
others. In the hard-water lakes of southeastern Wisconsin, the percentage of cal-'cium shows a maximum of a little more than 17 per cent, while a bottom sample fJ;omone of the lakes at Lunz, Austria, yielded a little more than 38 per cent of calciumand one from Lake Balaton, Hungary, a little more tha,n 37 per cent.
The percentage of organic carbon is distinctly smaller in the bottom samples fromthe Alaskan lakes than in those obtained from the lakes of northeastern Wisconsin;in the latter samples the percentage of organic carbon varied from somewhat morethan 10 to almost 39 per cent of the dry weight of the deposits.
TABLE 1l.-Che1T.ical analyses of bottom deposits of Alaskan lakes
[The samples were taken In 1927 with a small Ekman dredge, so that they represent only the upper 15 em. of the deposits. Theresults of the analyses are given In percentages of the dry weight of the samples. Upon dr)'lng the various samples lost from1.13 to 5.19 per cent of moisture]
Lake Date Depth SID, Fo,O, AI,O, Ca Mg p,O, SO. CO, Org.C--------------------1>feter&
Karluk, station 1. ________________ Aug. 13 _ 125 60.50 4.93 6.88 1. 62 0.44 0.92 1.06 0.69 4.58Karluk, The Thumb __ •_________ • Aug. 8___ 17 73.07 3.36 5.65 1.86 .51 1. 37 1. 85 .70 5.3. Do ___ •____________________ •__ __ .do_____ 38 63.91 5. 4,~ 11.76 2,60 1.50 .65 .44 .52 1. 95Do. __ •• _•••••• ___________ ._ •• __ .do___ ._ 40 66.10 7.00 12.22 2.05 1.30 .82 .51 .20 4.2Karluk, station 3__ •__ •_____ ._ •••• July 19__ 50 69.81 6.05 5.42 2.96 .90 .92 1. 37 .67 5.05'rhumb Lake__ •_______ •__________ July 21_. 10 60.00 6.42 9.65 1.89 1.07 1.02 1. 78 .20 6.56O'Malley Lake___________ •• _. ___ . July 23__ 12 71.76 4.32 3.75 2.71 .93 1. 35 1.12 .80 8.50
PLANKTON DATA
NET PLANKTON
Catches of net plankton were obtained from Karluk, Thumb, and O'MalleyLakes at the same time that samples were taken for the chemical analyses, and atother times also. This plankton material was secured by means of the regular typeof 'closing net that has been used in making catches on the Finger Lakes of NewYork, on a number of lakes in northwestern United States, and on various lakes inWisconsin. This type of closing net has been fully described by Juday (1916) sothat no further description is necessary at this time. The net has a relatively largestraining surface of bolting cloth in proportion to its opening and numerous testshave shown that its coefficient lies between 1.8 and 2; that is, it strains appro:ll.imately half of the water in the column through which it is hauled.
. The plankton material obtained in these catches was enumerated by the usualmethod and the numbers found in each catch were multiplied by 2 in order toindicate the total number of organisms in the column through which the net passed.
The results of these quantitative studies are given in Table 12 in which the averagenumbers of organisms per liter of water are indicated for the different series. Noattempt was made to count the different species separately; the different forms wereenumerated by genera, and the various genera were then combined into groups asshown in the table.
The great variety of organisms found in the catches is shown by the followinglist of genera which are represented in the material.
Cladoeera.:Alona..Bosmina.Chydorus.Daphnia.Holopedium.
Copepoda.:Cyclops.Diaptomus.Epischura..
Rotifera.:Anuraea.
Rotifera-Continued.Asplanchna.Asplanchnopus.Brachiol1us.Conochilus.Conochiloides.
Rotifera-Continued.Diplois.Diurella.Flo8oularia.Gastropus.Monostyla.

424 BULLETIN OF THE BUREAU OF FISHERIES'
Rotifer~-Continued,.Notholca.Ploesoma.Polyarthra.Rattulus.Synchaeta.Triarthra.
Protozoa:.Actinosphaerium.Ceratium.Dinobryon.Epistylis.Glenodinium.
.Mallomonas.Peridinium.Stentor.Uroglena.Vorticella.
Blue-green algre:Anabaena.Aphanocapsa.
. Chroococcus.Coelosphaerium.Gloeocapsa.
. Leptobasis.Lyngbya.Microcystis.Oscillatoria.Spirulina.
Green algre:. Ankistrodesmus.
Actinastrum.Botryococcus.Coelastrum.Chlamydomonas.Chlorangium.
Green algre-Continued.Cosmarium.Crucigenia..Mougeotia.Pediastrum.Pandorina.Staurastrum.S,cenedesmus.Sphaerocystis.Spondylosium.Tetraspora.Ulothrix.
Diatoms:Asterionella.Amphora.Ceratoneis.Cocconeis.Cyclotella.
Diatoms-Continued:.Cymbella.Epi~he~ia. 'Fragilaria.Goinphonema.Melosira. 'Navicula..Nitzschia.Stephanodiscus,Synedra.Tabellaria.
TABLE 12.-:-Numerical analysis of the net plankton catches of Kartuk, Thumb, and O'Malley Lakes[The average number of organisms per llter of water from surface to bottom is Indicated for the dHferent series]
KARLUK STATION 1
ICI3docera Protozoa I Blue· GreenDate Depth Copepoda Nauplll RoWera green algm Diatomsalgm
'--------- --------- ._-----Meters
July 19, 1927••• ____________________ 0-125 1.0 ,8.7 30.5 244.0 11 273 2,928 4,457July 31,1927_.. __ .... ____________ .. 0-125 1.3 1.9 32.3 257.0 1,279 445 28,561 4,802Aug. 13, 1927...... _••• ________ •__ •• 0-125 .7 4.0 47.0 2.14.0 543 ll41 1; 547 6.53Aug.24,1927. •••• _... ___ •_______.. 0-125 2.5 12.6 53.4 106.0 729 65 3,679 542SPf,t. 13, 1927......._._ ....._____ •• 0-125 2.1 15.3 37.7 29.3 43 9 3,681 226Ju Y10, 1928.. ~........ ____ .~ ____ ._ 0-125 .8 5.0 32.4 107.0 42 61 2,378 752'sey,t. 3, 1928... __......._........__ 0-125 8.1 24.5 100.0 54.5 133 18 4,121 417Ju Y9, 1929•••__...... ~ __ .. _....... 0-125 1.2 8;9 57.5 164.0 204 13 2,645' 3,591SeEt.8, 1929. ___ • __ c_ •• __ -------,-. 0-125 6.7 35.5 82.0 70.0
~b~1.191 1,482. 1.624Ju y 12, 1930._. ____ ., ....... __ .... _ 0-125 .4 14.7 3.3 159.0 868 2,1M 7,025
Sept. 9,1930_ .............__ • _____ • 0-125 1.5 7.3 26.0 60.7 177 548 634 605
KARLUK STATION 2
July 21, 1927........._.--- ..---: ••• 0-45 1.8 8.5 , . 9.8 367.0 14 1,058 23,452 67,424Aug. 2. 1lI27____________ ••.•••• _•••• 0-45 4.0 7.0 52.7 316.0 1,990 200 16,721 10,285Aug. 12, 1927._____.... ___ ........_. 0-45 6.2 5.1 28.1 322.0 663 ' 414 2,544: 3/596Aug. 26, 192L__ ._..... __ ...... _~.. 0-45 7.0 17.0 51. 0 172.0 62P 233 8,399 23,997Sept. Ie, 1927......_....._..__ • __ ._ 0-45 .6 11.5 12.5 ,17.2 43 6 1,298 4,114July 11, 1928....._. ______...__ •• _•• 0-45 .2 2.7 8.9 143.0 154 6 2,853 5,582sef,t. 2, 1928._.. _____ • _________ ._._ 0-45 13.4 33.0 120.0 90.0 207 59 2,555 1,270Ju Y 13, 1929_ •• _........._._~... ___ 0-45 .9 7.0 21:8 148.0 242 78 1,105 3,896Sef,t.7,1929- ...--- ______ .._....... 0-45 5.8 37.6 106.0 92.0 65 1,47-3 1 009 8,441lJu Y 13, 1930.........._....... _..... 0-45 .5 5.2 2.9 204.0 430 40 2, 283 50,268Sept. 2, 1930........... _......... _. 0-45 4.4 19.9 181. .0 240.0 24 484 2,338 748
KARLUK STATION 3
July 19, 1927........_.............., 0-50 I I0.9 I 5.51 15.31 361,
01 21'1
760 19.910 , 28,485'Jul~' 9,1929...... _.._______ .. __ .... 0-50 j 1.0 10.0 20.6' 188.0 281 149 1,622
122.0948
Sept. 11, 1929.... _... ____ .......... 0-50 7.1 46.9 130.0 221 352 1,081 I l,9n
THUMB LAKE,
IJuly 21,1927_____.. ___ •• ___________ 0-10 29.5 21J.l 24.1 370.0 ----- .. ---- 3,896 1,375,370Aug. 3, 1927........................ 0-10 160.0 33.8 4.6 405.0 ·.. ··-355· "-ji;i72' ----- ........ '" 985,825Aug. 12, 1927..... ___...., __ .. , ..... 0-10 4.2 13:4 .9 58.2 ----_ .. ---- ---------- 889,000Aug. 26. 1927__............._....... 0-10 17; 8 5.0 .9 133.0 195 -- ........ _oo .... M,134Seft. 16, 1927- --- ... -- .. ~.-------.. 0-10 5.0 .9 1.4 456.0 178 -""'355' 309,9,06Ju y 9,1928......... _..... _.. _..... 0-10 2.5 .9 69.0 ,'·87.0 ' 433 660 146,286SeEt. 3,1928.............. _......... 0-10 10.5 5.8 2.2 78.4 949
U'~i~ 104,628Ju y 11, 1929..__ .... ______ ...___.._ 0-10 .5 .2 6.0 177.0 6,647 32~ 010Seft.7'1929.........------- ....... 0-10 103.0 8.3 6.0 1,433.0 174 "'7i'-94S- 17,-30Z -793,320Ju y 13, 1930..... _....____ ......... 0-10 31. 0 46.21 489.0 1,120.0 157,~~ .. 94,724 7,386,500Sept. 6, 1939............•...... •.. • 0-10 99.5 12.8 1.6 2, 6711.0 -- ....iiS- 6,828; .' '1,752
tIMNOLOGrCAL'STU):>IES OF KARLUK LAKE :425
rrABLE 12.-,-Numerical.analysis QJ the net' plankton catches or Karluk, Thuri.b, and O'Malley Lakea-, , " , Continued , . '
,'. [The average number ~f prga~lsmsper ,liter ~f water from surface to bottom Is IlldJeated, for the dltrerent series)
" O'MALI,.EY LAKE
.
Date
'.'
Depth Cladocera Copeppda . N auplll Rotifera ProtozoaBlue·greenalgID
Green'illglB Diatoms
-'-'-----'-~---~~-I----'---'-'-'------- ---'- --'-'- -'-'-' --'-'--, .. MetersJuly 23,1927_. __ .__ ._.__ •••••_. • . 6-10Au~.JO,1927•••••••••••••• -.-.,.... 6-10Aug.24,lg27•••_•••••_. •••••• _ 6-10Sept, 14, 1927••c••••••••••••• ' •••• ~I·· 6-10July 10, 1929._•• __ •••••• ••••••• 6-10Sept. 12, 1929•• _._ ••••• __ .-'.:...... 6-10July 15, 1930••••••••••••• __ ._. •• 6-10
.. Sept, 5, 1930••••••••••••••••••••••, .6-10
1.21\.0.2,76.0
11.0. 1.,211.6'3.7
11.812.91.81.81.82.:86.73.0
6.95.58.31.09.74.69.72.8,
386.0 _•••••••• , 129 __ .:••••••167.0 •••••••••• """'_" 3,896'147.0782 7,820 1,564180.0 _•••,..... 1,760 782364.0 40 _••••• • 1,447175.0 241,' 1,564 404205.0 227 1, 173 1, 315246. 0 ,J78 568 2, 523
36,040502,650133,466145;44512,1046,737
12,789,21,495
KARLUK LAKE
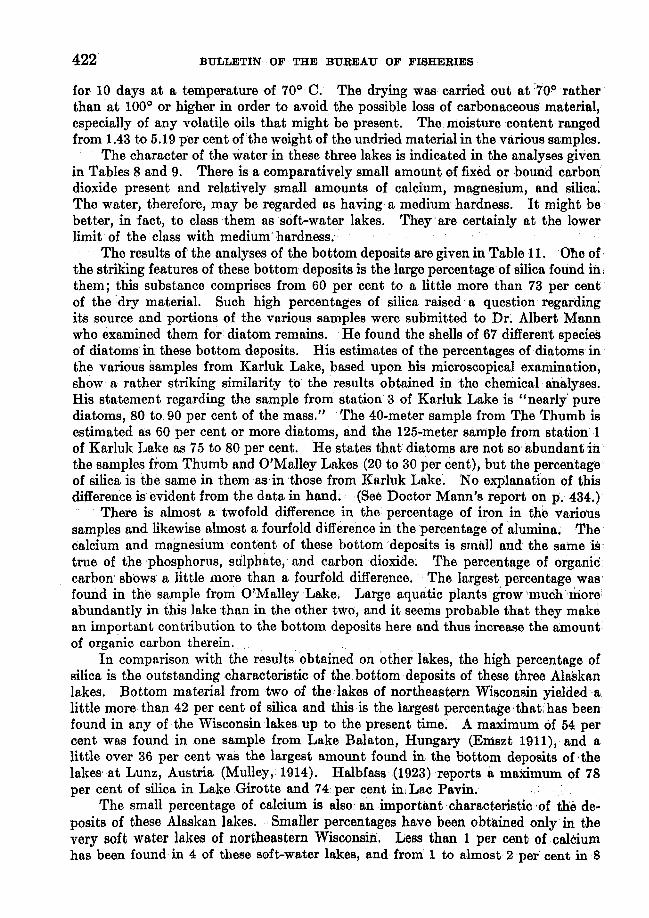
Five series of catches were taken in the deepest part of Karluk Lake (station 1)in 1927:and two series in each of the other years, 1928 to 1930, respectively. 'Twelveseries of catches were also taken at :station 2' in the Thumb during this same periodof ,time and two 'at station 3· in. the Lower Basin. (See map, fig. I.)
Zooplankton.-TheCladocera were represented in Karluk Lake by specimens ofBosmina and Dtiphnia. ,Numerically these two forms were about equally abundant inthe 'Various catches> Both forms were most abundant in: the upper 50 11leters; ,in
'some series, in fact, they were not found in the catches taken below this depth. Thesmallest number of Cladocera was noted in the series of catches taken on July 12, 1930.
.T·he maximum number of Daphnia was obtained in theS':"10-meter stratumat station1 "on September 8, 1929, namely, nineindividu'als per liter 'of water. Thela:rgestcatch ofBosniina: (13 per liter) was foun'din the 30-50-meter stratum on SeptemberS,
,1928; (See Table 12.) ,The C01Jepodawere repi-esented in the catches by speciesofDiaptomus and Cyclops;
'individuals belonging to ,the latter genus were more abundant than those belongingto the' former, . Both, forms were more 'abundant between the surface and 70 metersthan they were below the latter depth. The maximum number of Diaptomus wasfound in the:.O....S-inetercatchtaken at station Lon September 8, 1929, namely, 22'individuals per liter of water. In the same catch Cyclops reached the maximum
. number of 145 per liter.' .The average number of Copepoda from surface to bottom inthe .catches taken. on September 8, 1929, was 35 per liter. This was the highestaverage'obtained in any of the series'at station 1. Thecopepodnauplii were' morenumerous than the adults; they were more abundant in the upper 10 to 20 meters than·atgreater·depths. In 1927.thelal'gestaverage number of nauplii for the entire depth'oftlie'lake was .found on August 13 when 47 individuals per liter were found. Amaximum average of 100 per liter was noted on September 3, 1928. Thesmallest
"averagen'umbe'rwas foundon'July 12,193,0, namely, 3.3 per liter. . ' ..: Numerically the Rotifera·constituted the.major part of the zooplankton in Karluk
I Lake;;' Asplanchna,Anuraea, and Polyarthra were the most abundant: forms in this\grolipand ,they were most numerous in the upper 10 meters, N otholca was obtained,ill considerable numbers below a depth of 15 'meters in some of the series. ' Iliall of
::theseries the rotiiers were much more abundant in July than in September. The,decrease in ~he number 'of rotifers during the Bummer is well illustrated in' the five

426 BULLETIN OF THE BUREAU OF FlsHERIlllS
series of catches which were taken at station 1 in 1927. The average number fromsurface to bottom in the series of catches taken on July 19 was 244 per liter; it was257 on July 31, then declined to 213 on August 13, fell to 106 on August 24, andreached a minimum of only 30 per liter on September 13. In 1928 the average was107 per liter on July 10 and 55 on September 3, and similar decreases were noted inthe September series taken in 1929 and in 1930.
The protozoan population of Karluk Lake consisted principally of Epistylis andVorticella. These organisms were attached to the Copepoda; they were found inconsiderable numbers on both Cyclops and Diaptomus, but they were not present onthe Cladocera. A third protozoan, namely, Peridinium, was found in some of thecatches taken at station 1. The largest number of protozoa noted at station 1 wasobtained in the series taken on July 31, 1927, namely, an average of 1,279 per literfrom surface to bottom; at station 2 the largest average number was 1,990 per literdown to a depth of 45 meters, the maximum depth at the station, on August 2, 1927.In the other catches taken at the three stations in Karluk Lake, the average numberof protozoa varied from 11 to 729 per liter.
Phytoplankton.-:-The results obtained in the enumeration of the phytoplanktonforms of the net plankton are given in Table 12. This table shows that the bluegreen algre played only a. minor role in the catches secured between 1927 and .1930,leaving the green algre and the diatoms as the dominant elements of this group oforganisms. As might be expected these forms were most abundant in the upper .20llleters where light conditions were favorable for their photosynthetic activities.
. The phytoplankton material obtained in the lower strata represented senile or deadindividuals that were settling to the bottom, or else organisms that were living saprophytically in this region. A maximum of 102,000 green algre per liter was found in theO-lO-meter stratum of station 1 on July 31, 1927, and the next largest m~mber wasnoted in the 15-20 meter catch of this same series. The largest average number ofgreen algre from surface to bottom was obtained in this series also, namely 28,500per liter. The diatom maximum at station 1 yielded 25,700 cells and colonies perliter in the 10-15 meter stratum on July 31, 1927; the average number of diatoms fromsurface to bottom on this date was 4,800 per liter. An average of 7,000 was obtainedon July 12, 1930.
The September catches in general showed a smaller number of green algre andof diatoms than the July catches. The average number of green algre declined from28,500 per liter on July 31 to 3,680 on September 13, 1927. Decreases were notedalso in 1929 and 1930, but in 1928 the September average was larger than that obtained in July. The diatoms, on the other hand, showed a smaller average number inSeptember than in July from 1927 to 1930, inclusive.
The vertical distribution of various net plankton organisms at station 1 is showngraphically in Figures 3 to 6. The number of individuals belonging to the differentforms varies so widely that it is necessary to use the spherical type of curve in orderto get all of the groups on the same diagram. The construction of this type of curvehas been discussed by Birge and Juday (1922), so that it need not be repeated here.For the purpose of bringing out more clearly the vertical distribution of the Cladoceraand Copepoda, the diagrams have been platted on the basis of the number of organisms per cubic meter of water instead of on the liter basis as given in the tables. Theblue-green algre were omitted in some of the diagrams because they were present insuch small numbers; for the same reason the Cladocera were omitted in Figure 5.
LlMNOLOGICAL STUDIES OJ<' KARLUK LAKE 427
D.cA
11011--11---,.1201'----"L--FIGURE ••-Vertlcal distribution or zooplankton In Karluk
Lake, .station I, September 8, ·1929. A, Dlaptomus; B,Oyclops; C, nauplll; D,OIadocerll. Note tbe large numberor nauplll In the upper stratum
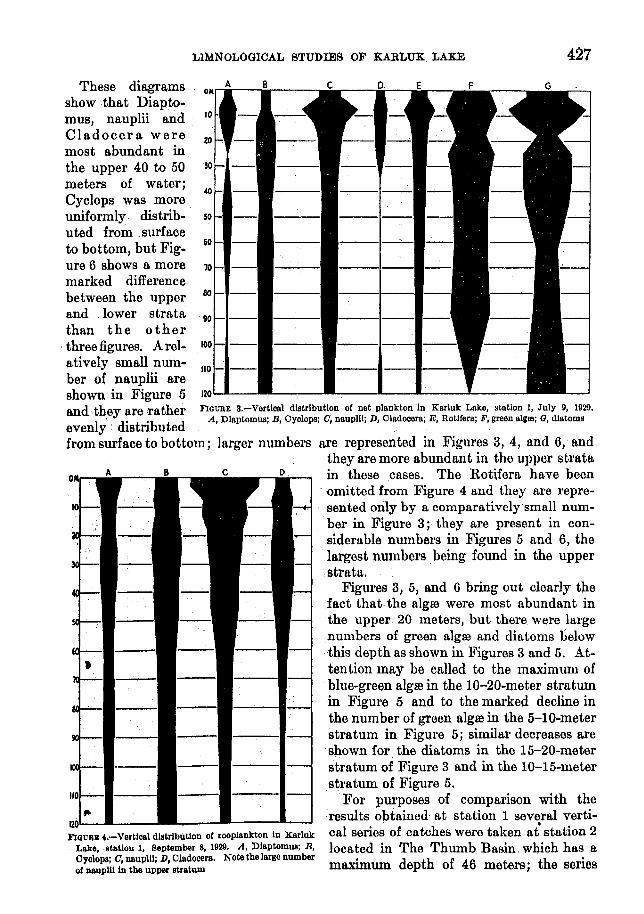
These diagramsshow that Diaptomus, nauplii andCladocer a weremost abundant inthe upper 40 to 50meters of water;Cyclops was moreuniformly distributed from surfaceto bottom, but Figure 6 shows a moremarked differencebetween the upperand lower stratathan the 0 therthree figures. Arelatively small num- 110
ber of nauplii areshown. in Figure 5and they are rather FIGURE 3.-Vertlcal distribution or net plankton In Karluk Lake, station 1, July 9, 1929.evenly. distributed A, Dlaptomus; B, Oyclops; C, nauplll; D. Oladocera; E, Rotlrera; F, green algm; G, diatoms
from surface to bottom; larger numbers are represented in Figures 3, 4, and 6, andthey are more abundant in the upper stratain these. cases. The Rotifera have beenomitted from Figure 4 and they are represented only by a comparatively small number in Figure 3; they are present in considerable numbers in Figures 5 and 6, thelargest numbers. being found in the upperstrata.
Figures 3, 5, and 6 bring out clearly thefact that the algre were most abundant inthe upper 20 meters, but there were largenumbers of green algre and diatoms belowthis depth as shown in Figures 3 and 5. Attention may be called to the maximum ofblue-green algre in the 1O-20-meter stratumin Figure 5 and to the marked decline inthe number of green algre in the 5-1O-meterstratum in FiglJre 5; similar decreases areshown for the diatoms in the I5-20-meterstratum of Figure 3 and in the 10-15-meterstratum of Figure 5.
For purposes of comparison with theresults obtained at station 1 several vertical series of catches were taken at station 2located in The Thumb Basin which has amaximum depth of 46 meters; the series
",taken at: thisstation 'extended to ll.
,depth of 45meters. (Seefig. 1.) In general, the average number oforganisms obtainedat thesetwos ta tionswas within therange of variation of duplicate samplestaken at a single station. Atwofold 'orthreefold variation in number may be expected incertain forms in
the various series taken at these twoforms in
120
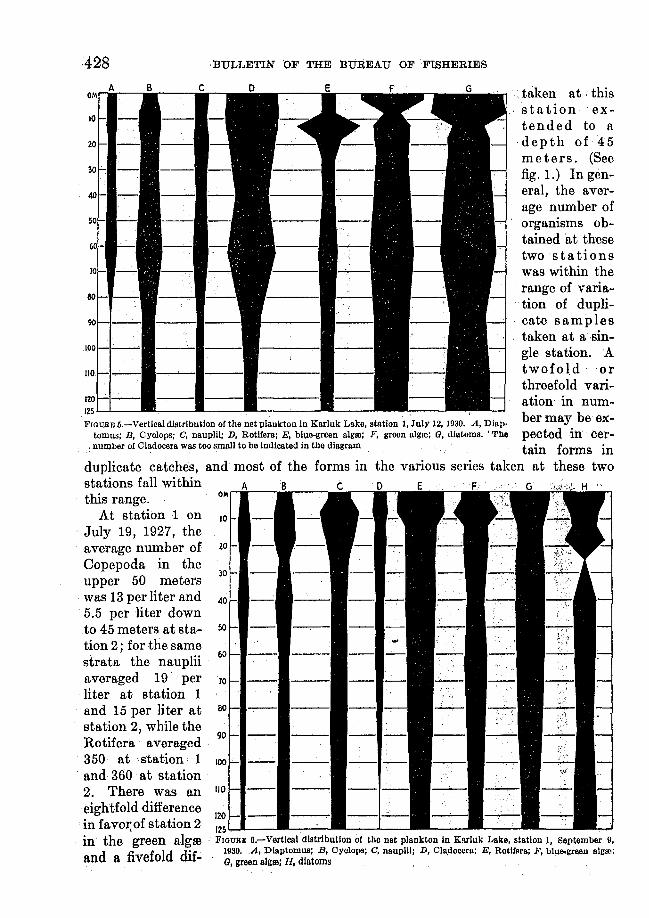
125L,-,----FIGURE 6.-Vertlcal distribution 01 the net plankton In Karluk Lake, station 1, September 9,
1030. A, Dlaptomus; E, Cyclops; C, nauplll; D, Cla,docars; E, RotilMa; F, bllle.green ailloo;G, green algm; Ii, diatoms
BULLETIN OF THE BUREAU OF FISHERIES
120125l-.l-
FIGUJlE D.-Vertical distribution olthe net plankton In Karluk Lake,station 1, July 12, 1930. A, Diap·tomns; B, Cyclops; C, nauplll; D, RoWera; E, blue·green algm; F, green algm; G, diatoms.• The
. number of Cladocera was too small to be Indicated in tile diagram
428A
OM
10
20
30
40
50
60
70
50
90
100 --110
duplicate catches, and most of thestations fall within A Bthis range. OM
At station 1 on 10
. July 19, 1927, theaverage number of 20
Oopepoda in the30
upper 50 meterswas 13 per liter and AD
5.5 per liter downto 45 meters at sta- 50
tion 2; for the same60
strata the naupliiaveraged 19 per 70
liter at station 1and 15 per liter at 80
station 2, while the'90
Rotifera averaged'350 at .station 1 100"
and 360 at station2. There was an 110
eightfold differencein favoI;of station 2in the green algreand a fivefold dif-

LIMNOLOGICAL' STUDIES OF KARLUK LAKE 429
ference in the diatoms. On July 12 and 13, 1928, the average numbers down to 50 and45 meters, respectively, were substantially the same at station 1 and at station 2 forthe green algro and the rotifers, but the diatoms were about five times as abundantat the latter as at the former station. The nauplii were a little more than five timesas abundant at station 1 as at station 2. On July 12 and 13, 1930,there was substantially the same average number of rotifers, nauplii, green algro and diatoms inthe upper 50 meters at station 1 as in the 45-meter series at station 2.
Similar variations in numbers were noted between the catches taken at station 1and those at station 3. On July 19, 1927, the aver'age number of nauplii down to50 meters at station 1 was 44 per liter and 19 per liter at station 3; the rotifers numbered 350 per liter at station 1 and 360 at station 3. The green algro were five timesand the diatoms four times as numerous at station 3 as at station 1. On July 9,1929, the catches in the upper 50 meters at station 1 yielded a la,rger number of netplankton organisms than those at station 3; the difference was less than twofoldin the rotifers and the green algro, but it was fourfold in the nauplii and fivefold inthe diatoms. In the series taken at station 1 on September 9, 1929, and that atstation 3 on September 11, 1929, the average number of nauplii, rotifers, and diatomswas somewhat smaller down to a depth of 50 meters in the former than in the latterseries, but the reverse was true of the green algro. A comparison of the averagenumbers in the series taken at station 2 on July 21, 1927, and on July 13 and September 7, 1929, with those from station 3 on July 19, 1927, and on July 9 and September 11, 1929, shows that the most marked differences are represented in the diatoms; even the maximum difference in this group is only a fourfold one.
THUMB LAKE
Five sets of net catches were secured from Thumb Lake in 1927 and two in eachof the other three years, making a total of 11 series. (See Table 12.) The Cladocerawere more abundant in Thumb Lake than in the upper 10 meters of Karluk Lake.A maximum of 263 Bosmina per liter was noted in the upper 5 meters of ThumbLake on August 12, 1927; this form seems to have been concentrated in the upperstratum at this time, since the 5-10-meter stratum showed only 6.5 individuals ,perliter. On the other hand, a larger number was found in the 5-10-meter stratum(121 individuals per liter) than in the upper 5 meters (82 per liter) on September 7,1929. Again on September 6, 1930, a larger number of Bosmina was found in theupper 5 meters than in the 5-10-meter stratum. The maximum number of Daphnia(10 per liter) was obtained in the upper 5 meters on August 26, 1927.
A maximum of 92 Cyclops per liter was noted in the 5-8-meter stratum on July13, 1930. Relatively small numbers of Diaptomus were obtained in Thumb Lake;the maximum was 3 per liter in the upper 3 meters on September 3, 1928. An unusually large number of nauplii was noted in the 5-8 meter strutum on July 13, 1930,namely 968 per liter; the next highest was 202 per liter on July 9, 1928.
The zooplankton of Thumb Lake was characterized hy the large number of rotifers. The maximum was found on September 6, 1930, when the average from surface to 8 meters was more than 3,600 per liter. The smallest number of rotifers wasobtained in the catches of 1928; on July 9 the average number was 87 per liter and onSeptember 3 it was 78.
Protozoa were most abundant in Thumb Lake on July 13, 1930, when the average number was 157,400 per liter of water.

430 BULLETIN OF THE BUREAU .oF FISHERIES
The phytoplankton consisted chiefly of diatoms; an average of 7,386,000 diatomsper liter was obtained in the net catch taken on July 13, 1930. A maximum averageof 94,700 green algre per liter of water was noted on the same date. The largestnumber of blue-green algre was found on September 7, 1929, namely, an average of71,900 per liter.
O'MALLEY LAKE
Eight series of net catches were taken on O'Malley Lake, four in 1927, and twoeach in 1929 and 1930. (See Table 12.) In general, the crustacea were not asabundant as in the Thumb Lake catches. The Cladocera were represented by a fewChydorus in one catch and by varying numbers of Bosmina in all of the catches. Amaximum of 17 Bosmina per liter was taken in the 5-10 meter catch on July 10,1929. The Copepoda were represented by a maximum of 8 Diaptomus per liter inone catch and a maximum of 4 Cyclops per liter in another. Epischura appeared inthree catches, with a maximum of 5 per liter in one.
As in Karluk and Thumb Lakes, the Rotifera were the dominant group numericallyin the zooplankton of O'Malley Lake. The catch taken on July 23,1927, yielded thelargest average number of rotifers, namely, 386 per liter.
Protozoa and blue-green algre were found in relatively small numbers. The greenalgre reached a maximum average of almost 3,900 per liter on August 10, 1927. Asin Thumb Lake, the phytoplankton of O'Malley Lake was dominated by the diatoms,but they were not as abundant in the latter as in the former lake; a maximum of562,000 diatoms per liter was obtained on August 10, 1927.
TABLE 13.-Average number of net plankton organismB per liter of water in seven American lakes
Lake Date Depth Clado- Cope- NaupJii Rotifera IProto- ~~':,';;cera poda zoa algID
Green DiatomsalgID
--------1--'------1--------- --'---------------Meter8
Canandaigua, N. Y _...__ .. _ Aug. 20, 1010____ 0- 80 1.0 5.4 3.0 0.7 12 30 1 15Do_____ . ___ ... ___ .. _____ July 27, 1918... __ 0- i2 .5 1.8 2.4 .7 10 5 2 17Cayuga, N. Y......... _____ . Aug. 12, 1010. ___ 0-120 10.2 2.8 10.6 50.0 851 22 --~-_.- --- 3,068
Do..... ______ . _.. ___ .. _'. July 30,1918.. ___ Q-100 5.0 3.1 2.2 30.0 83 3 ---------- 19Seneca, N. Y. _______________ Aug. 4,1910 _____ 0-165 6.3 \}.8 16.2 13.2 23 \} -- ---- ---- 230
Do.. __ ._. ________ .... ___ Aug. 1, 1918.. __ . Q-170 4.1 9.2 8.7 3.4 19 1 -- -- - ----- 113Skaneateles, N. Y .. _________ Aug. 15,1910 ____ Q- 80 .3 .4 2.5 1.3 92 31 1,384Crescent, "rash_~___________ Aug. 17, 1913 ____ Q-160 .01 .8 .2 2.8 2 3 110FallcD Leaf, CallL ___ ." ____ . July 25, 1913 __ .. _ Q-110 .5 2.1 1.0 4.8 18 -"'z;iii' 282Karluk ______________ .... ___ . July 9, 1929.... __ 0-125 1.2 8.0 57.5 173.8 125 13 3,592Do... _______ .. _. _______ . July 12, 1930_____ Q-125 .4 14.7 3.3 160.0 307 886 2,164 4,638
Do.. __ . ___ •. ' ___ . _•..•. _ Sept.9,1930-. ___ 0-125 1.5 8.1 , 26.0 61.0 18 537 636 605
COMPARISON OF KARLUK WITH OTI-IEH LAKES
Table 13 shows the average number of net plankton organisms per liter of waterfrom surface to bottom in some lakes that are similar to Karluk Lake in depth andcharacter. Four of the Finger Lakes of New York and one each from the States ofCalifornia and Washington are included in this table. The series of catches represented in these averages were taken with the same type and with the same size ofplankton net, so that the general results obtained in the various lakes are comparable.
The averl;J,ge number of Cladocera was larger in Cayuga and Seneca Lakes than inKarluk; they were about the same in Canandaigua and Karluk Lakes, but a smalleraverage was found in the other three lakes shown in the table. The average numberof Copepoda and nauplii waS larger in Karluk than in the other six lakes and the samewas true of the Rotifera. The average number of protozoa in Cayuga Lake exceeded

LIMNOLOGICAL STUDIES OF KARLUK LAKE 431
that of Karluk Lake, but the average number of the other five lakes was smaller thanthat of Karluk.
The blue-green and the green algID were more abundant in Karluk Lake than in theother six lakes. With the exception of the series of net catches taken on CayugaLake on August 12, 1910, the average number of diatoms was considerably larger inKarluk Lake than in the other six lakes included in the table. The general resultsgiven in this table indicate that the net plankton is more abundant in Karluk than inthe other lakes; the most striking difference is the great abundance of green algal inthe former as compared with that group of phytoplankton organisms in the latter.
This greater production of plankton in Karluk Lake is due, in part at least, to thenitrogen and phosphorus compounds that arc contributed to the water of this lakeand to that of the streams flowing into it by the decomposing carcasses of the redsalmon which spawn in its watershed. Both of these substances are essential foodmaterials for the phytoplankton and they serve the function of fertilizers; thus theaddition of these compounds derived from the dead salmon to those already presentin the water makes it possible for the lake to support a larger·crop of phytoplankton.A more abundant crop of phytoplankton will, in turn, support a larger crop of zooplankton forms which depend upon the algal for food; as a result this abundant supplyof phytoplankton and zooplankton provides a good supply of food for the young redsalmon, since they feed almost exclusively on plankton material while they inhabit thelake. Thus the fertilizers derived from the adult salmon are very important factorsin producing an abundant food supply for the young red salmon. Gilbert and Rich(1927) state that the Karluk fingerling red salmon are unusually large and form asturdy stock; these authors attribute the large size to the very favorable conditions forgrowth which they find in this watershed. It seems probable from the resultsobtained in the present investigation that the chief factor in these favorable growthconditions is the abundant crop of plankton which is available for them in Karluk Lake.
CENTRIFUGE PLANKTON
A series of centrifuge catches was taken fit station 2 in Karluk Lake on August 8,1927, and two sets of these samples were obtained from Thumb Lake, one on August 3and another on August 12,1927. These centrifuge catches were taken for the purposeof comparing the number organisms obtained by this method with that obtained withthe net; many plankton organisms are so small that they readily pass through themeshes of the net and are thus lost in such a catch. A hand centrifuge operated at aspeed of about 1,200 revolutions per minute was used for the centrifuge catches; from100 cubic centimeters to 120 cubic centimeters of water were used for each catch.Numerical results for the various catches are given in Table 14. The protozoa andblue-green algID have been omitted from the table because they were found in only 2of the 11 catches.
The six centrifuge samples taken at station 2 in Karluk Lake on August 8, 1927,yielded an average of 65,600 green algre and 88,200 diatoms per liter of water. No netcatches were taken at station 2on this date, but a series obtained there on August 12gave an average of 2,500 green algre and 3,600 diatoms per liter. The centrifugematerial yielded a little more than 25 tim'es as many green algal and almost 25 timesas many diatoms as the net samples obtained on the latter date. The series of netcatches taken at station 2 on August 2, 19~7, yielded an average of 16,700 greenalgre and 10,300 diatoms per liter, so that thek~~ntrifugecatches contained only aboutfour times as many green algal as these net catches and only a little more than eighttimes as many diatoms.

432 BULLETIN OF THE BUREAU OF FISHERIES
TABLE 14.-Number of phytoplankton organisms per liter of water at various depths in hand centrifugecatches taken in Karluk Lake, station 2, and in Thumb Lake in 1927
Thumb Lake
Karluk Lake, Aug. 8Organisms
o 10 15 25 40 o
Aug. 3
10 o
Aug. 12
5 10
--------1------------------------------ ----Green algal: Afeters Meters Meters Afeters :Afelers "'feters .Heters Meters Meiers Meters Meters
Ankistrodcsmus______ 70,560 _Chlamydomonas 70,560 211,685 23,520 70,560 '10,560 70,560 211,685 105,843 70,560Staurastrum 17,640 __Scenedesmus .. 105,825 _
Diatoms:Asterlonella 141,123 23,520 211,685Amphora 17,640 23,520CycloteIla 23,520 70,560 70,560 •• __Fragilaria 70,560 141,123 141.123 _Melosira 70,.560 23,520 23,520 35,280 776,178 987,803 917,300 917,300 70,560Navicula :_____ 35,230 _Synedra 35,280 17,640 70,560 35,280 423,370 94,082 70,560 35,280Stephanodiscus 70.560 _Tabellaria____________ 70,560 _
The net catches taken in Thumb Lake on August 3, 1927, contained no greenalgre, but the diatoms numbered 985,000 per liter of water. The surface and bottom centrifuge catches taken on this date gave an average of 70,500 green algre and1,377,000 diatoms per liter; the diatoms, therefore, were less than twice as numerousin the centrifuge catches as in the net material. In the net and centrifuge catchestaken in Thumb Lake on August 12, 1927, the average number of diatoms in theformer was 889,000 per liter and in the latter 788,000 per liter; in this case the netcatches yielded a larger number of diatoms than the centrifuge samples.
Net and centrifuge samples taken in Lake Mendota at Madison, Wis., over '0,
period of two and a half years showed that the latter yielded on the average aboutfive times as much dry organic matter as the former; at certain times the organicmatter in the centrifuge plankton was about the same in quantity as that in the netplankton, but at other times it amounted to about twenty-five times as much asthat in the net plankton.
SUMMARY
1. The area, maximum and mean depth, volume, temperature, and heat budgetof Karluk Lake are given,
2. The chemical results show that the surface water was alkaline (pH 8.6) andthat at 125 meters was neutral (pH 7); the water contained an abundance of dissolved oxygen at all depths during the summer, hence it belongs to the oligotrophictype of lakes; the water contained only 9 to 10 milligrams of fixed or bound carbondioxide per liter.
3. The soluble phosphorus in Karluk Lake varied from 0.002 milligram in thesurface water to 0.018 milligram per liter in the lower water; the organic phosphorusranged from 0.003 to 0.028 milligram per liter in the surface water and from 0.012to 0.014 milligram per liter in the lower water.
4. The titratable silica ranged from 0 to 0.6 milligram per liter.5. Very little ammonia nitrogen was found in the surface watcr of Karluk Lake,
but 0.12 milligram per liter was present in the bottom sample from station 2. Practically no nitrite nitrogen was present. The nitrate nitrogen ranged from 0.012milligram in the surface water to 0.052 milligram per liter in the bottom water.

LIMNOLOGICAL STUDIES OF KARLUK LAKE 433
6. The water yielded from 5 milligrams to a little more than 6 milligrams ofcalcium per liter and from a little more than 3 to almost 6 milligrams of magnesiumper liter.
7. The bottom deposits contained from 60 to 73 per cent of silica with onlysmall percentages of calcium and magnesium. -
8. The quantity of phosphorus, silica, and nitrogen was somewhat larger inThumb and O'Malley Lakes than in Karluk Lake.
9. Larger amounts of carbon dioxide, silica,. ammonia, and nitrate nitrogenwere found in some of the affiuents than in the surface water of Karluk Lake.
10. The decomposition of the dead salmon affects the chemical status of thewater in the three lakes and their affiuents.
11. The net zooplankton of Karluk Lake was character zed by a large populationof Rotifera.
12. The phytoplankton of this lake consisted chiefly of green algre and diatoms.These two forms were more abundant in July than in September.
13. In general, the net plankton was more abundant in Karluk Lake than infour of the Finger Lakes of New York and in two of the western lakes.
14 The net zooplankton of Thumb Lake was more abundant than that of theupper 10 meters of Karluk Lake. T4e same was true of the phytoplankton.
15. In general, the net plankton: was not as abundant in O'Malley Lake as inThumb Lake.
16. The rich crop of plankton produced by these lakes is due, in part at least,to fertilizing substances contributed to their waters by the decomposing carcasses ofthe salmon.
17. The large crop of plankton furnishes an abundant supply of food for theyoung salmon and, as a result, the fingerling salmon of Karluk Lake are unusuallylarge and sturdy.
LITERATURE CITEDA~WA~ER, W. O.
1888. The chemical composition and nutritive values of food-fishes and aquatic invertebrates.Report, U. S. Commissioner of Fish and Fisheries, Part XVI, 1888 (1892), pp. 679-868.Washington.
BIRGE, EDWARD A.1915. The heat budgets of American and Europeim lakes. Transactions, Wisconsin Academy
of Sciences, Arts and Letters, vol. 18, No.1, 1915, pp. 1-47. Madison.BIRGE, EDWARD A., and CHANCEY JUDAY.
1914. A limnological study of the Finger Lakes of New York. Bulletin, U. S. Bureau ofFisheries, Vol. XXXII, 1912 (1914), pp. 525-609, 22 figs., PIs. CXI-CXV1. Washington.
1922. The inland lakes of Wisconsin. The plankton. 1. Its quantity and chemical composition. Bulletin No. 64, Wisconsin Geology and Natural History Survey, 1922,222 pp.,46 figs. Madison.
BIRGE, E. A., and W. H. RICH.1927. Observations on Karluk Lake, Alaska. Ecology, vol. 8, No.3, July, 1927, p. 384.
BLACK, C. S.1929. Chemical analyses of lake deposits. Transactions, Wisconsin Academy of Sciences,
Arts and Letters, vol. 24, pp. 127-133. Madison.EMSZT, K.
1911. Die chemische Zusammensetzung des Schlammes und des Untergrundes vom BalatonBoden. Resultate del' wissensch. Erforsch. des Balatonsecs, Bd. 1, Heft 1, pp. 1-17.Vienna.
434 BULLETIN OF THE BUREAU OF FISHERIES
GILBERT, CHARLES H., and WILLIS H. RICH.1927. Investigations concerning the red-salmon runs to the Karluk River, Alaska. Bulletin,
U. S. Bureau of Fisheries, Vol. XLIII, Part II, 1927 (1929), pp. 1-69,34 figs. Washington.
HALBFASS, W.1923. Grundziige einer vergleichenden Seenkunde. 1923, 354 pp., 110 figs. Berlin.
JUDAY, CHANCEY.1916. Limnological apparatus. Transactions, Wisconsin Academy of Sciences, Arts and
Letters, vol. 18, No.2, 1916, pp. 566-592. Madison.KEMMERER, GEORGE, J. F. BOVARD, and W. R. BOORMAN.
1923. Northwestern lakes of the United States: Biological and chemical studies with referenceto possibilities in production of fish. Bulletin, U. S. Bureau of Fisheries, Vol. XXIX,1923-24 (1924), pp. 51-140, 21 figs. Washington.
MARTIN, G. C.1913. Mineral deposits of Kodiak and neighboring islands. In Mineral resources of Alaska, by
Alfred H. Books and others. Bulletin No. 542, U. S. Geological Survey, 1913, pp. 125136. Washington.
MULLEY, G.1914. Analysen des Schlammes der Lunzer Seen. Internat. Revue gesamten Hydrobiologie
und Hydrographie. Hydrographisches Supplement, Bd. 5, Heft 2, 1914, pp. 12-16.Leipzig.
SHOSTROM, O. E., R. W. CLOUGH, and E. D. CLAHK.1924. A chemical study of canned salmon. Industrial and Engineering Chemistry, vol. 16,
No.3, March, 1924, pp. 283-289.TAYLOR, HARDEN F.
1926. Mineral constituents of fish and shellfish. In Nutritive value of fish and shellfish.Appendix X, Report, U. S. Commissioner of Fisheries, 1925 (1926), pp. 539-546.Washington.
Part II. DIATOMS OF THE BOTTOM DEPOSITS OF KARLUKLAKE
By ALBEHT MANN
During the course of certain investigations relating to the red salmon of KarlukRiver, Kodiak Island, Alaska, the investigators of the United States Bureau ofFisheries have secured limnological data in Karluk Lake and the two smaller lakes,Thumb and O'Malley, which are tributary to the main lake. These lakes have beensurveyed and described by Gilbert and Rich (1927). In 1927 samples of the bottomdeposits were secured by means of an Ekman dredge. A chemical analysis showedan unusually high silicon content in the deposits of each of these lakes (Black, 1929).It seemed probable that this was due to an abundance of diatoms and eight sampleswere submitted to the writer for study. All are high in diatom content, some of themremarkably so, from 80 to 90 per cent, which accounts for the high silicon content.The great richness and nutritive value of this bottom material is worthy of note.
The data bearing on the samples and remarks on the general character of theircomposition are given below:
1. Lower basin, Karluk Lake (station 3) 50 meters, July 19, 1927.-Nearly purediatoms, 80 to 90 per cent of the mass. Mostly two species, Oyclotella Bodanica andStephanodiscus Niagarae, the former outnumbering the latter 3 to 1. Scanty representatives of Oymbella Mexicana var. Kamtschatica, Gomphonema herculeanum,Epithemia Zebra, Navicula tenella, Melosira Italica, Amphora ovalis, Surir'ella robusta,etc.
2. Thumb Lake, 10 meters, July 21,1927.-80 to 90 per cent diatoms; as in the last,mostly Oyclotella Bodanica and Stephanodiscus Niagarae in ratio of 3 to 1. Also

LIMNOLOGICAL STUDIES OF KARLUK LAKE 435
Oymbella Mexicana var. Kamtschatica, Oymbella ventricosa, Melosira crenulata, Navicula elliptica, Gomphonema subclavat'um, Tabellaria jlocculosa, etc.
3. O'Malley Lake, 12 meters, July 23, 1927.-Diatoms fewer, 20 to 30 per centof the mass. Much fine quartz sand and decayed plant tissue. Here OyclotellaBodanica and Stephanodiscus Niagara.e, although present, are few; Surirella elegansis frequent, but the bulk of the diatoms is made up of minute species-Tabellariajlocculosa, Melosim crenulata var. tenuis, Fragilaria construens, Oeratoneis a1'CUS,Oymbella cistula, etc.
4. O'Malley Lake, July 23, 1927.-The exact locality where this sample was takenwas not recorded, but it was in comparatively shallow water, not over 2 meters, andprobably near the head of the lake where the bottom consists largely of rather finedark sand. Over half the mass is decayed plant tissue, mixed with sand. OyclotellaBodanica, generally prolific in the other samples, seems to be wanting here, andStephanodiscus Niagara.e is scanty. :Among the relatively few diatoms the followingwere prominent: Melosira crenulata var. tenuis, Navicula elliptica, Navicula viridis,Epithemia Zebra, Oymbella ventricosa, Fragilaria construens, Tabellaria jlocculosa, etc.
5. The Thumb, Karluk Lake (station 2) 40 meters, August 8, 1927.-Sixty per centor more is diatoms, the rest decayed plant tissue and a mere trace of sand. OyclotellaBodanica and Stephanodiscus Niagarae compose four-fifths of the diatom bulk. Alsopresent were Oymbella Ehrenbergii, Oymbella gastroides, Oymbella cistula, OymbellaHelvetica, Navicula lata, Navicula major, Navicula viridis, etc.
6. The Thumb, Karluk Lake, 38 meters, August 8, 1927.-Diatoms 30 to 40 percent of the mass. Much sand and coarse plant tissue, moss and wood fiber. Oyclotella Bodanica and Stephanodiscus Niagarae dominant, about 3 to·1. Also OymbellaMexicana var. Kamtschatica, Epithemia turgida, Surirella biseriata, Surirella elegans,Melosira arenaria, Melosira Italica, Fragilaria construens and desmids (Micrasterias).
7. The Thumb, Karluk Lake, 17 meters, August 8, 1927.-Not over 20 per centdiatoms, mostly decayed plant tissue and a little sand. Oyclotella Bodanica andStephanodiscus Niagame are here in abeyance; large chains of Melosira arenaria arefrequent, also Amphom Lybica, Amphora ovalis, Navicula elliptica, Gomphonemageminatum, Oymbella Helvetica, Pleurosigma acuminatum. Some desmids (Staurastrum gracile) and some pin-head sponge spicules.
8. Karluk Lake, upper basin (station 1) 125 meters, August 13, 1927.-Seventy-fiveto eighty per cent of the mass is diatoms ,and of these four-fifths are OyclotellaBodanica and Stephanodiscus Niagarae in their usual ratio of 3 to 1. The remainderis decayed plant tissue with practically no sand or spicules. Other diatoms areOymbella gastroides, Oymbella cistula, Rhoicosphenia curvata, etc.
It is noticeable that the greatest abundance of diatoms in the deposits is foundin the main basins of Karluk Lake and in Thumb Lake. The bottom of O'MalleyLake, even in the center of its basin (sample 3) is much less rich than are the samplesfrom the other two lakes. The three samples from The Thumb are interesting in thatthey show a distinct negative correlation between the proportion of diatoms in thedeposits and the depth from which they came. The Thumb is really a large, wellmarked bay containing one of the main basins of Karluk Lake. The largest streamtributary to Karluk Lake, Thumb River, enters at the head of The Thumb and duringand subsequent to the spaw~ing season carries into the lake large quantities of organicmatter derived from the decaying bodies of the spawned out salmon. In makingthe collections of bottom samples an attempt was made to get a series from aboutthe center of the basin up toward the mouth of Thumb River. '1'he first sample of

436 BULLETIN OF THE BUREAU OF FISHERIES
this series was taken in about 40 meters, near the center of the basin and approximately one-half mile from the mouth of the river. The second sample was takenabout one-fourth mile from the mouth of the river in 38 meters, and an attempt wasthen made to get a sample from a point approximately 100 yards from the mouth ofthe river in about 20 meters. This last was not successful, however, on account oftwigs and other debris which prevented the dredge from closing. After severaltrials the attempt was abandoned and a sample taken in 17 meters near what isknown as Island Point on the western side of Thumb Bay and about three-fourthsmile from the mouth of the river.
Following is a list of the species of diatoms found in the collections as a whole:
Amphipleura pellucidaK.
Amphora Lybica E.Amphora ovalis K.Ceratoneis arcus K.Cocconeis Placentula E.Cyclotella Bodanica Eu!.Cyclotella antiqua W. S.Cymatopleura Solea
(Breb.) W. S.Cymbella c:.espitosa (K.)
Cl.Cymbella cistula (Hemp.)
Kirch.Cymbella cuspidata K.Cymbella Ehrenbergii K.Cymbella glLstroides K.Cymbella Helvetica K.
(not W. S.)Cymbella Mexicana val'.
Kamtschatica Grun.Cymbella ventricosa K.
(not Ag.)Denticula tenuis K.,
val'.Diatoma anceps (E.)
Grun.Epithemia turgida (E.)
K.
Epithemia Zebra (E.)K.
Eunotia bidens (E.) W.S.
Eunotia lunaris (E.)Grun.
Eunotia pr:.erupta E.Fragilaria construens
(E.) Grun.Fragilaria Harrisonii
(W. S.) Grun.Frustulia rhomboides
(E.) De T.Gomphonema constric
tum E. and varieties.Gomphonema gemina
tum (Lyng.) Ag.Gomphonema herculea
numE.Gomphonema subclava
tum Grun.Hantzschia amphioxys
(E.) Grun.Melosira arenaria
Moore.Melosira crenulata val'.
tenuis (K.) Grun.Melosira ltalica (E) .
K.
Melosira Rws:.ena Rab.Melosira varians Ag.Meridion circu'are Ag.Navicula amphirhyn-
chus E.Navicula borealis (E.)
K.Navicula commutata
Grun.Navicula elliptica K.Navicula Gastrum (E.)
Donk.Navicula Iridis val'. dil-
atata (E.)Navicula lata W. S.Navicula limosa K.Navicula major (K.)
Grun., char. emend.Navicula mesolepta E.Navicula Placentula
(E.) K.Navicula rupestris
(Hantz.) A. S.Navicula tenella Breb.Navicula transversa A.
S.Navicula viridis (W. S.)
A. S., char. amend.
Nitzschia BrebissoniiW.S.
Nitzschia palea (K.)W.S.
Pleurosigma acuminatum (K.) Grun.
Rhoicosphenia curvataGrun.
Rhopalodia gibba (E.)Muell.
Stauroneis Phoenicentemn E., and varieties.
Stephanodiscus Nia-gar:.e E.
Surirella amphioxys W.S.
Surirella bifrons E.Surirella biseriata (E.)
Breb.Surirella elegans E.Surirella robusta E.Synedra delicatissima
W.S.Synedra sub:.equalis
Grun.Tabellaria flocculosa
(Roth) K.
The scarcity of members of the genus Pleurosigma in all the samples is noteworthy; for it is a semisaprophytic genus and the unusually high percentage of decaying organic matter in all of the gatherings would presuppose an abundance of Pleurosigma. A possible explanation of this scantiness is that the genus as a whole thrivesbest in temperate and subtropical waters.
LITERATURE CITEDBLACK, C. S.
1929. Chemical analyses of lake deposits. Transactions, Wisconsin Academy of Sciel.).ces,Arts and Letters, vol. 24, pp. 127-133. Madison.
GILBEHT, CHAHLES H., and WILLIS H. RICH.1927. Investigations concerning .red-salmon runs to the Karluk River, Alaska. Bulletin,
United States Bureau of Fisheries, Vol. XLIII, Part II, 1927 (1929), pp. 1-69,34 figs.Washington.