Limits to Growth: The 30-Year Update Meadows, Randers, Meadows ISBN 1-931498-58-X And Why Systems...
39
Limits to Growth: The 30-Year Update Meadows, Randers, Meadows ISBN 1-931498-58-X And Why Systems Thinking is Imperative in the Field of Sustainability Management
-
Upload
philomena-dean -
Category
Documents
-
view
218 -
download
3
Transcript of Limits to Growth: The 30-Year Update Meadows, Randers, Meadows ISBN 1-931498-58-X And Why Systems...

Limits to Growth: The 30-Year UpdateMeadows, Randers, Meadows
ISBN 1-931498-58-X
And Why Systems Thinking is Imperative in the Field of Sustainability Management

BackgroundClub of Rome formed in 1968, by
Aurelio Peccei – founder of Alitalia Addressed
◦Poverty, war, pollution, crime, oppression, resource depletion, terrorism, economic instability, racism
1970 - invited Jay Forrester, MIT, to find interrelated world’s problems
1975 --Created World Model computer simulation showed world collapse based on System Thinking premises

BackgroundDonella and Dennis Meadows
joined the team in 1971 to create models based on:◦Population◦Industry◦Agriculture◦Natural resources◦Environment
Created the World 2 model key interconnectedness of socioeconomic systems

FindingsCarrying capacity of the planet
cannot sustain population and capital growth
“The only option is to choose our limits or nature will choose them for us”
“Exponential growth. What the world sees as solutions to problems is in fact a root cause of the problem” – J. Forrester
Called before US Congress to explain its model. Original text read by all global heads of state

Overshoot Defined = Overshoot is to go too
far or beyond limits accidentally 3 Causes
1. Growth, acceleration, rapid change2. Limits or barriers3. Delay in perception - and response
- to keep system within its limits

System DynamicsPopulation GrowthMaterial economyIn relation to Exceeding capacity of the
planet’s natural resourcesThere’s a disconnect: Pricing and
capital cannot be sustained to continue to reap natural resources

Predictable Outcomes?
1. “Crash” – Depleted Resources, Difficult Extraction of Resources, Too Expensive
2. A deliberate correction = a sustainable future

Methodologies used for LTG1. Standard scientific and
economic theories on global systems
2. Data on natural resources3. Computer models to project
implications4. Worldview – attitudes, beliefs,
values

What is a System?System Thinking – ForresterA system is the interconnected
set of elements that is coherently organized in a way that achieves something
1. Elements2. Interconnections3. Purpose

One Purpose = Interrelated Parts“Multiple Embedded Purposes”
PerhapsA University’s purpose is to
discover and preserve knowledgeThe purpose of the student is to
gain knowledge and obtain good grades
The purpose of the professors is to provide learning and research support
The purpose of the administration is to operate in a balanced budget

The ElementsElements change as part of living
system:◦Students graduate◦Professors retire◦Administrators turnover◦But the purpose remains the same
The system remains the sameYet if interconnections change,
the system does: ex. If students grade professors, decisions may be made through manipulation or coercion

Throughput/Stocks/SinksEvery system:
INFLOWSTOCK
OUTLFOW
RAINRIVER INFLOW
RESERVOIR EVAPORATIONDISCHARGE

Important PrinciplesEvery system:
1. Stocks Rise as Inflows Exceed Outflow
2. Stocks Fall as Outflows Exceed Inflow3. Dynamic Equilibrium if Inflow =
Outflow
INFLOWSTOCK
OUTLFOW

Systems ThinkingComprises Feedback LoopsChanges to the stock are caused
by flows to the same stockReinforcing feedback loops =
exponential growth or runaway decay

What Does It Look Like?Perhaps, a population imbalance
BIRTHSPOPULATION
DEATHS
FERTILITY MORTALITY
R (-)B (+)

Dynamics of Growth - Finite World
World3 Model◦Tracks stocks and flows – MEASURES,
ACTSStocks = population, industrial
capital, pollution, cultivated landThroughput flows – birth and
death rates, investment and depreciation, rates pollution generated and assimilated, land erosion and development, land removed for urban or industrial use rate

Limits to ThroughputEnergy and materials needed to
keep people, cars, houses, and factories functioning:
Sources and sinksWhat is driving the factors?
Sources Materials & Fuels Use
Waste in the Environment
Resource Use Rate
Emissions rate

Limits: A Human Choice: Linear
Economic Sources
• Extraction / Production - sources
• Material Economy
Society
Environment
• Consumption• Waste streams and
pollutants
Sinks:
Can’t be absorbed
• Waste• Toxins to air, water, land,
landfills

Chapter 2: Exponential GrowthPhysical growth on a finite planet
must eventually end. The World3 Model aims to define
exponential growth based on a system of human population and economic growth
Models time and interconnectionsOvershoot is caused by growth,
acceleration, rapid change

World3 Model - SimulationsKey features1. Growth process2. Limits3. Delays4. Erosion process
5. Reinforcing + and – balancing feedback loops or causal loops
6. Contributing and counteracting

World3Forecasts time to change based
on variable feedback loops
Developed to:◦ understand how the future can look◦ assess behavior patterns◦ and how the humans will interact
with the carrying capacity of the planet

What is Exponential Growth?Process of doubling, quadrupling,
etc. Linear growth increases at a
constant rate
Exponential growth can “sneak up on you” or become a surprise
Savings vs. putting money in jar◦Jar = linear. What you put in is what
you have.◦Account = compounded interest
earned

Drivers
For human society the drivers are:1. Population Growth2. Productive Capital Drive food production, resource
use, energy production, and pollution
Profound changes in consumption behavior can influence efficient use of resources – think “marketing” here

I. World Population – 7.1 BThe gap between birth and death rates
determines the rate at which population grows. 1 Billion ~ 12 years◦Rapid exponential growth in world
population will increase from 7B to 9.3B by 2050 (US Bureau of Census) Sub-Saharan Africa – double population in 10 yrs Northern India – expected to be 1.6B in 2050 Europe: average birth rate 1.2 per family USA – average birth rate 2 per family Japan – decline 1:3 will be elderly for next 30 yrs

Additions to World PopulationYear Population
(millions)Growth Rate People
Added (millions)
1970 3,690 1.93 71
1980 4,430 1.70 75
1990 5,250 1.49 78
2000 6,060 1.23 75
Growth rate is declining due to fewer deaths and increased births. (Difference between Birth and Mortality rate)
Thus, population continues to increase at a rate in countries that cannot sustain productive capital.

People, Poverty, More PeopleWhat have you experienced
regarding the gap between the rich and the poor?
Population growth slows economic growth and keeps people in conditions of poverty
Produce more food for more people results in destruction of arable land

Let’s BrainstormHow can we slow population
growth humanely?
Sources and SinksIncrease in energy and capital
needed to sustain growing population vs exhaustion of materials
2 main categories to sustain economic and population growth1. Physical needs - biological and
industrial2. Social needs: stability, peace,
security, long-term decision makers, education, innovation
STUDY Page 49 to learn to evaluate system sources and sinks
II. Productive Capital = OvershootHumans using materials and
producing wastes at rates that are not sustainable
Human burden on natural environment already in overshoot
True costs of material are increasing

Ecological Economist: Herman Daly
3 Rules to Define Sustainable Limits to material and energy throughput….1. Renewable resources = not depleted
faster than replenishment rate allows2. Nonrenewable resource = usage
doesn’t exceed renewable substitute or profits put back into renewable
3. Pollutants = rate of emissions not greater than can be absorbed, recycled, filtered

Let’s DiscussWhat is your understanding of
how humans are using critical resources at an unsustainable rate? What are some examples?
How will you recognize the peak?
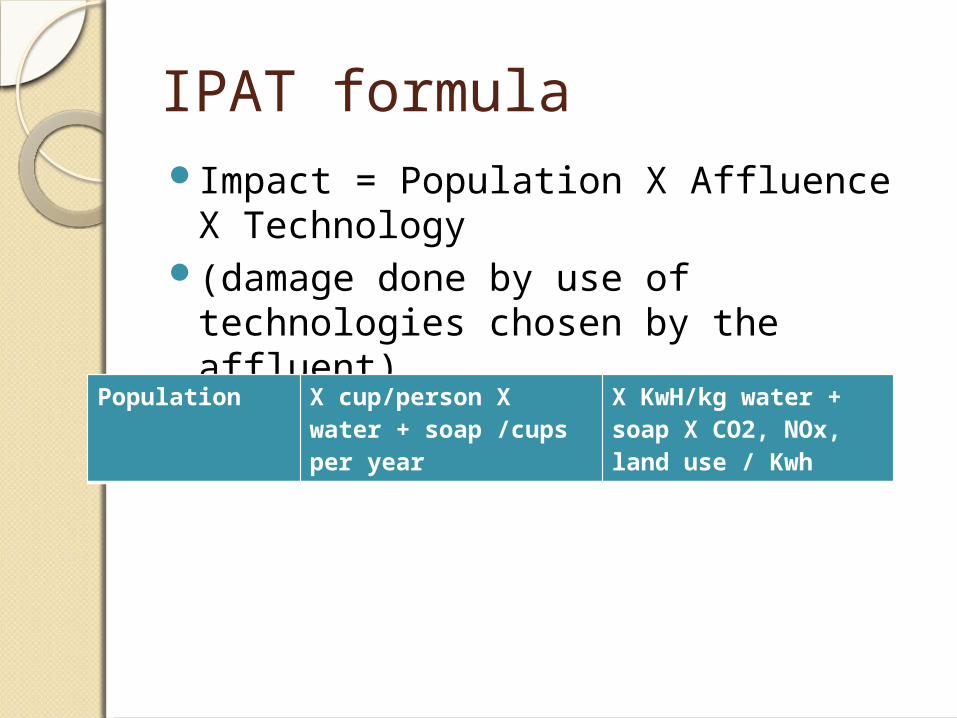
IPAT formulaImpact = Population X Affluence X
Technology(damage done by use of technologies
chosen by the affluent)
Population X cup/person X water + soap /cups per year
X KwH/kg water + soap X CO2, NOx, land use / Kwh

Scenarios
1. Primary goal is never-ending growth
2. Population will stop growing when rich
3. Economy stops growing when we run into limits

Our Task Force Teams in class will look at such topics asRenewable Sources
◦Food, Land, Soil◦Water◦Forests◦Ecosystems (species and extinction)
Nonrenewable Sources◦Fossil fuels, natural gas, hydrogen
liquid◦Nuclear energy, renewable energy
sources◦Materials extraction

Societal Approaches & Potential Outcomes
1. Grow without interruption2. Level off within capacity (?)3. Overshoot carrying capacity
without doing permanent damage
4. Overshoot with severe damage to resources (Outcome of this?)
Forces population and economy to decline to right size
Which stage do you think the USA is in?

We are already beyond the carrying capacity of planet
The models project collapse

Communicating Complex Info“The systems limits are not only
finite, but erodible when overstressed/used”
“Rising population gives signals of stress that are often ignored or action is delayed”
“There are physical limits to sources of materials and energy that sustain the economy and population”

What can we do?Growth in capital and population
must be slowedDematerialization, lifestyle
changes, energy sources for both rich and poor
Sources and sinks conserved and restored
Society must derive long-term solutions
Prevent and restore erosion

Steps to Problem SolvingDraw the current state value chainIdentify sources and sinksIdentify problems and long term
ramifications currently occurringDraw the current system feedback
loops based on the problems identified
Identify how to bring the system back to equilibrium
Draw the balancing loopsDraw unintended consequences of
balancing the system – i.e. who loses?