Limit analysis solutions for the bearing capacity of rock ... · International Journal of Rock...
18
International Journal of Rock Mechanics & Mining Sciences 43 (2006) 920–937 Limit analysis solutions for the bearing capacity of rock masses using the generalised Hoek–Brown criterion R.S. Merifield a, , A.V. Lyamin b , S.W. Sloan b a Department of Agricultural, Civil and Environmental Engineering, University of Southern Queensland, QLD 4350, Australia b Department of Civil, Surveying and Environmental Engineering, The University of Newcastle, NSW 2308, Australia Accepted 3 February 2006 Available online 31 March 2006 Abstract This paper applies numerical limit analyses to evaluate the ultimate bearing capacity of a surface footing resting on a rock mass whose strength can be described by the generalised Hoek–Brown failure criterion [Hoek E, Carranza-Torres C, Corkum B. Hoek–Brown failure criterion—2002 edition. In: Proceedings of the North American rock mechanics society meeting in Toronto, 2002]. This criterion is applicable to intact rock or heavily jointed rock masses that can be considered homogeneous and isotropic. Rigorous bounds on the ultimate bearing capacity are obtained by employing finite elements in conjunction with the upper and lower bound limit theorems of classical plasticity. Results from the limit theorems are found to bracket the true collapse load to within approximately 2%, and have been presented in the form of bearing capacity factors for a range of material properties. Where possible, a comparison is made between existing numerical analyses, empirical and semi-empirical solutions. r 2006 Elsevier Ltd. All rights reserved. Keywords: Bearing capacity; Rock; Failure; Footings/foundations; Numerical modelling 1. Introduction The ultimate bearing capacity is an important design consideration for dams, roads, bridges and other engineer- ing structures, particularly when large rock masses are the foundation materials. With the exception of some very soft rocks and heavily jointed media, the majority of rock masses provide an excellent foundation material. However, there is a need to accurately estimate the ultimate bearing capacity for structures with high foundation loads such as tall buildings and dams. Rigorous theoretical solutions to the problem of foundations resting on rock masses do not appear to exist in the literature. This may be attributed to the fact that rock masses are inhomogeneous, discontinuous media composed of rock material and naturally occurring discontinuities such as joints, fractures and bedding planes. This makes the derivation of simple theoretical solutions based on limit equilibrium methods very difficult. In addition, fractures and discontinuities occurring naturally in rock masses are difficult to model using the displacement finite element method without the addition of special interface or joint elements. The upper and lower bound formulations of Lyamin and Sloan [1,2] are ideally suited to analysing jointed or fissured materials due to the existence of discontinuities throughout the mesh. These discontinuities allow an abrupt change in stresses in the lower bound formulation and in velocities in the upper bound formulation. Moreover, employing discontinuities when modelling geotechnical problems enables great flexibility as they can be assigned different material properties and/or yield criteria. This unique feature was recently exploited by Sutcliffe et al. [3] and Zheng et al. [4] who used the formulations of Sloan [5] and Sloan and Kleeman [6] to analyse the bearing capacity of jointed rock and fissured materials respectively. The purpose of this paper is to take advantage of the ability of the limit theorems to bracket the actual collapse load by computing both lower and upper bounds for the ARTICLE IN PRESS www.elsevier.com/locate/ijrmms 1365-1609/$ - see front matter r 2006 Elsevier Ltd. All rights reserved. doi:10.1016/j.ijrmms.2006.02.001 Corresponding author. Tel.: +61 746 311 325; fax: +61 746 312 526. E-mail addresses: richard.merifi[email protected] (R.S. Merifield), [email protected] (A.V. Lyamin), [email protected] (S.W. Sloan).
Transcript of Limit analysis solutions for the bearing capacity of rock ... · International Journal of Rock...

ARTICLE IN PRESS
1365-1609/$ - se
doi:10.1016/j.ijr
�CorrespondE-mail addr
andrei.lyamin@
scott.sloan@ne
International Journal of Rock Mechanics & Mining Sciences 43 (2006) 920–937
www.elsevier.com/locate/ijrmms
Limit analysis solutions for the bearing capacity of rock masses usingthe generalised Hoek–Brown criterion
R.S. Merifielda,�, A.V. Lyaminb, S.W. Sloanb
aDepartment of Agricultural, Civil and Environmental Engineering, University of Southern Queensland, QLD 4350, AustraliabDepartment of Civil, Surveying and Environmental Engineering, The University of Newcastle, NSW 2308, Australia
Accepted 3 February 2006
Available online 31 March 2006
Abstract
This paper applies numerical limit analyses to evaluate the ultimate bearing capacity of a surface footing resting on a rock mass whose
strength can be described by the generalised Hoek–Brown failure criterion [Hoek E, Carranza-Torres C, Corkum B. Hoek–Brown failure
criterion—2002 edition. In: Proceedings of the North American rock mechanics society meeting in Toronto, 2002]. This criterion is
applicable to intact rock or heavily jointed rock masses that can be considered homogeneous and isotropic. Rigorous bounds on the
ultimate bearing capacity are obtained by employing finite elements in conjunction with the upper and lower bound limit theorems of
classical plasticity. Results from the limit theorems are found to bracket the true collapse load to within approximately 2%, and have
been presented in the form of bearing capacity factors for a range of material properties. Where possible, a comparison is made between
existing numerical analyses, empirical and semi-empirical solutions.
r 2006 Elsevier Ltd. All rights reserved.
Keywords: Bearing capacity; Rock; Failure; Footings/foundations; Numerical modelling
1. Introduction
The ultimate bearing capacity is an important designconsideration for dams, roads, bridges and other engineer-ing structures, particularly when large rock masses are thefoundation materials. With the exception of some very softrocks and heavily jointed media, the majority of rockmasses provide an excellent foundation material. However,there is a need to accurately estimate the ultimate bearingcapacity for structures with high foundation loads such astall buildings and dams.
Rigorous theoretical solutions to the problem offoundations resting on rock masses do not appear to existin the literature. This may be attributed to the fact thatrock masses are inhomogeneous, discontinuous mediacomposed of rock material and naturally occurringdiscontinuities such as joints, fractures and bedding planes.
e front matter r 2006 Elsevier Ltd. All rights reserved.
mms.2006.02.001
ing author. Tel.: +61746 311 325; fax: +61 746 312 526.
esses: [email protected] (R.S. Merifield),
newcastle.edu.au (A.V. Lyamin),
wcastle.edu.au (S.W. Sloan).
This makes the derivation of simple theoretical solutionsbased on limit equilibrium methods very difficult. Inaddition, fractures and discontinuities occurring naturallyin rock masses are difficult to model using the displacementfinite element method without the addition of specialinterface or joint elements. The upper and lower boundformulations of Lyamin and Sloan [1,2] are ideally suitedto analysing jointed or fissured materials due to theexistence of discontinuities throughout the mesh. Thesediscontinuities allow an abrupt change in stresses in thelower bound formulation and in velocities in the upperbound formulation. Moreover, employing discontinuitieswhen modelling geotechnical problems enables greatflexibility as they can be assigned different materialproperties and/or yield criteria. This unique feature wasrecently exploited by Sutcliffe et al. [3] and Zheng et al. [4]who used the formulations of Sloan [5] and Sloan andKleeman [6] to analyse the bearing capacity of jointed rockand fissured materials respectively.The purpose of this paper is to take advantage of the
ability of the limit theorems to bracket the actual collapseload by computing both lower and upper bounds for the

ARTICLE IN PRESSR.S. Merifield et al. / International Journal of Rock Mechanics & Mining Sciences 43 (2006) 920–937 921
bearing capacity of strip footings on a broken rock mass.These solutions are obtained using the numerical techni-ques developed by Lyamin and Sloan [1,2] which have beenmodified to incorporate the well-known Hoek–Brown yieldcriterion [7]. The applicability and background of theHoek–Brown criterion will be discussed in the followingsection in more detail.
2. The generalised Hoek–Brown failure criterion
2.1. Applicability
It is well known that the strength of jointed rock massesis notoriously difficult to assess. The behaviour of a rockmass is complicated greatly because deformations andsliding along naturally occurring discontinuities can occurin addition to deformations and failure in the intact parts(blocks) of the rock mass. Unfortunately, laboratory testson specific core samples is often not representative of arock mass at field scale, while in situ strength testing of therock mass is seldom practically or economically feasible.Nonetheless, engineers and geologists are required topredict the strength of large-scale rock masses whendesigning such things as drifts, foundations, slopes, tunnelsand caverns.
Many criteria have been developed that seek to capturethe important elements of measured rock strength or seekto modify theoretical approaches to accommodate experi-mental evidence. One currently accepted approach toestimating rock mass strength is to use the Hoek–Brownfailure criterion where the required parameters areestimated with the help of a rock mass classificationsystem. The Hoek–Brown failure criterion is an empiricalcriterion developed through curve-fitting of triaxial testdata. It was originally developed in the 1980s [8] for intactrock and jointed rock masses, and has been subject tocontinual refinement [7]. The Hoek–Brown criterion is oneof the few non-linear criteria used by practising engineers[9] to estimate rock mass strength. It is thereforeappropriate to use this yield criterion when predicting thebearing capacity of surface foundations on rock.
It is important to note that the Hoek–Brown failurecriterion, which assumes isotropic rock and rock massbehaviour, should only be applied to those rock masses inwhich there are a sufficient number of closely spaceddiscontinuities, with similar surface characteristics, thatisotropic behaviour involving failure on discontinuities canbe assumed. When the structure being analysed is large andthe block size small in comparison, the rock mass can betreated as a Hoek–Brown material. Where the block size isof the same order as that of the structure being analysed, orwhen one of the discontinuity sets is significantly weakerthan the others, the Hoek–Brown criterion should not beused. In these cases, the stability of the structure should beanalysed by considering failure mechanisms involving thesliding or rotation of blocks and wedges defined byintersecting structural features.
With reference to the bearing capacity problem con-sidered herein, the applicability of the Hoek–Browncriterion is best described by referring to Fig. 1. AfterHoek [10] it appears three main structural groups can bedifferentiated for rock masses, namely GROUP I, GROUPII, and GROUP III. Fig. 1 shows the transition from anisotropic intact rock (GROUP I), through a highlyanisotropic rock mass (GROUP II), to an isotropic heavilyjointed rock mass (GROUP III), with increasing samplesize for a surface foundation on a hypothetical rock mass.Which of these structural groups will apply in a given casewill depend on the width of the foundation relative to thediscontinuity spacing, and the orientations and strengths ofthe discontinuities. In this paper it has been assumed thatthe underlying rock mass is either: (1) intact or; (2) heavilyjointed with ‘‘small spacing’’ between discontinuities sothat, on the scale of the problem, it can be regarded as anisotropic assembly of interlocking particles. Consequently,the results presented are valid for ‘‘intact rock’’ (GROUPI) and ‘‘several discontinuities’’ and ‘‘jointed rock mass’’(GROUP III) conditions, respectively.The relative concept of ‘‘small spacing’’ as mentioned
above, was proposed by Serrano and Olalla [11] as a meansof quantifying the validity of using the Hoek–Brown failurecriterion for bearing capacity predictions. A new para-meter, the ‘‘spacing ratio of a foundation’’ (SR) wasproposed that depends, among other things, on the widthof the foundation. It is defined by the expression;
SR ¼ BXn
i¼1
1
Smi
¼ BXn
i¼1
li,
where B is the foundation width; Smi is the joint spacing ofthe ith discontinuity family; li is the frequency of the ithdiscontinuity family; and n is the number of discontinuityfamilies. Serrano and Olalla suggest a relatively ‘‘smallspacing’’ is when ðSRÞ is greater than 60. This would implythat there are four families of discontinuities eachappearing 15 times across the foundation width. Thereforethe Hoek–Brown criterion is not valid when SRo60,except when the value of SR is so low that the rock masscan be considered as intact and belonging to theaforementioned GROUP I.It should be noted that, in the case of intact rock
(GROUP I), common sense needs to be exercised whenusing the results presented in this paper since the failure ofthe foundation may be brittle rather than plastic.The effect of scale on the bearing capacity of founda-
tions on rock needs to be considered, particularly when theunderlying assumption is that the rock mass behaves as ahomogeneous isotropic continuous medium. There will bea distinct difference in the ultimate behaviour of ‘‘large’’and ‘‘small’’ foundations. For the case of ‘‘large’’ founda-tions where the load covers an extensive area, a consider-able volume of the rock mass is affected and the stressescaused by gravity on the potential flow surfaces arecomparable to that part of the strength which is due to

ARTICLE IN PRESS
GROUP I GROUP II GROUP III
INTACTROCK
JOINTEDROCKMASS
SINGLEDISCONTINUITY
TWODISCONTINUITIES
SEVERALDISCONTINUITIES
Jointed Rock�ci , GSI, mi , �
Fig. 1. Applicability of the Hoek–Brown yield criterion for shallow foundations.
R.S. Merifield et al. / International Journal of Rock Mechanics & Mining Sciences 43 (2006) 920–937922
the rock cohesion. In this case it seems reasonable toassume that such a problem can be studied using plasticitytheories. However, ‘‘small’’ foundations only influence asmall volume of the rock mass and the stresses caused byself-weight will be negligible when compared to thestrength of the rock. In this case the ultimate behaviourmay be brittle in nature and the theories of plasticity maynot be appropriate. Unfortunately, there is currently noguidance for engineers regarding what constitutes a ‘‘large’’or ‘‘small’’ foundation. As pointed out by Serrano andOlalla [11] more research is required to quantify thisproblem.
2.2. Limit analysis implementation
One of the key features of the Lyamin and Sloan [1,2]formulations is that they can deal with general yield criteriaincluding multi-surface ones where several convex domainsare combined to constrain the stresses at each node of themesh. These combinations can be different for differentparts of the discretised body. Because they are employed intheir native form, a wide range of yield criteria can be usedin the analysis. Each of the surfaces must be convex andsmooth but the resulting composite surface, thoughconvex, is generally non-smooth. An example of a multi-surface yield function is where the conventional (non-
smooth) Tresca criterion is combined with a transitionsurface to round the corners in the octahedral plane.Another example is the use of a simple plane to cut theapex of a cone-like yield surface. This type of cut-off isoften used for modelling materials such as rock, and leadsto a cup-shaped surface.In this section, details of the latest version of the
Hoek–Brown yield criterion [7] and how it has beenincorporated into the limit analysis formulations ofLyamin and Sloan [1,2] are discussed.The Hoek–Brown failure criterion for rock masses was
first described in 1980 [8] and has been subsequentlyupdated in 1983, 1988, 1992, 1995, 1997, 2001 and 2002.A brief history of its development can be found in Hoek[12]. The latest version that is used here can be written as
s01 ¼ s03 þ sci mb
s03s0ci
þ s
� �a
. (1)
The relationships between mb=mi, s and a and thegeological strength index (GSI) are as follows:
mb ¼ mi expGSI � 100
28� 14D
� �, (2)
s ¼ expGSI � 100
9� 3D
� �, (3)

ARTICLE IN PRESSR.S. Merifield et al. / International Journal of Rock Mechanics & Mining Sciences 43 (2006) 920–937 923
a ¼ 12þ 1
6e�GSI=15 � e�20=3� �
. (4)
The GSI was introduced because Bieniawski’s rock massrating (RMR) system [13] and the Q-system [14] were deemedto be unsuitable for poor rock masses. The GSI ranges fromabout 10, for extremely poor rock masses, to 100 for intactrock. The parameter D is a factor that depends on the degreeof disturbance. The suggested value of the disturbance factoris D ¼ 0 for undisturbed in situ rock masses and D ¼ 1 fordisturbed rock mass properties. For the analyses presentedhere, a value of D ¼ 0 has been adopted.
1.0
0.9
0.8
0.7
0.6 = � <��
0.5
0.4
0.3
0.2
0.1
0.0−1.2 −1.0
× 10−3
J 2
− 0.8 − 0.6 − 0.4 −
I1
√
GSI = 10, mi = 1, D = 0, � = 0, � =
Hoek−Brown curveIts smooth approximatio
�ci
= 1
∋
Fig. 2. Meridian plane section of Hoek–Brown
q = �Df
B
Qu = qu B
Jointed Rock �ci , GSI, mi ,�
Fig. 3. Problem
The unconfined compressive strength is obtained bysetting s3 ¼ 0 in Eq. (1), giving
sc ¼ scisa (5)
and the tensile strength is
st ¼ �ssci
mb
. (6)
In a similar manner to the Mohr–Coulomb failureenvelope, the Hoek–Brown yield surface has apex andcorner singularities in stress space. The direct computationof the derivatives at these locations, which are required for
0.2 0.0 0.2 0.4 0.6 0.8
× 10−3
0.0002
n
Hoek−Brown curveIts smooth approximation
�ci
= 0.1
= �� < �∋
yield surface and its smooth approximation.
rigid footing with rough base
potential slip line
Df
∞
definition.

ARTICLE IN PRESSR.S. Merifield et al. / International Journal of Rock Mechanics & Mining Sciences 43 (2006) 920–937924
the non-linear programming (NLP) solver, becomesimpossible. This issue can be resolved using three differentapproaches; namely, global smoothing, local smoothingand multi-surface representation (which includes both apriori and dynamic linearisation). As the current study islimited to the case of plain strain conditions, the cornersare automatically avoided and the only singularity whichneeds to be dealt with is the apex of the yield surface.The easiest options to implement are a simple tension cut-off (which is a multi-surface technique) or a quasi-
ZONE I ZONE II
qu
qu= [s a + (mb s a +
Qu
B
Fig. 4. Lower bound solution for bearing ca
14
12
10
8
6
4
N�
2
00.0001 0.0010 0.0
ζ
Fig. 5. Bearing capacity factor for weigh
hyperbolic approximation (which is a global smoothingtechnique). The authors decided to adopt the laterapproach as a similar method has been previouslyemployed by Abbo and Sloan [15] for smoothing theMohr–Coulomb yield criteria. The prefix ‘‘quasi’’ is usedhere because the Hoek–Brown yield surface is alreadycurved in the meridional plane and the suggested approx-imation is not a pure hyperbolic one. A brief description ofthe procedure is provides as follows (more details can befound in [15]).
ZONE I
0
0
s)a ]�ci
s a�ci s a�ci s a�ci
pacity (after Kulhawy and Carter [20]).
100 0.1000 1.0000
n
tless rock (after Serrano et al. [24]).

ARTICLE IN PRESSR.S. Merifield et al. / International Journal of Rock Mechanics & Mining Sciences 43 (2006) 920–937 925
First, the Hoek–Brown yield function given in Eq. (1) isexpressed in terms of stress invariants as
f HB ¼ffiffiffiffiffiJ2
pgðyÞ þ
ffiffiffiffiffiJ2
phðyÞ þ bI1 þ w
� �a, (7)
where I1 is the first stress invariant, J2 is the seconddeviatoric stress invariant and y is the Lode angle related tothe third deviatoric stress invariant J3, whereas parametersb and w, and functions gðyÞ and hðyÞ are given by thefollowing expressions:
gðyÞ ¼ �2 cosðyÞ, (8)
hðyÞ ¼ �mbsð1�aÞ=aci cosðyÞ þ
sinðyÞffiffiffi3p
� �, (9)
See inset
u = v = 0 (Upper Bound)
� =
0 (
Low
er B
ound
)u
= 0
(U
pper
Bou
nd)
v = −1 downward ve
� = �n = 0 (Lower Bound)
v
u
∫ �n (Lower Boun
Fig. 6. Typical finit
b ¼ mbsð1�aÞ=aci , (10)
w ¼ ss1=aci . (11)
Next, quasi-hyperbolic smoothing is applied by permutingJ2 with a small term � according to
J2 ¼ffiffiffiffiffiffiffiffiffiffiffiffiffiffiffiJ2 þ �2
p, (12)
on condition that � is related to the tensile strength ofmaterial by the rule
� ¼ minðd;mrjrgð0Þ þ ðrhð0Þ þ wÞa ¼ 0Þ. (13)
The constants d and m must be chosen to balance theefficiency of the NLP solver against the accuracy of the
locity (Upper Bound)
d)
e element mesh.

ARTICLE IN PRESSR.S. Merifield et al. / International Journal of Rock Mechanics & Mining Sciences 43 (2006) 920–937926
representation of the original yield surface. The values usedin the current study are d ¼ 10�6 and m ¼ 10�1.
The resulting approximation of the Hoek–Brown yieldcriterion can be written as
f HB ¼ J2gðyÞ þ J2hðyÞ þ bI1 þ w� �a
(14)
and is now a smooth and convex function in the meridionalplane. An illustration of the original and smoothedHoek–Brown curves in the ðI1;
ffiffiffiffiffiJ2
pÞ plane for zero y is
given in Fig. 2. It should be noted that the differencebetween the smooth approximation and the original yieldsurface has been greatly exaggerated in this figure byselecting values of m and r that are much larger than whatwas actually adopted. The original and smoothed yieldsurfaces are almost indistinguishable when the actualvalues of m and r are used.
2.3. Equivalent Mohr–Coulomb parameters
Since many geotechnical analysis methods still use theMohr–Coulomb failure criterion, it is sometimes necessaryfor practising engineers to determine equivalent angles offriction and cohesive strengths for each rock mass andstress range. In the context of this paper, estimating theseequivalent parameters will enable a direct comparison to be
Table 1
Values of the bearing capacity factor for a weightless rock
GSI mi Ns0 Average Ns0 Kulhawy and
Carter [20]
Ns0 Serrano et al.
[24]
G
10 1 0.015 0:009 ð�40%Þ 0:010 ð�35%Þ10 5 0.042 0:016 ð�61%Þ 0:035 ð�17%Þ10 10 0.077 0:022 ð�71%Þ 0:072 ð�7%Þ10 20 0.156 0:032 ð�80%Þ 0:159 ðþ2%Þ10 30 0.238 0:039 ð�83%Þ 0:259 ðþ9%Þ10 35 0.288 0:043 ð�85%Þ 0:314 ðþ9%Þ20 1 0.044 0:026 ð�41%Þ 0:036 ð�16%Þ20 5 0.119 0:046 ð�61%Þ 0:111 ð�6%Þ20 10 0.209 0:062 ð�70%Þ 0:204 ð�2%Þ20 20 0.389 0:086 ð�78%Þ 0:397 ðþ2%Þ20 30 0.575 0:106 ð�82%Þ 0:600 ðþ4%Þ20 35 0.670 0:114 ð�83%Þ 0:704 ðþ5%Þ30 1 0.092 0:054 ð�41%Þ 0:084 ð�8%Þ30 5 0.235 0:095 ð�60%Þ 0:227 ð�3%Þ30 10 0.397 0:127 ð�68%Þ 0:393 ð�1%Þ30 20 0.713 0:174 ð�76%Þ 0:716 ð0%Þ30 30 1.022 0:210 ð�79%Þ 1:038 ðþ2%Þ30 35 1.193 0:226 ð�81%Þ 1:200 ðþ1%Þ40 1 0.165 0:101 ð�39%Þ 0:158 ð�4%Þ40 5 0.401 0:171 ð�57%Þ 0:393 ð�2%Þ40 10 0.659 0:226 ð�66%Þ 0:654 ð�1%Þ40 20 1.149 0:306 ð�73%Þ 1:147 ð0%Þ40 30 1.630 0:368 ð�77%Þ 1:626 ð0%Þ40 35 1.873 0:395 ð�79%Þ 1:863 ð�1%Þ50 1 0.281 0:176 ð�37%Þ 0:274 ð�3%Þ 1
50 5 0.644 0:290 ð�55%Þ 0:638 ð�1%Þ 1
50 10 1.037 0:380 ð�63%Þ 1:031 ð�1%Þ 1
50 20 1.765 0:510 ð�71%Þ 1:760 ð0%Þ 1
50 30 2.467 0:610 ð�75%Þ 2:458 ð0%Þ 1
50 35 2.817 0:654 ð�77%Þ 2:801 ð�1%Þ 1
made between Hoek–Brown solutions and equivalentMohr–Coulomb solutions.The choice of method to use for determining equivalent
cohesion and friction angle is largely a matter of taste andexperience. An equivalent cohesion and friction angle at aspecified normal stress or minor principal stress, asdetermined by an elastic analysis, may give locally accuratevalues for a small stress variation. Alternatively, averagevalues applicable to a wider range of stress conditions may beobtained by using a regression procedure. However, this maylead to an underestimate of the strength for low stresses andan overestimate for high stresses. Nonetheless, a regressionapproach appears to be the most widely accepted methodand is typically performed by fitting a linear relationship tothe curve generated by Eq. (1) for a range of minor principalstress values defined by stos3os03max. This has beenperformed recently by Hoek et al. [7] where the fittingprocess involves balancing the areas above and below theMohr–Coulomb relation. This results in the followingequations for the angle of friction and cohesive strength:
c0 ¼sci½ð1þ 2aÞsþ ð1� aÞmbs03n�ðsþmbs03nÞ
a�1
ð1þ aÞð2þ aÞffiffiffiffiffiffiffiffiffiffiffiffiffiffiffiffiffiffiffiffiffiffiffiffiffiffiffiffiffiffiffiffiffiffiffiffiffiffiffiffiffiffiffiffiffiffiffiffiffiffiffiffiffiffiffiffiffiffiffiffiffiffiffiffiffiffiffiffiffiffiffiffiffiffiffiffiffiffiffiffiffiffi1þ ð6ambðsþmbs03nÞ
a�1Þ=ð1þ aÞð2þ aÞ
q ,
(15)
SI mi Ns0 Average Ns0 Kulhawy and
Carter [20]
Ns0 Serrano et al.
[24]
60 1 0.465 0:299 ð�36%Þ 0:458 ð�1%Þ60 5 1.013 0:479 ð�53%Þ 1:006 ð�1%Þ60 10 1.597 0:623 ð�61%Þ 1:588 ð�1%Þ60 20 2.667 0:830 ð�69%Þ 2:658 ð0%Þ60 30 3.644 0:990 ð�73%Þ 3:673 ðþ1%Þ60 35 4.186 1:060 ð�75%Þ 4:170 ð0%Þ70 1 0.765 0:503 ð�34%Þ 0:759 ð�1%Þ70 5 1.582 0:785 ð�50%Þ 1:574 ð�1%Þ70 10 2.444 1:012 ð�59%Þ 2:434 ð0%Þ70 20 4.012 1:339 ð�67%Þ 3:998 ð0%Þ70 30 5.491 1:592 ð�71%Þ 5:470 ð0%Þ70 35 6.068 1:703 ð�72%Þ 6:187 ðþ2%Þ80 1 1.260 0:847 ð�33%Þ 1:254 ð�1%Þ80 5 2.473 1:284 ð�48%Þ 2:463 ð0%Þ80 10 3.745 1:640 ð�56%Þ 3:732 ð0%Þ80 20 6.040 2:154 ð�64%Þ 6:019 ð0%Þ80 30 8.195 2:553 ð�69%Þ 8:171 ð0%Þ80 35 9.242 2:727 ð�70%Þ 9:210 ð0%Þ90 1 2.083 1:428 ð�31%Þ 2:076 ð0%Þ90 5 3.881 2:102 ð�46%Þ 3:869 ð0%Þ90 10 5.758 2:658 ð�54%Þ 5:741 ð0%Þ90 20 9.125 3:466 ð�62%Þ 9:100 ð0%Þ90 30 12.270 4:092 ð�67%Þ 12:237 ð0%Þ90 35 13.794 4:367 ð�68%Þ 13:738 ð0%Þ00 1 3.461 2:414 ð�30%Þ 3:449 ð0%Þ00 5 6.124 3:449 ð�44%Þ 6:114 ð0%Þ00 10 8.896 4:317 ð�51%Þ 8:875 ð0%Þ00 20 13.847 5:583 ð�60%Þ 13:809 ð0%Þ00 30 18.444 6:568 ð�64%Þ 18:390 ð0%Þ00 35 20.668 7:000 ð�66%Þ 20:628 ð0%Þ
ARTICLE IN PRESSR.S. Merifield et al. / International Journal of Rock Mechanics & Mining Sciences 43 (2006) 920–937 927
f0 ¼ sin�16ambðsþmbs03nÞ
a�1
2ð1þ aÞð2þ aÞ þ 6ambðsþmbs03nÞa�1
" #, (16)
where s3n ¼ s03max=sci.Note that the value of s03max, the upper limit of confining
stress over which the relationship between the Hoek–Brownand the Mohr–Coulomb criteria is considered, has to bedetermined for each individual case. Of course it is likelythat the stresses will vary greatly throughout the rock masswhich will make it difficult to select a representative value ofs03max. As far as the authors are aware, there are notheoretically correct methods for choosing this range and atrial and error method, based upon practical compromise, is
2.8
2.4
2.0
1.6
N�o
N�o
1.2
0.8
0.4
22
20
18
16
14
12
10
8
6
4
2
0
0.00 5 10 15
mi
0 5 10 15m
i
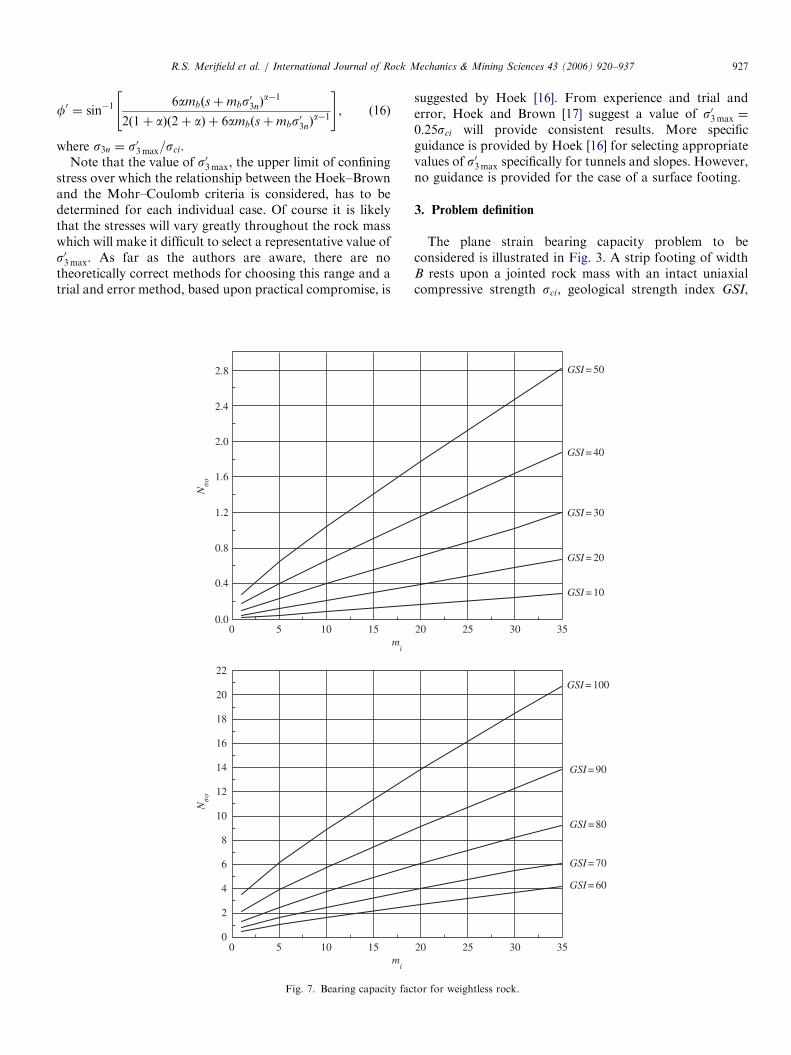
Fig. 7. Bearing capacity fac
suggested by Hoek [16]. From experience and trial anderror, Hoek and Brown [17] suggest a value of s03max ¼
0:25sci will provide consistent results. More specificguidance is provided by Hoek [16] for selecting appropriatevalues of s03max specifically for tunnels and slopes. However,no guidance is provided for the case of a surface footing.
3. Problem definition
The plane strain bearing capacity problem to beconsidered is illustrated in Fig. 3. A strip footing of widthB rests upon a jointed rock mass with an intact uniaxialcompressive strength sci, geological strength index GSI,
20 25 30
GSI = 50
GSI = 40
GSI = 30
GSI = 100
GSI = 90
GSI = 80
GSI = 70
GSI = 60
GSI = 20
GSI = 10
35
20 25 30 35
tor for weightless rock.

ARTICLE IN PRESSR.S. Merifield et al. / International Journal of Rock Mechanics & Mining Sciences 43 (2006) 920–937928
rock mass unit weight g, and intact rock yield parametermi. The ultimate capacity can be written as
qu ¼ sciNs, (17)
where Ns is defined as the bearing capacity factor. For aweightless rock mass ðg ¼ 0Þ, the above expression is validbut the bearing capacity factor Ns is replaced with Ns0.The form of Eq. (17) is a convenient way of expressing theultimate bearing capacity as a ‘‘fraction’’ of the uniaxialcompressive strength and is historically consistent withprevious bearing capacity representations.
mi = 1
mi = 1
mi = 5
mi = 10
mi = 10
mi = 30
GSI = 20
Fig. 8. Upper bound velocity fields an
In the following, the ultimate bearing capacity will beestimated for a practical range of GSI, g and mi values.
4. Previous studies
A review of the literature reveals that very few thoroughnumerical analyses have been performed to determine theultimate bearing capacity of shallow foundations on rock.Of the numerical studies that have been presented, few canbe considered as rigorous. The ultimate tip bearingcapacity of pile foundations, on the other hand, has
GSI = 50
d plastic zones for weightless rock.

ARTICLE IN PRESSR.S. Merifield et al. / International Journal of Rock Mechanics & Mining Sciences 43 (2006) 920–937 929
received much more attention and is discussed by Serranoand Olalla [11,18].
Carter and Kulhawy [19] and Kulhawy and Carter [20]proposed a simple lower bound solution for the bearingcapacity of a weightless rock mass obeying a non-linearHoek–Brown yield criterion. The details of the lowerbound stress field are shown in Fig. 4. A lower bound tothe failure load qu is calculated by finding a stress field thatsatisfies both equilibrium and the failure criterion. Therock mass beneath the strip footing is divided into twozones as shown. The vertical stress s3 in zone I is assumedto be zero (weightless), while the horizontal stress ðs1Þ isequal to the unconfined compressive strength of the rockmass, as given by Eq. (5). For equilibrium, continuity of
0.9
0.8
0.7
0.6
0.5
N�
N�
0.4
0.3
0.2
0.1
0.0
1.4
1.2
1.0
0.8
0.6
0.4
0.2
0.0
5 10 15 20
mi
5 10 15 20
mi
(a)
(b)
Fig. 9. Average finite element limit analysis v
the normal stress across the discontinuity between thezones must be maintained. The bearing capacity of the stripfooting may thus be evaluated from Eq. (1) (withs3 ¼ sasci) as
qu ¼ ½sa þ ðmbsa þ sÞa�sci, (18)
which to be consistent with Eq. (17) can be written as
qu ¼ Ns0sci,
where
Ns0 ¼ ½sa þ ðmbsa þ sÞa� (19)
is the bearing capacity factor for a weightless rock mass asdefined previously.
25 30 35
250
500
10002000500010000
250
500
10002000500010000
40
25 30 35 40
GSI = 10
GSI = 20
�ci
�B= 125
�ci
�B= 125
∞ = weightless
∞ = weightless
alues of the bearing capacity factor Ns.

ARTICLE IN PRESSR.S. Merifield et al. / International Journal of Rock Mechanics & Mining Sciences 43 (2006) 920–937930
Eq. (18), along with the categories of rock type and rockmass condition presented by Hoek [10], have been used toproduce guidelines for estimating the bearing capacity ofrock masses [21].
Serrano and Olalla [22,23] and Serrano et al. [24]proposed a method for estimating the ultimatebearing capacity for a strip footing on a weightless rockmass with or without a surface surcharge. The methodis based upon the slip-line method developed by Soko-lovskii [25].
The ultimate bearing capacity qu, as proposed bySerrano et al. [24] using the Hoek–Brown criterionpresented by Hoek et al. [26], is expressed as
qu ¼ Ph ¼ bnðNb � znÞ, (20)
2.0
1.8
1.6
1.4
1.2
1.0
0.8
0.6
0.4
0.2
0.0
2.8
2.4
2.0
1.6
1.2
0.8
0.4
0.0
5 10 15 20 2mi
5 10 15 20 2mi
N�
N�
(a)
(b)
Fig. 10. Average finite element limit analysis
where zn and bn are constants for the rock mass and dependon mb, a, s and sci according to
An ¼mbð1� aÞ
21=a
� �a=ð1�aÞ
; bn ¼ Ansci; zn ¼s
mbAn
.
zn is referred to as the ‘‘rock mass toughness’’ while bn isreferred to as the ‘‘strength modulus’’ [27,28]. Nb is afunction of the normalised external load on the boundaryadjacent to the footing. If there is no surface surcharge onthis boundary, then Nb can be determined using themethod outlined by Serrano and Olalla [22] and is showngraphically in Fig. 5. Note that this figure has beenproduced using the most recent version of the Hoek–Brown yield criterion, and not the earlier version [26] usedin the paper by Serrano et al. [24].
5 30 35 40
5 30 35 40
GSI = 30
GSI = 40
�ci
�B= 125
�ci
�B= 10000
�ci
�B= 10000
�ci
�B= 125
∞ = weightless
∞ = weightless
values of the bearing capacity factor Ns.

ARTICLE IN PRESSR.S. Merifield et al. / International Journal of Rock Mechanics & Mining Sciences 43 (2006) 920–937 931
More recently, Xiaoli et al. [29] formulated an analyticallower bound for the bearing capacity of a strip footingresting on a Hoek–Brown material. Very few results,however, were presented.
5. Results and discussion
The computed upper and lower bound estimates of thebearing capacity factor Ns for both the weightless andponderable rock analyses were found to be within 5% ofeach other. This indicates that, for practical designpurposes, the true collapse load has been bracketed towithin �2:5% or better. As a consequence, average valuesof the upper and lower bound bearing capacity factor havebeen calculated and will be used in the followingdiscussions.
Typical upper and lower bound meshes for the problem,along with the applied stress and velocity boundary
4.0
3.5
2.5
3.0
2.0
1.5
1.0
0.5
0.0
6
5
4
3
2
1
0
5 10 15 20 2mi
5 10 15 20 2mi
N�
N�
(a)
(b)
Fig. 11. Average finite element limit analysis
conditions, are shown in Fig. 6. The results presented arefor the case of a perfectly rough rigid footing. For thelower bound, this boundary condition is achieved byassuming the individual normal stresses at element nodeson the soil/footing interface are unrestricted in magnitude.In the upper bound case, a uniform velocity is prescribedfor all the nodes along the footing. The overall upperbound and lower bound mesh dimensions were selectedsuch that they adequately contained all plastic zones.
5.1. Weightless rock masses
For the weightless rock case the bearing capacity factorhas been defined as Ns0. The average upper and lowerbound estimates of Ns0 are summarised in Table 1 andFig. 7 for a range of GSI and mi values. As expected, for agiven GSI, increasing mi leads to an increase in the ultimate
5 30 35 40
5 30 35 40
GSI = 50
GSI = 60
�ci
�B= 125
�ci
�B= 10000
�ci
�B= 125
�ci
�B= 10000
∞ = weightless
∞ = weightless
values of the bearing capacity factor Ns.

ARTICLE IN PRESSR.S. Merifield et al. / International Journal of Rock Mechanics & Mining Sciences 43 (2006) 920–937932
bearing capacity. Fig. 7 indicates that Ns0 increases non-linearly with mi and GSI.
Fig. 8 presents several of the observed upper boundvelocity fields and plastic zones. For a given GSI, as mi
increases, so does the extent of the observed velocity fieldand zone of plastic yielding. This is expected as an increasein mi will, in essence, increase the strength of the rock andthe equivalent Mohr–Coulomb parameters. Interestinglythe same effect is not observed when, for a given mi, anincrease in GSI leads to a reduction in the extent of boththe velocity field and zone of plastic shearing.
5.2. Rock masses with unit weight
The effect of rock weight and rock strength has beenincorporated in the analyses using the non-dimensional
12
10
24
20
16
12
8
4
0
8
6
4
2
05 10 15 20 2
mi
5 10 15 20 2
mi
N�
N�
(a)
(b)
Fig. 12. Average finite element limit analysis
factor sci=gB which varies between 125 and 10 000. Thisrange will cover most problems of practical interest.The average upper and lower bound estimates of the
bearing capacity factor Ns are summarised in Figs. 9–12for a range of GSI and mi values. For a given GSI,increasing mi leads to an almost linear increase in thebearing capacity factor Ns.Referring to the above figures, the effects of including
self-weight in the analyses may be explained as follows. Forany given rock mass ðsci;GSI ;miÞ and foundation width B
(i.e. sci=B ¼ constant), the addition of self-weight g (i.e.decrease in the ratio sci=gB) will lead to an increase in thebearing capacity factor Ns and thus the ultimate bearingcapacity. That is, the bearing capacity factor for aweightless rock Ns0 is always less than the bearing capacityfactor Ns for a rock with unit weight ðNsXNs0Þ. The effectof a small increase or decrease in the estimated rock weight
5 30 35 40
5 30 35 40
GSI = 80
GSI = 100
�ci
�B= 125
�ci
�B= 10000
�ci
�B= 125
�ci
�B= 10000
∞
∞
values of the bearing capacity factor Ns.
ARTICLE IN PRESSR.S. Merifield et al. / International Journal of Rock Mechanics & Mining Sciences 43 (2006) 920–937 933
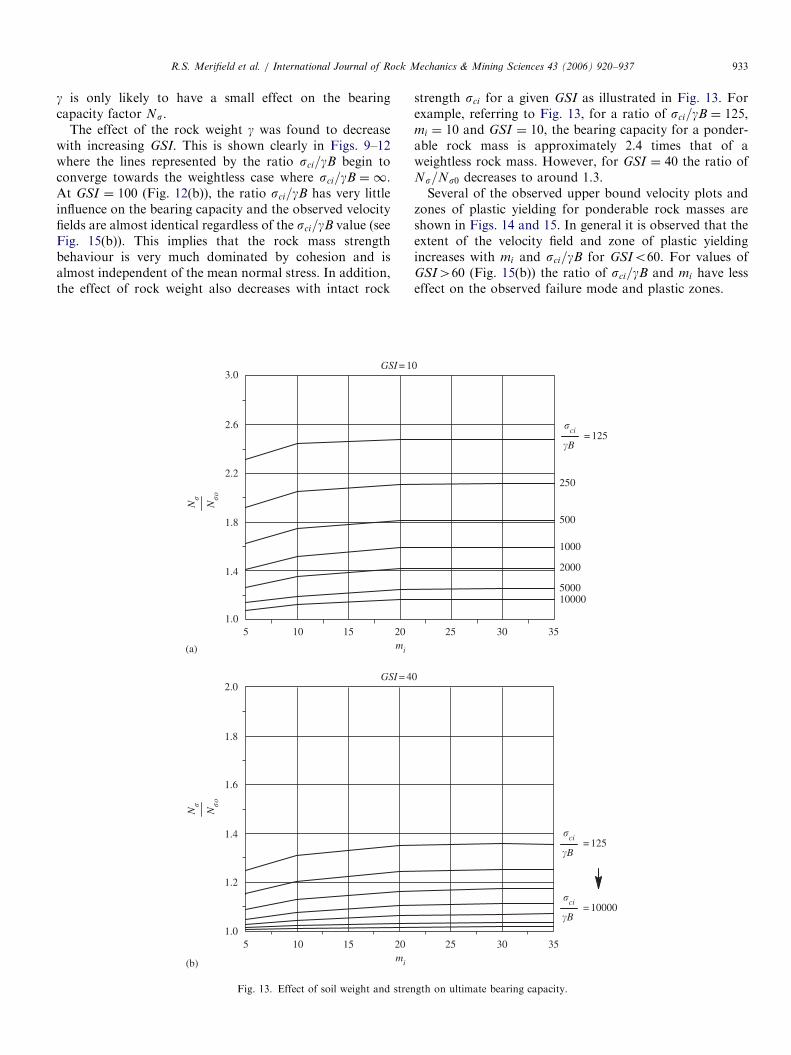
g is only likely to have a small effect on the bearingcapacity factor Ns.
The effect of the rock weight g was found to decreasewith increasing GSI. This is shown clearly in Figs. 9–12where the lines represented by the ratio sci=gB begin toconverge towards the weightless case where sci=gB ¼ 1.At GSI ¼ 100 (Fig. 12(b)), the ratio sci=gB has very littleinfluence on the bearing capacity and the observed velocityfields are almost identical regardless of the sci=gB value (seeFig. 15(b)). This implies that the rock mass strengthbehaviour is very much dominated by cohesion and isalmost independent of the mean normal stress. In addition,the effect of rock weight also decreases with intact rock
3.0
2.6
2.2
1.8
1.4
1.0
2.0
1.8
1.6
1.4
1.2
1.0
5 10 15 20mi
5 10 15 20mi
N�
N�
N�
N�
GSI = 1
GSI = 4
(a)
(b)
Fig. 13. Effect of soil weight and stren
strength sci for a given GSI as illustrated in Fig. 13. Forexample, referring to Fig. 13, for a ratio of sci=gB ¼ 125,mi ¼ 10 and GSI ¼ 10, the bearing capacity for a ponder-able rock mass is approximately 2.4 times that of aweightless rock mass. However, for GSI ¼ 40 the ratio ofNs=Ns0 decreases to around 1.3.Several of the observed upper bound velocity plots and
zones of plastic yielding for ponderable rock masses areshown in Figs. 14 and 15. In general it is observed that theextent of the velocity field and zone of plastic yieldingincreases with mi and sci=gB for GSIo60. For values ofGSI460 (Fig. 15(b)) the ratio of sci=gB and mi have lesseffect on the observed failure mode and plastic zones.
250
500
1000
2000
500010000
25 30 35
25 30 35
0
0
�ci
�B= 125
�ci
�B= 125
�ci
�B= 10000
gth on ultimate bearing capacity.

ARTICLE IN PRESS
�ci
�B= 125
�ci
�B= 250
�ci
�B= 1000
�ci
�B= 2500
�ci
�B= 5000
�ci
�B= 12500
GSI = 20, m = 5 GSI = 20, m = 20
Fig. 14. Upper bound velocity fields and plastic zones for rock with weight.
R.S. Merifield et al. / International Journal of Rock Mechanics & Mining Sciences 43 (2006) 920–937934
6. Comparison with previous numerical studies
As a preliminary comparison, several limit analyses wereperformed for weightless rock masses using equivalentMohr–Coulomb parameters as determined by Eqs. (16)and (15). Table 2 presents the results obtained for threedifferent quality rock masses. The equivalent Mohr–Cou-lomb parameters were obtained over two separate rangesof the minor principal stress s03; namely, 0os3o0:25sci
and 0os3o0:75sci. This table, along with Fig. 16,indicates just how sensitive the interpreted values of c0
and f0 are to the value of s03max. Indeed, the cohesion canvary by as much as 100% for each rock mass quality.It should be stressed that using a linear failure envelope
in place of the curved Hoek–Brown envelope will affect thepredicted bearing capacity. To highlight this, finite elementupper bound analyses were performed using the Hoek–Brown and equivalent Mohr–Coulomb material para-meters in Table 2 and the ultimate bearing capacity resultsare shown in Table 3. It can be seen that, for both ranges ofthe minor principal stress s3, the ultimate bearing capacityhas been overestimated significantly (46–157%) when we

ARTICLE IN PRESS
�ci
�B= 125
�ci
�B= 125
�ci
�B= 1000
�ci
�B= 12500
�ci
�B= 1000
�ci
�B= 12500
GSI = 50, m = 5
GSI = 100, m = 5 GSI = 100, m = 20
GSI = 50, m = 20(a)
(b)
Fig. 15. Upper bound velocity fields and plastic zones for rock with weight.
Table 2
Determination of equivalent Mohr–Coulomb parameters for various quality rocks
Rock quality sci mi GSI 0os3o0:25sci 0os3o0:75sci
c0 f0 c0 f0
Very poor 20 8 30 0.65 22.8 1.3 15.9
Average 80 12 50 4.2 32.1 8.55 23.4
Very good 150 25 75 14.1 45.8 28.6 36.6
R.S. Merifield et al. / International Journal of Rock Mechanics & Mining Sciences 43 (2006) 920–937 935

ARTICLE IN PRESS
70
60
50
40
30
20
10
00 10 20 30
Hoek-Brown
40 50 60
mi =12
70
GSI = 50
80 90
�ci
= 80 MPa
�3max
= 0.25�ci
,c′ = 4.2 MPa ,′ = 32.1°
�3max
= 0.75�ci
,c′ = 8.55 MPa ,′ = 23.4°
�n
�
Fig. 16. Failure envelopes and equivalent Mohr–Coulomb parameters for average quality rocks.
Table 3
Comparison of ultimate bearing capacity using Hoek–Brown and equivalent Mohr–Coulomb material parameters for various quality rocks-weightless
Rock quality qu (MPa) Hoek–Brown 0os3o0:25sci 0os3o0:75sci qu ( MPa) Serrano et al. [24]
qu (MPa) Mohr–Coulomb qu (MPa) Mohr–Coulomb
Very poor 6.7 12:0 ðþ46%Þ 15:3 ðþ87%Þ 6:5 ð�3%ÞAverage 98.5 156:4 ðþ59%Þ 161:0 ðþ63%Þ 94:4 ð�4%ÞVery good 886.0 2279:4 ðþ157%Þ 1614:6 ðþ82%Þ 870:4 ð�1%Þ
R.S. Merifield et al. / International Journal of Rock Mechanics & Mining Sciences 43 (2006) 920–937936
adopt equivalent Mohr–Coulomb strength parameters.Although the inclusion of rock weight g is likely to increasethe ultimate values shown in Table 3 by up to 25%, theoverall predictions will still be poor for these rock qualities.The only method for improving the comparison would beto re-analyse each problem until equivalent Mohr–Coulomb strength parameters c and f are found such theultimate bearing capacity matches those obtained from theHoek–Brown criterion. Given that a comprehensive set ofbearing capacity solutions is provided herein, there is littlepoint in carrying out such analyses.
The lower bound results obtained from the methodproposed Kulhawy and Carter [20] (Eqs. (18) and (19)) arecompared to the average finite element upper and lowerbounds in Table 1. Due to the very simple lower boundstress field that is assumed, their estimates of the bearingcapacity factor Nco are rather conservative and aretypically 30–80% below the average finite element limitanalysis results.
To make a direct comparison between the finite elementlimit analysis results and the results obtained by Serranoet al. [24] for weightless rock, Eq. (20) can be re-written as
Ns0ðSerranoÞ ¼qu
sci
¼bbðNb � znÞ
sci
, (21)
where Ns0ðSerranoÞ can be compared directly to the value ofNs ¼ Ns0 in Eq. (17).The bearing capacity factor obtained from Eq. (21) is
compared to the average limit analysis results in Table 1.The method proposed by Serrano et al. [24] providesestimates of the bearing capacity factor Ns0 that areremarkably close to the finite element results and in mostcases within a few percent. This is also confirmed by thecomparison in Table 3 for several broad rock types. Theonly exception to this observation occurs for a small classof very poor quality rocks with GSIp10, where themethod of Serrano et al. is more conservative andunderestimates the bearing capacity factor by up to 35%.

ARTICLE IN PRESSR.S. Merifield et al. / International Journal of Rock Mechanics & Mining Sciences 43 (2006) 920–937 937
7. Conclusions
The bearing capacity of a surface strip footing resting ona rock mass whose strength can be described by thegeneralised Hoek–Brown failure criterion has been inves-tigated. Using powerful new formulations of the upper andlower bound limit theorems, rigorous bounds on thebearing capacity for a wide range of material propertieshave been obtained. The results have been presented interms of a bearing capacity factor Ns in graphical form tofacilitate their use in solving practical design problems.
The following conclusions can be made based on thelimit analysis results:
(a)
The computed upper and lower bound estimates of thebearing capacity factor Ns, for either weightless orponderable rock foundations, were found to be within5% of each other. This indicates that, for practicaldesign purposes, the true collapse load has beenbracketed to within �2:5% or better.(b)
The effect of ignoring rock weight can lead to a veryconservative estimate of the ultimate bearing capacity.This is particularly the case for poorer quality rocktypes with GSI values less than approximately 30,where the ultimate bearing capacity can be as much as60% below the actual capacity when rock weight isincluded.(c)
Estimating the ultimate bearing capacity of a rock massusing equivalent Mohr–Coulomb parameters wasfound to significantly overestimate the bearing capa-city. This overestimate was found to be as high as157% for very good quality rock masses.(d)
Existing numerical solutions for weightless rock massesare generally conservative and can differ from thebound solutions by up to 80%.References
[1] Lyamin AV, Sloan SW. Lower bound limit analysis using non-linear
programming. Int J Numer Methods Eng 2002;55(5):573–611.
[2] Lyamin AV, Sloan SW. Upper bound limit analysis using linear finite
elements and non-linear programming. Int J Numer Anal Methods
Geomech 2002;26(2):181–216.
[3] Sutcliffe D, Yu HS, Sloan SW. Lower bound solutions for bearing
capacity of jointed rock. Comput Geotech 2004;31(1):23–36.
[4] Zheng X, Booker JR, Carter JP. Limit analysis of the bearing
capacity of fissured materials. Int J Solids Struct 2000;37(8):1211–43.
[5] Sloan SW. Lower bound limit analysis using finite elements and linear
programming. Int J Numer Anal Methods Geomech 1988;12(1):61–7.
[6] Sloan SW, Kleeman PW. Upper bound limit analysis using
discontinuous velocity fields. Comput Methods Appl Mech Eng
1995;127(1–4):293–314.
[7] Hoek E, Carranza-Torres C, Corkum B. Hoek–Brown failure
criterion—2002 edition. In: Proceedings of the North American rock
mechanics society meeting in Toronto; 2002.
[8] Hoek E, Brown ET. Empirical strength criterion for rock masses.
J Geotech Eng Div ASCE 1980;106(9):1013–35.
[9] Mostyn G, Douglas K. Strength of intact rock and rock masses. In:
Proceedings of the international conference on geotechnical and
geological engineering, Melbourne, Australia, vol. 1. Lancaster:
Technomic Publishing Co. Inc., 19–24 November 2000. p. 1389–421.
[10] Hoek E. Strength of jointed rock masses. Geotechnique 1983;33(3):
187–223.
[11] Serrano A, Olalla C. Ultimate bearing capacity of an anisotropic
discontinuous rock mass, part I: basic modes of failure. Int J Rock
Mech Min Sci 1998;35(3):301–24.
[12] Hoek E. A brief history of the development of the Hoek–Brown
failure criterion. hhttp://www.rocscience.comi. 2004.
[13] Bieniawski ZT. Rock mass classification in rock engineering. In:
Bieniawski ZT, editor. Exploration for rock engineering, proceedings
of the symposium, vol. 1. Cape Town: Balkema; 1976. p. 97–106.
[14] Barton N. Some new Q-value correlations to assist in site
characterisation and tunnel design. Int J Rock Mech Min Sci
2002;39(2):185–216.
[15] Abbo AJ, Sloan SW. A smooth hyperbolic approximation to the
Mohr–Coulomb yield criterion. Comput Struct 1995;54(3):427–41.
[16] Hoek E. Practical rock engineering: an ongoing set of notes. hhttp://
www.rocscience.comi. 2002.
[17] Hoek E, Brown ET. Practical estimates of rock mass strength. Int
J Rock Mech Min Sci 1997;34(8):1165–86.
[18] Serrano A, Olalla C. Ultimate bearing capacity of an anisotropic
discontinuous rock mass, part II: determination procedure. Int
J Rock Mech Min Sci 1998;35(3):325–48.
[19] Carter JP, Kulhawy FH. Analysis and design of drilled shaft
foundations socketed into rock. Rep. EL-5918. Palo Alto, CA:
Electric Power Research Institute; 1988.
[20] Kulhawy FH, Carter JP. Settlement and bearing capacity of
foundations on rock masses and socketed foundations in rock
masses. In: Bell FG, editor. Engineering in rock masses. Oxford, UK:
Butterworth-Heinemann; 1992. p. 231–45.
[21] AASHTO. Standard specifications for highway bridges. Washington,
DC: American Association of State Highway and Transport Officials;
1997.
[22] Serrano A, Olalla C. Ultimate bearing capacity of rock masses. Int
J Rock Mech Min Sci Geomech Abstr 1994;31(2):93–106.
[23] Serrano A, Olalla C. Allowable bearing capacity in rock foundations,
using a non-linear failure criterium. Int J Rock Mech Min Sci
1996;33(4):327–45.
[24] Serrano A, Olalla C, Gonzalez J. Ultimate bearing capacity of rock
masses based on the modified Hoek–Brown criterion. Int J Rock
Mech Min Sci 2000;37(6):1013–8.
[25] Sokolovskii VV. Statics of granular media. London, UK: Pergamon
Press; 1965.
[26] Hoek E, Wood D, Shah S. A modified Hoek–Brown failure criterion
for jointed rock masses. In: Eurock ’92; 1992. p. 209–13.
[27] Serrano A, Olalla C. Ultimate bearing capacity at the tip of a pile in
rock; theory (part I). Int J Rock Mech Min Sci 2002;39(7):833–46.
[28] Serrano A, Olalla C. Ultimate bearing capacity at the tip of a pile in
rock—part 2: application. Int J Rock Mech Min Sci 2002;39(7):
847–66.
[29] Yang X, Yin J-H, Li L. Influence of a non-linear failure criterion on
the bearing capacity of a strip footing resting on rock mass using a
lower bound approach. Can Geotech J 2003;40(3):702–7.